 Sawsan A. Mahmoud
 Basma S. Mohamed1
94% of researchers rate our articles as excellent or good
Learn more about the work of our research integrity team to safeguard the quality of each article we publish.
Find out more
ORIGINAL RESEARCH article
Front. Mater., 18 October 2021
Sec. Colloidal Materials and Interfaces
Volume 8 - 2021 | https://doi.org/10.3389/fmats.2021.714835
This article is part of the Research TopicThe Recent Progress of Metal Complexes in Materials ChemistryView all 4 articles
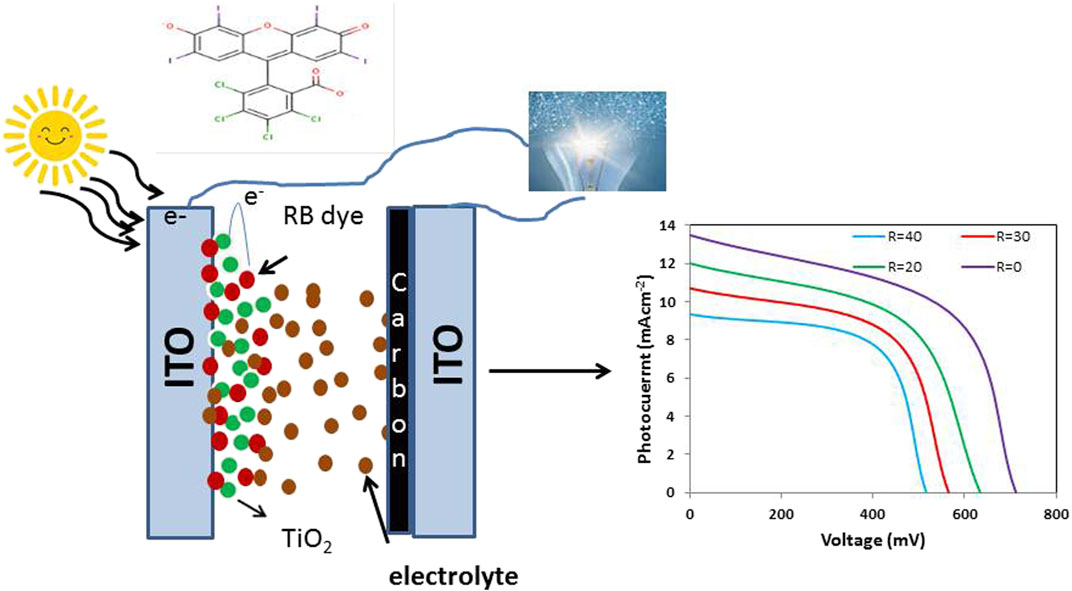
For more than 2 decades, extensive research has been done in the field of Dye-Sensitized Solar Cells (DSSCs) due to their low cost, easy preparation methodology, less toxicity, and ease of production. In this work, the performance of DSSCs containing different particle sizes is studied. N2-doped TiO2 was prepared by the sol-gel method, controlling the particle size through the addition of different H2O/Ti mole ratios R = 0, 20, 30, and 40. The dried samples at 100°C were characterized by X-ray diffraction, Optical Properties, High-Resolution Transmission Electron Microscope, Scanning Electron Microscope, Fourier-Transform Infrared Spectroscopy, N2-Adsorption-Desorption Isotherm, Raman Spectroscopy, and Dynamic Light Scattering (DLS). DLS results show that the size of TiO2 decreases as the H2O/TiO2 content increases from 0 to 40. It is found that TiO2 nanoparticles with smaller particle size distribution has the lowest conversion efficiency of 0.95% with H2O/Ti ratio = 40, and the photoelectrode with higher size has a conversion efficiency of 1.59% for the water-free sample. This could be explained as the larger particles have better dye adsorption, indicating that it has an effective surface area for greater photon absorption and electron-hole generation. The results also indicate that trimodal distribution with larger size also absorbs different wavelengths due to the broad distribution of the particle size.
GRAPHICAL ABSTRACT
Solar Energy Technology has recently emerged as a viable option for meeting our energy demands, particularly in areas in which coal and natural resources are being depleted at a frightening rate (Kamat, 2007; Gonçalves et al., 2008). Because of the high manufacturing costs, silicon-based solar cells are widely used (Moskowitz and Fthenakis, 1990; Moskowitz and Fthenakis, 1991). The next stage is to use basic manufacturing techniques to create solar cells from low-cost components. O’Regan and Gratzel designed dye-sensitized solar cells (DSSCs) in 1991, and they are an example of this type (O’Regan and Grätzel, 1991; Grätzel, 2001; Zhao et al., 2009; Park et al., 2012; Mir and Salavati-Niasari, 2013; Ramasamy et al., 2013). In DSSCs, the “sensitizer” is a dye that is either produced or derived from natural resources. The sensitizer dye produces electrons and holes when exposed to light. The electrons are moved to the CB of the Aceptor Semiconductor Metallic Oxide while the holes are transmitted to the electrolyte. The scientific community has worked hard to promote more effective dyes, such as Ruthenium complexes (Aghazada and Nazeeruddin, 2018), Porphyrin (Birel et al., 2017; Zeng et al., 2019), Carbazole (Carella et al., 2018; Lokhande et al., 2019), metal-free organic dyes (Błaszczyk, 2018; Lee et al., 2018; Wu et al., 2019), natural colors (Ammar et al., 2019; Ananthi et al., 2019; Sanjay et al., 2019; Trihutomo et al., 2019), and Rose Bengal (Mahmoud and Fouad, 2015; Mahmoud and Mohamed, 2015; Mahmoud et al., 2016; Mahmoud et al., 2017a; Mahmoud et al., 2017b; Mahmoud et al., 2021).
The particle size of the TiO2 film electrode, particularly in its Amorphous form, is an essential issue that has received little attention. The influence of particle size on the implementation of DSSCs is clarified, and it may be performed by running electrodes containing bigger or smaller pure (without additives that affect the size) TiO2 particles (Gregg, 2003; Gracia et al., 2004; Gregg, 2004; Hagfeldt et al., 2004). The catalytic performance of important and valuable metal nanoparticles is primarily determined by the effective atoms, which are proportional to the nanoparticle’s specific surface area (Zhu et al., 2021). The SBET of small nanoparticles is bigger. The high surface energy of small particles, on the other hand, induces nanoparticles to combine during catalysis and tend to agglomerate, resulting in a drop in the number of active surface atoms and a considerable loss in catalytic activity. This issue greatly limits the use of precious nanoparticles as catalysts in practical manufacturing.
As Photoactive semiconductor nanomaterials, TiO2 can successfully Engage Light and Display Effective Photon Size, Interface, and Quantum Reservation Effects, and it is widely used in Optical, Electrical, Magnetic, and Biological Fields (Geng et al., 2021; Qian et al., 2021; Yin et al., 2021).
Structural features have been offered to Anatase and Rutile, which have been the most extensively considered, rendering them extremely appealing for different purposes, such as solar cells (Bach et al., 1999; Park et al., 2000); Photo-catalysis (Kaneko and Okura, 2002; Anpo and Kamat, 2010); Electrodes in semiconductor designs (Nogami et al., 1991); catalysis (Topoglidis et al., 1998); catalyst supports (Zhang et al., 1994; Geserick et al., 2011); in Coatings, Toothpaste, and Makeup (Shubert et al., 2001); Adsorption of Proteins (Hsu et al., 1993); and others.
Materials with larger particle sizes possess larger contact points, permitting easier dye access and superior dye gathering. Smaller TiO2 particles have a bigger surface area and a greater number of joint sites between colloidal particles at the particle–core substrate interface, allowing for better dye adsorption. TiO2 with bigger particles has a slenderer surface area, which means there is less surface area available for adsorption capacity, potentially lowering the amount of light absorbed and the amount of the generated electrons and holes. The smaller TiO2 particles, on the other hand, have a greater number of grain boundaries where electrons require passing throughout, which results in a higher electron trapping probability. The high surface energy of small particles, on the other hand, induces nanoparticles to combine during catalysis, resulting in a drop in the number of active surface atoms and a considerable loss in catalytic activity.
Amorphous TiO2 has been synthesized through a wide range of processes as detailed in the literature (Hong and Sattler, 2010; Hong and Ganguli, 2012; Vargas and Rodríguez-Páez, 2017). Wang et al. (Wang et al., 2003) produced amorphous TiO2 utilizing a dodecylamine as an organic template to produce a wormhole-like framework mesostructure. Li et al. (Li et al., 2015a) used the sol-gel approach with further calcination to synthesize TiO2 nanoparticles using acetic acid to adjust the size of the TiO2-ANPs while polyethylene glycol was used to keep the dispersion of the particles. Pressure-induced amorphization (Li et al., 2010; Li et al., 2015b) and impulse plasma in dielectric liquid (Omurzak et al., 2009) approaches stand out among the innovative synthesis strategies used to prepare TiO2-ANPs.
In this paper, the DSSC photo-anode consists of TiO2 nanoparticle film with different particle sizes examined to understand whether the overall light conversion efficiency was affected by the variation in particle size. By using a sol-gel method with varying the H2O/Ti mole ratio, the diameter of different particle sizes of TiO2 was changed. The J-V curves of the manufactured TiO2 powders were compared and observed under light.
The chemicals used were Titanium (IV) Isopropoxide (TIP) (97%), rose Bengal dye (Sigma-Aldrich), and conductive Indium-Tin-Oxide (ITO)–coated glass slides (Aldrich, Rs∼8–10 ohm/sq). Urea and Ethanol were provided from Adwic.
The sol was prepared through the hydrolysis of TIP in ethanol with dropwise addition of urea dissolved in alcoholic solution, and then the amounts of the added deionized water were adjusted to obtain the supposed molar ratio of 0, 10, 20, 30, and 40 for H2O/Ti, respectively. The solutions were stirred for about 2 h at 25°C after the prompt formation of white precipitate while nitrogen gas was purged in the solution. The pH value of the gel was about 3.8, so a positively charged TiO2 is formed. The TiO2 nanoparticles were centrifuged and dried at 60°C. The produced powder was grounded using ball mail.
The X'Pert Philips XRD Diffractometer was used to record the X-ray diffraction (XRD). The operating voltage and effective ampere of the diffractometer were set to 40 kV and 20 mA, respectively. The scans were performed at a rate of 0.02 scans/s from 20° to 80°. Optical characterization of TiO2 samples were carried out by JASCO-750 UV-Vis spectrophotometer. FTIR was carried out using Nicolet Is50, Thermo Fisher Scientific Spectrophotometer. Qualitative Chemical structure assessment was done by Raman Spectroscopy analysis using SENTERRA Bruker. The excitation laser wavelength was 532 nm. SEM was performed using JEOL, JEM 3500 electron microscope. DLS was used to determine particle size distribution using Malvern Zetasizer ver. 6.32 equipment. HR-TEM images and EDX spectrum were captured using a 120 KV JEOL JEM-1230 electron microscope. At -196°C, the nitrogen adsorption desorption isotherms were determined using the Quantachrome NOVA automated gas sorption system. Degassing the samples was done at 60°C and 10–5 mmHg for 4 h.
ITO (8–12 Ω/sq) glass was ultrasonically washed with isopropanol, ethanol, and deionized water using a bath for 30 min. The prepared TiO2 was ground with a ball mill and formed a colloidal blend paste through mixing with water, ethanol, acetyl acetone, and Triton X-100, and then the film was deposited on the conductive side of the ITO glass by the doctor-blade approach to construct the photo-anode film. The obtained film was heated at 450°C for 30 min using a hotplate. The obtained photo-anodes were bathing in RB dye at 25°C, and then the photoanodes were rinsed using ethanol. The opposite electrode poised a film of salable carbon on the ITO glass. The cells contain I-/I3- as electrolyte, which was injected into the cell by capillary action. The active area of the cells was 4.25 cm2.
To measure the J–V curves, a solar box was used equipped with the photocell test device. To estimate the cell conversion efficiency, the J-V curve and Eq. 1 were used to calculate the Fill Factor (FF) using all cell outputs Voc and Jsc. The conversion efficiency can be calculated from Eq. 2.
Where
Figure 1 shows the XRD patterns of the TiO2 powders prepared by the sol-gel method using different H2O/Ti molar ratios. The graphs noticeably confirm that the prepared samples encompass an amorphous phase among all the used molar ratios of H2O/Ti perhaps owing to the presence of short-range crystalline order in XRD amorphous TiO2. The absence of the long-range order is reported by several authors (Tiron et al., 2016; Nair et al., 2013; Grilli et al., 201844). This could be attributed to the lack of the energy required for the crystal growth or the presence of urea suppressing the crystallinity.
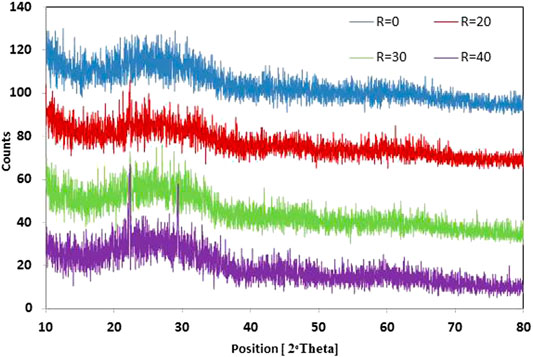
FIGURE 1. XRD of N2 doped TiO2 with different molar ratios of H2O/Ti.
Figure 2 shows the UV-Vis absorption spectra of TiO2 R = 0, R = 20, and R = 30. The analysis was carried out using a sonicated solution of barium sulfate in water containing TiO2 for 30 min. The figure shows the λmax of the prepared samples centered at 346 (R = 20 and 30) and at 348 nm for R = 0 samples. Bands between 205 and 215 nm, according to the literature (Marchese et al., 1991a), (Raimondi et al., 2000) can be ascribed to separated dissolved titania species coordinated tetrahedrally, whereas bands around λ >250 nm can be associated with cores of Ti(IV) in Penta and Octahedral configurations.
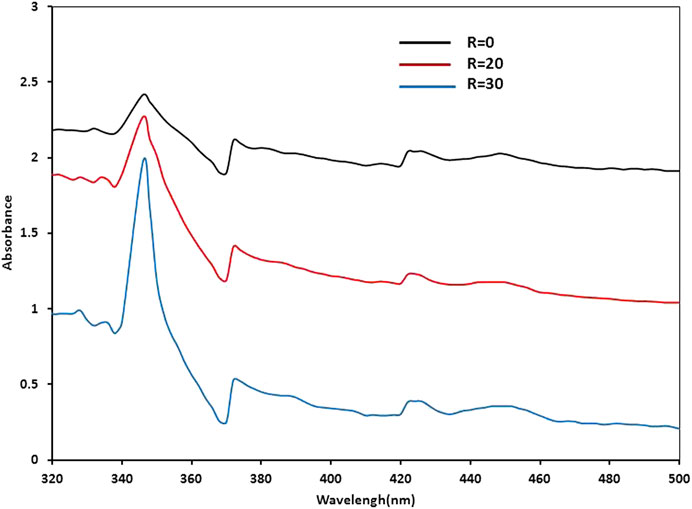
FIGURE 2. UV-Vis spectra of N2 doped TiO2 prepared with different molar ratios of H2O/Ti.
By extrapolation of the absorption edge to zero, the bandgap energy can be calculated by the following equation:
Where
Figure 3A, B shows the N2 Adsorption-Desorption Isotherms (Figure 3A) and the pore size distribution of the prepared samples (Figure 3B). Figure 3A depicts a decrease in the surface area as the water of hydrolysis increases. The samples represent type IV isotherm with an H4 hysteresis loop according to IUPAC classifications. Figure 3B shows that the pores are selective with the size in the mesoporous range. This effect indicates the vital role of water of hydrolysis in the features of TiO2.
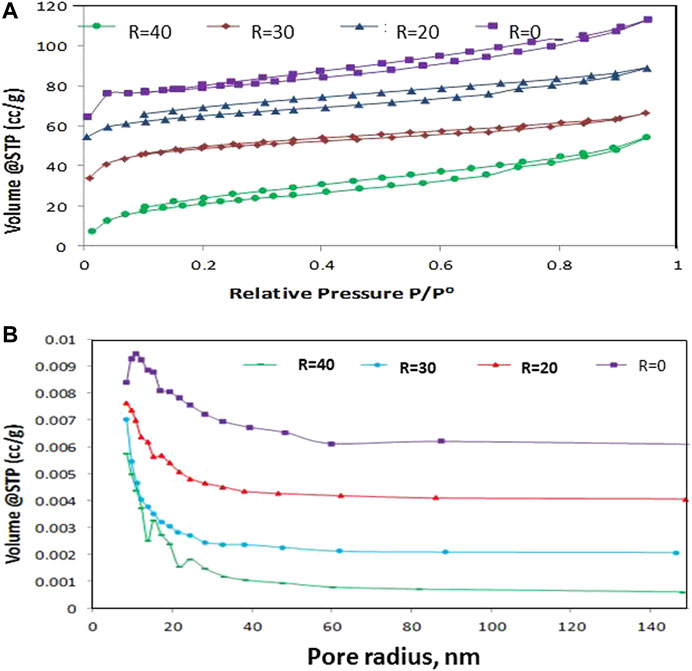
FIGURE 3. Adsorption-desorption isotherms of N2 doped TiO2 with different molar ratios of H2O/Ti (A) and pore size distribution of the prepared samples (B).
Table 1 shows the surface properties of the prepared TiO2. The results reveal that the surface area slightly decreases as the H2O/Ti ratio increases from R = 0 to R = 40. The pore volume and diameter also increase as the water ratio increases. The pore diameter ranges between 1.7 and 10.9 Ao and the pore volume ranges from 0.04 to 0.08 cm3/g.
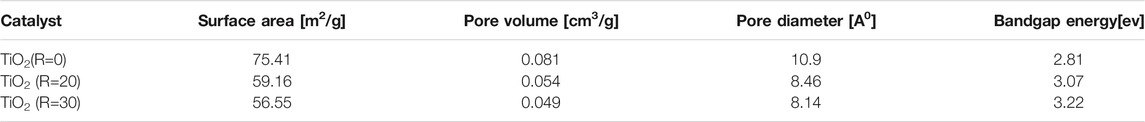
TABLE 1. Surface area properties and bandgap energy of the prepared samples.
Figure 4 shows the effect of H2O/Ti ratios on particle morphology using HR-TEM. The prepared samples show a cloud feature due to the presence of moisture in TiO2. The figures disclose the ordering degree of the TiO2 mesoporous arrangement. A wormlike pore structure of mesoporous material was observed. The existence of the crystalline phases is not detected in the XRD pattern due to the little extent of crystallization of the TiO2 and the smaller size of the nuclei. The pore morphology of the R = 40 catalyzed system was less marked than that of R = 0, R = 30, and R = 40, i.e., as the molar ratio of the water increased to R = 40, the order of the pore structure was decreased.
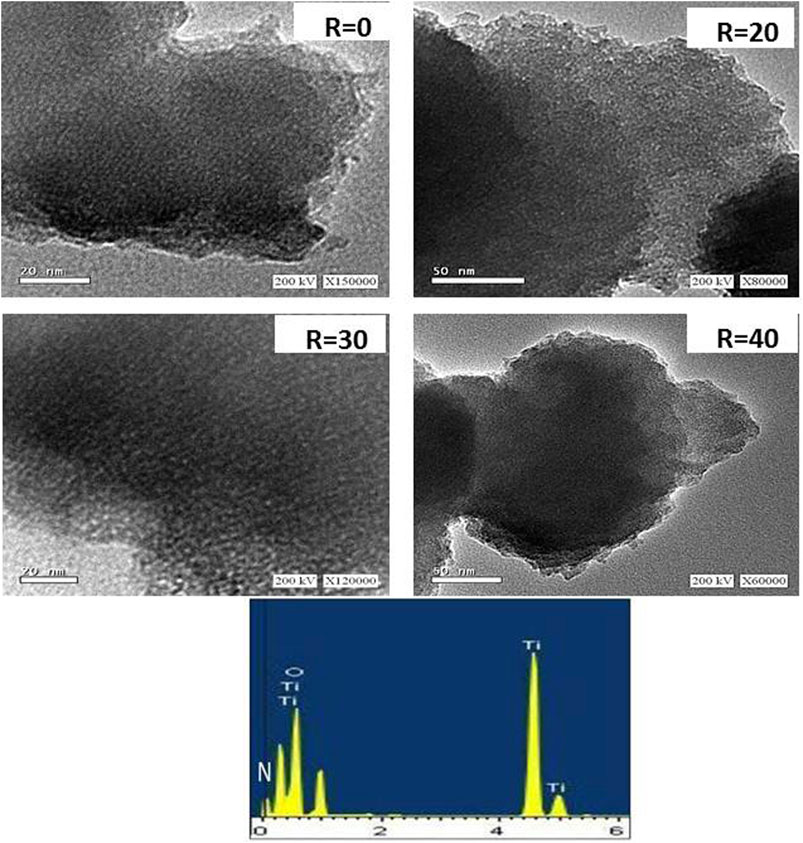
FIGURE 4. HR-TEM of N2 doped TiO2 with different molar ratios of H2O/Ti and EDX spectrum.
Figure 5 shows the surface morphology of the prepared samples R = 0 and R = 40 at different magnifications. The figures show that the agglomeration increases as the water content increases with the initial formation of spherical crystals.
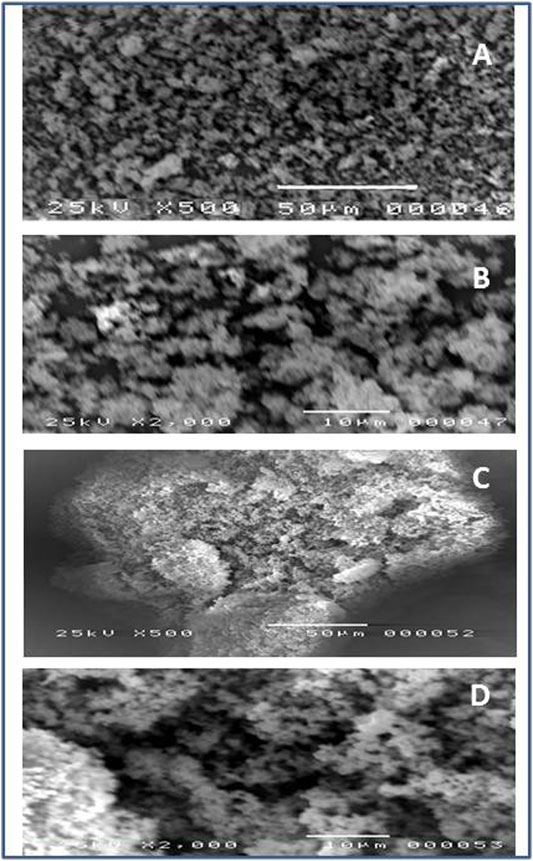
FIGURE 5. SEM of N2 doped TiO2 R = 0 (A,B) and R = 40 (C,D) at different magnifications.
Figure 6 depicts the FTIR of R = 0, R = 20, and R = 30. The figure shows two vibrational bands at 3,385 and 3,314 cm-1 due to the presence of 2 Amine. A stretching band at 3,170 cm-1 confirms the complete hydrogen bonding between water molecules in tetrahedral coordination (the ice-like water structure) (Cheng et al., 2013). The shape of the peak changed as the water content increase to become more sharp and intense for R = 30. A blue shift was also observed as the molar ratio of water increases. The OH bending appears at 1,432, 1,436, and 1,444 for R = 0, R = 20, and R = 30, respectively. The peak becomes intense as the water molar ratio increases and a blue shift was observed. The vibrational band at 1,614 cm-1 corresponds to C=O stretching and the Amide II band near 1,550 cm−1 could be confirmed to C–N stretch together with N–H bending. The asymmetric stretching of Ti-O-Ti in the linear structure centered at 1,147 cm-1. However, Ti-O-Ti increases with increasing water content. C–H rocking (CH3 in TIP) at 980 cm-1 while the band at 749 cm-1 shows the presence of Ti-O-Ti bending. The bands at 478 cm-1 show O-Ti-O bending.
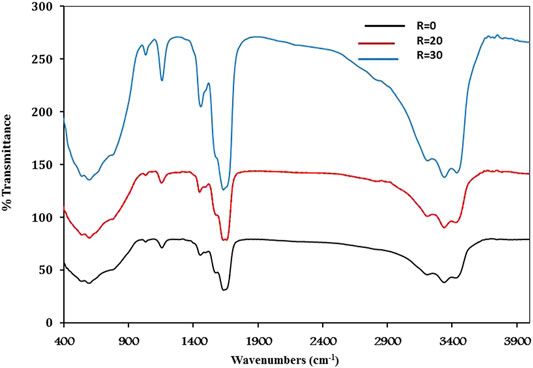
FIGURE 6. FTIR spectra of N2 doped TiO2 at R = 0, R = 20, and R = 30.
Figure 7A shows the Raman spectra of R = 0, R = 10, R = 20, and R = 30. The samples show small Raman bands at 146 (Eg), 185 (Eg), 401 (B1g), 518 (A1g), and 634 (Eg) cm−1 could be attributed to the characteristics the anatase phase. On the other hand, the Raman bands at 243, 431, and 590 cm-1 could be attributed to the rutile phase that corresponds to the symmetries of B1g, Eg, and A1g, respectively (Tamilselvan et al., 2012). In addition, a distinctive broad vibrational peak at 200–300 cm-1 was clearly identified as a result of several phonon scattering mechanisms.
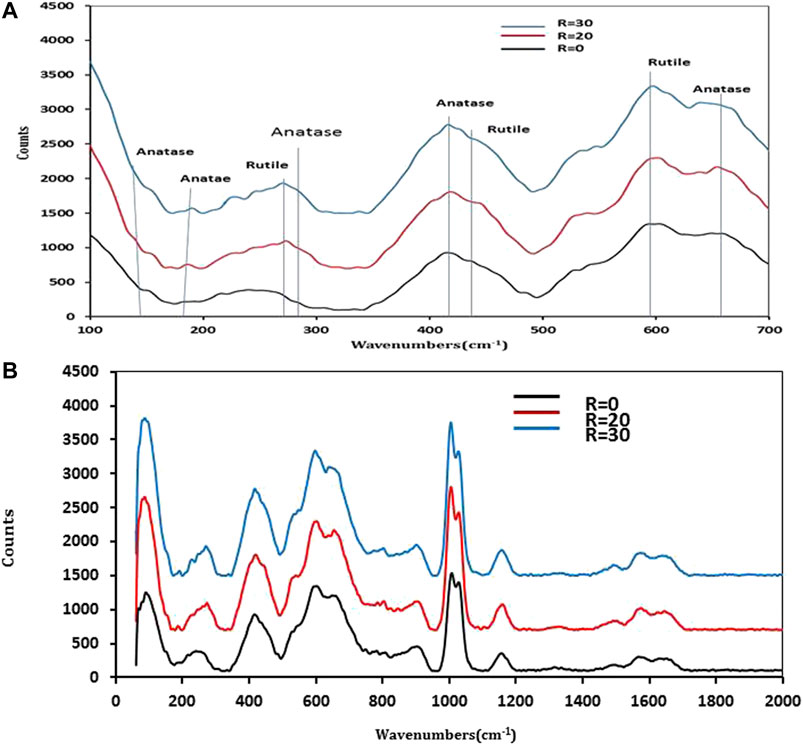
FIGURE 7. Raman analysis of N2 doped TiO2 in the range 100–700 cm−1 (A) and in the range of 0–2000 (B).
To investigate the effect of Nitrogen doping on the structure of Titanium Dioxide in the Raman Spectra, in general, the vibrational characteristic band of Ti–N can be clearly found in the Raman Spectra, which indicates the substitution of Nitrogen for some Oxygen Atoms in the Titania lattice. Ti-N could be observed at 209 for the sample R = 0 and shifted to higher frequency as the water content increase. This indicates the N2 deficiencies increase as the water content increase. A Raman peak at 1,452 cm-1 (weak) is attributed to the asymmetric deformation mode of Methyl group (Figure 7B). The strongest Raman peak at 1,005 cm−1 is attributed to the symmetric stretching CN vibration. Another two weak peaks observed at 1,546 cm−1 and 1,625 cm−1 are assigned to symmetric stretching CO and NH+3 vibrations, respectively. In addition, the peaks found at 1,593, 1,277, 1,161, and 904 cm−1 corresponds to the CH3 symmetric deformation, C–O vibration band, bending OH and stretching (C–C) + Methyl, respectively. Raman spectra of TiO2 containing R = 20 and R = 30 compared with R = 0 show that all function groups formed in the same position with small shifts. From Raman results, we observe the intensity of peaks attributed to C–N and C–O increase with an increase in water content due to an increase in hydrolysis of urea.
The physical and chemical features of materials are strongly dependent on their size distribution (Barbe´ et al., 1997; GraciaHolgado et al., 2004; Grätzel, 2001; Bohren and Huffman, 1998). Figures 8A–D shows the particle size distribution by number. It is clear that the TiO2 sample prepared at R = 0 has a bimodal size distribution with Z-average 1,230 nm. The first unimodal has a symmetric particle size distribution ranging from 164.2 to 458.7 nm with a maximum intensity at 255 nm, and the second unimodal has a particle size distribution ranging from 531 to 1718 nm with a maximum intensity at ∼1,000 nm. As the water ratio increases up to R = 20, the particle size distribution shows the presence of symmetric unimodal size distribution (z-average 1,422) with a size ranging from 531 to 1718 nm with a maximum intensity at 955 nm. As the water content decreases, a larger particle is formed due to the aggregation of the initially formed cluster, which could occur during the hydrolysis and condensation of the Alkoxy groups of the Ti cluster (Chou et al., 2007). This could be interpreting the retardation of gel formation as the water content decreases. Because the TiO2 powders were all composed of the same sol material and manufactured in the same way, the surface chemistry and particle filling were all the same. The shift in short-circuit current density and total light conversion efficiency, which is linked to particle size, is a particularly noticeable trend.
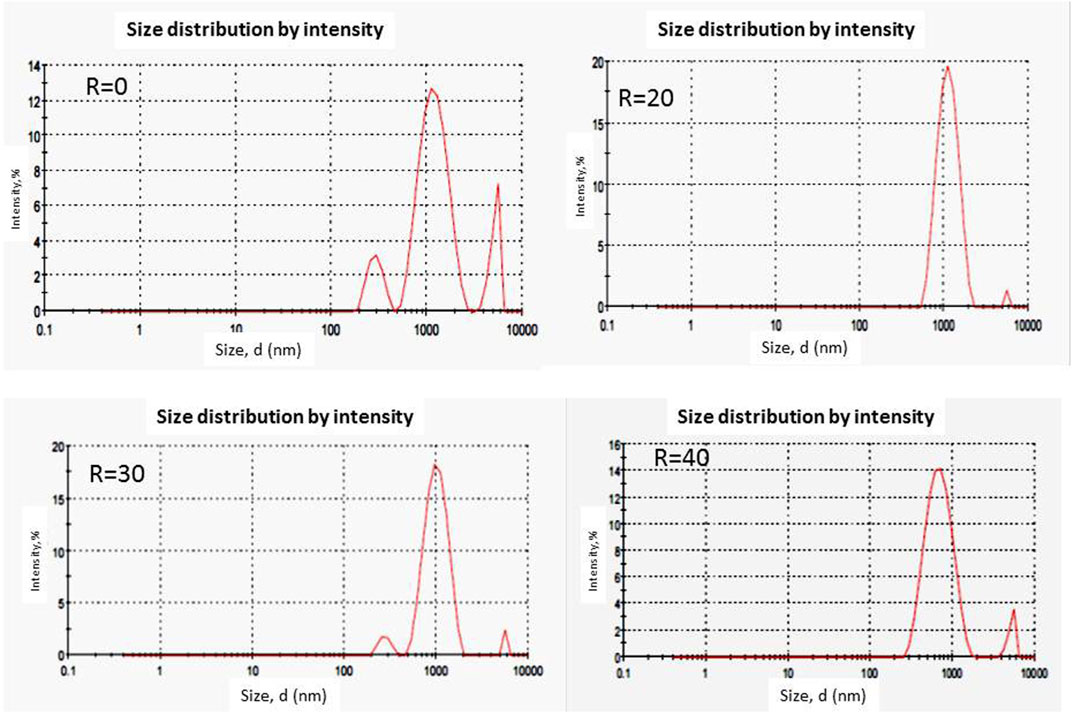
FIGURE 8. Size distribution by intensity of the N2 doped TiO2 through different water ratios.
Figure 9 depicts the J-V Characteristics of each solar cell consisting of TiO2 film with different particle sizes. Table 2 shows the calculated values achieved from the J-V curves of each solar cell. The most significant trend is the change in Short-Circuit Current Density, Open Circuit Voltage, and Conversion Efficiency, which correlates with the particle size. This could be attributed to the increase in the amount of dye adsorbed on the surface with increasing particle size (Tammy et al., 2007). DLS analysis shows that the larger surface area particles have larger pores into which the redox couple could diffuse more effectively than into the smaller pores, which could be generated by the smaller particles; consequently, the larger particles show maximum short circuit current density. This style is acceptable because the TiO2 nanoparticle powders were all prepared from the same TiO2 sol and in the same approach, therefore resulting in the same surface chemistry and particle packing. The most prominent inclination is the change in short-circuit current density and overall light conversion efficiency, which correlates with the particle size only. Although it was expected that small particles could adsorb more dye due to their greater surface area, it was proved that particles among larger diameters have better dye absorption due to the successful diffusion of the electrolyte in the pores, resulting in improvement in the overall light conversion efficiency. Bigger particles displayed better dye adsorption, indicating that TiO2 films consisting of bigger particles possess greater effective surface area for more photon absorption and electron-hole generation (Chou et al., 2007). Moreover, the large particle size is greatly related to enhancing the optical absorption of light in the photoelectrode. The larger particle size acts as light scatters, which leads to an increase in the possibility of adsorbed photons according to Mie scattering theory (Kerker, 1969; van de Hulst, 1981; Bohren and Huffman, 1998; Zhang et al., 2012). The potential increased to 516, 565, 634, and 712 mv with a further increase in particle size to 715.8, 715.8, 1,139, and 1,218 nm, respectively. In addition, the overall light conversion efficiency increased to 0.95, 1.01, 1.2, and 1.59%, respectively. The improvement in VOC could be correlated to the relaxed recombination and superior electron collection efficiency. Hence, a promising description for the increase in VOC is related to the better electron mobility of the semiconductor used, which improves the electron transfer and facilitates the charge carrier separation. On the other hand, there are several factors that influence the JSC: 1) the amount of RB dye adsorbed on the TiO2 surface, which results in efficient light harvesting; 2) the electron injection efficiency; 3) the electron gathering efficacy; and 4) RB dye regeneration efficiency.
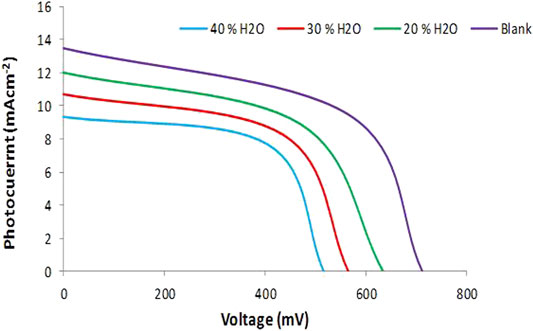
FIGURE 9. J-V curve of N2 doped TiO2 prepared through different H2O/Ti molar ratios.
TABLE 2. Photovoltaic performance ofN2 -TiO2 at different molars ratio of H2O/Ti.
More dye adsorption can also be influenced by the presence of larger contact points for easier access of the dye, which would increase the generation of electron-hole pairs. This increase in the generation of electron-hole pairs with increasing pore size is evidenced by the increase in short-circuit current density values as confirmed by our results. It was found that the amount of dye adsorbed on the surface increased with increasing pore size. One possible explanation for this trend was brought up by Grant et al. (Mahmoud et al., 2016), where it was reported that smaller particles resulted in smaller pore sizes, and larger particles resulted in larger pore sizes after sintering at elevated temperatures.
Several studies in DSSCs were reported using RB dye;Khadtare andPathan (Khadtare and Pathan, 2014) studied the performances of DSSCs ZnO photoanodes at different RB dye sensitization times. An enhancement of power conversion efficiency from 0.83 to 1.90% has been observed. Roy et al. (Roy et al., 2008) report that the power conversion efficiency of modified nanocrystalline TiO2 sensitized with rose Bengal dye is 2.09%. Sarode et al. (Sarode et al., 2016) used N2-nanocrystalline TiO2 powder prepared by simple hydrolysis route sensitized with RB dye obtain η = 0.52%.
The stability of the fabricated cell is studied in Figure 10. The stability of the DSSCs was studied through measuring the photovoltaic performance at various times. It is evident that PCE of the device suffers a rapid downfall after a few hours of 80 h. This could be attributed to the usage of liquid electrolyte.
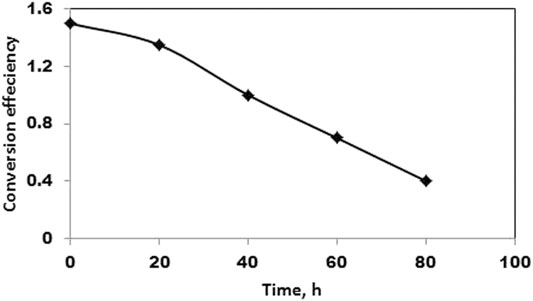
FIGURE 10. Stability of the fabricated cell with the ratio R = 0.
According to the findings, larger particles resulted in an increase in Short-Circuit Current Density, Open Circuit Voltage, and Total Light Conversion Efficiency. The working electrode films, which were made up of TiO2 nanoparticles with a diameter of 516 nm, resulted in a short-circuit current density of 9.33 mA/cm2 and a light conversion efficiency of 0.95%. An increase in particle size to 1,218 nm diameter resulted in a higher open circuit voltage of 712 mV and a 1.59% overall light conversion efficiency. The increased Short-Circuit Current Density, Short-Circuit Current Density, and overall light conversion efficiency, which coincides with particle size, could be due to the larger TiO2 nanoparticles better dye adsorption behavior by which larger particles allow for more dye adsorption via the extremely easy dye access, resulting in more electrification generation.
The raw data supporting the conclusions of this article will be made available by the authors, without undue reservation.
SAM: Conceptualization; methodology; investigation; visualization; writing; review and editing. BSM: methodology; investigation; formal analysis; writing - original draft. HMK: Conceptualization; review and editing.
The authors declare that the research was conducted in the absence of any commercial or financial relationships that could be construed as a potential conflict of interest.
All claims expressed in this article are solely those of the authors and do not necessarily represent those of their affiliated organizations, or those of the publisher, the editors and the reviewers. Any product that may be evaluated in this article, or claim that may be made by its manufacturer, is not guaranteed or endorsed by the publisher.
Aghazada, S., and Nazeeruddin, M. (2018). Ruthenium Complexes as Sensitizers in Dye-Sensitized Solar Cells. Inorganics 6, 52. doi:10.3390/inorganics6020052
Ammar, A. M., Mohamed, H. S. H., Yousef, M. M. K., Abdel-Hafez, G. M., Hassanien, A. S., and Khalil, A. S. G. (2019). Dye-Sensitized Solar Cells (DSSCs) Based on Extracted Natural Dyes, J. Nanomater. 2019, 1-10. doi:10.1155/2019/1867271
Ananthi, N., Subathra, M. S. P., Emmanuel, S. C., and Kumar, N. M. (2019). Energy Sources, Part A Recover Util. Environ. Eff. 0, 1–12.
Anpo, M., and Kamat, P. V. (2010). Environmentally Benign Photocatalysts. New York, US: Springer Science + Bussines Media.
Bach, U., Tachibana, Y., Moser, J.-E., Haque, S. A., Durrant, J. R., Grätzel, M., et al. (1999). Charge Separation in Solid-State Dye-Sensitized Heterojunction Solar Cells. J. Am. Chem. Soc. 121, 7445–7446. doi:10.1021/ja9915403
Barbe´, C. J., Arendse, F., Comte, P., Jirousek, M., Lenzmann, F., Shklover, V., et al. (1997). Nanocrystalline Titanium Oxide Electrodes for Photovoltaic Applications, J. Am. Ceram. Soc. 80, 3157. doi:10.1111/j.1151-2916.1997.tb03245.x
Birel, Ö., Nadeem, S., and Duman, H. (2017). Porphyrin-Based Dye-Sensitized Solar Cells (DSSCs): a Review. J. Fluoresc 27, 1075–1085. doi:10.1007/s10895-017-2041-2
Bohren, C. F., and Huffman, D. R. (1998). Absorption and Scattering of Light by Small Particles. New York US: John Wiley & Sons. doi:10.1002/9783527618156
Błaszczyk, A. (2018). Strategies to Improve the Performance of Metal-Free Dye-Sensitized Solar Cells. Dyes Pigm. 149, 707–718. doi:10.1016/j.dyepig.2017.11.045
Carella, A., Centore, R., Borbone, F., Toscanesi, M., Trifuoggi, M., Bella, F., et al. (2018). Tuning Optical and Electronic Properties in Novel Carbazole Photosensitizers for P-type Dye-Sensitized Solar Cells. Electrochimica Acta 292, 805–816. doi:10.1016/j.electacta.2018.09.204
Cheng, F., CaoGuan, Q. Y., Guan, Y., Cheng, H., Wang, X., and Miller, J. D. (2013). FTIR Analysis of Water Structure and its Influence on the Flotation of Arcanite (K2SO4) and Epsomite (MgSO4·7H2O). Int. J. Mineral Process. 122, 36–42. doi:10.1016/j.minpro.2013.04.007
Chou, T. P., Zhang, Q., Russo, B., Fryxell, G. E., and Cao, G. (2007). Titania Particle Size Effect on the Overall Performance of Dye-Sensitized Solar Cells. J. Phys. Chem. C 111, 6296–6302. doi:10.1021/jp068939f
Geng, R., Chang, R., Zou, Q., Shen, G., Jiao, T., and Yan, X. (2021). Biomimetic Nanozymes Based on Coassembly of Amino Acid and Hemin for Catalytic Oxidation and Sensing of Biomolecules. Small 17 (19), 2008114. doi:10.1002/smll.202008114
Geserick, J., Fröschl, T., Hüsing, N., Kucerova, G., Makosch, M., Diemant, T., et al. (2011). Molecular Approaches towards Mixed Metal Oxides and Their Behaviour in Mixed Oxide Support Au Catalysts for CO Oxidation. Dalton Trans. 40, 3269. doi:10.1039/c0dt00911c
Gonçalves, L. M., de Zea Bermudez, V., Ribeiro, H. A., and Mendes, A. M. (2008). Dye-sensitized Solar Cells: a Safe Bet for the Future. Energy Environ. Sci. 1, 655–667. doi:10.1039/b807236a
Gracia, F., Holgado, J. P., and González-Elipe, A. R. (2004). Photoefficiency and Optical, Microstructural, and Structural Properties of TiO2Thin Films Used as Photoanodes. Langmuir 20, 1688–1697. doi:10.1021/la034998y
GraciaHolgado, F. J. P., Holgado, J. P., and González-Elipe, A. R. (2004). Photoefficiency and Optical, Microstructural, and Structural Properties of TiO2Thin Films Used as Photoanodes. Langmuir 20, 1688–1697. doi:10.1021/la034998y
Grant, C. D., Schwartzberg, A. M., Smestad, G. P., Kowalik, J., Tolbert, L. M., and Zhang, J. Z. (2002). J. Electroanal. Chem. 40, 522.
Gregg, B. A. (2004). Interfacial Processes in the Dye-Sensitized Solar Cell. Coord. Chem. Rev. 248, 1215–1224. doi:10.1016/j.ccr.2004.02.009
Grilli, M. L., Yilmaz, M., Aydogan, S., and Cirak, B. B. (2018). Room Temperature Deposition of XRD-Amorphous TiO2 Thin Films: Investigation of Device Performance as a Function of Temperature. ceramics Int. 44, 11582–11590. doi:10.1016/j.ceramint.2018.03.222
Hagfeldt, A., Boschloo, G., Lindström, H., Figgemeier, E., Holmberg, A., Aranyos, V., et al. (2004). A System Approach to Molecular Solar Cells. Coord. Chem. Rev. 248, 1501–1509. doi:10.1016/j.ccr.2004.04.012
Hong, V. V. (2010). “Amorphous Nanoparticles,” in Handbook of Nanophysics: Nanoparticles and Quantum Dots. Editor K. S. Sattler (New York, US: CRC Press), 1–10.
Hsu, W. P., Yu, R., and Matijević, E. (1993). Paper Whiteners. J. Colloid Interf. Sci. 156, 56–65. doi:10.1006/jcis.1993.1080
Kamat, P. V. (2007). Meeting the Clean Energy Demand: Nanostructure Architectures for Solar Energy Conversion. J. Phys. Chem. C 111, 2834–2860. doi:10.1021/jp066952u
Kaneko, M., and Okura, I. (2002). Photocatalysis: Science and Technology. New York, US: Kodansha- Spring Verlag.
Kerker, M. (1969). The Scattering of Light and Other Electromagnetic Radiation. 1st edition. New York US: Elsevier.
Khadtare, S. S., and Pathan, H. M. (2014). Rose Bengal Sensitized ZnO Photoelectrode for Dye Sensitized Solar Cell: Optimizing the Performance. J. Renew. Sustain. Energ. 6, 053131–053139. doi:10.1063/1.4899050
Lee, H., Kim, J., Kim, D. Y., and Seo, Y. (2018). Co-sensitization of Metal Free Organic Dyes in Flexible Dye Sensitized Solar Cells. Org. Electron. 52, 103–109. doi:10.1016/j.orgel.2017.10.003
Li, Q., Liu, B., Wang, L., Li, D., Liu, R., Zou, B., et al. (2010). Pressure-Induced Amorphization and Polyamorphism in One-Dimensional Single-Crystal TiO2 Nanomaterials. J. Phys. Chem. Lett. 1, 309–314. doi:10.1021/jz9001828
Li, Q., Liu, R., Wang, T., Xu, K., Dong, Q., Liu, B., et al. (2015). High Pressure Synthesis of Amorphous TiO2 Nanotubes. AIP Adv. 5, 097128. doi:10.1063/1.4930916
Li, Z., Zhu, Y., Wang, J., Guo, Q., and Li, J. (2015). Size-controlled Synthesis of Dispersed Equiaxed Amorphous TiO2 Nanoparticles. Ceramics Int. 41, 9057–9062. doi:10.1016/j.ceramint.2015.03.278
Lokhande, P. K. M., Sonigara, K. K., Jadhav, M. M., Patil, D. S., Soni, S. S., and Sekar, N. (2019). Multi‐Dentate Carbazole Based Schiff Base Dyes with Chlorovinylene Group in Spacer for Dye‐Sensitized Solar Cells: A Combined Theoretical and Experimental Study. ChemistrySelect 4, 4044–4056. doi:10.1002/slct.201803940
Mahmoud, S. A., Atia, H., and Bendary, S. H. (2016). Synthesis of a High Efficiency Novel Working Electrode Scandium/HOMBIKAT in Dye-Sensitized Solar Cells. Solar Energy 134, 452–460. doi:10.1016/j.solener.2016.05.022
Mahmoud, S. A., Bendary, S. H., Atia, H., and Martin, A. (2017). Effect of Different Electrolytes on the Efficiency of Dye Sensitized Solar Cells for Solar Energy Conversion. J. Nanosci. Nanotechnol. 17, 3719–3728. doi:10.1166/jnn.2017.14004
Mahmoud, S. A., Fouad, O. A., Salem, A. A., and Bendary, S. H. (2021). Profound Impact of Zn3(OH)2(V2O7)(H2O)2 and Zn3V2O8-Zn2V2O7 in Dye Sensitized Solar Cells. J. Elec Materi 50, 4289–4302. doi:10.1007/s11664-021-08860-5
Mahmoud, S. A., and Fouad, O. A. (2015). Synthesis and Application of Zinc/tin Oxide Nanostructures in Photocatalysis and Dye Sensitized Solar Cells. Solar Energ. Mater. Solar Cell 136, 38–43. doi:10.1016/j.solmat.2014.12.035
Mahmoud, S. A., and Mohamed, B. S. (2015). Study on the Performance of Photogalvanic Cell for Solar Energy Conversion and Storage. Int. J. Electrochem. Sci. 10, 3340–3353.
Mahmoud, S. A., Mohamed, B. S., and Doheim, M. (2017). Ionic Liquid as Electrolyte in Photogalvanic Cell for Solar Energy Conversion and Storage. Int. J. Energ. Power Eng. 5, 203–208. doi:10.11648/j.ijepe.20160506.15
Marchese, L., Gianotti, E., Dellarocca, V., Maschmeyer, T., Rey, F., Coluccia, S., et al. (1991a). Structure–functionality relationships of grafted Ti-MCM41 silicas. Spectroscopic and catalytic studies, Phys. Chem. Chem. Phys. 1, 585–592. doi:10.1039/a808225a
Mir, N., and Salavati-Niasari, M. (2013). Preparation of TiO2 Nanoparticles by Using Tripodal Tetraamine Ligands as Complexing Agent via Two-step Sol-Gel Method and Their Application in Dye-Sensitized Solar Cells. Mater. Res. Bull. 48, 1660–1667. doi:10.1016/j.materresbull.2013.01.006
Moskowitz, P. D., and Fthenakis, V. M. (1991). A Checklist of Suggested Safe Practices for the Storage, Distribution, Use and Disposal of Toxic and Hazardous Gases in Photovoltaic Cell Production. Solar Cells 31, 513–525. doi:10.1016/0379-6787(91)90094-6
Moskowitz, P. D., and Fthenakis, V. M. (1990). Toxic Materials Released from Photovoltaic Modules during Fires: Health Risks. Solar Cells 29, 63–71. doi:10.1016/0379-6787(90)90015-w
Nair, P. B., Justinvictor, V. B., Daniel, G. P., Joy, K., and Thomas, P. V. (2013). Influence of Film Thickness and Annealing Atmosphere on the Structural, Optical and Luminescence Properties of Nanocrystalline TiO2 Thin Films Prepared by RF Magnetron Sputtering. J. Mater. Sci. Mater. Electron. 24, 2453–2460. doi:10.1007/s10854-013-1117-2
Nogami, G., Shiratsuchi, R., and Ohkubo, S. (1991). Energy Relaxation Mechanisms of Electroluminescence in Sintered TiO2 Electrodes. J. Electrochem. Soc. 138, 751–758. doi:10.1149/1.2085670
Omurzak, E., Mashimo, T., Iwamoto, C., Matsumoto, Y., and Sulaimankulova, S. (2009), Synthesis of Blue Amorphous TiO2 and TinO2n–1 by the Impulse Plasma in Liquid. J. Nanosci. Nanotechnol. 9, 637. doi:10.1166/jnn.2009.1331
O’Regan, B., and Grätzel, M.. A low-cost, high-efficiency solar cell based on dye-sensitized colloidal TiO2 films, (1991), Nat 353, 737–740. doi:10.4324/9781315793245-57
Park, N.-G., Van de Lagemaat, J., and Frank, A. J. (2000). Comparison of Dye-Sensitized Rutile- and Anatase-Based TiO2 Solar Cells. J. Phys. Chem. B 104, 8989–8994. doi:10.1021/jp994365l
Park, S. K., Chung, C., Kim, D-H., Kim, C., Lee, S-J., and Han, Y. S. (2012). Mater Res Bull. 47, 2722–2725.
Qian, C., Yin, J., Zhao, J., Li, X., Wang, S., Bai, Z., et al. (2021). Facile Preparation and Highly Efficient Photodegradation Performances of Self-Assembled Artemia Eggshell-ZnO Nanocomposites for Wastewater Treatment. Colloids Surf. A: Physicochemical Eng. Aspects 610, 125752. doi:10.1016/j.colsurfa.2020.125752
Raimondi, M. E., Gianotti, E., Marchese, L., Martra, G., Maschmeyer, T., and Seddon, J. M. (2000). Coluccia S.. J. Phys. Chem. B 104, 71. doi:10.1021/jp993545s
Ramasamy, P., Kang, M.-S., Cha, H.-J., and Kim, J. (2013). Highly Efficient Dye-Sensitized Solar Cells Based on HfO2 Modified TiO2 Electrodes. Mater. Res. Bull. 48, 79–83. doi:10.1016/j.materresbull.2012.10.006
Roy, M. S., Balraju, P., Kumar, M., and Sharma, G. D. (2008). Dye-sensitized Solar Cell Based on Rose Bengal Dye and Nanocrystalline TiO2. Solar Energ. Mater. Solar Cell 92, 909–913. doi:10.1016/j.solmat.2008.02.022
Sanjay, P., Isaivani, I., Deepa, K., Madhavan, J., and Senthil, S. (2019). The Preparation of Dye Sensitized Solar Cells Using Natural Dyes Extracted From Phytolacca icosandra and Phyllanthus reticulatus With ZnO as Photoanode. Mater. Lett. 244, 142–146. doi:10.1016/j.matlet.2019.02.072
Sarode, M. T., Khollam, Y. B., Jadkar, S. R., Kale, B. B., and Mohite, K. C. (2016). in International Conference on Automatic Control and Dynamic Optimization Techniques (ICACDOT), Pune (IEE), 1193–1198. doi:10.1109/ICACDOT.2016.787777
Shubert, M. M., Plzak, V., Garche, J., and Behm, R. J. (2001). Activity, Selectivity, and Long-Term Stability of Different Metal Oxide Supported Gold Catalysts for the Preferential CO Oxidation in H2-Rich Gas, Catal. Lett. 76, 143–150. doi:10.1023/A:1012365710979
Tamilselvan, V., Yuvaraj, D., Rakesh Kumar, R., and Narasimha Rao, K. (2012). Growth of Rutile TiO2 Nanorods on TiO2 Seed Layer Deposited by Electron Beam Evaporation. Appl. Surf. Sci. 258, 4283–4287. doi:10.1016/j.apsusc.2011.12.079
Tiron, V., Velicu, I.-L., Dobromir, M., Demeter, A., Samoila, F., Ursu, C., et al. (2016). Reactive Multi-Pulse HiPIMS Deposition of Oxygen-Deficient TiOx Thin Films. Thin Solid Films 603, 255–261. doi:10.1016/j.tsf.2016.02.025
Topoglidis, E., Cass, A. E. G., Gilardi, G., Sadeghi, S., Beaumont, N., and Durrant, J. R. (1998). Protein Adsorption on Nanocrystalline TiO2Films: An Immobilization Strategy for Bioanalytical Devices. Anal. Chem. 70, 5111–5113. doi:10.1021/ac980764l
Trihutomo, P., Soeparman, S., Widhiyanuriyawan, D., and Yuliati, L. (2019). Performance Improvement of Dye-Sensitized Solar Cell- (DSSC-) Based Natural Dyes by Clathrin Protein. Int. J. Photoenergy 2019, 1–9. doi:10.1155/2019/4384728
Vargas, M. A., and Rodríguez-Páez, E. J. (2017). Amorphous TiO2 Nanoparticles: Synthesis and Antibacterial Capacity. J. Non Cryst. Solids 459, 192–205. doi:10.1016/j.jnoncrysol.2017.01.018
Wang, Y. -D., Ma, C.-L., Sun, X.-D., and Li, H.-D. (2003), Synthesis and characterization of amorphous TiO 2 with wormhole-like framework mesostructure. J. Non-cryst. Sol. 319:109-116. doi:10.1016/s0022-3093(02)01956-7
Wu, H., Huang, Z., Hua, T., Liao, C., Meier, H., Tang, H., et al. (2019). Metal-free organic dyes with di(1-benzothieno)[3,2-b:2′,3′-d]pyrrole as a donor for efficient dye-sensitized solar cells: Effect of mono- and bi-anchors on photovoltaic performance. Dyes Pigm. 165, 103–111. doi:10.1016/j.dyepig.2019.02.003
Yin, J., Ge, B., Jiao, T., Qin, Z., Yu, M., Zhang, L., et al. (2021). Self-Assembled Sandwich-like MXene-Derived Composites as Highly Efficient and Sustainable Catalysts for Wastewater Treatment. Langmuir 37, 1267–1278. doi:10.1021/acs.langmuir.0c03297
Zeng, K., Lu, Y., Tang, W., Zhao, S., Liu, Q., Zhu, W., et al. (2019). Efficient Solar Cells Sensitized by a Promising New Type of Porphyrin: Dye-Aggregation Suppressed by Double Strapping. Chem. Sci. 10, 2186–2192. doi:10.1039/c8sc04969f
Zhang, Q., Myers, D., Lan, J., Jenekhe, S. A., and Cao, G. (2012). Applications of Light Scattering in Dye-Sensitized Solar Cells. Phys. Chem. Chem. Phys. 14, 14982–14998. doi:10.1039/c2cp43089d
Zhang, Z., Kladi, A., and Verykios, X. E. (1994). Spectroscopic Study of the Effects of Carrier Doping on the Surface Structure of Rh/TiO2 Catalysts and on Their Interaction with CO and H2. J. Phys. Chem. 98, 6804–6811. doi:10.1021/j100078a024
Zhao, L., Yu, J., Fan, J., Zhai, P., and Wang, S. (2009). Dye-Sensitized Solar Cells Based on Ordered Titanate Nanotube Films Fabricated by Electrophoretic Deposition Method. Electrochem. Commun. 11, 2052–2055. doi:10.1016/j.elecom.2009.08.050
Keywords: TiO2, particle size distribution, conversion efficiency, RB dye, DSSCs
Citation: Mahmoud SA, Mohamed BS and Killa HM (2021) Synthesis of Different Sizes TiO2 and Photovoltaic Performance in Dye-Sensitized Solar Cells. Front. Mater. 8:714835. doi: 10.3389/fmats.2021.714835
Received: 25 May 2021; Accepted: 30 August 2021;
Published: 18 October 2021.
Edited by:
Damian C. Onwudiwe, North-West University, South AfricaReviewed by:
Azhar Fakharuddin, University of Konstanz, GermanyCopyright © 2021 Mahmoud, Mohamed and Killa. This is an open-access article distributed under the terms of the Creative Commons Attribution License (CC BY). The use, distribution or reproduction in other forums is permitted, provided the original author(s) and the copyright owner(s) are credited and that the original publication in this journal is cited, in accordance with accepted academic practice. No use, distribution or reproduction is permitted which does not comply with these terms.
*Correspondence: Sawsan A. Mahmoud, c2F3c2FuaGFzc2FuMjAwM0B5YWhvby5jb20=
Disclaimer: All claims expressed in this article are solely those of the authors and do not necessarily represent those of their affiliated organizations, or those of the publisher, the editors and the reviewers. Any product that may be evaluated in this article or claim that may be made by its manufacturer is not guaranteed or endorsed by the publisher.
Research integrity at Frontiers
Learn more about the work of our research integrity team to safeguard the quality of each article we publish.