 Dongqi Song
 Ying Zhou
 Min Zhang2
- 1Key Laboratory of Material Physics, Ministry of Education, School of Physics and Microelectronics, Zhengzhou University, Zhengzhou, China
- 2Institutes of Physical Science and Information Technology, Anhui University, Hefei, China
Two-dimensional transition metal dichalcogenide 1T-VSe2 exhibits a unique three-dimensional charge density wave (CDW) order below ∼110 K at ambient pressure, which shows unusual evolution under pressure. Here we report on the high-pressure structural and transport properties of 1T-VSe2 by extending the pressure up to 57.8 GPa, through electrical transport, synchrotron X-ray diffraction (XRD) and Raman scattering measurements, which unravel two critical pressure points. The CDW transition is found to be enhanced under compression at a rate of 16.5 K/GPa up to the first critical pressure PC1 ∼ 12 GPa, at which a structural phase transition from hexagonal P-3m1 to monoclinic C2/m phase takes place. The second critical pressure PC2 ∼ 33 GPa corresponds to another structural transition from monoclinic C2/m to P21/m phase. These findings extend the phase diagram of pressurized 1T-VSe2 and may help to understand pressure tuning of structures in transition metal dichalcogenides.
Introduction
Two-dimensional transition metal dichalcogenides (TMDs) exhibit rich physical properties, which have been a hot research field in condensed matter physics for both fundamental interests and potential applications in electronics and optoelectronics (Sipos et al., 2008; Choi et al., 2013; Nayak et al., 2014; Novoselov et al., 2016). Among them, 1T-VSe2 has attracted extensive interests due to its unique three-dimensional (3D) charge density wave (CDW) order (Tsutsumi, 1982; Terashima et al., 2003; Strocov et al., 2012; Jolie et al., 2019), intrinsic photocatalytic (He et al., 2017) and photoluminescence properties (Ghobadi et al., 2018). Bulk 1T-VSe2 has a hexagonal layered structure, namely 1T (P-3m1) phase. The adjacent Se-V-Se sandwiches are held together by van der Waals interactions, and each V atom is surrounding by the nearest six Se atoms, constituting VSe6 octahedron Figure 1A (van Bruggen and Haas, 1976). It exhibits an incommensurate CDW with 4a × 4a × 3.18c periodic lattice distortion upon cooling to around 110 K, followed by a second transition to a commensurate CDW state at ∼ 80 K (Thompson and Silbernagel, 1979; Tsutsumi, 1982; Eaglesham et al., 1986; Terashima et al., 2003; Pandey and Soni, 2020). The mechanism of the 3D CDW was initially explained by Fermi-surface nesting resulting from the warped 3D electron pocket centered around the M point at the edge of the Brillouin zone (Terashima et al., 2003; Sato et al., 2004; Strocov et al., 2012). Recently, electron-phonon coupling was also found to contribute to the formation of the CDW (Pandey and Soni, 2020; Si et al., 2020). Previous studies showed that the valence band structure of 1T-VSe2 can be transformed into two-dimensional (2D) character by alkali metal intercalation, which was attributed to charge transfer and decoupling of the layers induced by the intercalated alkali ions (Starnberg et al., 1993; Brauer et al., 1998). In addition, the CDW ordering temperature can also be tuned effectively by the reduction of sample thickness owing to reduced interlayer coupling and enhanced quantum confinement (Yang et al., 2014; Pásztor et al., 2017). At the monolayer limit, many interesting phenomena have been reported, such as ferromagnetism (Ma et al., 2012; Bonilla et al., 2018), distinct CDW order (Zhang et al., 2017; Feng et al., 2018; Duvjir et al., 2018) as well as Mott/Peierls insulating state (Duvjir et al., 2018; Umemoto et al., 2018), depending on preparation conditions.
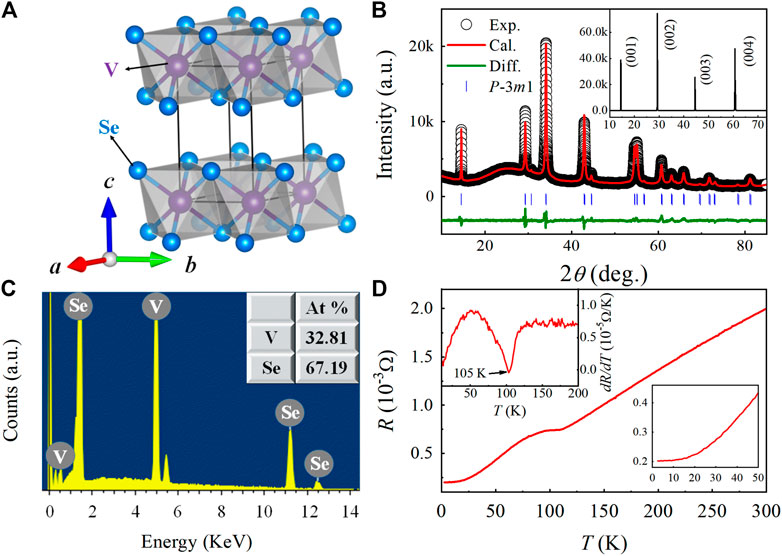
FIGURE 1. (A) Crystal structure of 1T-VSe2. (B) Room temperature powder X-ray diffraction pattern. Inset: Single-crystal XRD pattern. (C) Energy dispersive spectrum for single crystalline 1T-VSe2. (D) Resistance for a single crystal as a function of temperature. Inset: The first derivative of the resistance dR/dT.
Pressure has been considered as a clean and effective method to tune lattice degrees of freedom, and thereby the physical properties of materials (Mao et al., 2018). In 1T-VSe2, a pressure-induced structural phase transition from 1T phase to monoclinic C2/m phase with a novel superstructure around 15 GPa were reported via theoretical calculations, Raman spectroscopy and synchrotron X-ray diffraction (XRD) (Sereika et al., 2020; Feng et al., 2020). As for the transport properties of 1T-VSe2 under pressure, controversial results have been reported. Specifically, Sahoo et al. reported that the CDW transition temperature (TCDW) first increases marginally up to 5 GPa and then increases rapidly, and accompanying by non-hydrostatic pressure-induced suppression of CDW, superconductivity emerges at ∼15 GPa (Sahoo et al., 2020). However, soon after, Feng et al. found that the CDW transition temperature was enhanced linearly by increasing pressure, reaching 358 K at 14.6 GPa and no superconducting transition is observed under quasi-hydrostatic pressure up to 29.6 GPa (Feng et al., 2020). Obviously, the detailed properties of 1T-VSe2 under pressure remain far from being well explored. In addition, in these reports, the pressures applied in the XRD, Raman, and resistance measurements are below 30–35 GPa (Friend et al., 1978; Sereika et al., 2020; Feng et al., 2020; Sahoo et al., 2020). For pressures above 35 GPa, the evolution of structural and transport properties are still unclear.
In this paper, we synthesize high-quality 1T-VSe2 single crystals and investigate the evolution of structural and transport properties under pressure up to 57.8 GPa. Resistance measurements show that the TCDW shifts gradually to higher temperature with increasing pressure up to PC1 ∼ 12 GPa, at which the hexagonal P-3m1 structure undergoes a transition to monoclinic C2/m phase. And no sign of superconductivity is observed in the pressurized 1T-VSe2 up to 42 GPa. Moreover, our synchrotron XRD and Raman experiments reveal a second structural transition from the monoclinic C2/m to P21/m phase with further increasing pressure to the second critical pressure PC2 ∼ 33 GPa.
Materials and Methods
Single crystals of 1T-VSe2 were synthesized by chemical vapor transport method using selenium (about 2 mg/cm3) as transport agent (van Bruggen and Haas, 1976). The mixture of Vanadium (3N) and Selenium (5N) powders was sealed in an evacuated quartz tube. Then the quartz tube was heated for 1 week in a two-zone furnace with a temperature field of ΔT = (850–780)°C. The structure of the single-crystalline samples was analyzed by XRD experiments with Cu-Kα radiation (λ = 1.5418 Å). The atomic ratio was characterized by the energy dispersive X-ray spectrometry. The temperature-dependent resistance was measured using a standard four-point-probe method.
High-pressure resistance measurements were performed in a nonmagnetic Be-Cu diamond anvil cell (Zhou et al., 2019). Diamond anvils of 300 μm culets and a T301 stainless-steel gasket covered with a mixture of epoxy and fine cubic boron nitride (c-BN) powder were used. A hole with diameter of 150 mm was drilled at the center of the c-BN-covered pit, and then filled with pressure-transmitting medium. Daphne 7373 and NaCl were used as pressure-transmitting medium in Run 1 and Run 2, respectively. A rectangular single-crystal sample was loaded into the hole, together with some ruby powder as the pressure marker. Pt foils with a thickness of 7.5 μm were used as the electrode leads. The cell was then put into an in-house multifunctional physical properties measurement system. The resistance R was collected using the standard four-probe method via sweeping temperature.
Synchrotron XRD and Raman scattering measurements under pressure were performed in a Mao-Bell cell at room temperature. Daphne 7373 was used as pressure-transmitting medium for both experiments. The XRD was performed on powder crushed from single crystals at the beamline BL15U1 of the Shanghai Synchrotron Radiation Facility (SSRF). The wavelength of the focused monochromatic X-ray beam is 0.6199 Å. The DIOPTAS program (Clemens and Vitali, 2015) was used for image integrations. The XRD patterns were fitted by using the RIETICA program (Hunter, 1998) with the Le Bail method. Raman spectra were measured with a freshly cleaved 1T-VSe2 single crystal using the 532-nm solid-state laser. The pressure was calibrated by using the ruby fluorescence shift at room temperature for all of the high-pressure experiments above (Mao et al., 1986).
Results and Discussion
Figure 1B displays the XRD pattern for powdered 1T-VSe2 single crystals. All peaks can be well indexed by the P-3m1 space group, and the fitting yields the cell parameters a = b = 3.36 Å, c = 6.09 Å, and V = 59.54 Å3, in excellent accordance with the previous reports (van Bruggen and Haas, 1976; Pandey and Soni, 2020). A typical single-crystal diffraction pattern for 1T-VSe2 is shown in the inset of Figure 1B. Only (00l) reflections are observed, indicating a c-axis orientation of the cleavage plane. The energy-dispersive X-ray spectrum gives the ratio of V: Se as 1:2.05 (Figure 1C). The in-plane resistance R as a function of temperature at ambient pressure is given in Figure 1D. The R-T curve shows an overall metallic behavior but with a clear hump feature at around 105 K related to the CDW transition, in agreement with the previous studies (van Bruggen and Haas, 1976; Pandey and Soni, 2020). The CDW transition temperature TCDW is defined as the temperature at which the dR/dT is minimum (inset of Figure 1D). The characterizations above indicate high quality of our samples.
To check on the pressure evolution of CDW and pressure-induced superconductivity in 1T-VSe2, we have performed resistance measurements under pressures using different pressure-transmitting mediums. In Run 1 (Figure 2), we used Daphne 7373 as the pressure medium with pressures up to 28.5 GPa. As one can see in Figure 2A, at p = 0.7 GPa, a resistance hump relating to the CDW transition is observed at around 110.7 K, which is higher than that at ambient pressure (Figure 1D). With further increasing pressure, the temperature of the resistance hump rises rapidly and reaches a maximum of 289.3 K at p = 10.4 GPa. This suggests an enhancement of the CDW under pressure, in agreement with the previous reports (Friend et al., 1978; Feng et al., 2020; Sahoo et al., 2020). For pressures higher than 10.4 GPa (Figure 2E), the resistance hump is indiscernible, namely, no sign of CDW is observed in the temperature range of 2–300 K, and the R(T) curve is monotonically shifted upwards.
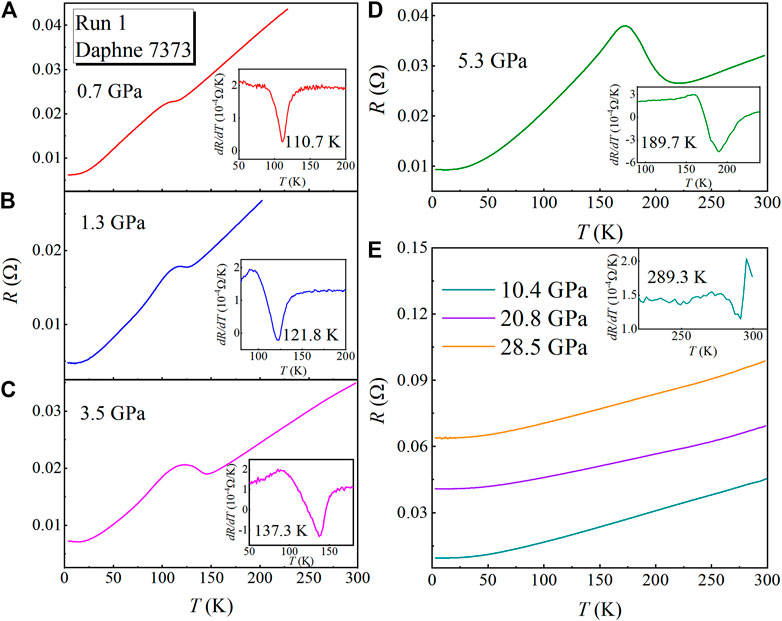
FIGURE 2. High-pressure resistance measurements were performed using Daphne 7373 as the pressure medium (Run 1). (A)–(E) Temperature dependence of resistance of 1T-VSe2 at various pressures. Insets of (A)–(E): Temperature dependence of dR/dT.
For comparison, we further carried out R(T) measurements using solid pressure medium (NaCl) up to 42.0 GPa in Run 2 (Figure 3), which is referred as non-hydrostatic pressure similar to that in Ref. (Sahoo et al., 2020). With increasing pressure from 0.4 to 10.9 GPa, the resistance hump moves toward higher temperatures, in conformity with that of Run 1, confirming that compression can increase TCDW in 1T-VSe2. The evident enhancement of TCDW could be related to the pressure-enhanced CDW gap and improvement of out-of-plane Fermi surface nesting due to increase of the dimensionality (Feng et al., 2020). Nevertheless, either quasi-hydrostatic or non-hydrostatic compression, no sign of superconductivity is observed from 2 to 300 K measured up to 42.0 GPa in our measurements.
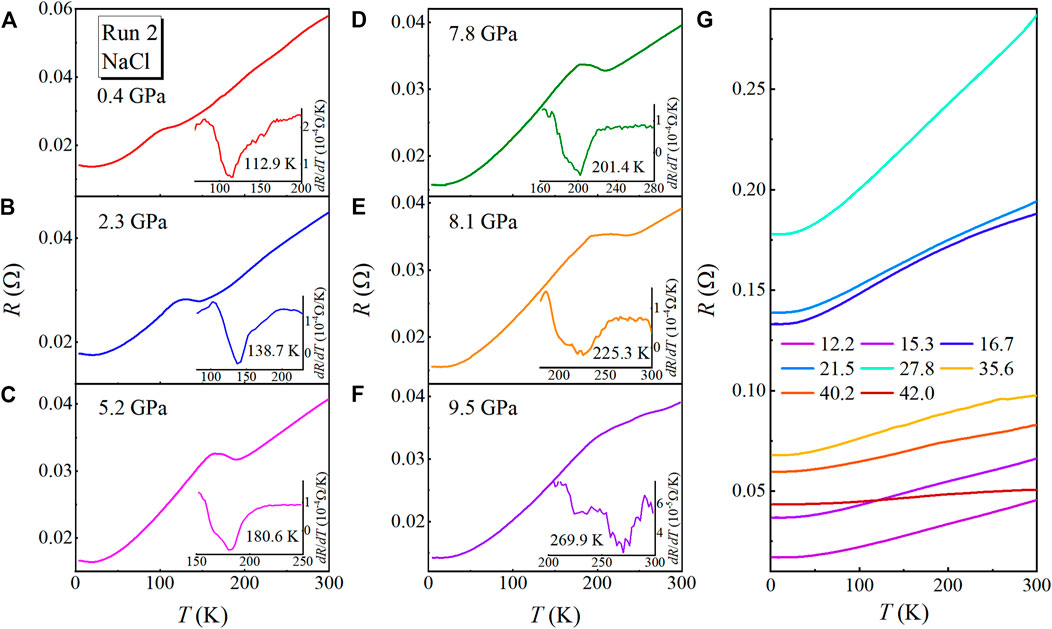
FIGURE 3. High-pressure resistance measurements were performed using NaCl as the pressure medium (Run 2). (A)–(G) Temperature dependence of resistance of 1T-VSe2 at various pressures. Insets of (A)–(F): Temperature dependence of dR/dT.
Next, pressure evolution of crystal structure of 1T-VSe2 was studied by synchrotron XRD measurements on powdered samples. Typical XRD patterns are shown in Figure 4A and three representative fittings for pressures p = 0.3, 16.9, and 36.2 GPa are presented in Figures 4B–D. Starting at 0.3 GPa, the XRD pattern can be well indexed by hexagonal crystal structure with space group P-3m1 (No. 164) (Figure 4D), which is the same as that of 1T-VSe2 at ambient pressure. Upon compression, all peaks shift to higher angles due to shrinkage of the lattice. At PC1∼13.2 GPa, some new diffraction peaks begin to occur at the 2θ angles of 12.6, 14.2, 15.9, and 17.0°, as denoted by arrows in Figure 4A, which indicates a structural transition. Phase II (red) can be fitted with the monoclinic C2/m structure (No. 12) as shown in Figure 4C, which is in accord with the results of Refs. (Feng et al., 2020; Sahoo et al., 2020). The C2/m structure can be considered as a distorted 1T phase, which involves the formation of trimers associated with tiny displacement of V atoms, leading to the formation of a novel 3 × 1 × 1 superstructure (Sereika et al., 2020; Feng et al., 2020). Moreover, when the pressure is increased to PC2 ∼ 33.7 GPa, an additional peak appears at 15.8°(see the star in Figure 4A); and its intensity increases with pressure increasing, which indicates occurrence of another structural transition. It is well-known that depending on the various stacking sequences of the two-dimension layers and the coordination of transition metal atoms, two-dimensional transition metal dichalcogenides MX2 can crystallize into different types, such as 1T (P-3m1), 1T′ (C2/m and P21/m), 2H (P63/mmc), 3R (R3m), Td (Pmn2) etc (Sofer et al., 2017). Excluding the ambient pressure P-3m1 and the first high-pressure C2/m phases, there are four remaining possible structures. We tried fitting our high-pressure XRD data by these candidate structures and found that the high-pressure XRD patterns above ∼33.7 GPa can be well fitted by the P21/m space group (Figure 4B), suggesting that the newly emergent phase III (blue) is a monoclinic structure with space group P21/m (No. 11), similar with that in pressurized TaTe2 (Guo et al., 2017). When the pressure is released to 3.5 GPa (denoted by d, top of Figure 4A), the XRD pattern evolves back to the starting structure of 1T-VSe2, implying that these two structural transitions are reversible.
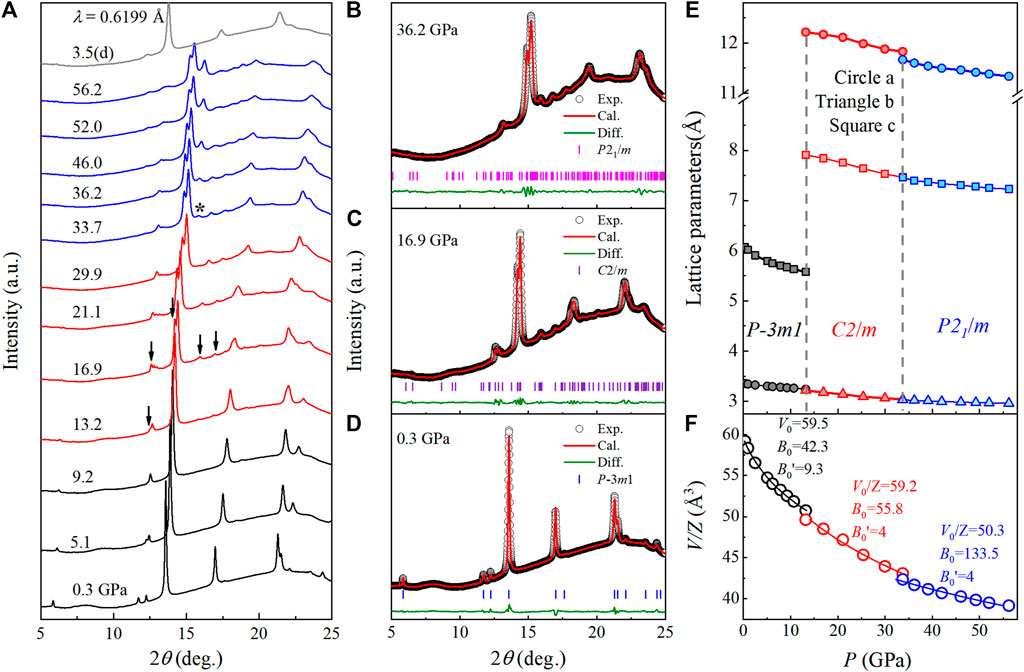
FIGURE 4. (A) High-pressure XRD patterns for powdered 1T-VSe2 single crystals under pressures from 0.3 to 56.2 GPa, and then down to 3.5 GPa (“d” means decompression). The diffraction wavelength λ = 0.6199 Å. (B)–(D) Representative fittings of the XRD patterns at 36.2, 16.9, and 0.3 GPa. (E) Pressure dependence of the lattice parameters a, b, and c. (F) Pressure dependence of the lattice volume of a unit cell.
The extracted lattice parameters as a function of pressure are summarized in Figure 4E. The lattice parameters for P-3m1, C2/m, and P21/m phases decrease gradually upon compression. The pressure dependence of unit cell volume V/Z is plotted in Figure 4F. The isothermal equations of state (EoS) were fitted by the third-order Birch-Murnaghan formula (Birch, 1947), as indicated by the solid lines. Our fitting yields the zero-pressure volume
It is known that the properties of the CDW transition are closely related to the dimensionality of the material. In Supplementary Figure S1, we plotted the pressure-dependent TCDW and the axial ratio c/a. It is obvious to see a direct correlation between the increase of TCDW and decrease of c/a ratio. And the axial ratio c/a of 1T-VSe2 decreases with pressure, that is, the dimensionality of the system increases (Feng et al., 2020). These results suggest that the enhancement of CDW is related to the inherent dimensionality of 1T-VSe2.
Raman spectroscopy is also an effective and powerful tool in detecting structural transition. Bulk 1T-VSe2 single-crystal displays a sharp A1g mode ∼ 206 cm−1 along with two additional modes associated with Eg ∼ 257 cm−1 symmetry and two-phonon (2ph) ∼ 332 cm−1 interactions at room temperature and ambient pressure (Pandey and Soni, 2020). Figure 5A shows the room-temperature Raman spectra of 1T-VSe2 single crystal at selected pressures. At a pressure of 0.9 GPa, the A1g and Eg modes are detected at ∼ 212 cm−1 and 255 cm−1, respectively, in agreement with previous report (Pandey and Soni, 2020). Since the Eg mode cannot be identified accurately at the higher pressure, we only trace A1g in this paper. With increasing pressure, the A1g mode moves toward higher frequencies monotonically. At PC1∼ 12.4 GPa, along with the structural transition to monoclinic C2/m structure, two new peaks are detected at 166, 202 cm−1 (labeled as M1 and M2, respectively), which is consistent with the previous study (Feng et al., 2020). Considering the continuous evolution of the A1g mode and the structural phase transition, we labeled the A1g mode in the range of 12.4∼31.3 GPa as A1g′mode. With increasing pressure up to 31.3 GPa, all A1g′, M1, and M2 peaks shift toward high frequency. Upon further compression above PC2 ∼ 33 GPa, the M2 mode disappears and another peak at 378 cm−1 emerges, which can be attributed to the structural transition from C2/m to P21/m detected in the XRD measurements. Similarly, we labeled the M1 and A1g′ modes above 31.3 GPa as the M1′ and A1g″ modes, respectively. The remaining one is labeled as M3. The Raman frequencies of M1′, A1g″, and M3 increase under further compression, and no additional peak is observed, suggesting a stable new high-pressure phase is formed up to 57.8 GPa. We note that the Raman peaks broaden obviously at high pressure, which is due to non-hydrostatic compression associated with the pressure-transmitting medium. With pressure released down to 0.7 GPa, the peaks in the Raman spectrum return to the initial position (denoted by d, at the top of Figure 5A), which means that these two structural transitions are reversible, in accordance with the results of XRD data.
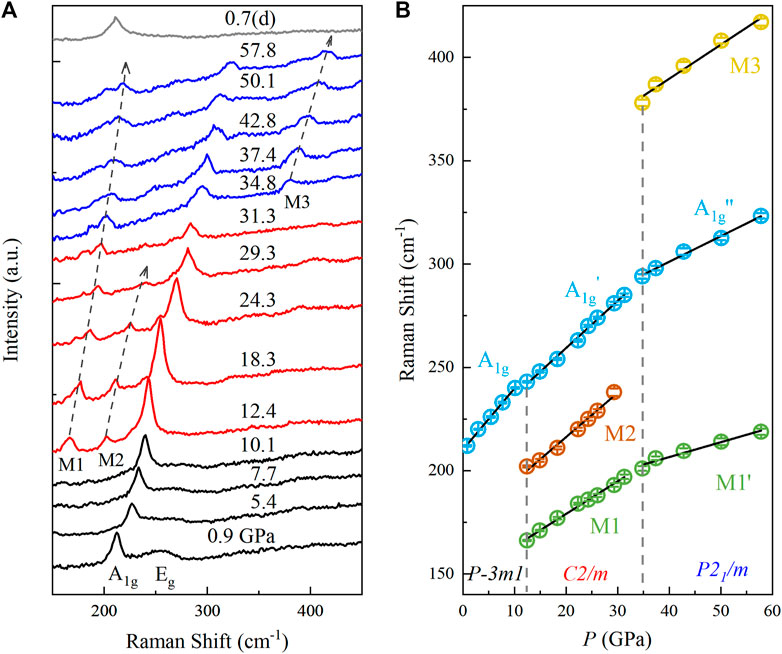
FIGURE 5. (A) Room-temperature Raman spectra of 1T-VSe2 single crystal under selected pressures. The Raman spectrum under decompression is labeled by “d”. The dashed lines are guides for the eye. (B) Pressure dependence of Raman frequencies of 1T-VSe2. Solid lines are linear fits to data.
The extracted Raman frequencies as a function of pressure are plotted in Figure 5B. With increasing pressure, Raman frequencies increase linearly in each crystal structure, while the corresponding slope is visibly different. The pressure coefficients of Raman modes are fitted by linear lines using Eq. 1 as displayed in Figure 5B. The individual mode Grüneisen parameter
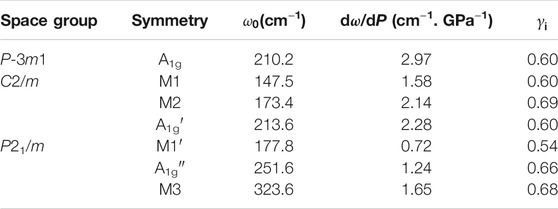
TABLE 1. Pressure coefficient (dω/dP) and mode Grüneisen parameter (γi) for different Raman modes.
Combining the electrical transport, synchrotron XRD and Raman measurements under pressure, we established the phase diagram which describes the structural and transport properties of 1T-VSe2 under pressure. As outlined in Figure 6, two critical pressure points can be discerned. With increasing pressure, TCDW increases linearly at a rate of 16.5 K/GPa, suggesting that the CDW state gets strengthened with pressure in the P-3m1 phase, which is consistent with the previous report (Friend et al., 1978; Feng et al., 2020; Sahoo et al., 2020). At the first critical pressure PC1 ∼ 12 GPa, the hexagonal P-3m1 structure undergoes a transition into monoclinic C2/m phase. The second critical pressure PC2 ∼ 33 GPa corresponds to another structural transition from the monoclinic C2/m to P21/m phase. The pressure evolution of structure can also be traced by resistance measurements. One can see that the R10K initially keeps a nearly constant value at low pressures. As the pressure increases up to PC1, the R10K suddenly goes up, while it abruptly drops around PC2.
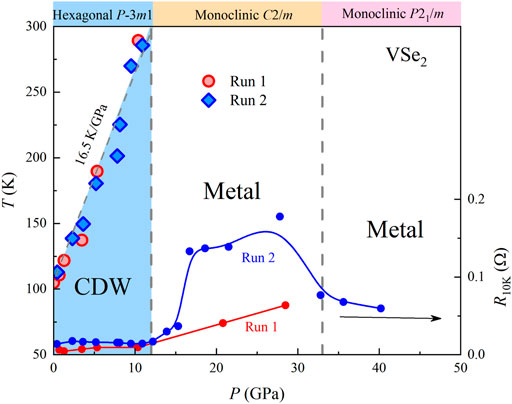
FIGURE 6. Pressure-temperature phase diagram combined with structural phase information for 1T-VSe2. The left y-axis: The pressure-dependent TCDW in Run 1 and Run 2, respectively. The right y-axis: Red (blue) circles represent the resistance values at 10 K extracted from the high-pressure resistance measurements of Run 1 (Run 2).
Conclusion
In conclusion, pressure evolutions of structure and resistance of single-crystalline 1T-VSe2 were studied by combined high-pressure electrical transport, synchrotron XRD and Raman experiments. We demonstrate that the CDW transition in the hexagonal P-3m1 phase is enhanced remarkably by the application of pressure. And two structural phase transformation from the 1T to C2/m and from C2/m to P21/m is observed at PC1 ∼ 12 and PC2 ∼ 33 GPa, respectively. These findings will shed light on the understanding of structural and transport properties in pressurized transition metal dichalcogenides.
Data Availability Statement
The original contributions presented in the study are included in the article/Supplementary Material, further inquiries can be directed to the corresponding authors.
Author Contributions
MZ and XH synthesized the sample and carried out the experiments of sample characterization. DS carried out the high-pressure electrical transport measurement and high-pressure Raman scattering. YZ carried out the high-pressure X-ray diffraction measurement. XL and YZ reviewed and edited the manuscript. All authors have read and agreed to the submitted version of the manuscript.
Funding
This research was funded by the National Natural Science Foundation of China (NSFC) (Grant No. 11974016), Natural Science Foundation of Anhui Province (Grant No. 2008085QA40).
Conflict of Interest
The authors declare that the research was conducted in the absence of any commercial or financial relationships that could be construed as a potential conflict of interest.
Acknowledgments
The X-ray diffraction experiment was performed at the beamline BL15U1, Shanghai Synchrotron Radiation Facility (SSRF).
Supplementary Material
The Supplementary Material for this article can be found online at: https://www.frontiersin.org/articles/10.3389/fmats.2021.710849/full#supplementary-material
References
Birch, F. (1947). Finite Elastic Strain of Cubic Crystals. Phys. Rev. 71, 809–824. doi:10.1103/PhysRev.71.809
Bonilla, M., Kolekar, S., Ma, Y., Diaz, H. C., Kalappattil, V., Das, R., et al. (2018). Strong room-temperature ferromagnetism in VSe2 monolayers on van der Waals substrates. Nat. Nanotech 13, 289–293. doi:10.1038/s41565-018-0063-9
Brauer, H. E., Starnberg, H. I., Holleboom, L. J., Strocov, V. N., and Hughes, H. P. (1998). Electronic Structure of Pure and Alkali-Metal-intercalated VSe2. Phys. Rev. B 58, 10031–10045. doi:10.1103/PhysRevB.58.10031
Choi, C. L., Feng, J., Li, Y., Wu, J., Zak, A., Tenne, R., et al. (2013). WS2 Nanoflakes from Nanotubes for Electrocatalysis. Nano Res. 6, 921–928. doi:10.1007/s12274-013-0369-8
Clemens, P., and Vitali, B. P. (2015). DIOPTAS: a Program for Reduction of Two-Dimensional X-ray Diffraction Data and Data Exploration. High Press. Res 35, 223. doi:10.1080/08957959.2015.1059835
Duvjir, G., Choi, B. K., Jang, I., Ulstrup, S., Kang, S., Thi Ly, T., et al. (2018). Emergence of a Metal-Insulator Transition and High-Temperature Charge-Density Waves in VSe2 at the Monolayer Limit. Nano Lett. 18, 5432–5438. doi:10.1021/acs.nanolett.8b01764
Eaglesham, D. J., Withers, R. L., and Bird, D. M. (1986). Charge-density-wave Transitions in 1T-VSe2. J. Phys. C: Solid State. Phys. 19, 359–367. doi:10.1088/0022-3719/19/3/006
Feng, J., Biswas, D., Rajan, A., Watson, M. D., Mazzola, F., Clark, O. J., et al. (2018). Electronic Structure and Enhanced Charge-Density Wave Order of Monolayer VSe2. Nano Lett. 18, 4493–4499. doi:10.1021/acs.nanolett.8b01649
Feng, J., Susilo, R. A., Lin, B., Deng, W., Wang, Y., Li, B., et al. (2020). Achieving Room‐Temperature Charge Density Wave in Transition Metal Dichalcogenide 1 T ‐VSe2. Adv. Electron. Mater. 6, 1901427. doi:10.1002/aelm.201901427
Friend, R. H., Jérome, D., Schleich, D. M., and Molinié, P. (1978). Pressure Enhancement of Charge Density Wave Formation in VSe2; The Role of Coulomb Correlations. Solid State. Commun. 27, 169–173. doi:10.1016/0038-1098(78)90825-6
Ghobadi, A., Ghobadi, T. G. U., Okyay, A. K., and Ozbay, E. (2018). Emerging Photoluminescence from Defective Vanadium Diselenide Nanosheets. Photon. Res. 6, 244–253. doi:10.1364/PRJ.6.000244
Guo, J., Luo, H. X., Yang, H. X., Wei, L. L., Wang, H. H., Yi, W., et al. (2017). Separation of the Charge Density Wave and Superconducting States by an Intermediate Semimetal Phase in Pressurized TaTe2. New York: Cornell University. arXiv:1704.08106 [cond mat.supr con].
He, S., Lin, H., Qin, L., Mao, Z., He, H., Li, Y., et al. (2017). Synthesis, Stability, and Intrinsic Photocatalytic Properties of Vanadium Diselenide. J. Mater. Chem. A. 5, 2163–2171. doi:10.1039/C6TA10390A
Hunter, B. A. (1998). Rietica—A Visual Rietveld Program. Commission on Powder Diffraction Newsletter No. 20 (Summer), International Union of Crystallography. Vienna, Austria: IAEA. Available at: http://www.rietica.org.
Jolie, W., Knispel, T., Ehlen, N., Nikonov, K., Busse, C., Grüneis, A., et al. (2019). Charge Density Wave Phase of VSe2 revisited. Phys. Rev. B 99, 115417. doi:10.1103/PhysRevB.99.115417
Ma, Y., Dai, Y., Guo, M., Niu, C., Zhu, Y., and Huang, B. (2012). Evidence of the Existence of Magnetism in Pristine VX2 Monolayers (X = S, Se) and Their Strain-Induced Tunable Magnetic Properties. ACS Nano 6, 1695–1701. doi:10.1021/nn204667z
Mao, H.-K., Chen, X.-J., Ding, Y., Li, B., and Wang, L. (2018). Solids, Liquids, and Gases under High Pressure. Rev. Mod. Phys. 90, 015007. doi:10.1103/RevModPhys.90.015007
Mao, H. K., Xu, J., and Bell, P. M. (1986). Calibration of the Ruby Pressure Gauge to 800 Kbar under Quasi-Hydrostatic Conditions. J. Geophys. Res. 91, 4673–4676. doi:10.1029/JB091iB05p04673
Nayak, A. P., Bhattacharyya, S., Zhu, J., Liu, J., Wu, X., Pandey, T., et al. (2014). Pressure-induced Semiconducting to Metallic Transition in Multilayered Molybdenum Disulphide. Nat. Commun. 5, 3731. doi:10.1038/ncomms4731
Novoselov, K. S., Mishchenko, A., Carvalho, A., and Castro Neto, A. H. (2016). 2D materials and van der Waals heterostructures. Science 353, aac9439. doi:10.1126/science.aac9439
Pandey, J., and Soni, A. (2020). Electron-phonon Interactions and Two-Phonon Modes Associated with Charge Density Wave in Single Crystalline 1T−VSe2. Phys. Rev. Res. 2, 033118. doi:10.1103/PhysRevResearch.2.033118
Pásztor, Á., Scarfato, A., Barreteau, C., Giannini, E., and Renner, C. (2017). Dimensional Crossover of the Charge Density Wave Transition in Thin Exfoliated VSe2. 2D Mater. 4, 041005. doi:10.1088/2053-1583/aa86de
Sahoo, S., Dutta, U., Harnagea, L., Sood, A. K., and Karmakar, S. (2020). Pressure-induced Suppression of Charge Density Wave and Emergence of Superconductivity in 1T−VSe2. Phys. Rev. B 101, 014514. doi:10.1103/PhysRevB.101.014514
Sato, T., Terashima, K., Souma, S., Matsui, H., Takahashi, T., Yang, H., et al. (2004). Three-Dimensional Fermi-Surface Nesting in 1T-VSe2 Studied by Angle-Resolved Photoemission Spectroscopy. J. Phys. Soc. Jpn. 73, 3331–3334. doi:10.1143/JPSJ.73.3331
Sereika, R., Park, C., Kenney-Benson, C., Bandaru, S., English, N. J., Yin, Q., et al. (2020). Novel Superstructure-Phase Two-Dimensional Material 1T-VSe2 at High Pressure. J. Phys. Chem. Lett. 11, 380–386. doi:10.1021/acs.jpclett.9b03247
Sherman, W. F. (1980). Bond Anharmonicities, Gruneisen Parameters and Pressure-Induced Frequency Shifts. J. Phys. C: Solid State. Phys. 13, 4601–4613. doi:10.1088/0022-3719/13/25/005
Si, J. G., Lu, W. J., Wu, H. Y., Lv, H. Y., Liang, X., Li, Q. J., et al. (2020). Origin of the Multiple Charge Density Wave Order in 1T−VSe2. Phys. Rev. B 101, 235405. doi:10.1103/PhysRevB.101.235405
Sipos, B., Kusmartseva, A. F., Akrap, A., Berger, H., Forró, L., and Tutiš, E. (2008). From Mott State to Superconductivity in 1T-TaS2. Nat. Mater 7, 960–965. doi:10.1038/nmat2318
Sofer, Z., Sedmidubský, D., Luxa, J., Bouša, D., Huber, Š., Lazar, P., et al. (2017). Universal Method for Large-Scale Synthesis of Layered Transition Metal Dichalcogenides. Chem. Eur. J. 23, 10177–10186. doi:10.1002/chem.201701628
Starnberg, H. I., Brauer, H. E., Holleboom, L. J., and Hughes, H. P. (1993). 3D-to-2D Transition by Cs Intercalation of VSe2. Phys. Rev. Lett. 70, 3111–3114. doi:10.1103/PhysRevLett.70.3111
Strocov, V. N., Shi, M., Kobayashi, M., Monney, C., Wang, X., Krempasky, J., et al. (2012). Three-Dimensional Electron Realm in VSe2 by Soft-X-Ray Photoelectron Spectroscopy: Origin of Charge-Density Waves. Phys. Rev. Lett. 109, 086401. doi:10.1103/PhysRevLett.109.086401
Terashima, K., Sato, T., Komatsu, H., Takahashi, T., Maeda, N., and Hayashi, K. (2003). Charge-density Wave Transition of 1T−VSe2 studied by Angle-Resolved Photoemission Spectroscopy. Phys. Rev. B 68, 155108. doi:10.1103/PhysRevB.68.155108
Thompson, A. H., and Silbernagel, B. G. (1979). Correlated Magnetic and Transport Properties in the Charge-Density-Wave States of VSe2. Phys. Rev. B 19, 3420–3426. doi:10.1103/PhysRevB.19.3420
Tsutsumi, K. (1982). X-ray-diffraction Study of the Periodic Lattice Distortion Associated with a Charge-Density Wave in 1T-VSe2. Phys. Rev. B 26, 5756–5759. doi:10.1103/PhysRevB.26.5756
Umemoto, Y., Sugawara, K., Nakata, Y., Takahashi, T., and Sato, T. (2018). Pseudogap, Fermi Arc, and Peierls-Insulating Phase Induced by 3D-2D Crossover in Monolayer VSe2. Nano Res. 12, 165–169. doi:10.1007/s12274-018-2196-4
van Bruggen, C. F., and Haas, C. (1976). Magnetic Susceptibility and Electrical Properties of VSe2 Single Crystals. Solid State. Commun. 20, 251–254. doi:10.1016/0038-1098(76)90187-3
Yang, J., Wang, W., Liu, Y., Du, H., Ning, W., Zheng, G., et al. (2014). Thickness Dependence of the Charge-Density-Wave Transition Temperature in VSe2. Appl. Phys. Lett. 105, 063109. doi:10.1063/1.4893027
Zhang, D., Ha, J., Baek, H., Chan, Y.-H., Natterer, F. D., Myers, A. F., et al. (2017). Strain Engineering a 4a×√3a Charge-Density-Wave Phase in Transition-Metal Dichalcogenide 1T−VSe2. Phys. Rev. Mater. 1, 024005. doi:10.1103/PhysRevMaterials.1.024005
Keywords: high pressure, transition metal chalcogenides, structural phase transition, charge density wave, electrical transport
Citation: Song D, Zhou Y, Zhang M, He X and Li X (2021) Structural and Transport Properties of 1T-VSe2 Single Crystal Under High Pressures. Front. Mater. 8:710849. doi: 10.3389/fmats.2021.710849
Received: 17 May 2021; Accepted: 08 June 2021;
Published: 30 June 2021.
Edited by:
Mingliang Tian, Hefei Institutes of Physical Science (CAS), ChinaReviewed by:
Liling Sun, Institute of Physics (CAS), ChinaJie Ma, Shanghai Jiao Tong University, China
Copyright © 2021 Song, Zhou, Zhang, He and Li. This is an open-access article distributed under the terms of the Creative Commons Attribution License (CC BY). The use, distribution or reproduction in other forums is permitted, provided the original author(s) and the copyright owner(s) are credited and that the original publication in this journal is cited, in accordance with accepted academic practice. No use, distribution or reproduction is permitted which does not comply with these terms.
*Correspondence: Ying Zhou, eXpob3VAYWh1LmVkdS5jbg==; Xinjian Li, bGl4akB6enUuZWR1LmNu