 Chao Huan
 Chao Zhu
 Lang Liu
 Mei Wang
 Yujiao Zhao
 Bo Zhang
 Xiaoyan Zhang
94% of researchers rate our articles as excellent or good
Learn more about the work of our research integrity team to safeguard the quality of each article we publish.
Find out more
ORIGINAL RESEARCH article
Front. Mater. , 19 July 2021
Sec. Structural Materials
Volume 8 - 2021 | https://doi.org/10.3389/fmats.2021.700917
This article is part of the Research Topic Non-BF Slag-based Green Cementitious Materials View all 20 articles
The development of cemented paste backfilling (CPB) technology has made an important contribution to the mining economy. As a kind of porous material, the pore structure characteristic of cemented paste backfill (CPB) is strongly correlated to its mechanical properties. In this study, CPB specimens were prepared with tailings/cement ratios (T/C ratio) of 4, 6, 10 and curing durations of 3, 7, 14, and 28 days, respectively. Pore structures characteristics of CPB specimens were investigated using nuclear magnetic resonance (NMR) and scanning electronic microscopy (SEM). The uniaxial compressive strength (UCS) was adopted to illustrate the mechanical property of CPB specimens. The coupling effects of T/C ratio and curing time on the pore characteristics of CPB as well as the effect of pore size on the UCS were analyzed. The results indicated that: 1) the microstructural integrity of CPB was highly related to the development status of the pore structure, which can be represented by micro-parameters like porosity, average pore area, etc. 2) a similar normal distribution curve was observed from the four kinds of pore structure in CPB. As the curing time increased, the peak of the pore size curve shifted left, and the peak value decreased, which means that the pore size in CPB decreased and became much concentrated; 3) the extension of the most probable pore size led to the cross-connection of pores and resulted in the fracture of CPB, which was shown as a crack on the main section.
The cemented paste backfill (CPB) technology has been widely used in recent years due to technical, economical, and environmental benefits (Yilmaz et al., 2011a; Lu et al., 2018; Qi et al., 2018a; Liu et al., 2020). In the deep mining, CPB could control the ground pressure to protect mine workers from roof subsidence. Diverting tailing into underground stopes could reduce surface tailing disposal and environmental hazards as well as cut the costs of tailings management (Hu et al., 2004; Yilmaz et al., 2011b; Qi et al., 2018b; Qi et al., 2018c; Cao et al., 2019). Generally, CPB is a kind of three-phase cementitious composite material, that includes solid particles (tailings, cement, etc.), water and pores, produced with three ingredients, i.e., tailings, cement, and mixing water (Benzaazoua et al., 2002; Yilmaz et al., 2010; Li et al., 2016). During the consolidation process of CPB, large numbers of pores with different size would form around the hydration products, which has an important influence on the mechanical properties (Huang et al., 2021) and flow characteristics (Jiang et al., 2020) of CPB.
At present, scanning electron microscope (SEM) and nuclear magnetic resonance (NMR) are widely used in microstructure analysis of various materials. Due to its good results, high efficiency, and low consumption. SEM has been successfully applied to study the microstructure of concrete, rock, and soil. Complex micro-pore structure characteristics of backfill can be observed through SEM (Xu et al., 2015; Li et al., 2016; Liu et al., 2021). Meanwhile, SEM images can be used to analyze the pore structure, hydration process and hydration products of cementing backfill (Cihangir et al., 2012; Wu et al., 2015; Chen et al., 2017; Koohestani and Belem, 2017; Liu et al., 2017; Chen et al., 2018; Zhou et al., 2014). In order to obtain the quantitative description of SEM images, Liu et al. (2011) developed Particles (Pores) and Cracks Analysis System (PCAS) software, in which the image recognition technology was employed to conduct quantitative analysis on soil microstructure. However, SEM can only analyze the local microstructure of the filling body due to the restriction of the sampling area. NMR technology can make up for the inadequacy of SEM in overall pore structure analysis and has been widely adopted in rock micro-pore structure investigation because of its advantages of no destruction and rapid detection. For example, based on NMR technology, Zhou et al. (2012) and Wang et al. (2017) studied the pore characteristics of rocks and the pore structure of cement asphalt mortar, respectively; Ji et al. (2017) examined the fractal features of pore structure in fresh cement slurry.
On the other hand, many efforts have been made to investigate the pore structure of backfill to get better unconfined compressive strength (UCS), recently. Xing et al. studied the effect of fineness of tailings on the pore structure of cementing backfill (Li et al., 2016). Liu et al. studied the effect of cement particle shapes on the capillary structure of hardened cement slurry through numerical simulations (Liu C et al., 2018). Ma et al. analysed the effects of adding superabsorbent polymer (SAP) on the performance of cement-based material and its pore structure (Ma et al., 2017). Those studies are valuable in engineering from the perspective of understanding the effects of material granularity and additives on pore structure. However, there still exists three problems that need to be further explored with respect to the microstructure of CPB: 1) how to determine the relationship between the microstructure and mechanical properties quantitatively; 2) the coupling effects of tailings cement ratio (T/C ratio) and curing time on the development process of pore structure; and 3) the relationship between the failure mechanism and the pore structure in CPB.
The objective of this paper was to assess the coupling effect of tailings cement ratio and curing time on microstructural parameters (such as average pore area, T2 spectrum area etc.) and UCS of CPB specimens, which were prepared with different tailings cement ratios. Therefore, a series of tests including SEM test, NMR test, and UCS test have been performed, then the relationship between the pore structure parameters of CPB and the UCS was investigated. Finally, the effects of different pore sizes on the failure process in CPB was discussed. The results of this study could provide a reference for the pore characteristics investigation of CPB and accelerate the application of CPB in the future.
The tailings utilized in this study were obtained from Xianglushan tungstic mine, located in Jiangxi Province of China. The particle size distribution (PSD) of tailings is shown in Figure 1, and the related physical characteristics of tailings are summarized in Table 1. Figure 1 indicates that the d10, d50, d60 were 11.8, 105, and 134.1 μm, respectively, while the non-uniformity coefficient (d60/d10) was 11.36. The main chemical compositions of tailings are presented in Table 2. The binder used was P.O 32.5 Portland cement based on Chinaʼs Common Portland Cement Standard (No. GB175-2007), and its main chemical compositions are summarized in Table 3. The water used for CPB preparation was tap water (Liu L et al., 2018).
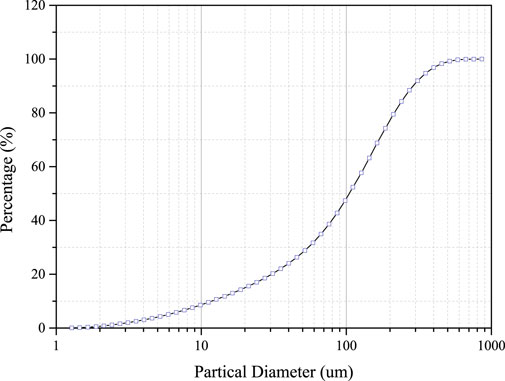
FIGURE 1. The particle size distribution of tailings.

TABLE 1. Physical characteristics of tailings.

TABLE 2. Chemical composition of tailings used (units of wt%).

TABLE 3. Chemical composition of Portland cement used (units of wt%).
Because the solid concentration of 72 wt% can ensure the liquidity requirement during CPB transportation, three kinds of CPB specimens with the solid concentration of 72 wt%, and T/C ratios of 4, 6, and 10 were prepared, respectively, (Koohestani and Belem, 2017; Qi et al., 2018a). The mine tailings, cement, and tap water were mixed with a mortar mixer. The CPB slurry was stirred evenly in cylindrical bottom-drained column moulds (∅50 mm × 100 mm). After a rest period, CPB specimens were placed into a curing box at a temperature of 20 ± 1°C and a relative humidity of 95 ± 1% (Yin et al., 2018). Then the specimens, cured for 3, 7, 14, and 28 days, were evaluated by SEM test, NMR test, and UCS test, respectively. In this paper, all experiments were performed at room temperature in accordance with the related test manuals and literatures, specific methods are descripted as follows.
The MacroMR12-150I test system (Suzhou Niumag Analytical Instrument) was performed for NMR test, as shown in Figure 2. The prepared CPB specimens were covered with a layer of Polytetrafluoroethylene (PTFE) to avoid moisture loss before the NMR test. The NMR tests involve two sequential steps, i.e., excitation status and reception status. Excitation status is used to excite the signals of CPB specimens, while reception status is to convert analog signals to digital signals. According to the operational procedures, each CPB specimen (ф 50 mm × 100 mm) was tested three times, the specific test method can be found in a previous study (Liu C et al., 2018). Finally the distributions of pores size in CPB could be examined through the T2 spectra analysis.
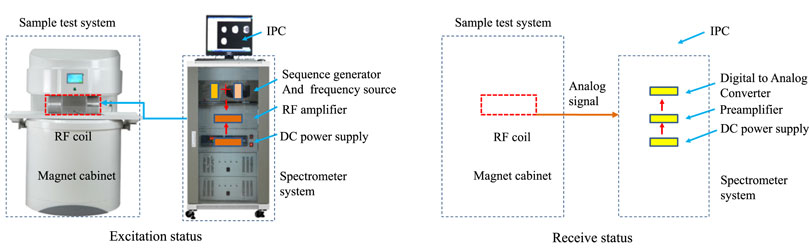
FIGURE 2. NMR test system (Liu L et al., 2018).
After the NMR test, CPB specimens were covered with a layer of Polytetrafluoroethylene (PTFE) again and sent to the UCS laboratory immediately. The UCS measurements were performed on CPB specimens (50 mm × 100 mm) using an electrohydraulic servo universal testing machine (MTS C43.504, MTS Systems Corporation, United States) to investigate the relationship between the UCS and pore size in CPB specimens. The UCS tests were conducted with a constant displacement-speed of 1 mm/min. For each experimental scenario, three identical specimens were tested and their average UCS values were recorded for further analysis.
After the aforementioned UCS test, the samples of SEM test were obtained from the central part of each CPB specimen. The specimens were coated with a layer of metal conductive film in a vacuum coating machine, and then were scanned with a JSM-6460LV scanning electron microscope produced by Nippon Electronics Company (JEOL). To avoid the human error, we conducted three times on each specimen. After that, the SEM images were quantitatively analyzed using the software of Particles (Pores) and Cracks Analysis System (PCAS) to evaluate the micro-parameters such as apparent porosity ratio, average pore area etc. For the former, it is a ratio of the pore area to the total specimen area in SEM test. And it is a two-dimensional parameter, which could indirectly indicate the pore variation trend in CPB (Koohestani and Belem, 2017). For the latter, it is a parameter which depends on the average pore length and average pore width. It could indicate the average size of pores and reflect the pore size variation in CPB specimens (Koohestani and Belem, 2017).
The variation tendency of the pore structure in CPB during its curing period can be observed directly by SEM image, as shown in Figure 3. At the same curing time, the pore structure in CPB gradually became worse with the increased tailing/cement ratio (T/C ratio), due to more and more generated pores (especially macro-pores) and ettringite (AFt). Because hydration productions at an early curing time (such as 3 days) were less and could not fully fill the pore structure (Chen et al., 2021). Therefore, we can clearly see that there were a large amount of needle-like ettringites and pores with different sizes. When the curing period was 14 days, on the one hand, more and more C-S-H and needle-like ettringites were produced by cement hydration. On the other hand, macro-pores were unceasingly filled by those stuffs and subsequently became the pores with smaller size. Therefore, internal microstructure integrity of CPB specimens gradually became higher than before.
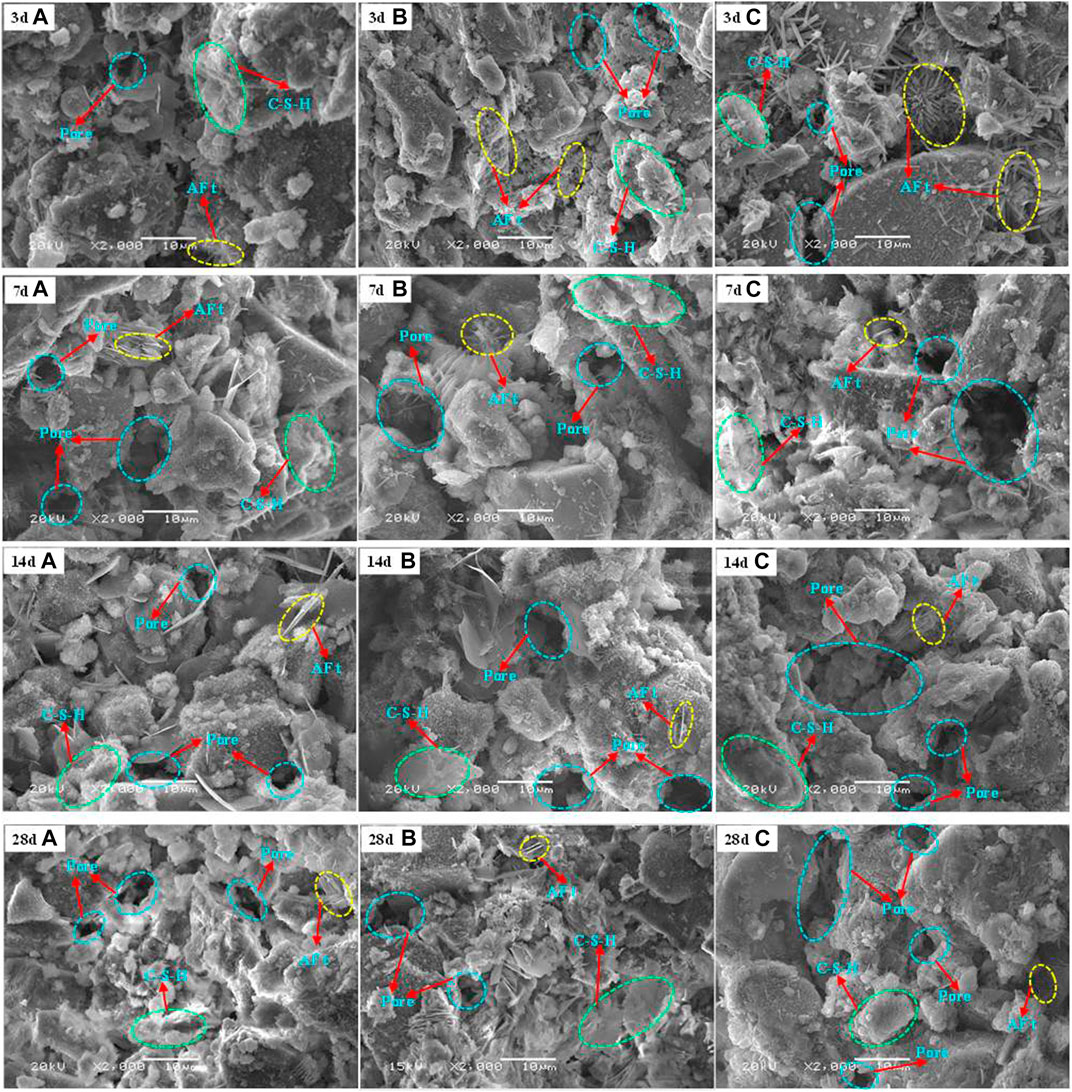
FIGURE 3. CPB microstructures obtained by SEM test.
However, the hydration process in CPB specimens gradually slows down as curing time increased. such as with a curing time of 28 days. In this case, the larger pore cannot be further filled by hydration productions, therefore the change of pore structure in CPB gradually became stabilized, finally formed the unique pore characteristics of CPB. Under this circumstance, the coupling effect of curing time and T/C ratio seems to be negligible. Meanwhile, it manifested that the UCS decreased with the increase of T/C ratio due to less hydration products.
Figure 4 shows the relationships among apparent porosity ratio and average pore area of CPB and curing time. As shown in Figure 4, as curing time increased, the apparent porosity ratio of CPB with T/C ratios of 4, 6 and 10, decreased from 4.04 (3 days) to 2.03 (28 days), from 4.87 (3 days) to 2.18 (28 days), from 6.6 (3 days) to 3.4 (28 days), respectively. The micro-structural integrity in CPB approximately increased by 51.86%, due to the pore structure in CPB improved by curing time, although the initial T/C ratio is different. Meanwhile, the average pore area had a nearly inverse proportional relation to the curing time. As curing time increased, the average pore area decreased from 342.26 (3 days), 424.79 (3 days), and 549.33 (3 days) to 195.63 (28 days), 266.12 (28 days), and 299.38 (28 days), respectively. The micro-structural integrity in CPB increased by about 41.43%. The results indicated that the apparent porosity ratio is highly correlated with the average pore area, both of them could illustrate the development of pore structure characteristics in CPB.
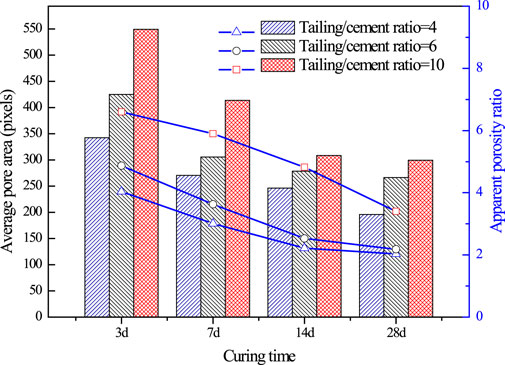
FIGURE 4. Relationships among apparent porosity ratio, average pore area, and curing time.
Due to the defects of SEM sampling, in this section we used T2 spectrum area, porosity (NMR) as parameters to quantitatively investigate the pore structure characteristics in CPB. Generally, the NMR relaxation time and T2 spectrum area were proportional to the liquid content of the rock (Zhang and Xiao., 2006). To be specific, a shorter relaxation time (T2) indicates a smaller pore size. Thus the area of zone enclosed by the T2 spectrum amplitude and x-axis indicates the porosity (NMR) of CPB. Furthermore, the pore size distribution in CPB could be obtained by the conversion of T2 spectrum distribution as well.
Table 4 shows the results of T2 spectrum of CPB. If the T/C ratio was set to be a certain value (4, 6, and 10), as the curing time increased, the spectrum area decreased. The same goes for the porosity (NMR). To be specific, the porosity (NMR) of CPB with T/C ratios of 4, 6, and 10 decreased from 11.75 (3 days), 18.65 (3 days), and 12.94 (3 days) to 2.45 (28 days), 3.57 (28 days), and 4.46 (28 days), respectively. The micro-structural integrity in CPB approximately increased by 80.86%. There seems to be a negative correlation between the integrity in CPB and the parameters, such as T2 spectrum area, and porosity (NMR). It is also negatively correlated with UCS. Although the integrity values obtained by different analysis methods were obviously different, both SEM and NMR analyses demonstrated that the internal pore structure of CPB became much better as the curing time increased.
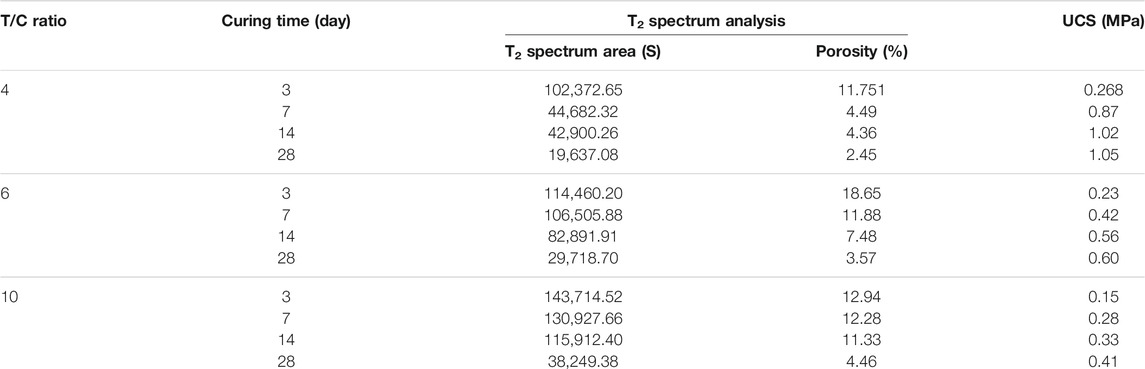
TABLE 4. The NMR spectrum area.
As aforementioned, pore structure characteristics in CPB have a close relationship with the hydration process. However, the pore structure in CPB would become stabilized to form its own unique pore characteristics as the curing period increased. The reason is that the cement hydration process gradually slows down, and even stops. Therefore, in this section, the pore size in CPB was divided into four types according to the related literature (Yang et al., 2010), including gel pores (pore size <10 nm), transition pores (pore size = 10–100 nm), capillary pores (pore size = 100–1,000 nm), and macro-pores (pore size > 1,000 nm), as shown in Table 5.
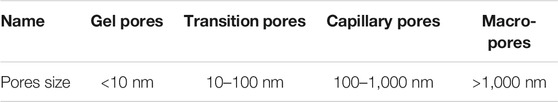
TABLE 5. Pores size partition in CPB (Yang et al., 2010).
In this section, CPB specimens with a T/C ratio of 4 were taken as an example to study the effect of curing time on the development of pore size in CPB. Figure 5 shows the proportion of different pore sizes in CPB during the curing period. As shown in Figure 5, as the curing time increased, the gel pore (<10 nm) increased, while the transition pores (10–100 nm) decreased. To be specific, the volume percentage of gel pores gradually increased from 2.65% (3 days) and 4.75% (7 days) to 46.37% (14 days) and 48.96% (28 days), while the transition pores decreased from 89.73% (3 days) and 92.16% (7 days) to 44.75% (14 days) and 43.14% (28 days), respectively. It is interesting that these two kinds of pores seem to maintain a dynamic balance. However, the volume percentage of capillary pores (100–1,000 nm) keeps a stable level (about 9.46%) while the macro-pores are negligible (about 0.05%) during the whole curing period. This means that the hydration products continuously increase with the curing time, but it just has a significant influence on the pore size of 10–100 nm. The effect of the hydration products has little impact on the pore sizes above 1,000 nm, which have a good agreement with the results of SEM analysis.
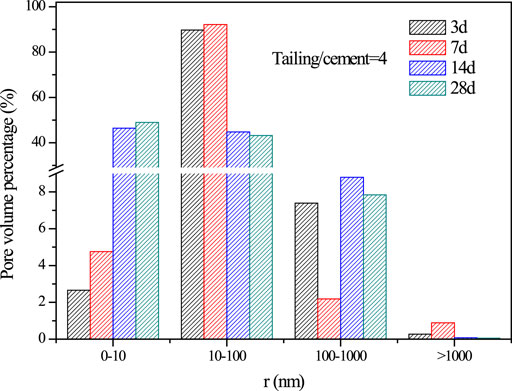
FIGURE 5. The percentage distribution of pores with different size in CPB.
As shown in Figure 5, when the curing time is 3 days, the percentage of different pores in CPB exhibits a similar normal distribution. To be more specific, the peak of the curve is the most probable pore size (10–100 nm), namely the pore size with the largest proportion in CPB, the pore size between 0 and 10 nm and that between 100 and 1,000 nm located on the two sides of the peak, respectively. As the curing time increased, these four kinds of pore sizes in CPB keep the similar normal distribution, the pore sizes below 10 nm and above 100 nm distributed at the two sides all the time, while the pore size within 10–100 nm always occupies the peak of the curve.As the curing time increased, the peak shifted left due to the pore size in CPB decreased, meanwhile the peak reduced because the percentage of different pores distributed more concentrated. Generally, the dominant pore size has an important influence on material characteristics (Yaohua et al., 2018), therefore the effect of the dominant pore size on the mechanical property of CPB will be discussed in The Effect of Pore Size on Failure Process of CPB.
Figure 6A shows the NMR T2 spectrum of CPB specimens with different T/C ratios, the corresponding pore volume percentage in CPB is shown in Figure 6B, in which there were two distinct peaks on T2 spectrum when the curing time is 3 days or 7 days. Generally, the area of the first peak was about 76.105–99.701% of the total area of T2 spectrum, while the second peak was about 0.299–23.340% of the total area. However, we found a third peak and a fourth peak when the curing periods were 14 and 28 days, respectively. The third peak or the fourth peak areas are very small, accounted for only 0.1% of the total area. This means that local pore size in CPB increased unexpectedly due to the coupling influence of C/T ratio and curing time.
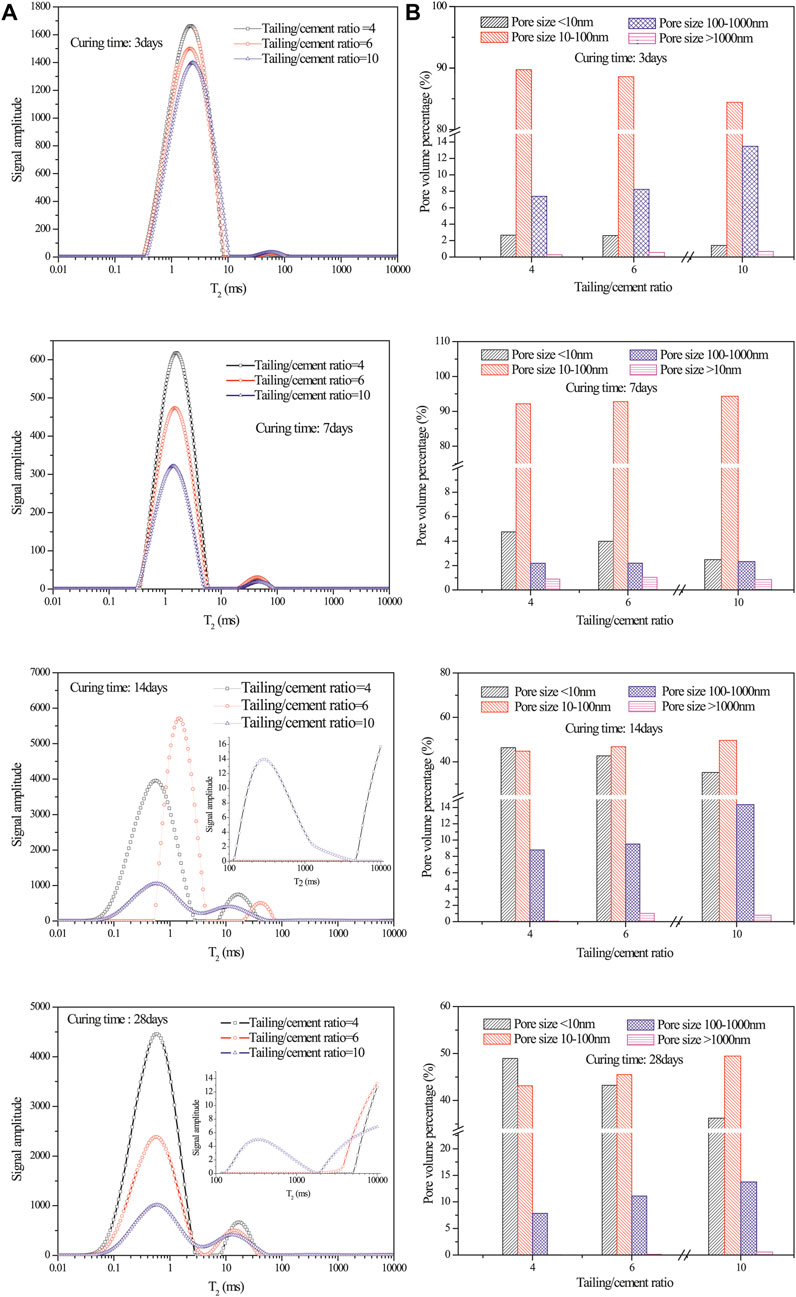
FIGURE 6. The pore size distribution of CPB specimens at different curing time; (A) NMR T2 spectrum of CPB specimens; (B) Pore volume percentage in CPB.
Figure 6B shows that when the curing time was 3 days, the volume percentage of pores between 10 and 100 nm decreased continuously with the increase of T/C ratio, while the pore size between 100 and 1,000 nm increased. The macro-pores (pore size >1,000 nm) were very few, but it exhibited an uptrend. When the curing time increase to 7, 14 or 28 days, the volume percentages of pore size between 10–100 nm and 100–1,000 nm increased continuously with the increased T/C ratio, while pore size (<10 nm) decreased gradually. This means that with the increase of T/C ratio, the cement content in CPB descended. As a result, the hydration products were too few to fully fill the pores with large size, which is in good agreement with the aforementioned analysis.
In this section, CPB with a curing time of 28 days and a T/C ratio of 4 was taken as an example to evaluate the effect of pore size on the failure process of CPB. Meanwhile, because of the development characteristic of pore structure in CPB, the most probable pore size was used to study the effect of pore size on the failure process of CPB.
Figure 7 shows the failure mode of CPB after UCS test. As shown in Figure 7, the failure mechanism of CPB was mainly shear failure due to the main fracture through the shear slip surface. According to the mesomechanics theories and related literatures (Luo et al., 2000; Gregerová and Všianský, 2009), the failure essence of CPB is the results of micro-damage as well as the accumulation and development of micro-fracture. Generally, during the UCS test, pores with pore size within 10–100 nm (as the most probable pore size) were compacted to be micro-crack due to the gradual increase of the load. Then, the micro-fracture will not disappear but extend to form the main cracks together with the nearby micro-crack, when the higher load further added, finally resulted in the main failure surface throughout CPB. As for macro-pores, which accounted for only 0.05% of the total pores, just leaded to the partial peeling-off of CPB rather than the generation of the main crack section, as shown in Figure 7. Therefore, it is significantly important to make an investigation and control on the most probable pores size (the dominant pore sizes) for predicting the failure mechanism of CPB.
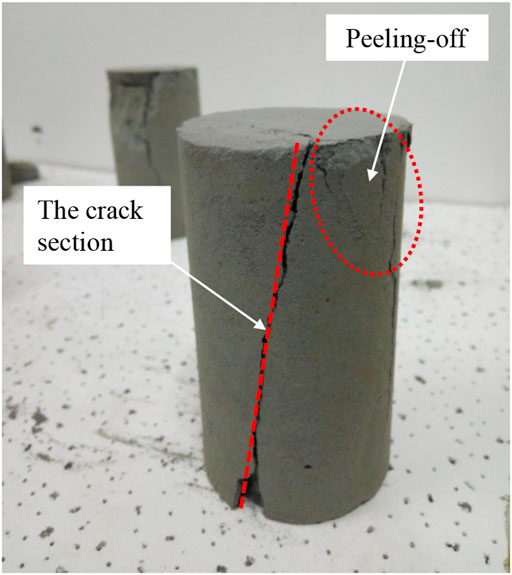
FIGURE 7. The failure mode of the CPB after UCS.
In this study, the development process of the pore structure in cemented paste backfill was systematically investigated using NMR test and SEM test. The coupling effect of curing time and T/C ratio on the pore size and failure mechanism of CPB was presented. The following conclusions could be drawn from the current study.
a. Pore structure in CPB could be represented by the average pore area, apparent porosity ratio, porosity (NMR), and T2 spectrum area, which are negatively correlated with UCS.
b. As the curing time increased, the amount of pores below 10 nm descended, while those between 10 and 100 nm increased. During the initial development stage of CPB pores (3 days or 7 days), almost 90% of the total pores were transition pores (10–100 nm). In the second development stage of CPB pores (14 days or 28 days), the dominant contents were gel pores (<10 nm) and transition pores (10–100 nm), occupying up to about 40% of the total pores, respectively.
c. A similar normal distribution was observed from the volume percentages of the four kinds of pore structure in CPB. As the curing time increased, the peak of pore size distribution curve shifted left, and the peak value decreased, which means that the pore size in CPB decreased and was distributed to be highly concentrated.
d. Pores larger than 1,000 nm have little effect on uniaxial compressive strength. The failure mode of CPB was mainly shear, which was significantly affected by pores between 10 and 100 nm. To be more specific, the extension of the most probable pore size led to the cross-connection of pores and resulted in the main failure surface in CPB.
e. Research and control of the most probable pore size is of great significance in predicting the macro-crack generation in CPB during the UCS test. Three-dimensional testing methods (like CT) in the future studies should be adopted to rebuild the complete pore structure in CPB, as well as to monitor the pore extension process in real time during the UCS test, which can significantly accelerate the application of CPB in the future.
The original contributions presented in the study are included in the article/supplementary material, further inquiries can be directed to the corresponding author.
LL contributed to the conception of the study; CZ performed the experiment; CH, MW contributed significantly to analysis and manuscript preparation; YZ, XZ performed the data analyses and wrote the manuscript; BZ helped perform the analysis with constructive discussions. All authors agree to be accountable for the content of the work.
This research was supported by the National Natural Science Foundation of China (No. 52004207, 51504182, 51674188, 51404191, 51405381), the Natural Science Basic Research Plan of Shaanxi Province of China (No. 2015JQ5187), the Scientific Research Program funded by the Shaanxi Provincial Education Department (No. 15JK1466), the Project funded by China Postdoctoral Science Foundation (No. 2015M582685), and Outstanding Youth Science Fund of Xi’an University of Science and Technology (No. 2018YQ2-01). This research was also supported by the National Research Council of Science andTechnology (NST) grant by the Korea government (MSIP) (No. CRC-16- 38502-KICT).
The authors declare that the research was conducted in the absence of any commercial or financial relationships that could be construed as a potential conflict of interest.
We would like to express our gratitude to Huafu Qiu and Dongzhuang Hou for their assistance.
Benzaazoua, M., Belem, T., and Bussière, B. (2002). Chemical Factors that Influence the Performance of Mine Sulphidic Paste Backfill. Cement Concrete Res. 32, 1133–1144. doi:10.1016/s0008-8846(02)00752-4
Cao, S., Yilmaz, E., Song, W., and Xue, G. (2019). Assessment of Acoustic Emission and Triaxial Mechanical Properties of Rock-Cemented Tailings Matrix Composites. Adv. Mater. Sci. Eng. 2019, 1–12. doi:10.1155/2019/6742392
Chen, Q.-s., Zhang, Q.-l., Fourie, A., Chen, X., and Qi, C.-c. (2017). Experimental Investigation on the Strength Characteristics of Cement Paste Backfill in a Similar Stope Model and its Mechanism. Construction Building Mater. 154, 34–43. doi:10.1016/j.conbuildmat.2017.07.142
Chen, Q., Zhang, Q., Qi, C., Fourie, A., and Xiao, C. (2018). Recycling Phosphogypsum and Construction Demolition Waste for Cemented Paste Backfill and its Environmental Impact. J. Clean. Prod. 186, 418–429. doi:10.1016/j.jclepro.2018.03.131
Chen, S., Wu, A., Wang, Y., and Wang, W. (2021). Coupled Effects of Curing Stress and Curing Temperature on Mechanical and Physical Properties of Cemented Paste Backfill. Construction Building Mater. 273, 121746. doi:10.1016/j.conbuildmat.2020.121746
Cihangir, F., Ercikdi, B., Kesimal, A., Turan, A., and Deveci, H. (2012). Utilisation of Alkali-Activated Blast Furnace Slag in Paste Backfill of High-Sulphide Mill Tailings: Effect of Binder Type and Dosage. Minerals Eng. 30, 33–43. doi:10.1016/j.mineng.2012.01.009
Gregerová, M., and Všianský, D. (2009). Identification of concrete Deteriorating Minerals by Polarizing and Scanning Electron Microscopy. Mater. Characterization 60 (7), 680–685. doi:10.1016/j.matchar.2009.01.018
Hu, R. L., Yue, Z. Q., Wang, L. C., and Wang, S. J. (2004). Review on Current Status and Challenging Issues of Land Subsidence in China. Eng. Geology. 76 (1-2), 65–77. doi:10.1016/j.enggeo.2004.06.006
Huang, Z., Yilmaz, E., and Cao, S. (2021). Analysis of Strength and Microstructural Characteristics of Mine Backfills Containing Fly Ash and Desulfurized Gypsum. Minerals 11 (4), 409. doi:10.3390/min11040409
Ji, Y., Sun, Z., Jiang, X., Liu, Y., Shui, L., and Chen, C. (2017). Fractal Characterization on Pore Structure and Analysis of Fluidity and Bleeding of Fresh Cement Paste Based on 1H Low-Field NMR. Construction Building Mater. 140, 445–453. doi:10.1016/j.conbuildmat.2017.02.151
Jiang, H., Fall, M., Yilmaz, E., Li, Y., and Yang, L. (2020). Effect of mineral Admixtures on Flow Properties of Fresh Cemented Paste Backfill: Assessment of Time Dependency and Thixotropy. Powder Tech. 372, 258–266. doi:10.1016/j.powtec.2020.06.009
Koohestani, B., and Belem, A. K. (2017). Influence of Polymer Powder on Properties of Cemented Paste Backfill. Amsterdam, Netherlands: International Journal of Mineral Processing.
Liu, L., Xin, J., Huan, C., Zhao, Y. J., Fan, X., Guo, L. J, et al. (2021). Effect of Curing Time on the Mesoscopic Parameters of Cemented Paste Backfill Simulated Using the Particle Flow Code Technique. Int. J. Minerals 28, 590–602. doi:10.1007/s12613-020-2007-2
Li, X., Wang, B., You, J., Yang, H., Hou, Y., Xie, L., et al. (2016). Study on Mechanical Properties and Microstructure of the Cemented Tailings Backfill. China Mining Mag. 25 (6), 169–172. (In Chinese). doi:10.3969/j.issn.1004-4051.2016.06.038
Liu, C., Liu, G., Liu, Z., Yang, L., Zhang, M., and Zhang, Y. (2018). Numerical Simulation of the Effect of Cement Particle Shapes on Capillary Pore Structures in Hardened Cement Pastes. Construction Building Mater. 173, 615–628. doi:10.1016/j.conbuildmat.2018.04.039
Liu, C., Shi, B., Zhou, J., and Tang, C. (2011). Quantification and Characterization of Microporosity by Image Processing, Geometric Measurement and Statistical Methods: Application on SEM Images of clay Materials. Appl. Clay Sci. 54 (1), 97–106. doi:10.1016/j.clay.2011.07.022
Liu, L., Fang, Z., Qi, C., Zhang, B., Guo, L., and Song, K.-I. (2018). Experimental Investigation on the Relationship between Pore Characteristics and Unconfined Compressive Strength of Cemented Paste Backfill. Construction Building Mater. 179 (aug.10), 254–264. doi:10.1016/j.conbuildmat.2018.05.224
Liu, L., Zhou, P., Feng, Y., Zhang, B., and Song, K.-i. (2020). Quantitative Investigation on Micro-parameters of Cemented Paste Backfill and its Sensitivity Analysis. J. Cent. South. Univ. 27 (001), 267–276. doi:10.1007/s11771-020-4294-1
Liu, Q., Liu, D., Tian, Y., and Liu, X. (2017). Numerical Simulation of Stress-Strain Behaviour of Cemented Paste Backfill in Triaxial Compression. Eng. Geology. 231, 165–175. doi:10.1016/j.enggeo.2017.10.021
Lu, H., Qi, C., Chen, Q., Gan, D., Xue, Z., and Hu, Y. (2018). A New Procedure for Recycling Waste Tailings as Cemented Paste Backfill to Underground Stopes and Open Pits. J. Clean. Prod. 188 (JUL.1), 601–612. doi:10.1016/j.jclepro.2018.04.041
Luo, X., Sun, W., and Chan, S. Y. N. (2000). Effect of Heating and Cooling Regimes on Residual Strength and Microstructure of normal Strength and High-Performance concrete. Cement Concrete Res. 30, 379–383. doi:10.1016/s0008-8846(99)00264-1
Ma, X., Liu, J., Wu, Z., and Shi, C. (2017). Effects of SAP on the Properties and Pore Structure of High Performance Cement-Based Materials. Construction Building Mater. 131, 476–484. doi:10.1016/j.conbuildmat.2016.11.090
Qi, C., Fourie, A., Du, X., and Tang, X. (2018b). Prediction of Open Stope Hangingwall Stability Using Random Forests. Nat. Hazards 92 (2), 1179–1197. doi:10.1007/s11069-018-3246-7
Qi, C., Chen, Q., Fourie, A., Zhao, J., and Zhang, Q. (2018c). Pressure Drop in Pipe Flow of Cemented Paste Backfill: Experimental and Modeling Study. Powder Tech. 333, 9–18. doi:10.1016/j.powtec.2018.03.070
Qi, C., Fourie, A., and Chen, Q. (2018a). Neural Network and Particle Swarm Optimization for Predicting the Unconfined Compressive Strength of Cemented Paste Backfill. Construction Building Mater. 159, 473–478. doi:10.1016/j.conbuildmat.2017.11.006
Wang, Y., Yuan, Q., Deng, D., Ye, T., and Fang, L. (2017). Measuring the Pore Structure of Cement Asphalt Mortar by Nuclear Magnetic Resonance. Construction Building Mater. 137, 450–458. doi:10.1016/j.conbuildmat.2017.01.109
Wu, A., Wang, Y., Wang, H., Yin, S., and Miao, X. (2015). Coupled Effects of Cement Type and Water Quality on the Properties of Cemented Paste Backfill. Int. J. Mineral Process. 143, 65–71. doi:10.1016/j.minpro.2015.09.004
Xu, W., Pan, W., and Ding, M. (2015). Experiment on Evolution of Microstructures and Long-Term Strength Model of Cemented Backfill Mass. J. Cent. South Univ. 46, 2333–2341. (In Chinese). doi:10.11817/j.issn.1672-7207.2015.06.046
Yang, Y. H., Yue, L. I., and Xiu-Li, D. U. (2010). Study on Early Autogenous Shrinkage and Microcosmic Pore Distribution of Self-Compacting Concrete. J. Building Mater.
Yaohua, G., Hongyan, D., Puyang, Z., and Lei, Z. (2018). Pore Structure Characteristics of SAP concrete Based on Mercury Intrusion Test. J. Building Mater. 21 (1), 138–142. (In Chinese). doi:10.3969/j.issn.1007-9629.2018.01.022
Yilmaz, E., Belem, T., Benzaazoua, M., and Bussière, B. (2010). Assessment of the Modified CUAPS Apparatus to Estimate In Situ Properties of Cemented Paste Backfil. Geotechnical Test. J. 33 (5), 102689. doi:10.1520/gtj102689
Yilmaz, E., Belem, T., Benzaazoua, M., Kesimal, A., Ercikdi, B., and Cihangir, F. (2011b). Use of High-Density Paste Backfill for Safe Disposal of Copper_zinc Mine Tailings. Mineral. Resour. Manage. 27 (3), 81–94.
Yilmaz, E., Belem, T., Bussière, B., and Benzaazoua, M. (2011a). Relationships between Microstructural Properties and Compressive Strength of Consolidated and Unconsolidated Cemented Paste Backfills. Cement and Concrete Composites 33 (6), 702–715. doi:10.1016/j.cemconcomp.2011.03.013
Yin, S., Shao, Y., Wu, A., Wang, Y., and Chen, X. (2018). Expansion and Strength Properties of Cemented Backfill Using Sulphidic Mill Tailings. Construction Building Mater. 165, 138–148. doi:10.1016/j.conbuildmat.2018.01.005
Zhang, Y. Z., and Xiao, L. Z. (2006). Experimental Study of the NMR Characteristics in Rock under Uniaxial Load. Beijing, China: Nuclear Electronics & Detection Technology. (In Chinese) doi:10.1109/icct.2006.341981
Zhou, J., Deng, Y., Cao, Y., and Yan, J. (2014). Experimental Study of Microstructure of Hangzhou Saturated Soft Soil during Consolidation Process. J. Cent. South Univ. 45 (6), 1998–2005. (In Chinese).
Keywords: cemented paste backfill, pore structure characteristics, mechanical properties, integrity, damage process
Citation: Huan C, Zhu C, Liu L, Wang M, Zhao Y, Zhang B and Zhang X (2021) Pore Structure Characteristics and Its Effect on Mechanical Performance of Cemented Paste Backfill. Front. Mater. 8:700917. doi: 10.3389/fmats.2021.700917
Received: 27 April 2021; Accepted: 09 June 2021;
Published: 19 July 2021.
Edited by:
Tingting Zhang, Dalian University of Technology, ChinaReviewed by:
Erol Yilmaz, Recep Tayyip Erdoğan University, TurkeyCopyright © 2021 Huan, Zhu, Liu, Wang, Zhao, Zhang and Zhang. This is an open-access article distributed under the terms of the Creative Commons Attribution License (CC BY). The use, distribution or reproduction in other forums is permitted, provided the original author(s) and the copyright owner(s) are credited and that the original publication in this journal is cited, in accordance with accepted academic practice. No use, distribution or reproduction is permitted which does not comply with these terms.
*Correspondence: Chao Zhu, emN4eDUyMUAxMjYuY29t
Disclaimer: All claims expressed in this article are solely those of the authors and do not necessarily represent those of their affiliated organizations, or those of the publisher, the editors and the reviewers. Any product that may be evaluated in this article or claim that may be made by its manufacturer is not guaranteed or endorsed by the publisher.
Research integrity at Frontiers
Learn more about the work of our research integrity team to safeguard the quality of each article we publish.