- College of Civil Engineering and Architecture, Guilin University of Technology, Guilin, China
Due to the different material composition and deposition conditions, the undisturbed clay presents different degree of structure. Because of the existence of structure, the undisturbed clay has structural yield stress. When the stress level exceeds the structural yield stress, the stress-strain relation of undisturbed clay has typical softening characteristics. To explore the constitutive relation of undisturbed soil, triaxial consolidation, and drainage tests were carried out on undisturbed and remolded soils of structural clay in Zhanjiang Formation in China, and the stress-strain relations under different confining pressures were obtained. By analyzing the structural failure process of undisturbed clay, Weibull distribution was introduced to describe the strength distribution of each point in undisturbed clay, and the structural failure coefficient of undisturbed clay was established during the loading process. Based on the elastic theory and structural failure coefficient, a constitutive model considering the structural failure of clay was proposed, and the method to determine the model parameters was given. The model was used to simulate the experimental data in this paper and the reference, and the validity of the model was verified. The results show that the model can well simulate the softening effect of structural clay during loading.
Introduction
Since Roscoe et al. (1958; 1963; 1968) proposed the Cam-clay model, the constitutive theory of remolded soil has entered a new stage of development, and relatively satisfactory results have been achieved in the study of the constitutive relation of remolded soil. Cam-clay model, Lade-Duncan model, and Duncan-Chang model have been widely used in theoretical research and engineering practice of remolded soil (Lade and Duncan, 1975; Lade, 1977; Yu et al., 2014; Liu et al., 2018; Bryant and Sun, 2019; Liu et al., 2019). However, undisturbed clay is usually structural (Gong et al., 2000). The structure of clay refers to the arrangement of soil particles or aggregates in space and their interconnection, which is an important factor to determine the physical and mechanical properties of soil. The structure of undisturbed clay causes structural yield stress (Chen et al., 2008; Shen and Wang, 2009; Sun and Chen, 2011; Yin et al., 2013; Zeng et al., 2014). When the stress level is less than the structural yield stress, the mechanical properties of clay are good. When the stress level exceeds the yield stress of the structure, the mechanical properties of clay gradually deteriorate, and its stress-strain relation has a typical softening characteristic, which leads to a great difference between the mechanical properties of undisturbed soil and remolded soil (Deng and Songyu, 2007; Kong et al., 2011, 2015; Chen and Liu, 2019). Therefore, the constitutive model of undisturbed clay should consider the influence of structure to describe the strain softening effect.
To quantitatively describe the influence of structure on the stress-strain relation of clay, many scholars have proposed different constitutive models of structural clay. The constitutive model of structural clay is usually constructed in the following ways: 1) The constitutive model of remolded clay was improved by introducing structural parameters. Li et al. (2015), Zhang et al. (2019) introduced structural parameters on the basis of the Cam-clay model and extended the Cam-clay model to the category of considering the structural influence of soil. Since the strain softening phenomenon of overconsolidated soil in the shear process is similar to that of structural clay, Zhu and Wang, (2019), Enyang et al. (2019) extended the unified hardening model (UH) of overconsolidated soil to a constitutive model considering the structure of soil. 2) The mechanical behavior of structural clay is described by means of mechanics of solid materials, such as damage mechanics and disturbed state theory. Shen et al. (2019), Chu et al. (2019) used the damage theory to explain the failure process of the internal structure of structural clay, obtained the damage coefficient of soil, and established the damage constitutive model of structural clay. Liu et al. (2017), Ouria (2017) explained the internal structural adjustment process of structured soil based on the disturbed state theory, and then proposed a constitutive model of structured soil. 3) Through the test, the parameters that can reflect the structural changes of soil are obtained, thus establishing the relation between the structural parameters and the physical and mechanical parameters. Huang et al. (2020) established the relation between deformation modulus and confining pressure of undisturbed red clay through triaxial tests, and then obtained the constitutive model of undisturbed red clay. The above research methods and results promote the development of structural clay research and provide ideas and basis for the theoretical research of structural clay. However, these studies believe that the strength of the soil whose structure has been destructed is zero, without considering the residual strength of the soil after the structural destruction, which is not consistent with the actual situation.
The structure of soil has great influence on engineering practice. Engineering problems such as the stability of slope and foundation pit (Park and Kutter, 2015; Hu et al., 2019; Lu et al., 2021), the bearing capacity of foundation (Fateh et al., 2017), the settlement and deformation of foundation (Meng et al., 2018) are closely related to the structure of soil. In engineering practice, ignoring the influence of the structure of soil may cause serious consequences (Cheng et al., 2020). Structural clay of Zhanjiang Formation is widely distributed in Leizhou Peninsula, China, and is characterized by strong structure (Shen et al., 2013), high plasticity (Zhang et al., 2014), micro-permeability (Zhang et al., 2012), strong acidity (Zhang et al., 2017), creep (Kong et al., 2012), thixotropy (Zhang X. W. et al., 2017), etc. It is a very unusual special soil, resulting in its rare engineering characteristics. In this paper, through triaxial consolidation and drainage tests on undisturbed and remolded soils of structural clay in Zhanjiang Formation, the variation law of mechanical properties during loading process was explored, and a constitutive model considering the residual strength and reflecting the strain softening effect of structural clay was proposed, which provides a reference for theoretical research on structural clay and solving practical engineering problems.
Triaxial Consolidation and Drainage Test
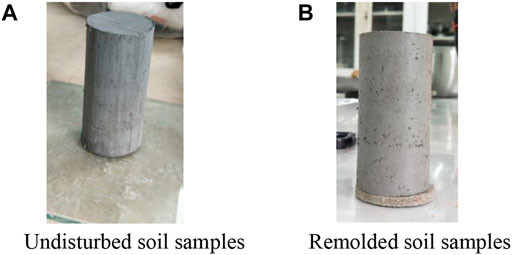
Through existing regional geological data and engineering geological surveys, typical strata are selected for investigation, drilling, and sampling. Undisturbed soil in Zhanjiang Formation clay was taken from baosteel zhanjiang iron and steel base in Donghai Island, Zhanjiang City, Guangdong Province, China. The depth for soil sampling is 40–43 m. Sampling was carried out by using a stainless steel open thin-walled sampler with an inner diameter of 100mm, a wall thickness of 2mm, a cutting edge angle of 60° and a length of 300 mm. The upper end of the sampler was connected with a drill stem by screws and was provided with an exhaust (drain) hole and a spherical valve, to release air and water pressure during sampling, prevent water from reentering, and maintain a vacuum above the soil sample during lifting. The natural moisture content of the soil sample is 40.13%, the natural density is 1.79 g/cm3, and the specific gravity of soil particles is 2.7. Consolidation and drainage triaxial tests were carried out on the undisturbed soil samples and remolded soil samples. The specifications of the samples were cylindrical samples with a diameter of 39.1 mm and a height of 80 mm. When preparing the undisturbed soil sample, the wire saw is used to cut a soil column slightly larger than the specified size and put it between the upper and lower disks of the soil cutting plate. The sample is carefully cut from top to bottom with the wire saw close to the edge column, and the disk is rotated while cutting until the diameter of the soil sample is cut to the specified diameter, then the upper and lower ends are cut according to the requirements of the sample height, as shown in Figure 1A. Clay was dried and crushed, and then a cylindrical remolded soil sample with a diameter of 39.1 mm and a height of 80 mm was prepared according to the density and moisture content of the undisturbed soil, as shown in Figure 1B. The sample preparation method shall refer to the relevant provisions of Article 19.3.1 of the “Standard for Geotechnical Test Methods” (GB/T50123-2019, China).
Put the prepared sample into the saturator, and put the saturator with the sample into an anhydrous pumping cylinder for vacuum pumping. When the vacuum degree is close to 1 atmosphere, continue pumping for 2 h, and then inject distilled water and keep the vacuum degree stable. When the saturator is completely submerged by water, stop pumping and release the vacuum of the pumping cylinder. The sample was left submerged for 10 h to reach saturation. The method of saturation shall refer to the relevant provisions in Article 19.3.2 of the “Standard for Geotechnical Test Methods” (GB/T50123-2019, China). The strain control triaxial instrument was used in the test. The effective consolidation confining pressures of the test were 100, 150, and 200 kPa respectively, and the loading rate was 0.003%/min. The test method shall refer to the relevant provisions in Article 19.6 of the “Standard for Geotechnical Test Methods” (GB/T50123-2019, China). The sample is loaded until the strain reaches 15%. At this time, the sample has produced a large deformation, which can be considered as the sample has been damaged. The failure pattern of undisturbed soil and remolded soil samples are shown in Figure 2. Through triaxial consolidation and drainage tests, the relation between shear stress
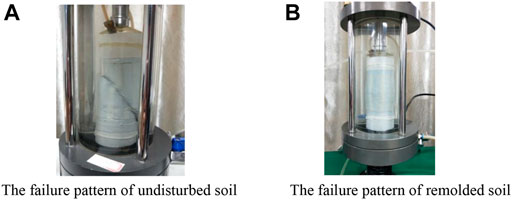
FIGURE 2. The failure patters of samples. (A) The failure pattern of undisturbed soil (B) The failure pattern of remolded soil.
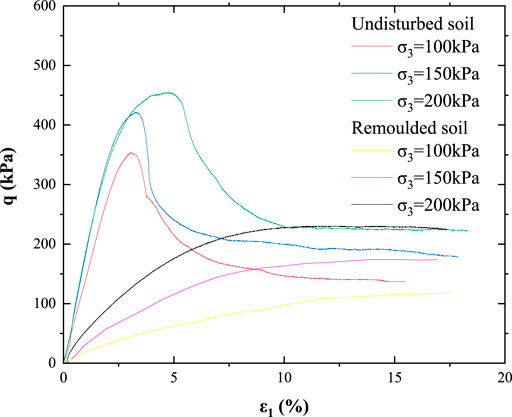
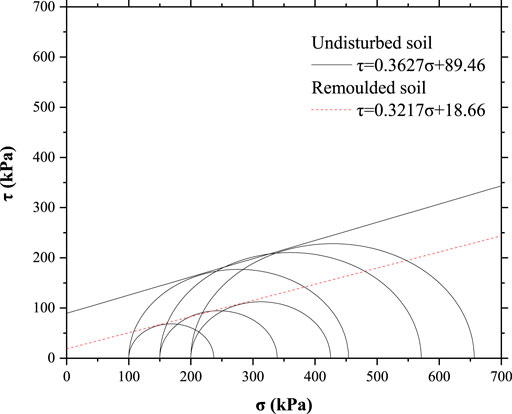
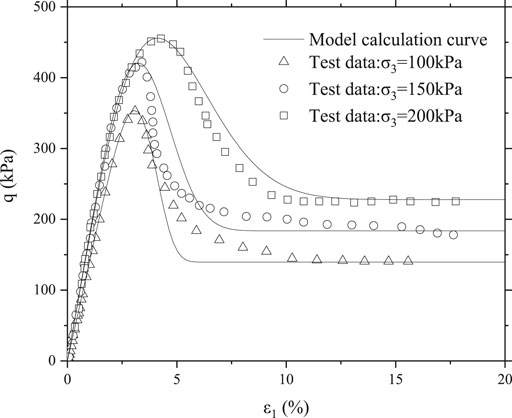
As can be seen from Figure 2, the upper and lower parts of the undisturbed soil sample slide relative to each other along the failure surface after a complete failure surface is generated, while the remolded soil sample does not have a failure surface in the loading process, but bulges gradually in the middle part. The failure patters of the two samples are significantly different. Due to the influence of structure, the stress of the undisturbed soil sample drops sharply after reaching the peak value, which makes the failure of the sample brittle, so there is an obvious failure surface. The stress of remolded soil gradually increases and tends to be stable during the loading process. The failure of the remolded soil is ductile failure, and the failure form is bulging in the middle. According to Figure 3, when the strain is less than 2.5%, the stress-strain curve of the undisturbed soil sample is close to a straight line. Under the condition of low strain, the internal structure of the soil is basically not damaged, so the deformation of the soil can be considered as elastic deformation. With the increase of strain, the growth of stress slows down gradually and reaches the peak value. At this stage, the internal structure of soil is gradually destructed, and the stress is adjusted self-adaptively and reaches the ultimate limit state. As the strain continues to grow, the internal structure of the soil will not be able to withstand the applied load, and each failure point will form a complete failure surface. At this time, the internal structure of the soil will fail and the stress will drop sharply. After the complete failure of the structure, the stress-strain curve of the undisturbed soil gradually approaches that of the remolded soil. To study the change of mechanical properties of the sample before and after structural failure, the stress corresponding to the peak stress and 15% strain of the undisturbed soil sample is the peak strength and residual strength of the undisturbed soil, as shown in Table 1. Mohr circle of stress corresponding to peak strength and residual strength of undisturbed soil was made according to the data in Table 1, as shown in Figure 5.
According to the equation of failure envelope in Figure 5, both cohesion and internal friction Angle decrease after the structure is destructed. The structure of soil can be reflected by Sensitivity, which is the ratio of peak strength to residual strength, and the strength is related to the confining pressure. When the confining pressure changes, the ratio of strength may change and is not unique. To describe the structure of soil, the ratio of cohesion corresponding to peak strength and residual strength, and the ratio of internal friction Angle corresponding to peak strength and residual strength are defined as the soil structure coefficient, namely:
Where:
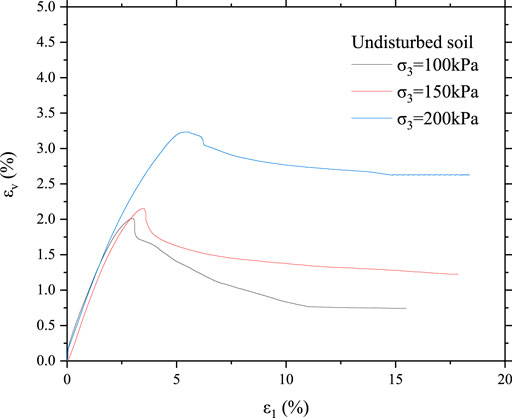
It can be seen from Figure 4 that, similar to the relation curve between shear stress and axial strain, the structure of the sample is basically not damaged at the initial stage of loading, and the relation curve between volumetric strain and axial strain of the undisturbed soil sample is approximately a straight line. When the axial strain continues to increase, the curve peaks, and then the volumetric strain gradually decreases. At this time, the internal structure of the sample is gradually damaged, and the particles may move and roll, which makes the sample have the tendency of dilatancy, so the volumetric strain gradually decreases. In the last stage of loading, the structure of the sample is completely destructed, forming a complete failure surface and sliding. At this time, it can be considered that the volume of the sample remains unchanged, and the volume strain tends to be stable.
Constitutive Model of Structural Clay
Structural Failure Coefficient
To quantitatively analyze the failure process of undamaged soil, several hypotheses are given: 1) The soil obeys Hooke’s law and has the property of linear elasticity without considering structural failure. The structure still has a certain residual strength after failure, which meets the Moor-Coulomb criterion. 2) The soil mass is divided into micro-elements, which are large enough to contain many microscopic pores and particles, but small enough to be considered as a particle in continuum mechanics. 3) The strength of undisturbed soil elements are different due to structural differences, and its strength distribution follows the Weibull distribution statistical law (Weibull, 1951; Cao et al., 1998; Wu et al., 2012; Wu et al., 2013). After structural failure, the structural influence is eliminated, and the strength of all elements is the same and in the ultimate state. The probability density function of Weibull distribution is:
Where:
Assuming that the total number of elements is
In the loading process, the elements with small structural strength are destructed first, and the strength after the destruction of the elements is the residual strength. With the increase of the load, the elements with different structural strength are destructed one after another. When the elements are formed into a plane, the whole soil will be destructed. In any load interval
Substituting Eq. 4 into Eq. 3, the structural failure coefficient
The damage amount of the material can be measured by strain
The value of the structural failure coefficient
Establishment of Constitutive Model
Under the condition of triaxial test, the total axial stress is
In the loading process, the undamaged elements are gradually transformed into the damaged elements. The decrease of the undamaged elements is equal to the increase of the damaged elements, and the sum of the two is a constant value. The stress adjustment distribution in the failure process can be expressed as (Cao et al., 2008):
The undamaged part satisfies Hooke’s law. For conventional triaxial tests, we get:
Where:
After the destruction of structure of each soil elements, the structural differences are eliminated, and the strength of the elements is determined by the friction between particles. For the same clay, the cohesion and internal friction Angle are the same, and the strength of each element is the same after the structural destruction. The destruction process of soil elements is transformed from the high ultimate stress state to the low ultimate stress state, so every element is in the ultimate state after the structure is destructed, which meets the Moor-Coulomb criterion. The cohesion and internal friction Angle after structural failure are
According to Eqs. 1, 11, the axial stress of the damaged element can be solved as follows:
Substituting Eqs. 6, 8, 10, 12 into Eq. 9, the relation between axial stress and axial strain can be obtained as follows:
The relation between shear stress and axial strain is:
Where:
(1) According to the characteristics of the stress-strain relation of structural clay, there are peak points in the stress-strain relation. At the peak strength, we get:
(2) It is assumed that the peak strength is
According to Eq. 14:
When
Take the logarithm of both sides of Eq. 18:
When
Let
The values of
According to Eq. 14, the parameters of the constitutive model established in this paper are E,
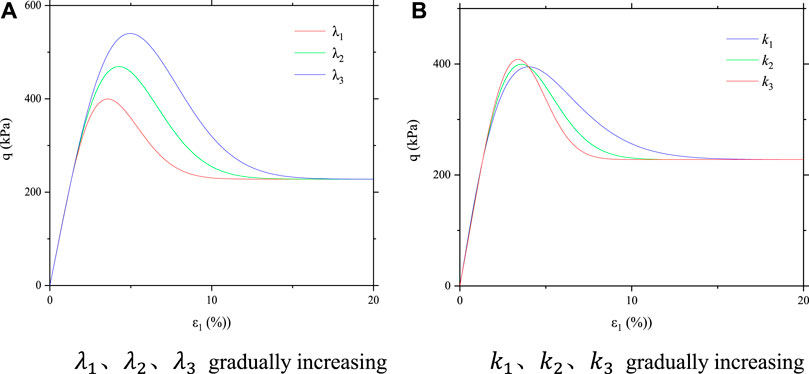
FIGURE 6. Curves of different
As can be seen from Figure 6, when
Model Validation
To verify the validity of the model, the model is used to simulate the experimental data in this paper. According to the above parameter determination method, parameters of each curve in the test in this paper can be obtained, as shown in Table 2.
By substituting the parameters in Table 2 into Eq. 14, the mathematical model of each curve in Figure 3 can be obtained as follows:
The calculated results of Eq. 23 are compared with the test data in Figure 3, as shown in Figure 7.
To further verify the rationality of the model, the model proposed in this paper is used to simulate the test data in references Meng et al., 2018 and Zhu and Xiao-qiang, 2018. The model parameters in references Meng et al., 2018 and Zhu and Xiao-qiang, 2018 are shown in Table 3 and 4.

TABLE 3. Model parameters in reference Meng et al., 2018.

TABLE 4. Model parameters in reference Zhu and Xiao-qiang, 2018.
By substituting the parameters in Table 3 into Eq. 14, the mathematical model of each curve in reference Meng et al., 2018 can be obtained as follows:
The calculated results of Eq. 24 were compared with the experimental data in reference Meng et al., 2018, as shown in Figure 8.
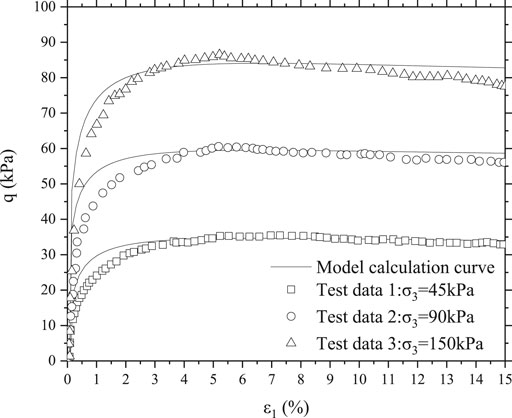
FIGURE 8. Comparison between model calculation curve and data in reference Meng et al., 2018.
By substituting the parameters in Table 4 into Eq. 14, the mathematical model of each curve in reference Zhu and Xiao-qiang, 2018 can be obtained as follows:
The calculated results of Eq. 25 were compared with the experimental data in reference Zhu and Xiao-qiang, 2018, as shown in Figure 9.
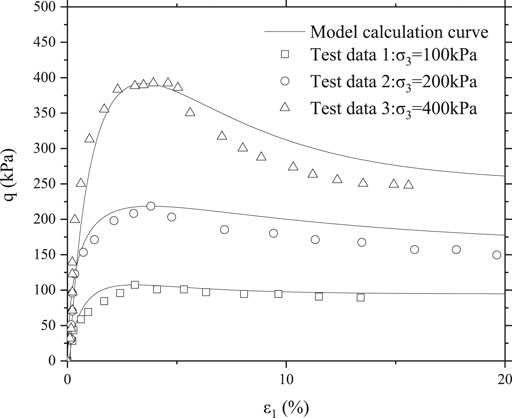
FIGURE 9. Comparison between model calculation curve and data in reference Zhu and Xiao-qiang, 2018.
It can be seen from Figures 7–9 that the calculated results of the model are in good agreement with the experimental results, and the model established in this paper can well reflect the strain softening effect of structural clay during loading.
Conclusion
In this paper, the stress-strain relation curves of the undisturbed and remolded soils of the structural clay of Zhanjiang Formation are obtained through triaxial tests. According to the test results, the failure law of structural clay during loading is analyzed, the failure coefficient of structural clay is established, and the constitutive model reflecting the strain softening effect of structural clay is proposed, and the calculation method of model parameters is given. The validity of the model is verified by the experimental data in this paper and literature.
(1) The ratio of cohesion and internal friction Angle of undisturbed soil at peak strength to cohesion and internal friction Angle of residual strength can reflect the size of soil structure. The smaller the ratio, the stronger the soil structure, and vice versa.
(2) The Weibull distribution was introduced to establish the structural failure coefficient of clay, and quantitatively describe the structural damage rule of structural clay during loading.
(3) Based on the structural failure coefficient and elastic theory, a constitutive model of structural clay is proposed. The model has few parameters and is easy to determine.
(4) The model can consider the residual strength after structural failure and well reflect the strain softening effect of structural clay.
Data Availability Statement
The original contributions presented in the study are included in the article/supplementary material, further inquiries can be directed to the corresponding author.
Author Contributions
BZ: experiment, data processing and article writing. BT: article writing and revision. JK: literature data collection and document editing.
Funding
This work was supported by the National Natural Science Foundation of China (41867035), the Guangxi Natural Science Foundation (2020GXNSFAA297199), and the the project of Guangxi Key Laboratory of Geotechnical Mechanics and Engineering (2016-A-01).
Conflict of Interest
The authors declare that the research was conducted in the absence of any commercial or financial relationships that could be construed as a potential conflict of interest.
Publisher’s Note
All claims expressed in this article are solely those of the authors and do not necessarily represent those of their affiliated organizations, or those of the publisher, the editors and the reviewers. Any product that may be evaluated in this article, or claim that may be made by its manufacturer, is not guaranteed or endorsed by the publisher.
Acknowledgments
We thank all authors for their contributions, the reviewers for valuable comments, and the Frontiers Editorial Office for improving the layout of this Research Topic.
References
Bryant, E. C., and Sun, W. (2019). A Micromorphically Regularized Cam-clay Model for Capturing Size-dependent Anisotropy of Geomaterials. Comput. Methods Appl. Mech. Eng. 354, 56–95. doi:10.1016/j.cma.2019.05.003
Cao, W-G., Fang, Z-L., and Tang, X-J. (1998). A Study of Statistical Constitutive Model for Soft and Damage Rocks. Chin. J. Rock Mech. Eng. 06, 628–633.
Cao, W-G., and Xiang, L. (2008a). A New Discussion on Damage Softening Statistical Constitutive Model for Rocks and Method for Determining its Parameters. Rock Soil Mech. 29 (11), 2952–2956. doi:10.16285/j.rsm.2008.11.023
Cao, W-G., Zhang, S., and Zhao, M-H. (2008). Study on Simulation of Deformation Process of Saturated Soils by Statistical Damage Theory. Rock Soil Mech. 29 (01), 13–17. doi:10.16285/j.rsm.2008.01.025
Chen, J., and Liu, Z. (2019). Strength Change Mechanism of Undisturbed Red Clay and Remolded Red Clay. J. Henan Univ. Sci. Technol. (Natural Science) 40 (03), 53–59+65+7-8. doi:10.15926/j.cnki.issn1672-6871.2019.03.010
Chen, X-P., Zeng, L-L., Lu, J., Qian, H., and Li-wen, K. (2008). Expeimental Study of Mechanical Behavior of Structured clay. Rock Soil Mech. 29 (12), 3223–3228. doi:10.16285/j.rsm.2008.12.054
Cheng, W.-C., Li, G., Liu, N., Xu, J., and Horpibulsuk, S. (2020). Recent Massive Incidents for Subway Construction in Soft Alluvial Deposits of Taiwan: a Review. Tunnelling Underground Space Technol. 96, 103178. doi:10.1016/j.tust.2019.103178
Chu, F., Zhang, H-G., and Shao, S-J. (2019). Experimental Study of Constitutive Model of Longdong Q3 Structural Loess with Compressive and Shearing Damage. Rock Soil Mech. 40 (10), 3855–3870. doi:10.16285/j.rsm.2018.1420
Deng, Y., and Songyu, L. (2007). Effect of Sample Disturbance on Soft Soil Strength. Chin. J. Rock Mech. Eng. 09, 1940–1944.
Enyang, Z., Wang, S., and Wang, Y. (2019). Modelling Strain Softening of Structured Soils. IOP Conf. Ser. Earth Environ. Sci. 371 (2), 022090. doi:10.1088/1755-1315/371/2/022090
Fateh, A. M. A., Eslami, A., and Fahimifar, A. (2017). Study of Soil Disturbance Effect on Bearing Capacity of Helical Pile by Experimental Modelling in FCV. Int. J. Geotechnical Eng. 11 (3), 289–301. doi:10.1080/19386362.2016.1222692
Gong, X-N., Chuan-Xiang, X., Xiang, K-X., and Hou, Y-F. (2000). The Formation of clay Structure and its Influence on Mechanical Characteristics of clay. J. Hydraulic Eng. 10, 43–47. doi:10.13243/j.cnki.slxb.2000.10.007
Hu, B., Li, X., and Huang, D. (2019). Safety Risk Analysis and Protective Control of Existing Pipelines Affected by Deep Pit Excavation in Metro Construction. Model. Simulation Eng. 2019, 1–17. doi:10.1155/2019/3643808
Huang, X., Chen, H. B., Chen, X. J., Liang, D. X., Bai, H. Y., and Song, Y. (2020). Experimental Study on the Damage Evolution and Characteristics of the Structured Red clay in Guilin. J. Appl. Sci. Eng. 23 (2), 361–368. doi:10.6180/jase.202006_23(2).0020
Kong, L-W., He, L-J., and Zhang, X-W. (2012). Creep Model of Zhanjiang clay and Plastic Components with Variable Parameters. Rock Soil Mech. 33 (08), 2241–2246. doi:10.16285/j.rsm.2012.08.002
Kong, L-W., Zang, M., Guo, A-G., and Yong-Fei, T. (2015). Effect of Stress Path on Strength Properties of Zhanjiang strong Structured clay. Rock Soil Mech. 36 (S1), 19–24. doi:10.16285/j.rsm.2015.S1.004
Kong, L., Zhang, X., Guo, A., and Cai, Y. (2011). Creep Behavior of Zhanjiang strong Structured clay by Drained Triaxial Test. Chin. J. Rock Mech. Eng. 30 (02), 365–372.
Lade, P. V., and Duncan, J. M. (1975). Elastoplastic Stress-Strain Theory for Cohesionless Soil. J. Geotech. Engrg. Div. 101 (10), 1037–1053. doi:10.1061/AJGEB6.0000204
Lade, P. V. (1977). Elasto-plastic Stress-Strain Theory for Cohesionless Soil with Curved Yield Surfaces. Int. J. Sol. structures 13 (11), 1019–1035. doi:10.1016/0020-7683(77)90073-7
Li, S-Q., Zhang, J-W., and Jin-Hong, X. (2015). An Improvement on Cam-clay Model and Modified Cam-clay Model for Intact Soil. Rock Soil Mech. 36 (S2), 215–220. doi:10.16285/j.rsm.2015.S2.028
Liu, E.-L., Yu, H.-S., Zhou, C., Nie, Q., and Luo, K.-T. (2017). A Binary-Medium Constitutive Model for Artificially Structured Soils Based on the Disturbed State Concept and Homogenization Theory. Int. J. Geomech. 17 (7), 04016154. doi:10.1061/(ASCE)GM.1943-5622.0000859
Liu, J-D., Rong-Jian, L., Sun, P., Wang, Z-J., Luo, J-W., and Zhen-Fei, L. (2018). Duncan-chang Nonlinear Constitutive Model Based on Joint Strength Theory of Structural Loess. Chin. J. Geotechnical Eng. 40 (S1), 124–128. doi:10.11779/CJGE2018S1020
Liu, K., Chen, S. L., and Voyiadjis, G. Z. (2019). Integration of Anisotropic Modified Cam Clay Model in Finite Element Analysis: Formulation, Validation, and Application. Comput. Geotechnics 116, 103198. doi:10.1016/j.compgeo.2019.103198
Lu, T-S., Song-Yu, L., Cai, G-J., Wu, K., and Xia, W-J. (2021). Study on the Disturbance and Recompression Settlement of Soft Soil Induced by Foundation Excavation. Rock Soil Mech. 42 (2), 565–580. doi:10.16285/j.rsm.2020.0980
Meng, F.-Y., Chen, R.-P., and Kang, X. (2018). Effects of Tunneling-Induced Soil Disturbance on the post-construction Settlement in Structured Soft Soils. Tunnelling Underground Space Technol. 80, 53–63. doi:10.1016/j.tust.2018.06.007
Ouria, A. (2017). Disturbed State Concept-Based Constitutive Model for Structured Soils. Int. J. Geomech. 17 (7), 04017008. doi:10.1061/(ASCE)GM.1943-5622.0000883
Park, D. S., and Kutter, B. L. (2015). Static and Seismic Stability of Sensitive clay Slopes. Soil Dyn. Earthquake Eng. 79, 118–129. doi:10.1016/j.soildyn.2015.09.006
Roscoe, K., and Burland, J. B. (1968). “On the Generalized Stress-Strain Behaviour of Wet clay,” in Engineering Plasticity. Editors J. Heyman, and F. A. Lechie (Cambridge: Cambridge University Press), 535–609.
Roscoe, K. H., Schofield, A. N., and Thurairajah, A. (1963). Yielding of Clays in States Wetter Than Critical. Géotechnique 13 (3), 211–240. doi:10.1680/geot.1963.13.3.211
Roscoe, K. H., Schofield, A. N., and Wroth, C. P. (1958). On the Yielding of Soils. Géotechnique 8 (1), 22–53. doi:10.1680/geot.1958.8.1.22
Shen, J-H., Wang, R., Zheng, Y., Han, J-Z., and Xiao-Dong, C. (2013). Research on Regional Microstructure Characteristics of Structural clay of Zhanjiang Formation. Rock Soil Mech. 34 (07), 1931–1936. doi:10.16285/j.rsm.2013.s1.073
Shen, K., and Wang, L. (2009). Expeimental Study on the Yield Surface and Flow Rule of Natural Clays. China Civil Eng. J. 42 (4), 119–127.
Shen, Z., Jiang, M., and Wang, S. (2019). Static and Kinematic Damage Characterization in Structured Sand. Acta Geotech. 14 (5), 1403–1421. doi:10.1007/s11440-018-0730-x
Sun, D., and Chen, B. (2011). Experimental Study on the Mechanical Behavior of Structural Soft clay. China Civil Eng. J. 44 (S2), 65–68. doi:10.15951/j.tmgcxb.2011.s2.006
Weibull, W. (1951). A Statistical Distribution Function of Wide Applicability. J. Appl. Mech. 18 (3), 293–297. doi:10.1115/1.4010337
Wu, E-L., Wei, C-F., Wei, H-Z., and Yan, R-T. (2013). A Statistical Damage Constitutive Model of Hydrate-Bearing Sediments. Rock Soil Mech. 34 (01), 60–65. doi:10.16285/j.rsm.2013.01.012
Wu, E., Wei, H., Yan, R., and Wei, C. (2012). Constitutive Model for Gas Hydrate-Bearing Sediments Considering Damage. Chin. J. Rock Mech. Eng. 31 (S1), 3045–3050.
Yang, M-H., Zhao, M-H., and Wen-Gui, C. (2005). Method for Determining the Parameters of Statistical Damage Softening Constitutive Model for Rock. J. Hydraulic Eng. 36 (03), 345–349.
Yin, J., Fu-Jiang, L., Chen, L., and Chun-Wei, L. (2013). Stress Path Tests on Natural Sedimentary Silty clay. Rock Soil Mech. 34 (12), 3389–3393. doi:10.16285/j.rsm.2013.12.019
Yu, J., Li, T., Zheng, C., Cai, Y., Tu, B., and Mu, K. (2014). Numerical Simulation Research on Prolongation Duncan-Chang Model for Seashore Soft Soil. Chin. J. Rock Mech. Eng. 33 (S2), 4271–4281. doi:10.13722/j.cnki.jrme.2014.s2.110
Zeng, L-L., Zeng, J., Fu-Quan, C., Hong, Z-S., and Xia, B. (2014). Undrained Shear Strength Behaviour of Natural Sedimentary Structural clay. Chin. J. Geotechnical Eng. 36 (06), 1072–1078. doi:10.11779/CJGE201406012
Zhang, X-W., Ling-Wei, K., Cheng, C., Kui-Kui, L., and Liu, Y. (2017). Effects of Hydrochemistry on Structural Strength of Zhanjiang Formation clay. Chin. J. Geotechnical Eng. 39 (11), 1967–1975. doi:10.11779/CJGE201711003
Zhang, X-W., Ling-wei, K., Guo, A-G., and Yong-Fei, T. (2014). Experiment Study of Pore Distribution of strong Structural clay under Different Consolidation Pressures. Rock Soil Mech. 35 (10), 2794–2800. doi:10.16285/j.rsm.2014.10.005
Zhang, X-W., Ling-Wei, K., Guo, A-G., and Yongfei, T. (2012). Evolution of Microscopic Pore of Structured clay in Compression Process Based on SEM and MIP Test. Chin. J. Rock Mech. Eng. 31 (02), 406–412.
Zhang, X. W., Kong, L. W., Yang, A. W., and Sayem, H. M. (2017a). Thixotropic Mechanism of clay: A Microstructural Investigation. Soils and Foundations 57 (1), 23–35. doi:10.1016/j.sandf.2017.01.002
Zhang, Y-W., Xiao-Lin, W., Zhan-Ping, S., and Xie, Y-L. (2019). A Modified Cam-clay Model for Structural and Anisotropic Loess. Rock Soil Mech. 40 (03), 1030–1038. doi:10.16285/j.rsm.2017.1909
Zhu, E-Y., and Xiao-Qiang, L. (2018). A Unified Hardening Model Considering Bonding in Structured Soils. Rock Soil Mech. 39 (01), 112–122. doi:10.16285/j.rsm.2017.0482
Keywords: clay, structure, triaxial test, strain softening, constitutive model
Citation: Zhou B, Tang B and Kang J (2021) A Constitutive Model of Clay Considering Structural Failure. Front. Mater. 8:697181. doi: 10.3389/fmats.2021.697181
Received: 22 May 2021; Accepted: 02 August 2021;
Published: 12 August 2021.
Edited by:
Yu-Fei Wu, RMIT University, AustraliaCopyright © 2021 Zhou, Tang and Kang. This is an open-access article distributed under the terms of the Creative Commons Attribution License (CC BY). The use, distribution or reproduction in other forums is permitted, provided the original author(s) and the copyright owner(s) are credited and that the original publication in this journal is cited, in accordance with accepted academic practice. No use, distribution or reproduction is permitted which does not comply with these terms.
*Correspondence: Bin Tang, dGFuZ2JpbkBnbHV0LmVkdS5jbg==
 Biaohe Zhou
 Bin Tang
 Jiashuai Kang