 Haibei Xiong
 Lin Chen
 Cheng Yuan
 Qingzhao Kong
- Department of Disaster Mitigation for Structures, Tongji University, Shanghai, China
Early detection of timber damage is essential for the safety of timber structures. In recent decades, wave-based approaches have shown great potential for structural damage assessment. Current damage assessment accuracy based on sensing signals in the time domain is highly affected by the varied boundary conditions and environmental factors in practical applications. In this research, a novel piezoceramic-based sensing technology combined with a visual domain network was developed to quantitatively evaluate timber damage conditions. Numerical and experimental studies reveal the stress wave propagation properties in different cases of timber crack depths. Through the spectrogram visualization process, all sensing signals in the time domain were transferred to images which contain both time and frequency features of signals collected from different crack conditions. A deep neural network (DNN) was adopted for image training, testing, and classification. The classification results show high efficiency and accuracy for identifying crack conditions for timber structures. The proposed technology can be further integrated with a fielding sensing system to provide real-time monitoring of timber damage in field applications.
Introduction
Timber structures have been increasingly utilized in building construction due to their excellent seismic performance and environmental friendliness, which mean flexible building function, especially with the improvement of engineering wood products (Cao et al., 2019; Chen et al., 2020; Sun et al., 2020). A variety of novel structural systems have been designed and built into landmarks. Wood cracking is an inevitable issue for timber structures because of the variation of temperature and humidity (Li et al., 2013; Dietsch and Winter 2018). Wood cracks could cause potential safety hazards and increase maintenance costs. Therefore, a reliable crack detection technology for extensive in-service and newly constructed timber structures is of great importance to ensure the safety of timber structures.
Existing approaches for timber cracks detection mainly include resistance drilling measurement and scanning image technique (Wei et al., 2011; Brites et al., 2012; Tannert et al., 2014; Kloiber et al., 2015; Zhang et al., 2015; Mol et al., 2020). Drilling measurement is a conventional method to assess the internal condition of timber members (Mol et al., 2020). However, this method is semi-destructive, and the results are highly affected by the test personnel. The scanning image method utilizes different levels of absorbance between crack and health wood for external waves, such as microwaves (Baradit et al., 2009), X-rays (Wei et al., 2011; Pease et al., 2012; Sandak et al., 2015a), and infrared rays (Sandak et al., 2010; Sandak et al., 2015b), to obtain visualized information of the scanning section. However, this method is a qualitative assessment and limited to relatively high cost for real projects.
Compared to the existing wave-based inspection technology, the stress wave shows potential for timber crack detection since stress wave–based inspection is easy to perform with portable devices for in situ assessment. According to frequency bands, stress wave–based approaches can be divided into acoustic tomography (low frequency) (Dackermann et al., 2014a; Riggio et al., 2014; EI-Hadad, 2017) and ultrasonic echo method (high frequency exceeds 20 kHz) (Puaad et al., 2014; Koca et al., 2018; Linke et al., 2019). The detection principles, equipment, and applications have been well demonstrated in the literature (Dackermann et al., 2014b; Krause et al., 2015). Conventional data processing for stress wave–based crack detection measures the change of wave velocity in timber structures. However, wave velocity is highly affected by various factors, such as moisture content, wood species, and orientation of growth rings. All mentioned factors bring uncertainties to detection results. Furthermore, wave velocity is normally obtained by the measurement of time-of-flight of the time-domain probing signal. The influences of damage on the frequency domain of the probing signal cannot be investigated (Lee and Shin, 2002).
For obtaining frequency features to achieve high accuracy in damage identification, time–frequency technologies have been widely applied in radar signal recognition (Ahmad et al., 2020), equipment fault detection (Ulloa and Barbieri, 2018), and non-destructive testing (Obuchowski et al., 2014; Dorafshan and Azari, 2020; Li et al., 2020). Gong et al. (Gong et al., 2020) proposed an algorithm for the automatic extraction of the stress wave reflection period based on image processing to measure the different lengths of buried metal piles in soil. Le et al. (Li et al., 2020) adopted time–frequency analysis to extract the instantaneous frequency of a vehicle–bridge interaction system and evaluated the bridge’ state. Hui et al. (Bao et al., 2018) used the deep learning neural network to identify different time-series images of signal faults in bridge health monitoring. However, there is still no study using time–frequency analysis combined with visual domain networks to detect the timber cracks.
In this paper, the authors propose a novel piezoceramic-based sensing technology combined with the vision classification algorithm for timber crack detection. The proposed visual domain method replaces the conventional way (i.e., damage index) of quantifying the variation of the stress wave signal in the time domain. The received stress wave signal was transformed into spectrograms using the short-time Fourier transform (STFT). Then, the dataset of each case with the label of crack depths was fed into a deep learning network for classification. Numerical simulation was performed to illustrate the stress wave propagation properties when passing through timber cracks in different depth cases. A series of experimental investigations, including a total of three timber beam specimens with seven crack depth conditions in each, were conducted to validate the feasibility and accuracy of the proposed technology.
Methodology
The proposed approach consists of three major steps, as detailed in Figure 1: 1) data pre-processing by conducting joint time–frequency analysis; 2) data augmentation for expanding the dataset and simulating environmental uncertainties in operation; and 3) deep neural network (DNN) training for crack depth classification. Spectrograms of different crack depths are obtained in data pre-processing using the short-time Fourier transform (STFT). Three data augmentation methods include adding white noise to wave data in the time series, adding Gaussian noise to the spectrum, and jittering spectrums, which will not change the main characteristics of signals from the statistical perspective (Tanner, 2014). After data augmentation, seven spectrum image datasets with the label of crack depths are fed into the proposed DNN to train a model and consequently identify damage severity.
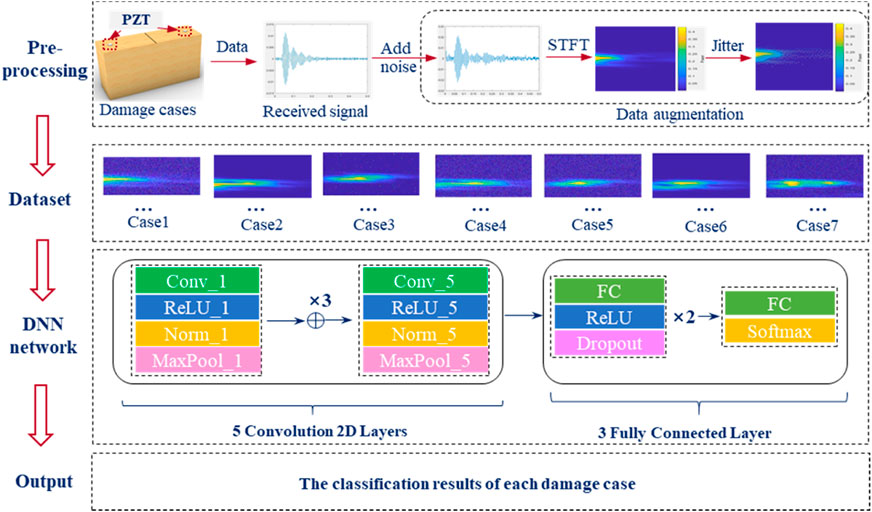
FIGURE 1. Pipeline of the proposed detection method.
Stress Wave–Based Sensing Technology Using Piezoelectric Transducers
Piezoelectric materials, such as lead zirconate titanate (PZT), have attracted increasing attention in real-time monitoring of structural damage for their high stability, small size, great linearity, and piezoelectric effects (Yang et al., 2018; Yuan et al., 2020). The feasibility, applicability, and reliability of PZT sensors have been widely validated in the past decade (Dansheng et al., 2016; Zhang et al., 2018a; Zhang et al., 2018b; Han et al., 2019). PZT-based detection mainly includes stress wave sensing and electro-mechanical impedance (EMI) method (Huo et al., 2017; Zhang et al., 2021), while the high-cost equipment requirement impedes practical applications of the EMI method. Furthermore, because of the larger range of perception and the indirect and the direct piezoelectricity of the PZT material, stress wave sensing is adopted in this research, in which PZT-based transducers can function as both actuators and sensors.
In this study, a pair of PZT patches (an actuator and a sensor) is mounted on the timber surface to generate and detect stress waves, respectively. Figure 2 shows the stress wave propagation mechanism when a crack occurs on timber. The propagation property is affected by the internal condition in the wave path. The existence of cracks in the timber beam could transform the propagation path and wave pattern. When a crack is present, stress waves will reflect and diffract at the damage interface, causing the energy drop-down on the other side of the crack. In Figure 2, it is obvious that the stress wave energy attenuates due to reflection and diffraction at crack interfaces.
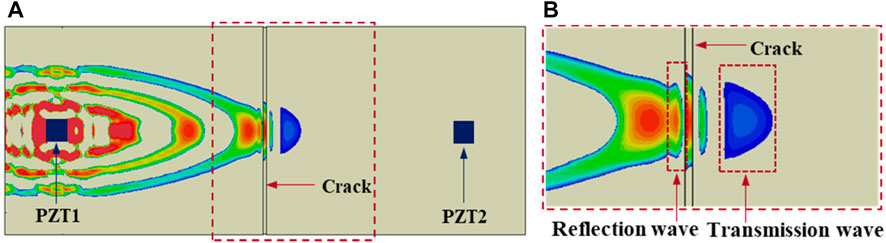
FIGURE 2. Stress wave propagation properties on the crack surface: (A) overall view; (B) wavefront details.
Generation of Spectrum Image Data
The time-series signal received by piezoelectric transducers only contains information of the time domain, which does not consider the influence of cracks on frequency components. Thus, time–frequency analysis including both time and frequency information of the received signal is utilized in this research to obtain spectrum images of the received signal.
In this generation process of image data, time series from tests are transformed into frequency spectrums by using short-time Fourier transform (STFT). For an original discrete signal sequence x(n), a pre-determined window function is used to divide the time series into many segments, and it is assumed the signal is pseudo-stationary over a short interval, and then Fourier transform is carried out on each window length (Bendory et al., 2017; Rashid and Louis, 2020). The transform process of STFT is shown in Figure 3. Both time- and frequency-domain characteristics of timber cracks are contained in STFT spectrums; thus, more damage features can be learned in the training process of the neural network. The calculation of STFT is shown in the following equation:
where
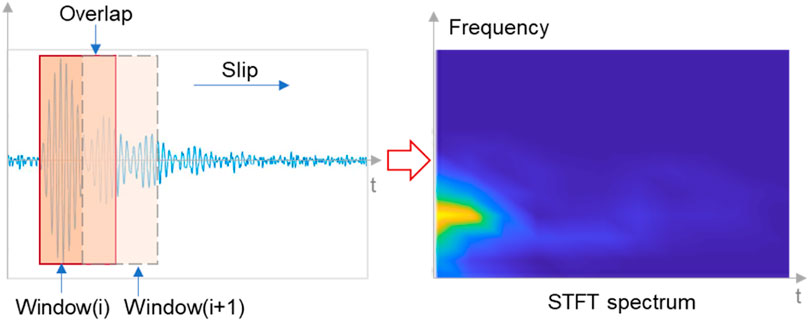
FIGURE 3. Generation process of image data.
Process of Classification Training
STFT spectrum images contain multi-domain feature information of each damage case. Since the DNN has validated significant performance in the classification of images (Shukla and Piratla, 2020), the timber crack detection is conducted using a transferred DNN. The AlexNet network is transferred in this study to imitate the human decision-making process for a deep understanding of the characteristics of STFT spectrums in different crack conditions. The AlexNet network consists of eight layers, including five convolution (Conv) layers and three fully connected (FC) layers (Krizhevsky et al., 2012), as shown in Figure 4.
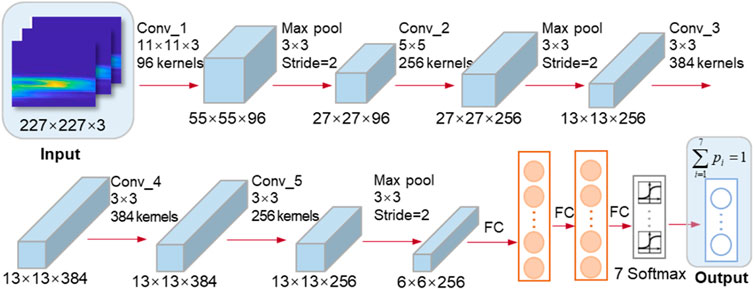
FIGURE 4. Architecture of the AlexNet network.
As shown in Figure 4, damage spectrums are firstly normalized to the size of 227 × 227 × 3 pixels in the input layer, and then 96 kernels are used to extract edge features in the first convolutional layer. The feature map obtained from the former convolutional layer is then put into the ReLU layer and is mapped non-linearly using activation function (i.e., rectified linear unit, ReLU). The ReLU layer’s output then gets into the pooling layer, in which salient features are extracted by the max-pooling algorithm. These steps are repeatedly conducted in the following four convolutional layers with different kernels and padding sizes. With the increase of convolutional layers, the extracted feature number is significantly increased. After that, feature maps are connected to FC layers. The dropout layer can avoid the occurrence of overfitting. The classification results can be obtained in the output layer using softmax function to normalize possibility in each class.
Numerical Study
Model Setup
Numerical simulations were performed in Abaqus. The mechanical properties of timber were set as orthotropic, and detailed constants are listed in Table 1. The parameter E represents the elastic modulus, G is the shear modulus, and µ is Poisson’s ratio. The indexes L, R, and T represent the longitudinal direction, radial direction, and tangential direction, respectively.
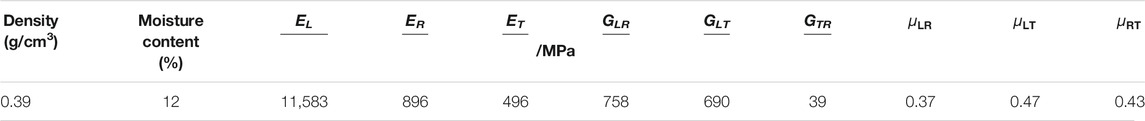
TABLE 1. Mechanical properties of the timber material used in Abaqus.
The material properties of PZT patches were adopted values in official documents of Abaqus1. The dielectric constant, engineering constants, and piezoelectric coupling matrix are listed in Table 2.
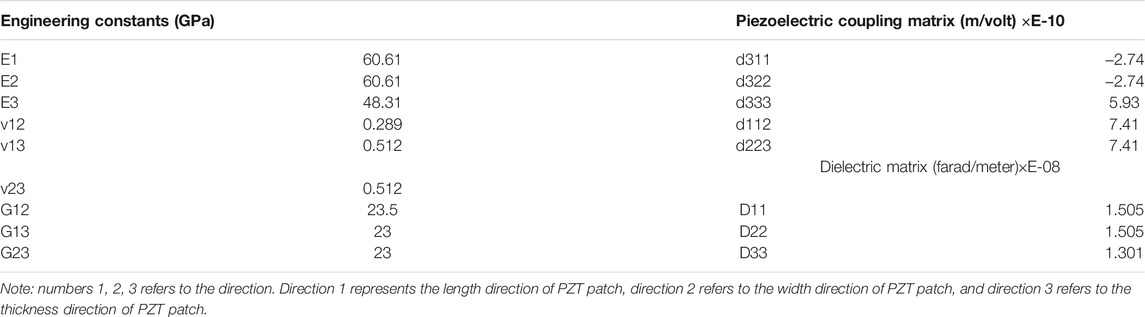
TABLE 2. Material properties of PZT patches used in Abaqus.
The interfaces between timber and PZT patches were set as the connection type of tie. The solid element C3D8R was adopted for the timber beam, and the solid element C3D8E with piezoelectric effects was used for PZT patches. The excitation signal was produced by setting different electrical potentials at the top and bottom surfaces of PZT patches. In particular, the electrical potential at the bottom surface was set as zero, and at the top surface, ten voltages with a pre-determined amplitude were set. The excitation load is a one-cycle sine wave with a frequency of 190 kHz.
The implicit dynamic solver was used with a time period of 0.0001 s, and the time iteration was 1e-7. Figure 5 shows specimen dimensions and PZT locations in the established model. Figure 6 depicts a three-dimensional propagation path of stress waves.
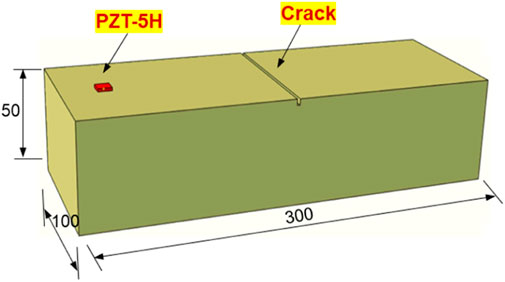
FIGURE 5. Assembly model.
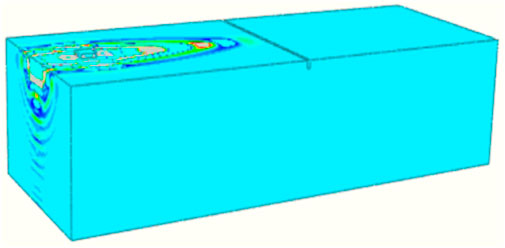
FIGURE 6. Three-dimensional propagation path of the stress wave.
Effects of the Crack on Stress Wave Propagation
To investigate the effect of cracks on stress wave propagation, four crack depths were performed. Figure 7 shows wavefronts of four damage cases in the 220th iteration step. Reflections are observed at the left and side boundaries, and wavefronts show the same pattern before passing through cracks, which means incident waves into the crack interface have same properties and differences as received signals that are only caused by cracks.
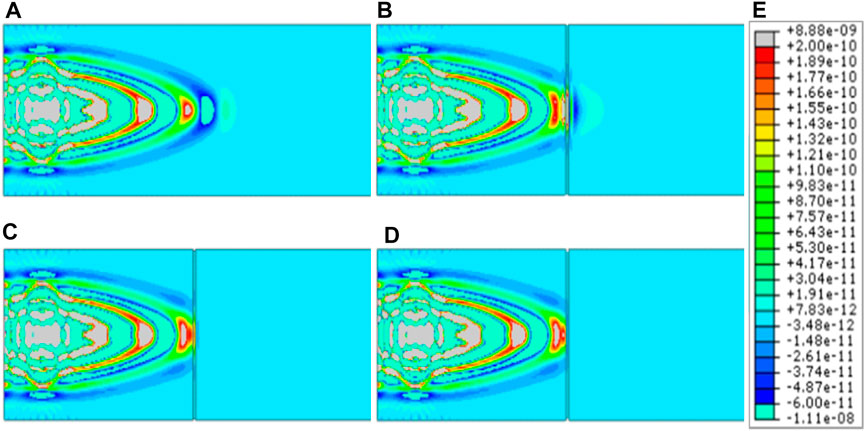
FIGURE 7. Strain contours of the stress wave in the 220th iteration step: (A) crack depth of 0 mm; (B) crack depth of 4 mm; (C) crack depth of 10 mm; (D) crack depth of 20 mm; (E) stress wave intensity.
Figure 8 shows strain contours when stress waves are passing through the crack interface in the 400th iteration step. Reflection waves caused by the crack are obvious in all damage cases. The transmission wave is only observed at the crack depth of 4 mm, which indicates wave velocity decays when the stress wave passes through cracks.
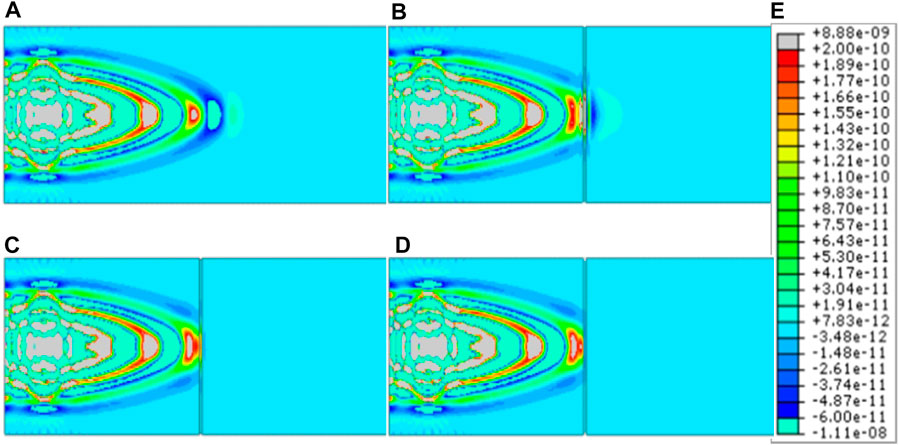
FIGURE 8. Strain contours of the stress wave in the 400th iteration step: (A) crack depth of 0 mm; (B) crack depth of 4 mm; (C) crack depth of 10 mm; (D) crack depth of 20 mm; (E) stress wave intensity.
After passing through cracks, the characteristics of stress waves show extreme differences (as depicted in Figure 9). At the same time in the 470th iteration step, the wavefronts drop down rapidly with the increase of crack depths, representing the attenuation of wave velocities. At the same position of the transmission wave, the stress wave intensity reduces significantly with the increase of crack depths.
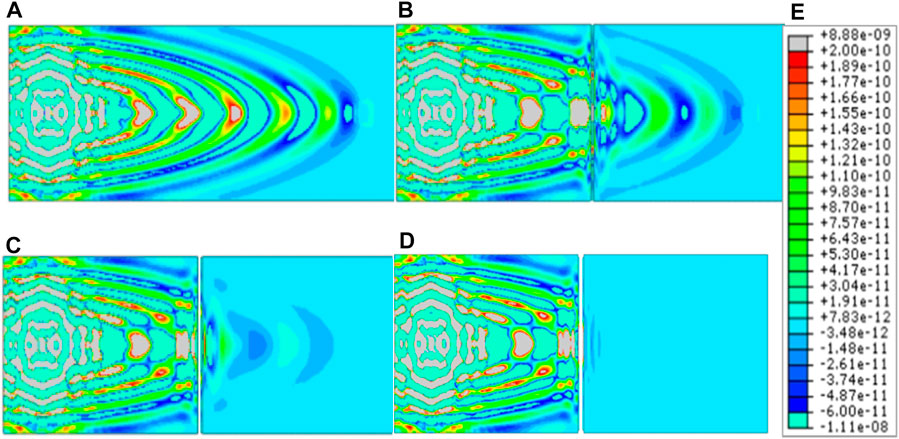
FIGURE 9. Strain contours of the stress wave in the 470th iteration step: (A) crack depth of 0 mm; (B) crack depth of 4 mm; (C) crack depth of 10 mm; (D) crack depth of 20 mm; (E) stress wave intensity.
Experimental Verification
Laboratory Test Specimen
Three timber specimens (pine wood) with the same dimensions (300 mm × 100 mm × 50 mm) were prepared at the State Key Laboratory of Tongji University. For simulating timber cracks, 2-mm-width cracks within seven different depths, listed in Table 3, were cut off on the top surface perpendicular to the grain direction. Two PZT patches were mounted at predetermined locations using adhesive (Comix super glue B2695), and the distance is 50 mm from two adjacent ends of the timber specimen, as shown in Figure 10. The dimensions of PZT patches are 10 mm, 10 mm, and 2 mm in length, width, and depth, respectively.
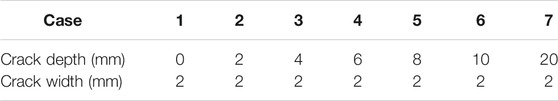
TABLE 3. Seven cases of crack condition.
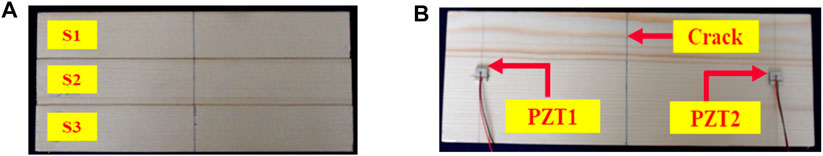
FIGURE 10. Timber specimens: (A) side view; (B) top view of PZT configuration.
Experimental Setup
The experimental apparatus includes timber specimens, a data acquisition system, and a monitoring visualization system, as depicted in Figure 11. Timber specimens are fixed by two fixtures for simulating the boundary conditions in real cases. On the top surface of specimens, two PZT patches were used for transmitting and receiving signals. One PZT patch, excited by a one-cycle sine wave with a frequency of 190 kHz, is connected to the acquisition system with 2 MS/s sampling frequency. The data acquisition system consists of an acquisition card (NI USB 6366) and a signal power amplifier (Trek model 2100HF). The other PZT connected to the acquisition system is used to receive stress waves and displace the signal response in the visualization system.

FIGURE 11. Experimental apparatus.
Results and Discussion
Time-Domain Signal Collection
The time-domain probing signals for three specimens are shown in Figure 12. The time duration of each specimen is 0.5 ms. A general trend of all the test specimens shows two significant wave packets in time response. The first wave packet is the signal directly received from the probing signal, and the second wave packet is the signal received from boundary reflections. The signal amplitudes decrease with the increase of crack depth in the first wave packet. The second wave packet has no similar trend due to the multi-boundary reflection effects. Because of the large material dispersion of timber, time-domain signals are very difficult to process and classify the damage cases. Thus, time–frequency spectrums in terms of images are established from each time-domain signal for training the developed DNN.
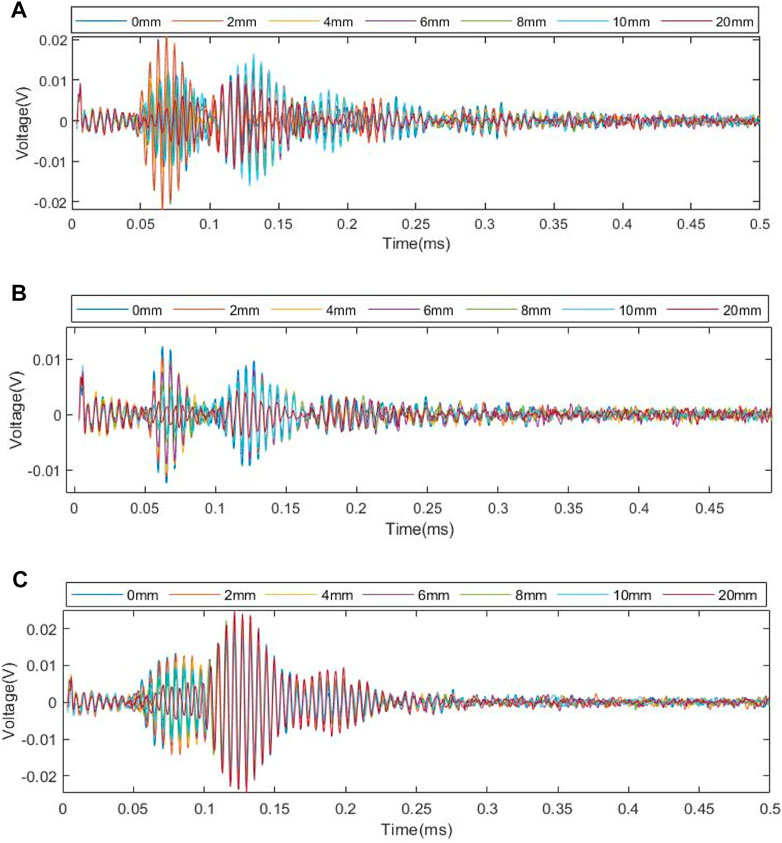
FIGURE 12. Received signals: (A) specimen 1; (B) specimen 2; (C) specimen 3.
Data Training Process
Since original signals from tests are limited to training neural networks, three data augmentation methods are used to expand datasets in both the time domain and the frequency domain. Gaussian noises with certain signal-to-noise ratios were added to raw data, and all raw data were transformed into frequency spectrums by STFT. In addition, salt and pepper noises were added into spectrum images of original signals, and spectrum images were jittered into 8 channels and 16 channels, respectively. Each original signal was expanded to 27 images after data augmentation. Spectrums from different specimens but for the same crack depth were mixed into a separate dataset. A total of 567 images were obtained in this research, as shown in Figure 13.
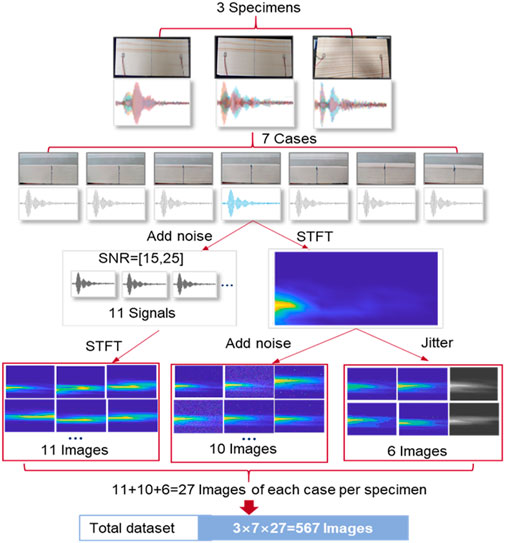
FIGURE 13. Process of data augmentation.
Classification Results
Visual domain network–based image identification for the spectrum dataset was conducted. Seven datasets with 567 images are mixed and fed into the transferred AlexNet network. The learning rate is set as 0.0001, and a total of 200 epochs are set. In each epoch, images are randomly split into the training set and validation set. As shown in Figure 14, the training dataset accounts for 70% of the total images, and the validation dataset accounts for 30%. As shown in Figure 15, the predicted accuracy rapidly increases with the addition of iterations. When the number of iterations exceeds 2,000, the prediction accuracy approaches a constant value of 95.83%.
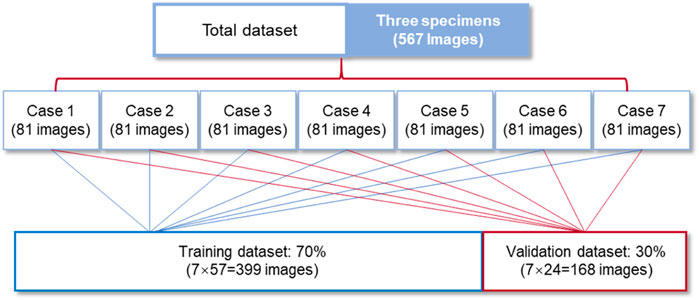
FIGURE 14. Distribution of training and validation datasets.
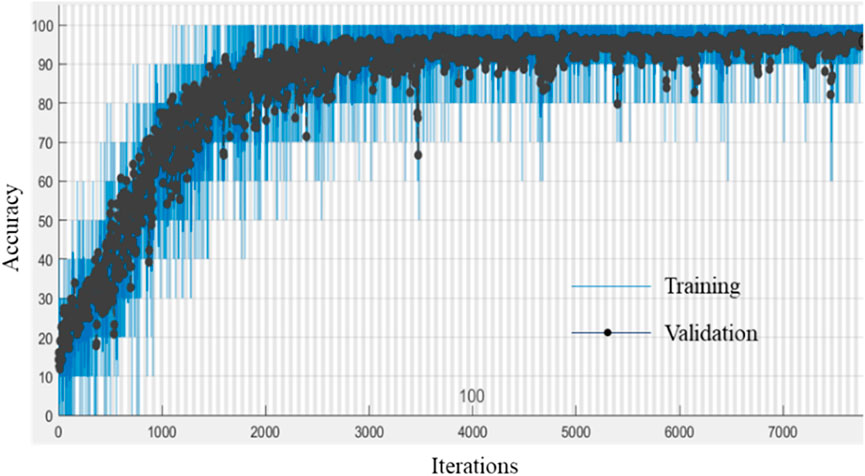
FIGURE 15. Training process of accuracy.
Figure 16 illustrates the confusion matrix regarding the classification accuracy of the validation dataset. The average accuracy rate is 95.8%. The crack depth of 8 mm has the highest accuracy of 100%. The crack depths of 0 mm, 2 mm, 4 mm, and 10 mm have the same accuracy with a 4.3% probability of wrong predictions, and the crack depth of 20 mm has a lower accuracy of 91.7%.
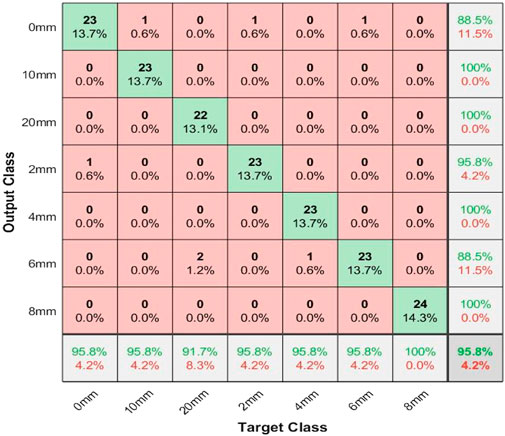
FIGURE 16. Confusion matrix of the validation dataset.
Discussions
The classification results from the transferred DNN show the feasibility of the proposed technology to identify timber crack severity. Compared with traditional signal processing of the stress wave method, the proposed method based on STFT spectrums and computer vision technique shows the advantage in generality and the extensibility of the dataset. However, adopting this approach in field applications still faces a few challenges. In particular, four aspects should be considered in the future work: 1) The detection accuracy is highly limited to the size of the training dataset, which requires continuously expending the current dataset to improve the stability and adaptability of the developed DNN-based classification. 2) Only timber beam elements are investigated in the experimental study, whereas the boundary conditions and dimensional features may be different from other timber structural components, such as columns, wood slab, and timber connections. All mentioned factors may influence the reflection pattern of stress waves. 3) The performance of the proposed method in identifying cracks in propagation is not clear. Therefore, one possible solution is to collect stress wave signals over the whole loading process and then divide these raw data and their corresponding STFT spectrums into different stages according to crack propagating severity and then use the computer vision approach to identify crack propagation. 4) The form of sensor used in this research is surface-mounted patches, whose performance is easily affected by environmental variations and service life. Proper sensor protection should be considered to ensure its long-time service for structural health monitoring of timber structures.
Conclusions
This research proposes a novel piezoceramic-based sensing technology combined with visual domain networks for timber crack detection. Surface-mounted piezoelectric transducers were utilized to transmit and receive stress waves in both numerical simulations and experiments. The numerical and experimental results reveal the wave propagation properties in different cases of crack depths. A total of 567 images were reconstructed by transferring the time-domain signal to time–frequency spectrums. Respective labels from the dataset were trained through the transferred DNN, and the predicted outputs show an average accuracy of 95.8% for crack condition identification. The proposed technology has great potential for achieving real-time monitoring of timber damage in engineering projects when expanding the training samples from in situ timber damage cases.
Data Availability Statement
The raw data supporting the conclusions of this article will be made available by the authors, without undue reservation.
Author Contributions
HX involved in data analysis. LC wrote the paper. CY contributed to FEM modeling. QK provided the idea and revised the paper.
Funding
The authors greatly appreciate the funding support from the National Natural Science Foundation of China (Grant numbers 51978507, 52020105005, and 51978502) and Science and Technology Commission of Shanghai Municipality (Grant numbers 19DZ1201200, 19DZ1202502).
Conflict of Interest
The authors declare that the research was conducted in the absence of any commercial or financial relationships that could be construed as a potential conflict of interest.
Publisher’s Note
All claims expressed in this article are solely those of the authors and do not necessarily represent those of their affiliated organizations, or those of the publisher, the editors, and the reviewers. Any product that may be evaluated in this article, or claim that may be made by its manufacturer, is not guaranteed or endorsed by the publisher.
Footnotes
1http://wufengyun.com:888/books/exa/default.htm(n.d.).
References
Ahmad, A. A., Lawan, S., Ajiya, M., Yusuf, Z. Y., and Bello, L. M. (2020). Extraction of the Pulse Width and Pulse Repetition Period of Linear FM Radar Signal Using Time-Frequency Analysis. J. Adv. Sci. Eng. 3, 1–8. doi:10.37121/jase.v3i1.69
Bao, Y., Tang, Z., Li, H., and Zhang, Y. (2018). Computer Vision and Deep Learning–Based Data Anomaly Detection Method for Structural Health Monitoring. Struct. Health Monit. Int. J., 147592171875740.
Baradit, E., Aedo, R., and Aguilera, C. (2009). Imaging Processing for Knot Detection in wood Using Microwaves. Wood Res. 54, 55–60.
Bendory, T., Eldar, Y. C., and Boumal, N. (2017). Non-Convex Phase Retrieval from STFT Measurements. IEEE Trans. Inf. Theor.. doi:10.1109/icassp.2017.7953062
Brites, R. D., Lourenço, P. B., and Machado, J. S. (2012). A Semi-destructive Tension Method for Evaluating the Strength and Stiffness of clear wood Zones of Structural Timber Elements In-Service. Construction Building Mater. 34, 136–144. doi:10.1016/j.conbuildmat.2012.02.041
Cao, J., Xiong, H., and Chen, L. (2019). Procedure for Parameter Identification and Mechanical Properties Assessment of CLT Connections. Eng. Struct. 203, 109867.
Chen, J., Xiong, H., Wang, Z., and Yang, L. (2020). Experimental Buckling Performance of Eucalyptus-Based Oriented Oblique Laminated Strand Lumber Columns under Centric and Eccentric Compression. Construction Building Mater. 262, 120072. doi:10.1016/j.conbuildmat.2020.120072
Dackermann, U., Crews, K., Kasal, B., Li, J., Riggio, M., Rinn, F., et al. (2014). In Situ assessment of Structural Timber Using Stress-Wave Measurements. Mater. Struct. 47, 787–803. doi:10.1617/s11527-013-0095-4
Dackermann, U., Skinner, B., and Li, J. (2014). Guided Wave-Based Condition Assessment of In Situ Timber Utility Poles Using Machine Learning Algorithms. Struct. Health Monit. 13, 374–388. doi:10.1177/1475921714521269
Dansheng, W., Qinghua, W., Hao, W., and Hongping, Z. (2016). Experimental Study on Damage Detection in Timber Specimens Based on an Electromechanical Impedance Technique and RMSD-Based Mahalanobis Distance. Sensors 16, 1765.
Dietsch, P., and Winter, S. (2018). Structural Failure in Large-Span Timber Structures: A Comprehensive Analysis of 230 Cases. Struct. Saf. 71, 41–46. doi:10.1016/j.strusafe.2017.11.004
Dorafshan, S., and Azari, H. (2020). Evaluation of Bridge Decks with Overlays Using Impact echo, a Deep Learning Approach. Automation in Construction 113, 103133. doi:10.1016/j.autcon.2020.103133
Ei-Hadad, A. (2017). Using Acoustic Emission Technique with Matlab® Analysis to Detect Termites in Timber-In-Service. Melbourne: The university of Melbourne.
Gong, P., Luo, M., Zhou, L., Jiang, L., and Chen, X. (2020). An Image Processing Method for Extraction of the Stress Wave Reflection Period. Appl. Sci. 10, 3486. doi:10.3390/app10103486
Han, F., Jiang, J., Xu, K., and Wang, N. (2019). Damage Detection of Common Timber Connections Using Piezoceramic Transducers and Active Sensing. Sensors 19, 2486. doi:10.3390/s19112486
Huo, L., Chen, D., Liang, Y., Li, H., Feng, X., and Song, G. (2017). Impedance Based Bolt Pre-load Monitoring Using Piezoceramic Smart Washer. Smart Mater. Struct. 26, 057004. doi:10.1088/1361-665x/aa6a8e
Kloiber, M., Drdácký, M., Machado, J. S., Piazza, M., and Yamaguchi, N. (2015). Prediction of Mechanical Properties by Means of Semi-destructive Methods: A Review. Construction Building Mater. 101, 1215–1234. doi:10.1016/j.conbuildmat.2015.05.134
Koca, G., Dndar, T., and Nusret, A. S. (2018). Using the Ultrasonic Stress Wave Technique to Evaluate Structural Timber Members of an Old Masonry Building. Kastamonu University Journal of Forestry Faculty 18(3), 341–349. doi:10.17475/kastorman.499081
Krause, M., Dackermann, U., and Li, J. (2015). Elastic Wave Modes for the Assessment of Structural Timber: Ultrasonic echo for Building Elements and Guided Waves for Pole and Pile Structures. J. Civ. Struct. Health Monit. 5, 1–29. doi:10.1007/s13349-014-0087-2
Krizhevsky, A., Sutskever, I., and Hinton, G. (2012). ImageNet Classification with Deep Convolutional Neural Networks. Adv. Neural Inf. Process. Syst. 25.
Lee, U., and Shin, J. (2002). A Frequency Response Function-Based Structural Damage Identification Method. Comput. Structures 80, 117–132. doi:10.1016/s0045-7949(01)00170-5
Li, J., Zhu, X., Law, S. S., and Samali, B. (2020). Time-varying Characteristics of Bridges under the Passage of Vehicles Using Synchroextracting Transform. Mech. Syst. Signal. Process. 140, 106727.1–106727.19. doi:10.1016/j.ymssp.2020.106727
Li, P., Yang, N., and Wang, Y. (2013). Research on Structural Present State and Damage Reasons of Ancient Tibetan Buildings. Amm 351-352, 1652–1656. doi:10.4028/www.scientific.net/amm.351-352.1652
Linke, G., Rug, W., and Pasternak, H. (2019). “Strength Grading of Structural Timber in Existing Structures with the Ultrasonic Time-Of-Flight Measurement,” in 5th Int. Conf. Struct. Health Assess (Guimaraes, Portugal: Timber Struct.).
Mol, A., Cabaleiro, M., Sousa, H. S., and Branco, J. M. (2020). HBIM for Storing Life-Cycle Data Regarding Decay and Damage in Existing Timber Structures. Autom. Constr. 117. doi:10.1016/j.autcon.2020.103262
Obuchowski, J., Wyłomańska, A., and Zimroz, R. (2014). The Local Maxima Method for Enhancement of Time-Frequency Map and its Application to Local Damage Detection in Rotating Machines. Mech. Syst. Signal Process. 46, 389–405. doi:10.1016/j.ymssp.2014.01.009
Pease, B. J., Scheffler, G. A., and Janssen, H. (2012). Monitoring Moisture Movements in Building Materials Using X-ray Attenuation: Influence of Beam-Hardening of Polychromatic X-ray Photon Beams. Construction Building Mater. 36, 419–429. doi:10.1016/j.conbuildmat.2012.04.126
Puaad, M. B. F. M., Ahmad, Z., and Azlan, H. M. (2014). Ultrasonic Wave Non-destructive Method for Predicting the Modulus of Elasticity of Timber. Springer Singapore.
Rashid, K. M., and Louis, J. (2020). Activity Identification in Modular Construction Using Audio Signals and Machine Learning. Automation in Construction 119, 103361. doi:10.1016/j.autcon.2020.103361
Riggio, M., Anthony, R. W., Augelli, F., Kasal, B., Lechner, T., Muller, W., et al. (2014). In Situ assessment of Structural Timber Using Non-destructive Techniques. Mater. Struct.. 47(5), 749–766.
Sandak, A., Sandak, J., and Riggio, M. (2015a). Estimation of Physical and Mechanical Properties of Timber Members in Service by Means of Infrared Spectroscopy. Construction Building Mater. 101, 1197–1205. doi:10.1016/j.conbuildmat.2015.06.063
Sandak, A., Sandak, J., and Riggio, M. (2015b). Multivariate Analysis of Multi-Sensor Data for Assessment of Timber Structures: Principles and Applications. Constr. Build. Mater.
Sandak, J., Sandak, A., and Negri, M. (2010). Mechanical Testing of wood Assisted by Infrared Spectroscopy and thermal Imaging, 11th World Conf. Trentino, Italy. Timber Eng. 3, 2081–2085.
Shukla, H., and Piratla, K. (2020). Leakage Detection in Water Pipelines Using Supervised Classification of Acceleration Signals. Autom. Constr. 117.
Sun, X., He, M., and Li, Z. (2020). Novel Engineered wood and Bamboo Composites for Structural Applications: State-Of-Art of Manufacturing Technology and Mechanical Performance Evaluation. Constr. Build. Mater. 249.
Tannert, A., Rw, K., Kloiber, P., Riggio, R., and Widmann, Y. (2014). In Situ assessment of Structural Timber Using Semi-destructive Techniques. Mater. Struct. 47(5), 767–785.
Ulloa, F., and Barbieri, G. (2018). “Bearing Fault Detection through Machine Learning: Time-Domain vs Time-Frequency Analysis for Feature Extraction,” in First EAGE Workshop High Perform. Comput. Upstream (Santander, Colombia: Lat. Am.). doi:10.3997/2214-4609.201803075
Wei, Q., Leblon, B., and La Rocque, A. (2011). On the Use of X-ray Computed Tomography for Determining wood Properties: a review1This Article Is a Contribution to the Series the Role of Sensors in the New Forest Products Industry and Bioeconomy. Can. J. For. Res. 41, 2120–2140. doi:10.1139/x11-111
Yang, W., Kong, Q., Ho, S. C. M., Mo, Y. L., and Song, G. (2018). Real-Time Monitoring of Soil Compaction Using Piezoceramic-Based Embeddable Transducers and Wavelet Packet Analysis. IEEE Access. 6, 5208–5214.
Yuan, C., Kong, Q., Chen, W., Jiang, J., and Hao, H. (2020). Interfacial Debonding Detection in Externally Bonded BFRP Reinforced Concrete Using Stress Wave-Based Sensing Approach. Smart Mater. Struct. 29, 035039 (13pp). doi:10.1088/1361-665x/ab7111
Zhang, C., Yan, Q., Wang, X., Panda, G. P., Vipulanandan, C., and Song, G. (2021). Measurement and Evaluation of Soft Soil Strength Development during Freeze-Thaw Process Based on Electromechanical Impedance Technique. Meas. Sci. Technol. 32 (14pp), 025113 (14pp). doi:10.1088/1361-6501/abb7a1
Zhang, J., Huang, Y., and Zheng, Y. (2018). A Feasibility Study on Timber Damage Detection Using Piezoceramic-Transducer-Enabled Active Sensing. Sensors 18, 1563. doi:10.3390/s18051563
Zhang, J., Li, Y., Huang, Y., Jiang, J., and Ho, S. C. (2018). A Feasibility Study on Timber Moisture Monitoring Using Piezoceramic Transducer-Enabled Active Sensing. Sensors 18, 3100. doi:10.3390/s18093100
Keywords: timber beam crack, stress wave–based sensing, piezoelectric transducer, computer vision, deep neural network
Citation: Xiong H, Chen L, Yuan C and Kong Q (2021) A Novel Piezoceramic-Based Sensing Technology Combined With Visual Domain Networks for Timber Damage Quantification. Front. Mater. 8:688594. doi: 10.3389/fmats.2021.688594
Received: 21 April 2021; Accepted: 31 July 2021;
Published: 25 August 2021.
Edited by:
Liqiang Wang, Shanghai Jiao Tong University, ChinaReviewed by:
Yiming Zhang, Hebei University of Technology, ChinaJie Li, Xian Aeronautical Polytechnic Institute, China
Copyright © 2021 Xiong, Chen, Yuan and Kong. This is an open-access article distributed under the terms of the Creative Commons Attribution License (CC BY). The use, distribution or reproduction in other forums is permitted, provided the original author(s) and the copyright owner(s) are credited and that the original publication in this journal is cited, in accordance with accepted academic practice. No use, distribution or reproduction is permitted which does not comply with these terms.
*Correspondence: Qingzhao Kong, cWtvbmdAdG9uZ2ppLmVkdS5jbg==