- 1General Research Institute for Non-ferrous Metals, Beijing, China
- 2GRIMAT Engineering Institute Co., Ltd., Beijing, China
- 3GRINM Group Corporation Limited, Beijing, China
Hot compression tests were conducted using a Gleeble 3500 thermomechanical simulator at temperatures ranging from 1,000 to 1,200°C with the strain rate ranging from 0.1 to 10 s−1. Electron backscatter diffraction (EBSD) technique was employed by investigating the microstructure evolution during hot deformation. Microstructure observations reveal that deformation temperatures and strain rates have a significant effect on the DRX process. It is found that the fraction and grain size of DRX increase with the decreasing deformation temperature, along with the increasing high-angle grain boundaries (HAGBs). The fraction of DRX first decreases and then increases with the increase of strain rates. It is noted that there are both the nucleation mechanisms of discontinuous dynamic recrystallization (DDRX) and continuous dynamic recrystallization (CDRX) during the DRX process for Co–Ni–Cr–W–based superalloys. DDRX and CDRX are the primary and subsidiary nucleation mechanisms of DRX, respectively. It is also found that deformation temperatures and strain rates have almost no effect on the primary and subsidiary nucleation mechanisms of DRX. At the temperature above 1,150°C, the complete DRX occurred with the average grain sizes of about 25.32–29.01 μm. The homogeneity and refinement of microstructure can be obtained by selecting the suitable hot deformation parameters.
Introduction
The Co–Ni–Cr–W–based superalloy has excellent ductility, outstanding strength at high temperatures, good resistance to hostile environments, and weldability. It is suitable for various assembly applications in the aerospace industry. It is widely used in the combustion tank, transition tube, and afterburner of military and commercial gas turbine engines (Haynes International, 2020; Bhanu et al., 1997). In such applications, the components are subjected to complicated conditions, such as high temperature, high pressure, severe environment, and combinations of them (Coutsouradis et al., 1987; Bonacuse and Kalluri, 1995; Lee et al., 2008). In order to obtain excellent properties, it is very important to control the microstructure of the alloy during hot deformation (Cai et al., 2007). In the process of hot deformation, strain hardening, dynamic recovery (DRV), and dynamic recrystallization (DRX) usually occur, which contribute to a complex microstructure evolution (Humphreys et al., 2004). Therefore, the control of the microstructure is of great significance to optimize the final properties of products.
In the present, the microstructure characteristics, recrystallization behavior, and DRX mechanisms in hot deformed nickel-based superalloys, such as Inconel 625 (Li et al., 2011), Inconel 718 (Azarbarmas et al., 2016), Haynes 230 (Liu et al., 2008), Hastelloy C-276 and Co–Cr–based alloys (Jaladurgam and Kanjarla, 2018), Co–Ni–Cr–Mo superalloy (Kartika et al., 2009), Co–28Cr–6Mo–0.16N alloy (Chiba et al., 2009), Co–Cr–W–based alloy (Yamanaka et al., 2014), and Co–Ni–Cr–Mo–Nb alloy (Ouyang et al., 2020), have been extensively studied using hot torsion or hot compression experiments. However, there are few reports about the microstructure evolution of the Co–Ni-Cr–W–based superalloy during hot deformation. This study was aimed to investigate the effect of deformation temperature and strain rate on the microstructure evolution and nucleation mechanisms of DRX for Co–Ni–Cr–W–based superalloys during hot deformation. The DRX process and grain boundary misorientation of DRX under different hot deformation conditions were investigated. The microstructures of the deformed specimens were observed using electron backscattered diffraction (EBSD) technique.
2 Experimental
The as-received Co–Ni–Cr–W–based superalloy is a forging bar with a nominal diameter of 300 mm, and its chemical composition (wt.%) is 22.54Ni–22.63Cr–14.56W–0.28Fe–0.35Si–0.04Mn–0.04La–0.005B–(bal.)Co. The bar was solution treated at 1,200°C for 120 min followed by water quenching to obtain equiaxed and homogeneous grains. Cylindrical specimens with dimensions of Φ8 × 12 mm were machined from the solution-treated bar. The specimens were hot compressed to the true strain of 0.7 at temperatures ranging from 1,000 to 1,200°C with the strain rate ranging from 0.01 to 10 s−1. Each specimen was heated to the set temperatures at a rate of 5°C/min. In order to ensure temperature uniformity, the specimens were held in the chamber for 5 min before hot compression. After hot compression, the specimens were water quenched to room temperature to maintain the microstructures at the end of hot deformation. Then, the deformed specimens were sliced along the compression axis to characterize their microstructures.
EBSD was employed to investigate the microstructure evolutions of hot deformation specimens, which are attached to a SYMMETRY equipped with TSL OIM analysis software. The orientation imaging microscopy (OIM) maps and misorientation angle and size of the grains can be calculated from the EBSD results. The specimen for EBSD investigation was electropolished in a 20% H2SO4 and 80% methanol solution under 15–30 V for 5–15 s at room temperature.
3 Results and Discussion
3.1 Initial Microstructure
Figure 1 shows the original microstructure of the solution-treated superalloy at 1,200°C for 120 min by EBSD. The OIM map of the solution-treated superalloy is shown in Figure 1A. The grain boundaries with misorientation angles below 10° are defined as low-angle grain boundaries (LAGBs). The grain boundaries with misorientation angles above 15° are defined as high-angle grain boundaries (HAGBs). The grain boundaries with misorientation angles between 10° and 15° are defined as medium-angle grain boundaries (MAGBs) (Wang et al., 2008; Li et al., 2011; Zhang et al., 2015a). In Figure 1A, the black and blue lines represent HAGBs and MAGBs, respectively. Moreover, red and green lines represent LAGBs. It is noted that equiaxed grains with HAGBs are presented in the solution-treated superalloy, and some annealing twins also exist, as shown in Figure 1A. The grain size distributions are shown in Figure 1B. The average grain size of the solution-treated superalloy is 88.4 μm.
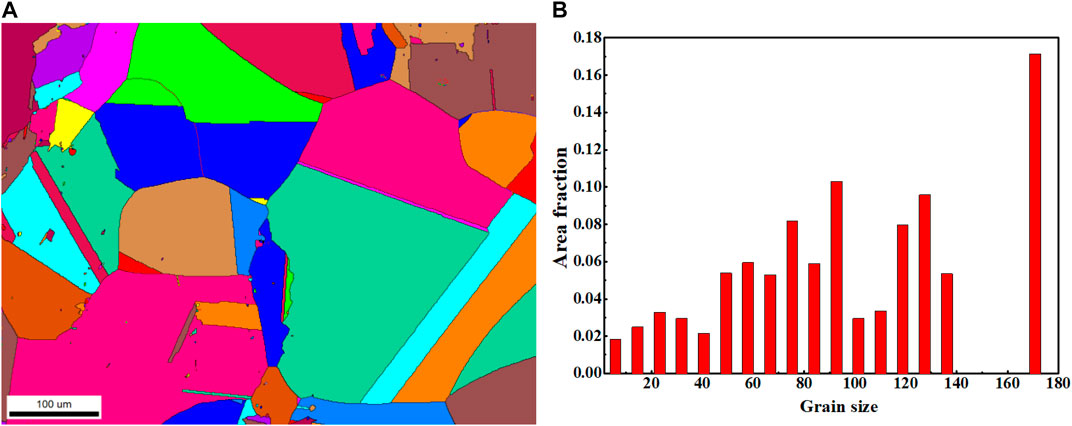
FIGURE 1. Microstructure of the solution-treated superalloy: OIM map (A) and grain size distribution (B).
3.2 Flow Stress Curves
Figure 2 shows typical true stress–strain curves of different temperatures at a strain rate of 0.1 s−1 and different strain rates at a temperature of 1,100°C. It can be seen from Figure 2 that the shape of the flow curves is significantly affected by the temperature and strain rate. The maximum flow stress increases with the decrease of temperature and with the increase of strain rate. The flow stress increases to peak stress and then gradually decreases and reaches a steady state with the increase of strain. The characteristic features of flow stress are related to the competition between dynamic softening and work hardening during hot deformation. At higher deformation temperatures (1,150 and 1,200°C), the flow stress increases to peak stress and then gradually decreases with the increase of strain, as shown in Figure 2A. This flow softening is related to the DRX process. At deformation temperatures below 1,100°C, the stress increases and reaches a steady state. This characteristic feature is related to the occurrence of DRV. At a strain rate of 10 s−1, flow softening is observed in Figure 2B. The adiabatic temperature rise of the sample caused by deformation heat may result in this softening phenomenon at a higher strain rate. The DRV and DRX for the studied superalloy will be revealed by the analysis of the microstructural evolution.
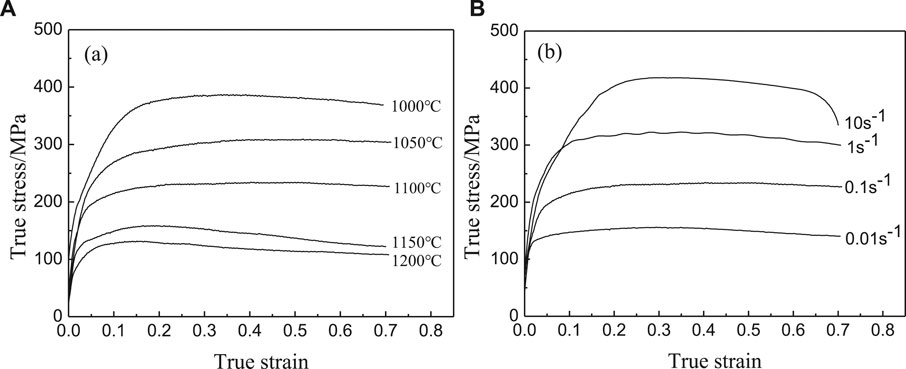
FIGURE 2. Typical true stress–strain curves for the studied superalloy under (A) different temperatures at a strain rate of 0.1 s−1 and (B) different strain rates at a temperature of 1,100°C.
3.3 Effect of Deformation Temperature on the Microstructure Evolution
The microstructures of the Co–Ni–Cr–W–based superalloy deformed to the true strain of 0.7 at different temperatures with the strain rate of 0.1 s−1 were examined by EBSD. Figures 3A1–E1 show the OIM maps of the superalloy deformed in the different deformation conditions. Figures 3A2–E2 display the corresponding kernel average misorientation (KAM) maps. It can be seen from Figure 3 that the deformation temperature has an obvious effect on the DRX process. It is found that a small amount of DRX grains are distributed along the initial grain boundaries and only a tiny amount of new grains are observed inside the original grains at temperatures below 1,050°C. With the increase of deformation temperature, the fraction of DRX grains increases. DRX grains, along with the boundaries of the original grains and elongated deformed grains, form the necklace structures, as shown in Figures 3B1,C1. When the deformation temperature increases to 1,150°C, the recrystallized microstructures become uniformly equiaxed grains, as shown in Figure 3D1. It is also found that the grain size begins to coarsen at 1,150°C. The degree and grain size of DRX increase with the increase of deformation temperature, as shown in Figures 3A1–E1. It is generally known that the grain boundary migration rate is related to the deformation temperature. With the increase of deformation temperature, the grain boundary migration rate increases, which results in the increase of the convex grain boundary to the critical size required to form the recrystallization core in a short time; thus, new DRX grains are formed. The high migration rate caused by high deformation temperature will promote the growth of DRX nuclei. Therefore, when the deformation temperature is high, it is conducive to the nucleation and growth of recrystallization and the degree of recrystallization is also high. It is also noted that the extensive serrated and bulging grain boundaries are the dominant characteristic during hot deformation, as shown in Figure 3. Such grain boundary morphology contains the nucleation of DRX grains and subsequent grain growth (Zhang et al., 2015b). These salient features indicate that the nucleation mechanism of DRX for Co–Ni–Cr–W–based superalloys during hot deformation can be attributed to the discontinuous dynamic recrystallization (DDRX).
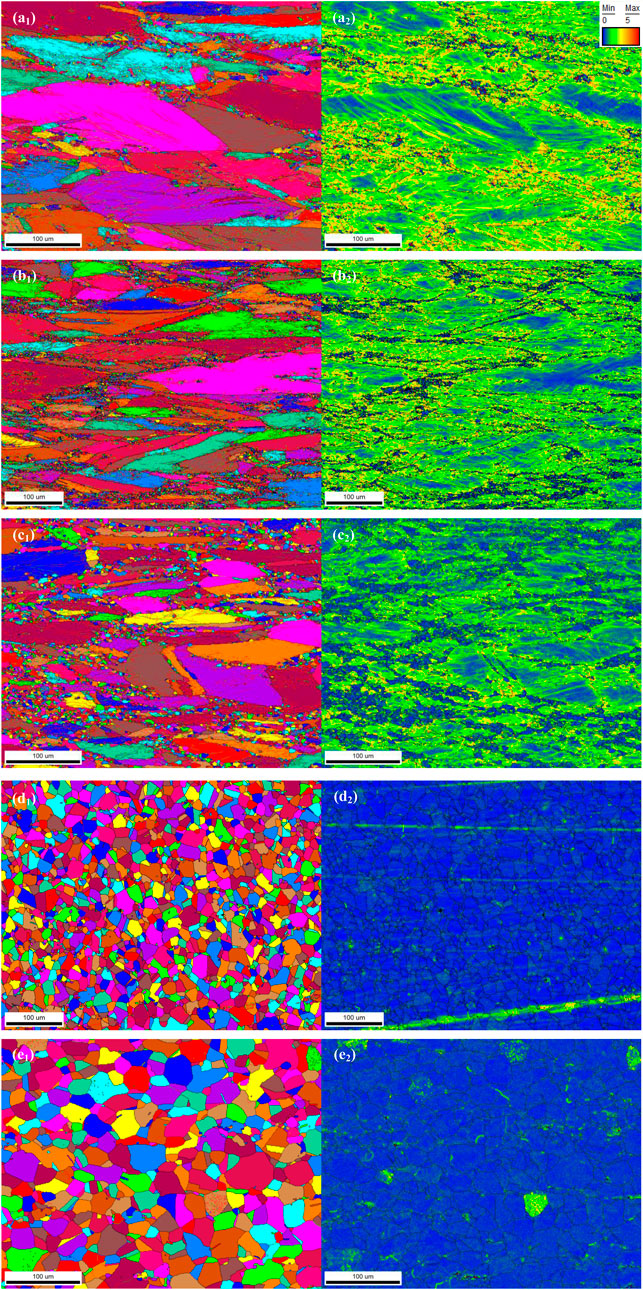
FIGURE 3. Typical OIM and KAM maps of the Co–Ni–Cr–W–based superalloy deformed to a true strain of 0.7 at different temperatures with a strain rate of 0.1 s−1: (A) 1,000°C, (B) 1,050°C, (C) 1,100°C, (D) 1,150°C, and (E) 1,200°C.
It is well known that the KAM value can be used to represent the dislocation density qualitatively (Liu et al., 2020). It is found that, with the increase of temperature, the dislocation density decreases. At the temperatures of 1,000 and 1,050°C, the dislocation distribution is very non-uniform. There are high dislocation densities in the grains deformed, as shown in Figures 3A2,B2. Figure 4 presents the misorientation distribution of boundaries for the treated solution samples and the samples deformed at different temperatures with the strain rate of 0.1 s−1. The grains of the treated solution samples have a relatively high fraction of HAGBs, as shown in Figure 4A. It can be observed in Figures 4B,C that the samples deformed at temperatures below 1,050°C contain a great quantity of LAGBs. The dislocation generation and proliferation leads to strain hardening. This suggests that the partial primary grains have undergone work hardening with high dislocation densities, as shown in Figure 3A2,B2.
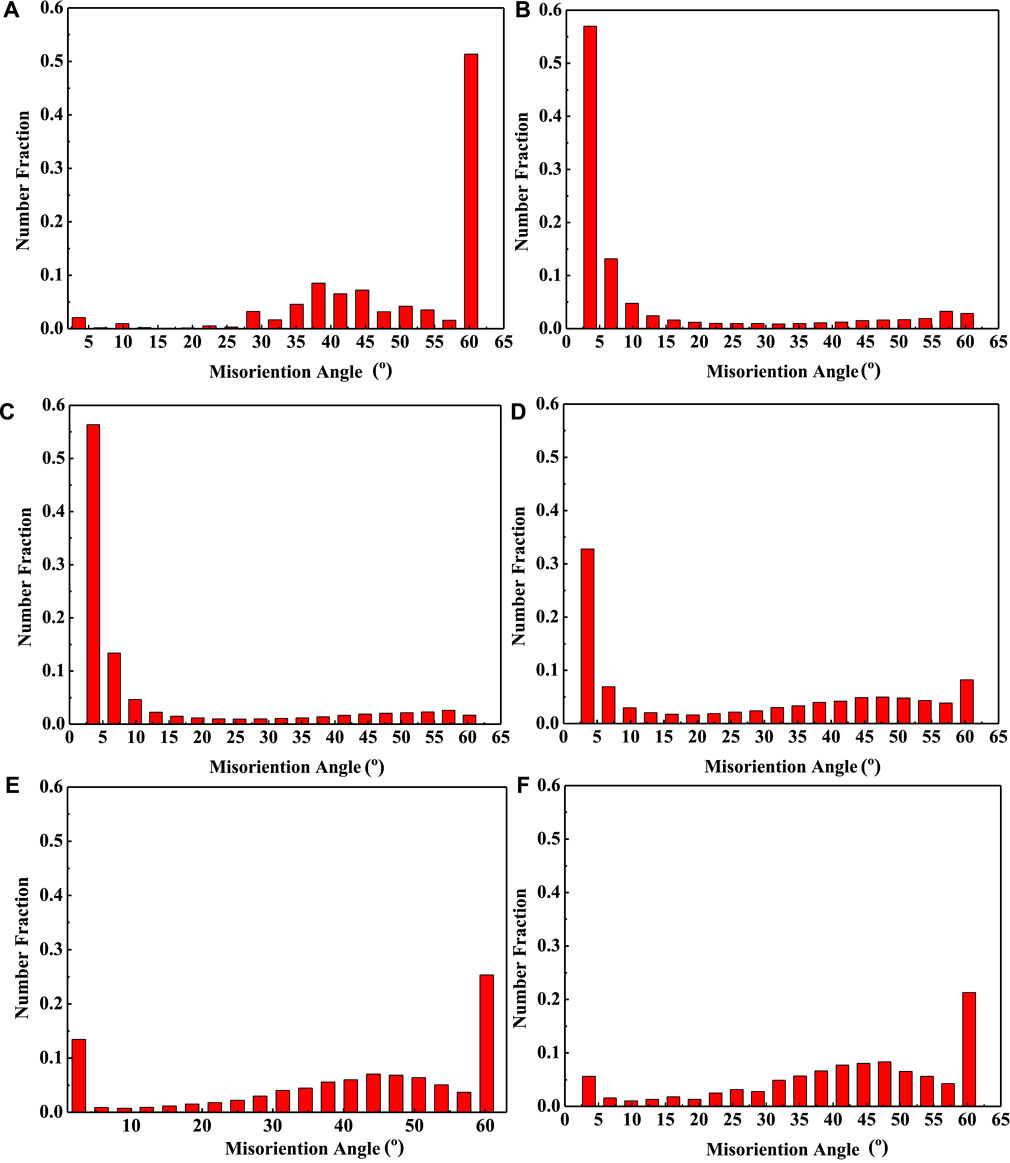
FIGURE 4. Misorientation distribution histogram at different temperatures with the strain rate of 0.1 s−1: (A) solution, (B) 1,000°C, (C) 1,050°C, (D) 1,100°C, (E) 1,150°C, and (F) 1,200°C.
Meanwhile, there are relatively low dislocation densities in the grains deformed at the temperature of 1,100°C, as shown in Figure 3C2. At the higher temperature deformation, the partial different sign dislocations annihilate each other to form dislocation cells in elongated large grains. The dislocation cells might further develop to transform into subgrains by absorbing dislocations. Thus, the dislocation density reduces. The dislocation annihilation and rearrangement probably results in strain softening. It is also noted that there exists a small amount of MAGBs in Figure 4D. These results indicate that the subgrains have been formed and the dynamic recovery (DRV) has occurred at the temperature of 1,100°C. The microstructures are characterized by the deformation of initial grains and a certain amount of subgrains and DRX grains. With the increase of deformation temperature, the dislocation density gradually decreases. Correspondingly, the LAGBs decrease gradually by taking the place of MAGBs or HAGBs. The microstructures of the samples deformed at temperatures above 1,150°C in Figures 4E,F are characterized by the DRX grains with almost dislocation-free microstructures in the interior of the grains, as shown.
It has been reported that the nucleation of CDRX operated through progressive subgrain rotation required the occurrence of MAGBs. In other words, the fraction of MAGBs could directly represent the role of CDRX during the DRX process (Wang et al., 2008; Li et al., 2011; Zhang et al., 2015a). Subgrain boundaries might further develop to transform into HAGBs by absorbing dislocations. The new DRX grains would be formed in the interior of original grains (Jia et al., 2014). It is also found that the percentage of MAGBs is low in these deformation conditions. This indicates that the amount of DRX grains formed by subgrains is relatively less and CDRX is the subsidiary nucleation mechanism for Co–Ni–Cr–W–based superalloys during the DRX process.
3.3 Effect of Deformation Temperatures on Grain Size
Figure 5 displays the grain size distributions and average grain sizes of the alloy deformed at the strain rate of 0.1 s−1 with different temperatures. At the temperatures of 1,000 and 1,050°C, due to the lowest volume fraction of DRX grains, the grain size distribution is very wide, as shown in Figures 5A,B. The size of deformed original grains is about 180.47 μm, whereas the size of DRX grains is about 7.52 μm at the temperature of 1,050°C. The microstructure is very unevenly distributed. With the temperature increase to 1,150°C (Figure 5C), a narrower grain size distribution is gradually developed. Compared with that at the temperature of 1,050°C, the average grain size decreases from 93.97 ± 12.15 to 25.32 ± 4.68 μm. The fraction of the grains with the size in the range of 4.5–27.2 μm reaches 85%. Moreover, the difference in size between the coarse grain and the small grain is 43.2 μm. The homogeneity and refinement of the microstructure are effectively obtained at the temperature of 1,150°C. At the temperature of 1,200°C (Figure 5E), the average grain size increases to about 29.01 ± 5.11 μm. This indicates that the growth of DRX grains due to the higher deformation temperature improves the ability of grain boundary migration.
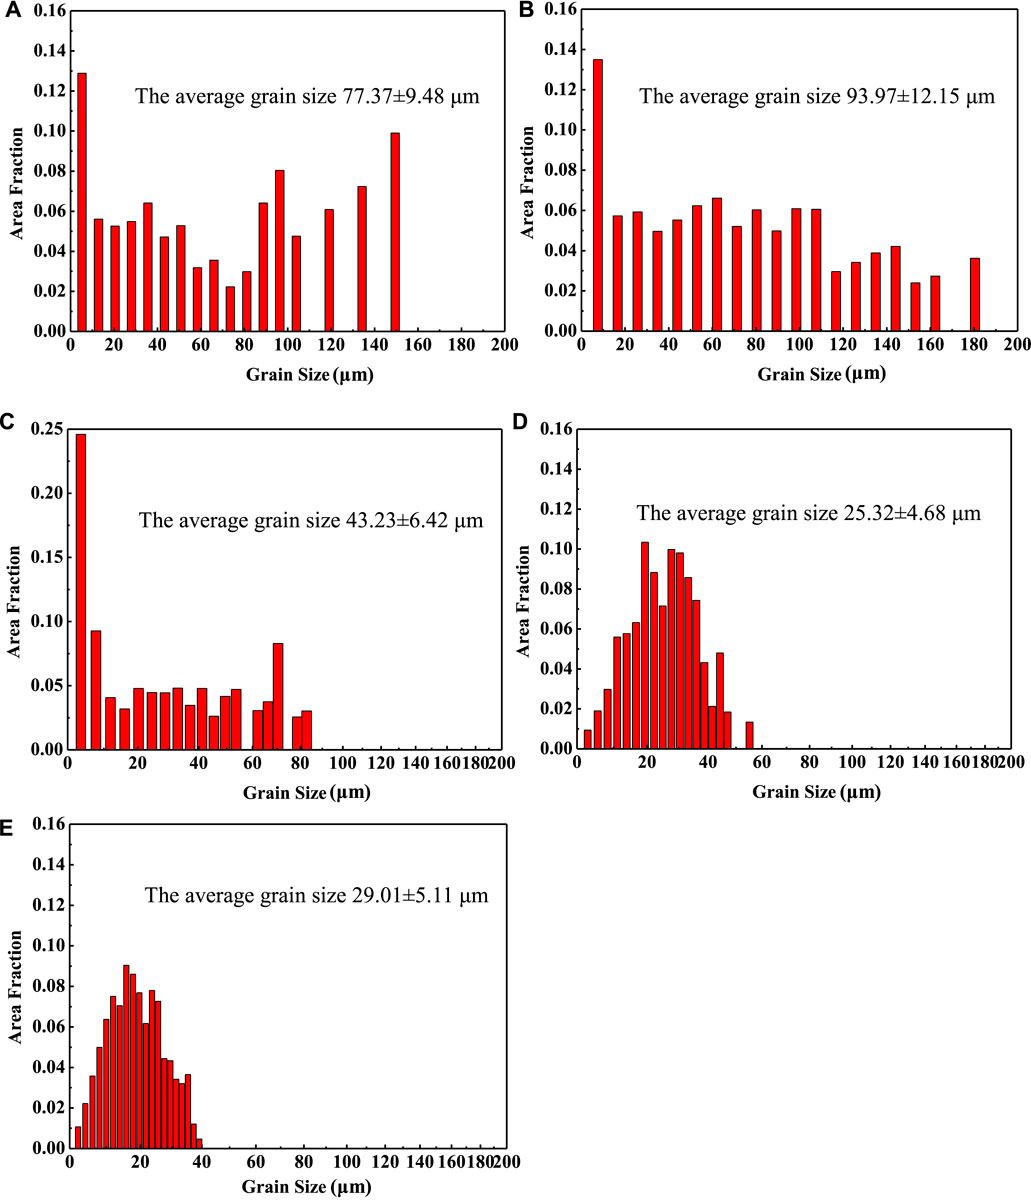
FIGURE 5. Grain size distributions of the Co–Ni–Cr–W–based superalloy deformed at different temperatures with the strain rate of 0.1 s−1: (A) 1,000°C, (B) 1,050°C, (C) 1,100°C, (D) 1,150°C, and (E) 1,200°C.
3.4 Effect of Strain Rates on the Microstructure Evolution
Figure 6 exhibits the typical OIM maps of the sample deformed at 1,100°C with different strain rates. It can be noted that the microstructure evolution of the Co–Ni–Cr–W–based superalloy during hot deformation is closely related to the strain rate. The strain rates have a significant effect on the volume fraction, growth, and size of DRX grains. At the strain rates of 0.01 and 10 s−1, the microstructures consist of many DRX grains and some elongated original grains, as shown in Figures 6A–D. Except for the strain rate of 10 s−1, with the increasing strain rate, the degree of DRX decreases. It is commonly known that the DRX process consists of nucleation and core growth. At the strain rate of 0.01 s−1, there is enough time for the core of DRX to grow up, leading to the acceleration of the DRX process. When the strain rates are less than or equal to 1 s−1, the DRX process is inhibited due to the increase of the critical dislocation density of DRX. At the higher strain rate of 10 s−1, the high deformation rate can promote the interaction of dislocations and increase the density of dislocations. There is a higher storage energy in deformed grains, which is beneficial to the nucleation of DRX. In addition, the heat of deformation causes the adiabatic temperature rise of the specimen. Because of the short deformation time, the heat could not be diffused out. The high stored energy and adiabatic temperature rise accelerate the grain boundary migration, resulting in the promotion of the DRX process at the strain rate of 10 s−1.
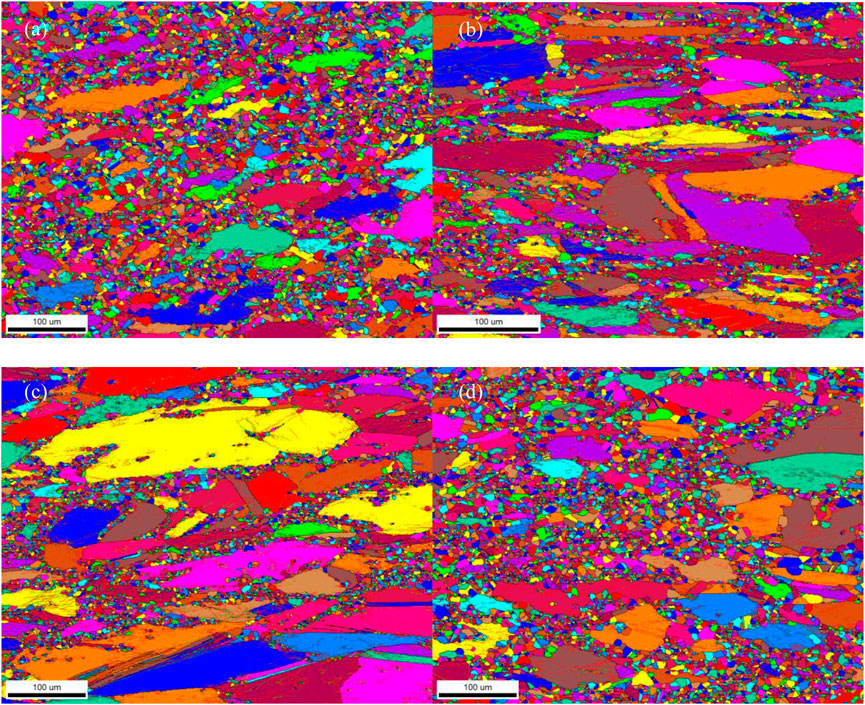
FIGURE 6. Typical OIM maps of the Co–Ni–Cr–W–based superalloy deformed to a true strain of 0.7 at different strain rates with the temperature of 1,100°C: (A) 0.01 s−1, (B) 0.1 s−1, (C) 1 s−1, and (D) 10 s−1.
Figure 7 presents the misorientation distribution of boundaries for the samples deformed at different strain rates. The change of relative fraction at different misorientation angle scopes is shown in Figure 8. It is noted that there are many HAGBs at the strain rates of 0.01 and 10 s−1. However, there are many LAGBs at the strain rates of 0.1 and 1 s−1. These results indicate that the degree of DRX at 0.01 and 10 s−1 is higher than that at 0.1 and 1 s−1. The fraction of MAGBs can directly represent the influence of CDRX on DRX processing with various strain rates (Wang et al., 2008; Li et al., 2011; Zhang et al., 2015a). It can be found that MAGBs increase first in the strain rate range of 0.01–0.1 s−1 and then decrease in the strain rate range of 0.1–10 s−1, as shown in Figure 8. These results indicate that, with the increase of strain rate, the effect of CDRX on DRX processing is strengthened first in the strain rate range of 0.01–0.1 s−1 and then weakened again in the strain rate range of 0.1–10 s−1. When the strain rate increases from 0.01 to 0.1 s−1, the fraction of MAGBs only increases from 0.015 to 0.02. Then, it decreases to 0.01 with a strain rate of 10 s−1. This suggests that CDRX can only be confirmed as a subsidiary nucleation mechanism of DRX for Co–Ni–Cr–W–based superalloys during hot deformation.
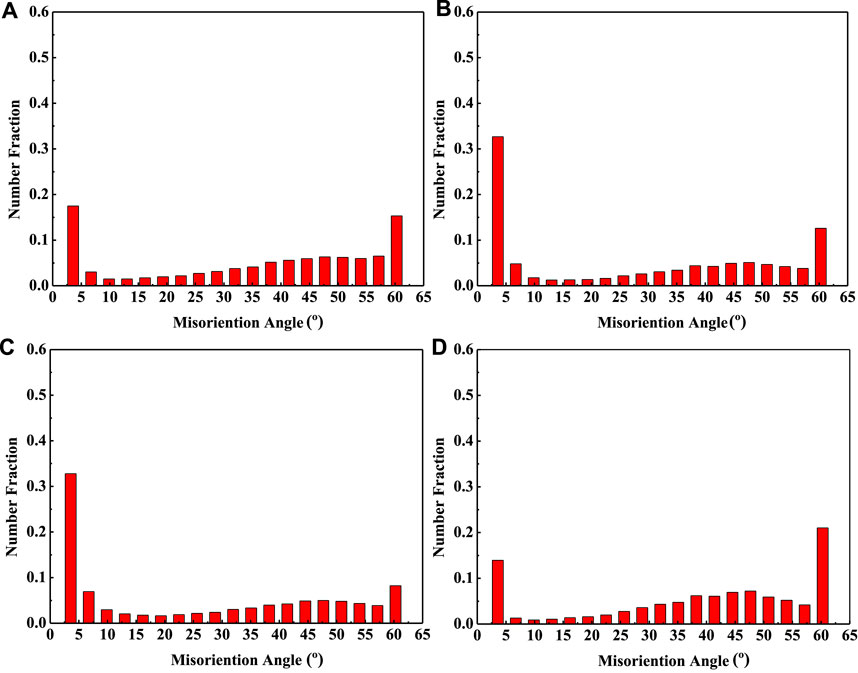
FIGURE 7. Misorientation distribution histogram at different strain rates with the temperature of 1,100°C: (A) 0.01 s−1, (B) 0.1s−1, (C) 1 s−1, and (D) 10 s−1.
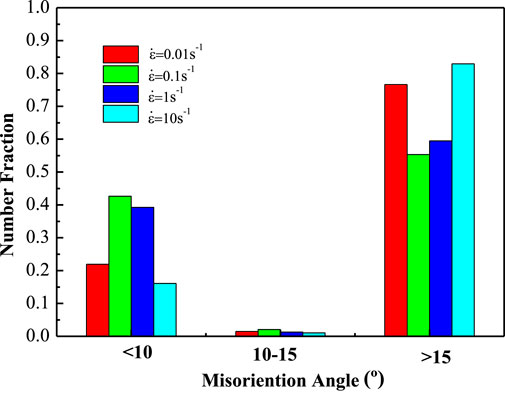
FIGURE 8. Change of relative fraction at different misorientation angle scopes at different strain rates with the temperature of 1,100°C.
3.5 Effect of Strain Rates on Grain Size
Figure 9 shows the grain size distributions and average grain sizes of the alloy deformed at a temperature of 1,100°C with different strain rates. At the strain rate of 10 s−1, the area fraction of the grain sizes below 18 μm is the highest and up to 67% in Figure 9D. The high stored energy and adiabatic heating promote the development of DRX, and the short deformation time inhibits the growth of the DRX grain. At the strain rate of 0.01 s−1, the area fraction of the grain sizes below 25 μm is up to 81% in Figure 9A. In other words, the volume fraction of DRX is about 81%. DRX is a dominant evolution mechanism due to the deformation time adequate for the nucleation and growth of DRX. At the strain rate of 1 s−1, the grain size distribution is very wide, as shown in Figure 9C. Hence, the lowest volume fraction of DRX grains is developed. The size of deformed original grains is about 174.96 μm, whereas the size of DRX grains is about 5.78 μm at the strain rate of 1 s−1. The average grain size is 90.4 ± 14.77 μm. The microstructure is mainly composed of the deformed original grains. Compared with those at the strain rates of 0.01 and 10 s−1, the deformation time sufficient for grain boundary migration would be shorter and the stored energy and the adiabatic temperature rise would be lower. The DRX process is relatively slow. There is a large difference between the grain sizes of deformed original grains and DRX grains. The microstructure is very coarse and uneven at the strain rate of 1 s−1.
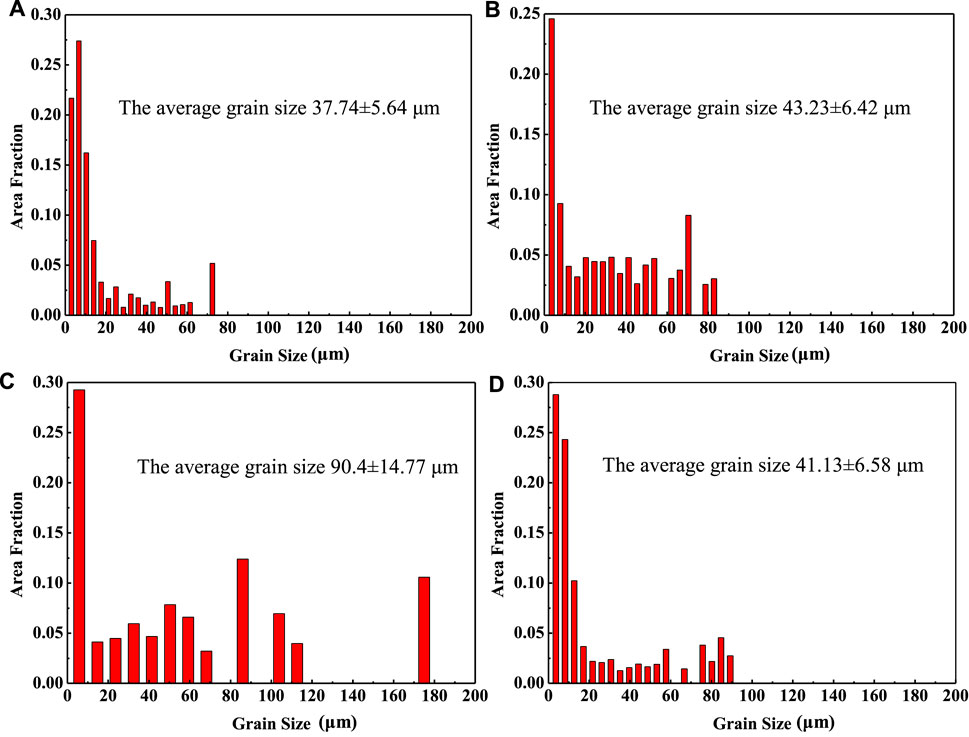
FIGURE 9. Grain size distributions of the Co–Ni–Cr–W–based superalloy deformed at different strain rates with the temperature of 1,100°C: (A) 0.01 s−1,(B) 0.1 s−1, (C) 1 s−1, and (D) 10 s−1.
4. Conclusion
Microstructural evolution of the Co–Ni–Cr–W–based superalloy was investigated in the temperature range of 1,000–1,200°C with the strain rate ranging from 0.1 to 10 s−1 through isothermal compression tests and microstructures analysis by EBSD. The following conclusions are drawn:
Deformation temperatures and strain rates have a significant effect on the DRX process. The fraction and grain size of DRX increase with the increase of deformation temperature, along with the increase of HAGBs. The fraction of DRX first decreases and then increases with the increase of strain rate.
At temperatures below 1,050°C, the primary grains have undergone work hardening with high dislocation densities. The microstructures are very non-uniform. At the temperature of 1,100°C, microstructures are composed of the deformation initial grains and a certain amount of subgrains and DRX grains.
At temperatures above 1,150°C, the original grains are replaced by the new grains of DRX. The average grain size is about 25.32 ± 4.68 μm. The homogeneity and refinement of microstructure are obtained.
The continuous dynamic recrystallization (CDRX) is the primary nucleation mechanism of DRX for Co–Ni–Cr–W–based superalloys during hot deformation. CDRX can only be confirmed as a subsidiary nucleation mechanism.
Data Availability Statement
The raw data supporting the conclusions of this article will be made available by the authors, without undue reservation.
Author Contributions
WZ was mainly responsible for the experiment and paper writing, BZ was mainly responsible for the guidance and later revision of the paper, SW was responsible for the supervision and partial guidance of the experiment, and ST was responsible for the investigation and experiment of heat treatment process.
Conflict of Interest
Authors WZ, BZ, SW, and ST were employed by the company GRIMAT Engineering Institute Co., Ltd. and GRINM Group Corporation Limited.
References
Azarbarmas, M., Aghaie-Khafri, M., Cabrera, J. M., and Calvo, J. (2016). Dynamic Recrystallization Mechanisms and twining Evolution during Hot Deformation of Inconel 718. Mater. Sci. Eng. A 678, 137–152. doi:10.1016/j.msea.2016.09.100
Bhanu, K., Sankara, R., Castelli, M. G., Allen, G. P., and John, R. E. (1997). A Critical Assessment of the Mechanistic Aspects in HAYNES 188 during Low-Cycle Fatigue in the Range 25 to 1000°C. Metallurgical Mater. Trans. A 28, 347–361.
Bonacuse, P. J., and Kalluri, S. (1995). Elevated Temperature Axial and Torsional Fatigue Behavior of Haynes 188. J. Eng. Mater. Technology 117, 191–199. doi:10.1115/1.2804529
Cai, D., Xiong, L., Liu, W., Sun, G., and Yao, M. (2007). Development of Processing Maps for a Ni-Based Superalloy. Mater. Char. 58, 941–946. doi:10.1016/j.matchar.2006.09.004
Chiba, A., Lee, S.-H., Matsumoto, H., and Nakamura, M. (2009). Construction of Processing Map for Biomedical Co–28Cr–6Mo–0.16N alloy by Studying its Hot Deformation Behavior Using Compression Tests. Mater. Sci. Eng. A 513-514, 286–293. doi:10.1016/j.msea.2009.02.044
Coutsouradis, D., Davin, A., and Lamberigts, M. (1987). Cobalt-based Superalloys for Applications in Gas Turbines. Mater. Sci. Eng. 88, 11–19. doi:10.1016/0025-5416(87)90061-9
Haynes International (2020). Haynes Online Literature, No. H-3001, Haynes 188 alloy Product Brochure. Available at: http://www.haynesintl.com/pdf/h3001.pdf
Humphreys, F., Rohrer, G. S., and Hatherly, M. (2004). Recrystallization and Related Annealing Phenomena. Amsterdam: Elsevier.
Jaladurgam, N. R., and Kanjarla, A. K. (2018). Hot Deformation Characteristics and Microstructure Evolution of Hastelloy C-276. Mater. Sci. Eng. A 712, 240–254. doi:10.1016/j.msea.2017.11.056
Jia, J., Zhang, K., and Lu, Z. (2014). Dynamic Recrystallization Kinetics of a Powder Metallurgy Ti-22Al-25Nb alloy during Hot Compression. Mater. Sci. Eng. A 607, 630–639. doi:10.1016/j.msea.2014.04.062
Kartika, I., Matsumoto, H., and Chiba, A. (2009). Deformation and Microstructure Evolution in Co-ni-cr-mo Superalloy during Hot Working. Metall. Mat Trans. A. 40 (6), 1457–1468. doi:10.1007/s11661-009-9829-x
Lee, S. Y., Lu, Y. L., Liaw, P. K., Choo, H., Thompson, S. A., Blust, J. W., et al. (2008). High-temperature Tensile-Hold Crack-Growth Behavior of HASTELLOY X alloy Compared to HAYNES 188 and HAYNES 230 Alloys. Mech. Time-depend Mater. 12, 31–44. doi:10.1007/s11043-008-9049-6
Li, D., Guo, Q., Guo, S., Peng, H., and Wu, Z. (2011). The Microstructure Evolution and Nucleation Mechanisms of Dynamic Recrystallization in Hot-Deformed Inconel 625 Superalloy. Mater. Des. 32, 696–705. doi:10.1016/j.matdes.2010.07.040
Liu, X., Sun, Y., Nagira, T., Ushioda, K., and Fujii, H. (2020). Effect of Stacking Fault Energy on the Grain Structure Evolution of FCC Metals during Friction Stir Welding. Acta Metall. Sin. (Engl. Lett. 33, 1001–1012. doi:10.1007/s40195-020-01064-6
Liu, Y., Hu, R., Li, J., Kou, H. H. C., Li, H., Chang, H., et al. (2008). Deformation Characteristics of As-Received Haynes230 Nickel Base Superalloy. Mater. Sci. Eng. A 497, 283–289. doi:10.1016/j.msea.2008.07.052
Ouyang, L., Luo, R., Gui, Y., Cao, Y., Chen, L., Cui, Y., et al. (2020). Hot Deformation Characteristics and Dynamic Recrystallization Mechanisms of a Co-ni-based Superalloy. Mater. Sci. Eng. A 788, 139638. doi:10.1016/j.msea.2020.139638
Wang, Y., Shao, W. Z., Zhen, L., and Zhang, X. M. (2008). Microstructure Evolution during Dynamic Recrystallization of Hot Deformed Superalloy 718. Mater. Sci. Eng. A 486, 321–332. doi:10.1016/j.msea.2007.09.008
Yamanaka, K., Mori, M., and Chiba, A. (2014). Dynamic Recrystallization of a Biomedical Co–Cr–W-based alloy under Hot Deformation. Mater. Sci. Eng. A 592, 173–181. doi:10.1016/j.msea.2013.11.002
Zhang, H., Zhang, K., Jiang, S., Zhou, H., Zhao, C., and Yang, X. (2015). Dynamic Recrystallization Behavior of a γ′-hardened Nickel-Based Superalloy during Hot Deformation. J. Alloys Compounds 623, 374–385. doi:10.1016/j.jallcom.2014.11.056
Keywords: microstructure evolution, dynamic recrystallization, Co–Ni–Cr–W–based superalloy, nucleation mechanisms, dynamic recovery
Citation: Zhang W, Zhu B, Wu S and Tao S (2021) Investigation into Microstructure Evolution of Co–Ni–Cr–W–Based Superalloy During Hot Deformation. Front. Mater. 8:684985. doi: 10.3389/fmats.2021.684985
Received: 24 March 2021; Accepted: 11 June 2021;
Published: 06 July 2021.
Edited by:
Jana Petrů, VSB-Technical University of Ostrava, CzechiaReviewed by:
Guozheng Quan, Chongqing University, ChinaMingyue Sun, Chinese Academy of Sciences, China
Copyright © 2021 Zhang, Zhu, Wu and Tao. This is an open-access article distributed under the terms of the Creative Commons Attribution License (CC BY). The use, distribution or reproduction in other forums is permitted, provided the original author(s) and the copyright owner(s) are credited and that the original publication in this journal is cited, in accordance with accepted academic practice. No use, distribution or reproduction is permitted which does not comply with these terms.
*Correspondence: Baohong Zhu, emh1YmhAZ3Jpbm0uY29t
 Wei Zhang
 Baohong Zhu1,2,3*
 Shuaishuai Wu