 Wang Chen1†
 Mulian Zheng
94% of researchers rate our articles as excellent or good
Learn more about the work of our research integrity team to safeguard the quality of each article we publish.
Find out more
ORIGINAL RESEARCH article
Front. Mater. , 06 July 2021
Sec. Structural Materials
Volume 8 - 2021 | https://doi.org/10.3389/fmats.2021.683947
This article is part of the Research Topic Trends and Advanced Materials for Pavement and Road Infrastructure View all 5 articles
As a common preventive maintenance technique for asphalt pavement, micro-surface (MS) has the advantages of waterproofing and crack sealing. However, issues such as the fact that the conventional MS generates large noise and the evaluation of the indexes of tire-road noise are relatively less studied. The traditional surface texture index cannot reveal the range and distribution of pavement surface texture, thus hindering research of low-noise MS. To study the mechanism of tire-road noise generated by MS, and propose the tire-road noise and surface texture indicators for MS. In this study, the mechanism of five low-noise MS was systematically analyzed and compared through surface texture and noise tests. Then, a three-dimensional digital texture model (3D-DTM) of MS surface texture was constructed using a series of digital image processing techniques, including grayscale identification, binary conversion, and noise reduction. The results show that optimizing the gradation, adding sound-absorbing materials, and improving the workability of construction can improve the noise reduction performance of MS, it is worth mentioning that the MS prepared with sound-absorbing materials and low-noise gradation has the greatest noise reduction effect, with a maximum reduction of 6.3 dB(A). In addition, it was also found that the 3D-DTM can well reflect the surface texture characteristics of MS. The probability of convex peak distribution (PCD) and the proportion of convex peak area (PCA) with peak heights greater than 0.25 mm (Kh ≥ 0.25), which are extracted from the 3D-DTM, can well reflect the surface texture, tire-road noise, respectively. The results show that the 3D-DTM is a promising tool to optimize the design of low-noise MS.
With the ever-increasing service time, different types and degrees of surface distress will appear on asphalt pavement, such as rutting and cracking (Li et al., 2021), maintenance for pavement is required at this time. Preventive maintenance is regarded as the most economical maintenance strategy for asphalt pavement, which is widely used in the early distress treatment of asphalt pavement to restore pavement performance in time (Sun et al., 2020; Cai et al., 2020). As a commonly used preventive maintenance technique, micro-surface (MS) has been widely used for its advantages including waterproofing, sealing cracks, and filling ruts (Du et al., 2018). Although MS has rich surface texture characteristics that improve anti-skid performance (Kogbara et al., 2016), it also increases the driving noise by 3∼4 dB (A) compared to hot-mix asphalt (HMA) pavement, which not only affects driving comfort but also causes serious noise pollution (Hencken, 2014; Li et al., 2018). Several studies have been conducted on noise reduction techniques for MS, including reducing the aggregate size (Li et al., 2018) and adding sound-absorbing materials (Zhao and Zhao 2014).
NCAT (2010) conducted noise tests on various pavements at the same service life, and the results showed that the tested noise values were 96.4 dB(A) for normal HMA pavement, 97.5dB(A) for stone matrix asphalt (SMA) pavement, and 99dB(A) for MS. In terms of MS noise reduction techniques, Li et al. (2012) added 7 mm sieve holes between 9.5 and 4.75 mm, increased the support minerals while establishing a multi-pivot noise reduction model, then proposed a new low-noise gradation. Compared with traditional MS, the low-noise MS can reduce the noise by 3–4 dB. Based on the SandBery/Descorne model, Liu (2016) proposed a low-noise MS by improving the traditional gradation, which not only has good performance but also can reduce the noise value by 2–3 dB(A). Wei (2016) used steel slag to replace part of the mineral and mixed it with rubber powder to prepare low-noise MS, and found that it had a good noise reduction effect, but the asphalt content needs to be increased to meet road performance. However, there is a lack of effective indicators to reflect noise characteristics in the current mixture design of low-noise MS.
The traceability of tire-road noise has become a current hot-spot topic. The porosity properties of the material, surface texture, and the friction coefficient between the road surface and the tire are regarded as the main influencing factors (Staiano 2018; Fang et al., 2020). Based on that, several models have been developed to characterize the noise. Chen et al. (2008) proposed an experimental model of noise physics suitable for simulation analysis and established a time-domain and frequency-domain coupled line array as well as time-domain wave and frequency-domain wave representations of the noise. Currently, surface texture features are generally considered to be pivotal factors influencing noise, and an increase in texture depth has been reported to increase the value of driving noise (Liao et al., 2014; Wei et al., 2018). Macro-texture was considered to be a determinant factor affecting tire/road noise (Chen 2015). As a characterization of pavement surface texture and noise is crucially important, several devices have been developed for surface texture and noise characterization. The mean texture depth (MTD) or the mean profile depth (MPD) were usually tested by the sand patch test, non-contact laser equipment, respectively. However, these indicators may not reflect the size and depth distribution characteristics of the surface texture (Chen et al., 2015). Although there is a close relationship between macro-texture and noise, El Gendy et al. (2011) pointed out that two-dimensional evaluation indicators for surface texture may not be sufficient to characterize the correlation with noise. In addition, traditional testing methods will consume a lot of time in practice and may generate subjective results (Xiao et al., 2018). Therefore, it is important to assess the micro-surface texture and establish a quantitative relationship with noise reasonably. Bennert et al. (2005) investigated the effects of aggregate type and void ratio on surface texture and noise, then found that finer gradation and multi-void structure can reduce noise while ensuring performance. Peng and Huang (2008) conducted a follow-up investigation on typical MS pavements and found that the noise of driving outside the vehicle has some significant qualitative relationship with surface texture depth, but no significant quantitative relationship. Liu and Shalaby (2017) established a high-precision characterization model of road texture using photometric stereo equipment and then extracted the simulated texture depth and skewness from the model for texture characterization and noise evaluation. Chen et al. (2016) explored the relationship between the car interior noise and exterior noise and the surface texture of the HMA pavement, the results showed that the car internal noise was linearly related to the roughness (IRI), while these two noises were not significantly related to MTD. Chen et al. (2018) established the relationship between noise and pavement sound absorption coefficient, vehicle speed, and wavelength. (Han et al., 2005). tested the noise characteristics of exposed concrete using the tire drop method, and a concave quadratic function was found for the relationship between noise and texture depth when the latter was 0.5–2.0 mm. Jae et al. (2015) used the texture wavelength (defined by a peak number) as a texture indicator to characterize the relationship between asphalt pavement texture and noise.
Although some work has been done on noise and surface texture evaluation, the limitations are also obvious: 1) existing studies on the correlation between surface texture and noise mainly concentrated on hot-mix asphalt or cement concrete pavement, with less research conducted on MS. 2) The traditional texture indicators (MTD, MPD) cannot reflect the size and depth distribution of surface texture.
The purpose of this study is to develop a cost-effective and user-friendly three-dimensional (3D) model to test and evaluate the surface as well as tire-road noise of MS. The scope of this study can be broken down as follows: 1) design several low-noise MS based on existing research, and test the surface texture and noise tests on different MS indoors to analyze their noise reduction characteristics and mechanisms. 2) Develop a cost-effective and 3D model based on digital image technology for MS, and propose the evaluation indicators surface texture and noise. This study can provide a new evaluation method and high-performance auxiliary tools for the optimal design of MS.
The sources of tire-road noise are mainly divided into three categories: 1) the noise generated by the equipment components during operation of the vehicle; 2) the aerodynamic noise generated by the interaction between the car body and the surrounding air; and 3) the tire-road noise generated by the interaction between the tire and the road surface, which has become the main source of noise for high-speed vehicles (Ling et al., 2021).
The main sources of tire-road noise come from the impact of tire tread protrusions, air pumping, and air turbulence vibration noise, as shown in Figure 1. Uniformly distributed tire tread protrusions periodically collide with the road surface as the wheels rotate, then the tire pattern compresses and bounces strongly, which generates the tire vibration noise (Kuijpers and Blokland 2001), as shown in Figure 1 (a). This periodic effect is related to the tire tread distribution, the driving speed, and the macro-texture of the road surface. In addition, when the tire is in contact with the road surface tread it is deformed and the air inside the cavity is instantaneously discharged out (Bennert et al., 2005). Moments later, as the tire leaves the contact surface, the original tread pattern that has been compressed and deformed will recover instantaneously, which causes the cavity volume to instantaneously increase and form a certain vacuum. Then, the outside air is quickly sucked back into cavities (Beckenbauer et al., 2008) as shown in Figure 1 (b). The above two processes occur repeatedly when the vehicle is driving on the road, which causes a pumping action and generates noise. On the other hand, there is a significant difference in air pressure around the tire as the wheel rotates, and areas with strong pressure flow to the weak, thus creating a chaotic air field. The turbulent airflow collides with the exterior of the vehicle, creating an air vortex that generates noise (Cesbron et al., 2008), as shown in Figure 1 (c). This kind of noise is well correlated with driving speed, and the higher the speed, the greater the noise.
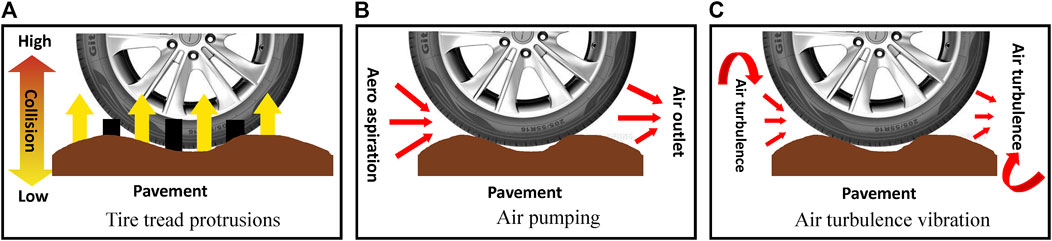
FIGURE 1. The mechanism of tire-road noise.
Based on the above mechanism of tire-road noise, combined with the characteristics of MS, the reasons for MS to produce large noise compared with asphalt pavement are as follows:
1) The thickness of single-layer MS is about 10 mm, the presence of flat particles and the overlap of minerals easily affect the surface texture of MS, and its mineral protrusions are difficult to be leveled due to the absence of rolling process, resulting in rough macro-texture.
2) The thickness of the HMA pavement is generally greater than 2–3 times the maximum nominal particle size of the aggregate. The top of most aggregates is the same surface level after rolling. Therefore, slight vibration noise will be caused by the impact of the tire tread on the aggregate in the HMA. As for MS, the top of the aggregate is not on a horizontal surface but protrudes. Therefore, the tire and vehicle body will vibrate with the rotation of the wheels, resulting in high frequency and low amplitude vibration noise.
3) The elasticity of flexible pavement can reduce tire vibration. There are numerous voids in the pavement structure, and energy consumption can be reduced because the noise in the voids is constantly reflected. However, the thickness of MS in the slurry state does not exceed 10 mm, and the proportion of fine aggregate is high, so there are few internal voids. Therefore, the vibration damping and sound absorption effect of MS are limited.
Given the above noise mechanism of MS, the design principles of low-noise MS were proposed as follows: 1) to optimize the aggregate gradation to reduce the protrusion of large-size particles in terms of the uneven distribution and protrusion of large-size aggregates on MS. 2) To add sound-absorbing additives (i.e., rubber powder) to the mixture to enhance the elasticity and sound absorption ability. 3) To adjust the material composition design to improve the workability of construction, which can increase the intermediate texture to reduce the gap between each other and reduce the high frequency noise, due to the absence of rolling process in MS.
In this study, a low-noise graded MS was designed by optimizing the gradation, rubber powder-fiber MS was designed by adding sound-absorbing materials, and water-based epoxy resin-modified emulsified asphalt MS was designed by improving the construction workability of MS. In addition, The latter two MSs were applied to conventional medium-value gradation and low-noise gradation, except for the low-noise graded MS. Apart from the mixture design of conventional medium-graded MS (MS-M) based on the standard values, the mixture design of the other MS were determined by testing mechanical performance and durability, such as cohesive, abrasion resistance, rutting resistance, and crack resistance, etc. Therefore, five types of low-noise MS were proposed in this study, including low-noise graded MS (MS-LN), low-noise graded MS with rubber powder-fiber (MS-LN-R), medium-value gradation MS with rubber powder-fiber (MS-MR), water-based epoxy resin modified emulsified asphalt MS with low-noise gradation (MS-LN-E), water-based epoxy resin modified emulsified asphalt MS with medium-value gradation (MS-M-E).
A Styrene-butadiene rubber (SBR, 3% in mass) modified asphalt binder was used to prepare MS in this study, the principal technical properties of which are provided in Table 1.

TABLE 1. Technical indexes of modified asphalt binder.
The SBR composite modified emulsified asphalt (SCMEA) was prepared by using self-developed water-based epoxy resin (WER) (Liu et al., 2021). The preparation process of the WER system was as follows: the mass ratio of epoxy resin, epoxy resin emulsifier, and additional water is 100:15:90, and they were sheared at a water bath temperature of 55°C, and the shearing speed was 1000 r/min, the phase reversal method was performed after keeping stirring for 25 min. The epoxy value of the prepared waterborne epoxy resin emulsion was 0.216 mol/100g, the solid content of about 57.3%, and the average particle size was 516.5 nm, all of which met the requirements of the "Technical Specifications for Construction of Highway Asphalt Pavements" (MOT 2004). It is worth noting that 7% of WER system content was used in this study.
The crushed limestone was used as the aggregate, and all indicators met the requirements of the "Standard Test Methods of Bitumen and Bituminous Mixtures for Highway Engineering" (MOT 2011). After reviewing the domestic and international literature involving the gradation of MS, it was suggested to add a 7 mm sieve hole between 4.75 and 9.5 mm to finely control the large size aggregates in the mixture. The upper and lower limits of the MS-III gradation were analyzed based on fractal theory, and then the appropriate fractal size was selected to optimize the passing rate of sieve holes other than the 7 mm sieve in the upper and lower limits of the gradation. After analyzing the effect of the ratio of 4.75∼7 mm to 7∼9.5 mm aggregates on the surface texture of MS, it was found that MS has a suitable texture depth at 30∼50% of 7∼9.5 mm in the 4.75∼9.5 mm aggregate. Therefore, the passing rate of the 7 mm sieve in the upper and lower gradation should be optimized to ensure that the aggregate of 7∼9.5 mm in the upper and lower gradation accounts for about 50 and 30% of 4.75∼9.5 mm, respectively. Finally, the optimized gradation range and the low-noise gradation for MS were proposed (Ning 2019), as shown in Figure 2.
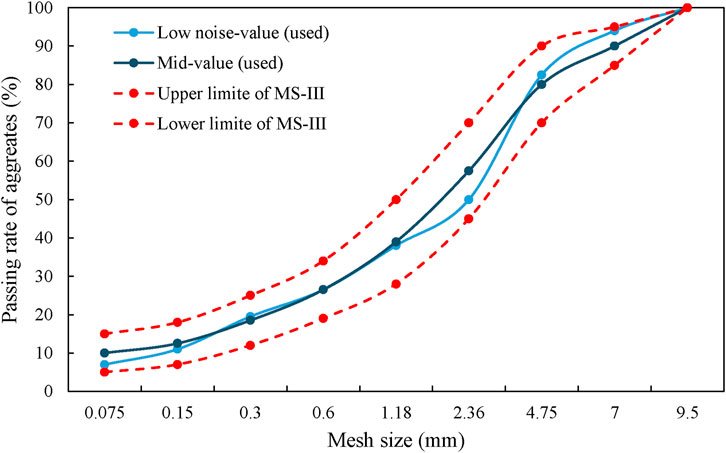
FIGURE 2. Gradation curve for median and low-noise micro-surface.
Apart from optimizing the gradation of MS, rubber powder was also added as a sound-absorbing material to reduce noise. Based on the existing research results of our research group (Ning 2019), waste rubber tires were selected for grinding and crushed by ambient temperature method to make 40 mesh rubber particles. Additionally, 0.2% polypropylene (PP) monofilament fiber with a length of 6 mm was also mixed to improve the abrasion resistance of MS. The technical properties of rubber powder and polypropylene monofilament fiber are shown in Table 2 and Table 3, respectively.
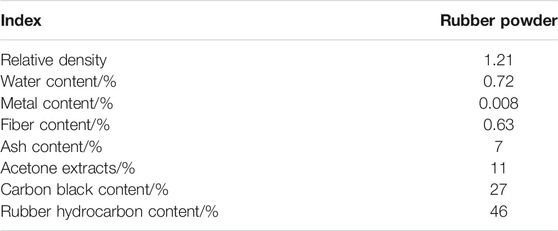
TABLE 2. Technical indexes of rubber powder.
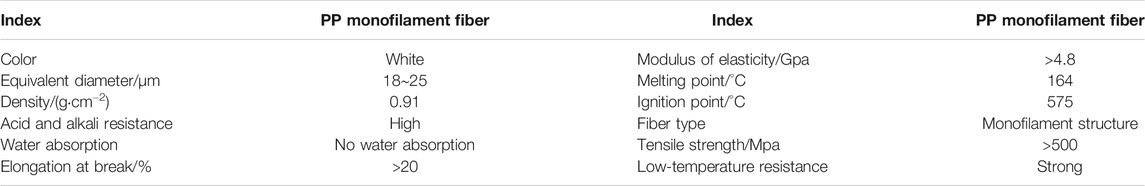
TABLE 3. Technical indexes of PP monofilament fiber.
Based on the self-developed five low-noise MSs, and compared with the conventional MS, the surface texture and noise were evaluated. The composition and proportion of raw materials are shown in Table 4.
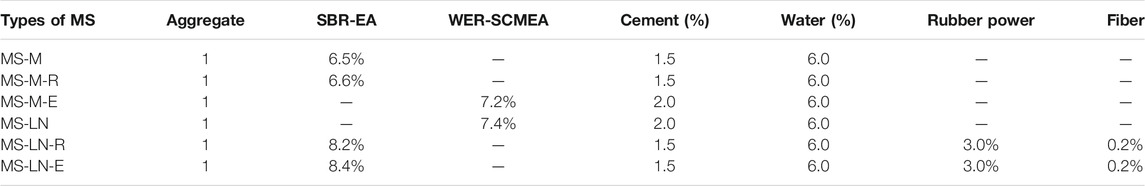
TABLE 4. The composition and proportion of raw materials.
Tire-road noise tests were conducted with different techniques, including the load wheel method (LW), tire falling method (TFM), and wet wheel abrasion method (WWA), as shown in Figure 3. Through the analysis of the noise results generated by various test methods in this study (Figure 4), it was found that LW had the smallest test results and variance, but it was difficult to accurately reflect the noise differences between various MS. The trend of the results from the TFM was similar to that of WWA, and there were many error factors in this testing process, so the results were relatively unstable. However, the noise results from WWA can reflect the surface texture on various MS to the greatest extent.
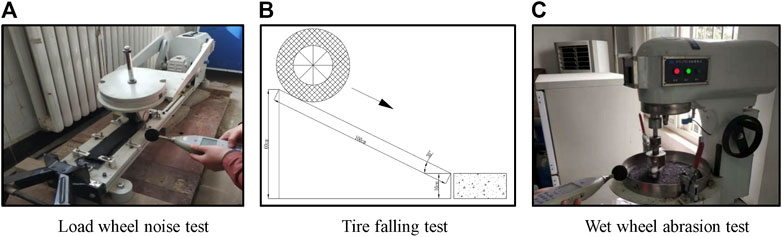
FIGURE 3. Noise test method of the MS.
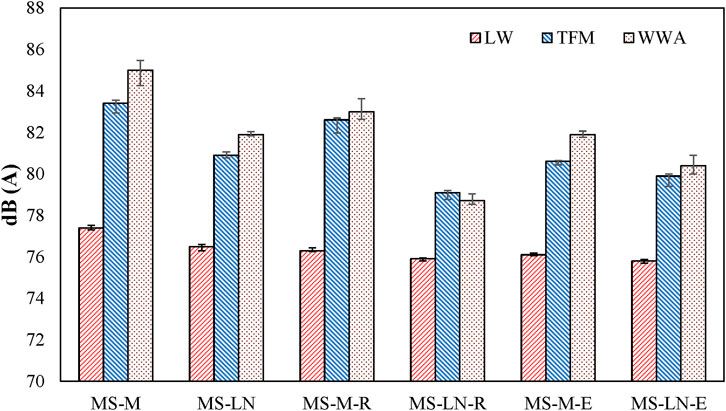
FIGURE 4. The tire-road noise results under different testing techniques.
Thus, the WWA was adopted to simulate the process of the wheel rolling on MS in this study, and the noise [Leq (dB)] during wheel rolling was measured in combination with a multi-functional noise analyzer (H6288E). It was necessary to measure the noise of WWA at no load as a control group before conducting the noise test.
The MTD was used to characterize the surface texture of MS, which was tested by the manual sand patch test (MOT 2019). Assuming that the volume of standard sand is V, and the average diameter in two vertical directions after paving is D (cm), the MTD (cm) of each sample can be obtained by Eq. 1.
The digital image is stored in the computer by a two-dimensional matrix, which is usually represented by the spatial coordinates (x, y) and luminance F (x, y). in addition, a grayscale image is a two-dimensional matrix, which consists of a series of numbers. The matrix in a grayscale image only contains 255 colors from black to white, where "0″ represents black, "255″ represents white, and the other numbers vary from small to large represents the transition color from black to white.
Given the fixed direction and intensity of the light source, the intensity of the reflected light will show a certain pattern with the uneven variation of the object surface. The reflected light will be stronger in high areas than in lower areas, which is called grayscale value in the digital image. Therefore, DIT can be employed to construct the 3D model of MS. By capturing the texture image of MS, and then quantizing the pixel values with image processing software, a two-dimensional matrix sequence of pixels can be obtained. After that, the 3D digital texture model (3D-DTM) of MS can be constructed using the distribution of gray values and the corresponding scale conversion, as shown in Eq. (2).
Where Z represents the pixel value; x, y represents the scalar and ordinate number corresponding to the pixel, respectively, which should be expressed by the grayscale value.
The captured MS specimen images should be processed as follows: grayscale identification, binary conversion, and noise reduction, then a general 3D-DTM of the MS can be established. Finally, the pixel ratio needs to be calibrated with a reference object. The overall process of model establishment is shown in Figure 5, more details of the construction process will be elaborated in the subsequent section.
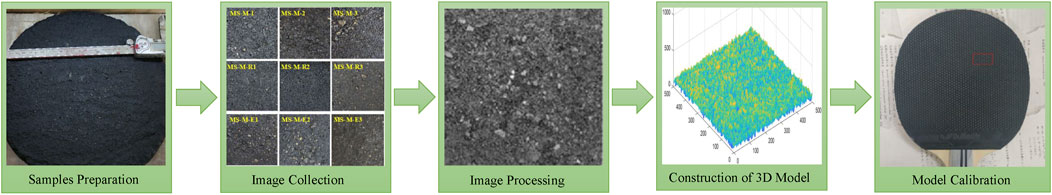
FIGURE 5. Overall process of 3D-DTM establishment for MS.
Digital images of MS specimens were acquired using a digital camera. Images were acquired at night and other light sources were also turned off to eliminate the effects of sunlight intensity and angle variations. The surface of each specimen should be cleaned and then fixed in position before collection. The digital camera was facing the specimen with the camera lens parallel to the surface of the specimen, and the vertical distance fixed at 30 cm. In this way, three images were obtained for each specimen, as shown in Figure 6.
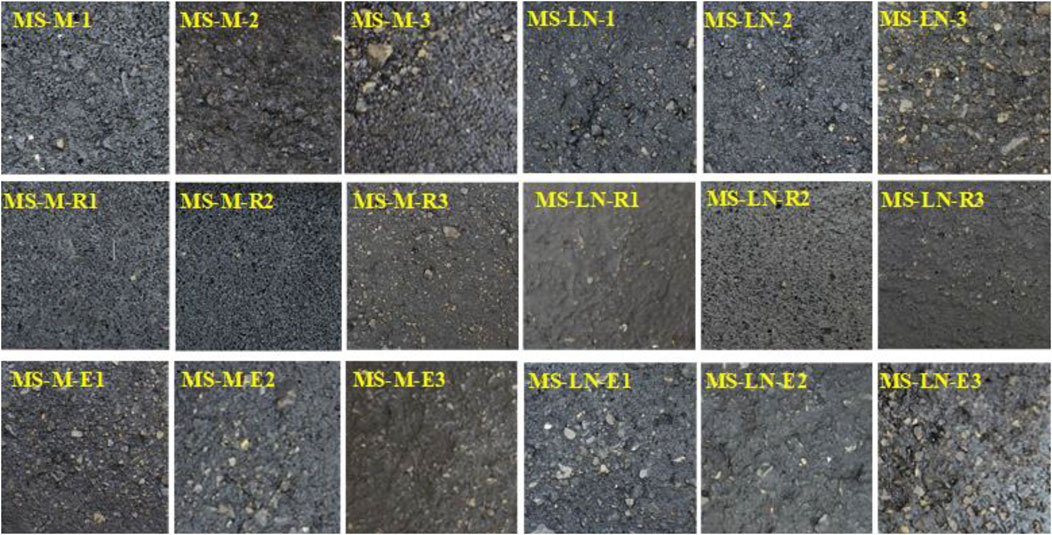
FIGURE 6. Representative digital images of each MS specimen (1,000 × 1,000 pixels).
Selecting images and cutting them into standard pixels (1,000 × 1,000), the digital image should be converted into a grayscale image and then binarized. With the adjustment of the grayscale threshold, the surface texture of the digital image was extracted to obtain the binary image, and then the corresponding two-dimensional matrix can be generated. As shown in Figure 7, the lighter colored areas in the binary image are the convex areas of MS, and the darker colored areas are the concave area, which is consistent with the actual pavement texture characteristic.
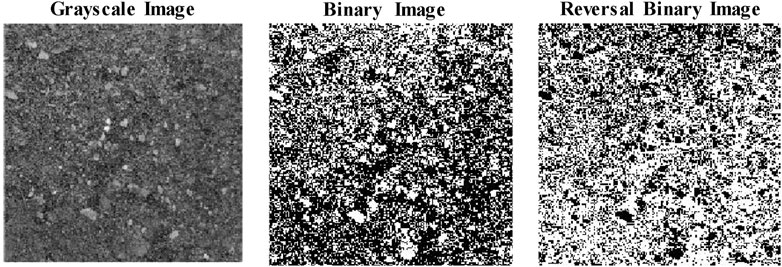
FIGURE 7. Digital image gray-scale processing.
Due to the reflection effect of some smooth points on the surface, there may be some bright spots (hot pixel) with larger grayscale in the grayscale processed digital image, which will lead to large errors in the calculation of pixel difference, especially in MS. Therefore, the grayscale image should be denoised and modified to the average of the grayscale values around this point to filter the points with too large grayscale values.
The pixel value F(x, y) corresponding to the image coordinates (x, y) in a given region D (the area is A) can be obtained, and then the maximum height difference Fmax of the MS surface in area D can also be calculated. Furthermore, a plane was constructed using the Fmax, and then the volume Vpixel surrounded by this plane, then Vpixel can be calculated through Eq. (3).
Therefore, the average pixel difference of region D, which is the depth of the surface texture corresponding to the digital image, and can be calculated by Eq. (4).
There is a proportional relationship between object distance and image distance in the imaging process of the digital image. Therefore, it is necessary to calibrate the actual object to obtain the grayscale of the digital image. Grayscale is defined as the ratio of the known height difference to the pixel value difference of the digital image grayscale of the actual object. In this study, the plastic plate on the surface of a common butterfly ping pong stick was used as the calibration reference. The edge gray value data of the convex part of the image can be acquired, and the average maximum pixel value of the highest and the lowest points were taken to calculate Hpixel between the convex part of the particle and the plane. Subsequently, the ratio of the average height difference of the rubber particles on the plastic plate to the Hpixel was calculated to obtain the scale of the grayscale image. Finally, Hpixel can be converted into the height difference to calculate texture depth by the scale of the grayscale image.
An uneven surface occurs during the paving phase of MS, and this protruding area is referred to as the convex peak. From the collected images, there was a significant difference in the wheel-rolled and non-wheel-rolled surfaces. In this way, the 3D-DTM of the posted rolled specimen was reconstructed, as shown in Figure 8, where the variation from blue to yellow color represents an increase in relative convex peak height (CPH). The CPH increases significantly after rolling. In practice, the convex aggregate can be embedded in the tire, thus increasing the effective contact area between the tire and the pavement surface, while the noise increases. It shows that the height and distribution of the convex peaks were directly related to the contact mechanical behavior between the tire and pavement surface, which also has a direct impact on the noise generation.

FIGURE 8. The digital image after wheel rolling.
Motivated by that, the pixel values of each point on different digital images can be ranked, and the probability of the convex peak distribution (PCD) on specimen surface can be obtained statistically to characterize the texture of different MS.
The 3D-DTM can identify the pixel value of all CPH, and in this way, the pixel value of the tire-pavement contact surface can be obtained, which was used as the critical point to re-binarization, as shown in Figure 9. The white area was the convex texture relative to the critical height, and the black area represents the concave part of the tire-pavement contact surface.
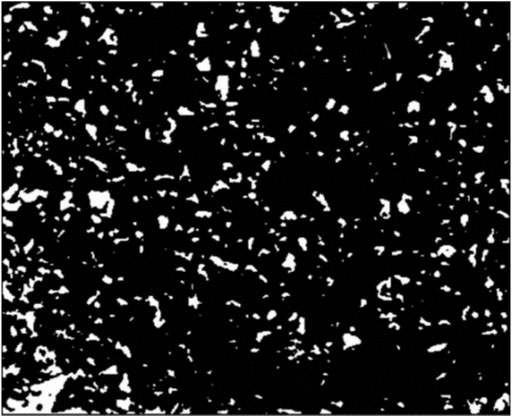
FIGURE 9. Surface binary image.
Calibrating the pixels of the binary image, and measuring the number of pixels M in the area S, and the length of areas S is L, so the unit pixel length ε can be calculated by Eq. (5):
The total number of pixels Nh corresponding to different CPH in the white area was counted, and then the area of different CPH were obtained, then their proportion Kh in the entire test range (the area is S) can be calculated by using Eq. (6):
By calculating and counting the contact area between the surface and tire, the proportion of convex peak area (PCA) of the MS surface can be compared and discussed, then a correlation with the surface texture and noise can be established.
The results of the texture depth of the six MS are shown in Figure 10. The texture depth of MS-M was higher than the others, while it has better anti-skid performance and durability. In addition, the use of rubber powder-fiber with low-noise gradation (MS-M-R, MS-LN-R) can reduce texture depth, and the MS prepared with WER-SCMEA (MS-M-E, MS-LN-E) can improve the construction workability, and reduces the macro-texture. The reasons may be that 1) the type of gradation corresponding to the low texture depth was selected in the low-noise gradation design. 2) In the case of the rubber powder-fiber MS, although the incorporation of the fiber will reduce the free asphalt content, this factor has been taken into account at the point of the design, and the amount of asphalt has been increased. The addition of rubber powder will fill some of the pores of the mixture, which reduces the surface stiffness of the mix, and also reduces the texture depth (Ning 2019). 3) When the water-based epoxy resin system is added to the emulsified asphalt, the emulsified asphalt can be diluted, which reduces its probability of inter-particle swelling and aggregation, and it is more difficult to break the emulsion and increases the mixing time. In addition, the water-based epoxy resin system is thicker than water, and it can prevent water spillage in the system to some extent, which enhances the water retention performance of the mixture. Therefore, it generally changes the workability of construction, making the surface flatter and increasing the fine view texture, thus reducing the texture depth (Fan 2020).
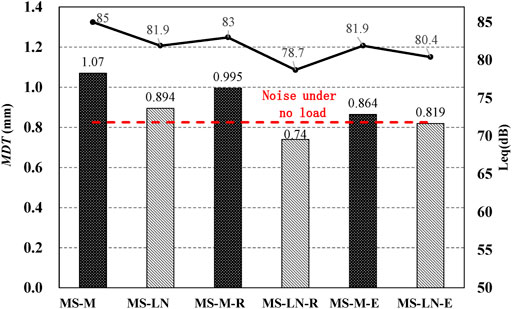
FIGURE 10. Texture depth and noise results of MS.
The noise results of different MS are shown in Figure 10, the noise under no load of WWA was 71.8dB(A), and the difference between the minimum noise and the background noise was about 7dB(A), so the influence of the background noise on the test results can be disregarded, and the noise was analyzed as follows:
1) Compared with MS-M, rubber powder improves the elasticity and sound absorption ability of MS, so MS-M-R can reduce the noise by 2 dB, and the MS-L-R can reduce 6.3 dB. For rubber powder-fiber MS, rubber powder plays a major role in noise reduction. On the one hand, adding a reasonable amount of rubber particles in the traditional MS will produce a porous structure inside the mixture, thus playing the role of sound absorption. Moreover, the sound waves generated by the interaction between tires and road surface will be diffused through the pores of the surface, and eventually converted into heat energy under the viscous damping effect and heat conduction effect, thus achieving the effect of noise reduction. On the other hand, due to the characteristics of rubber powder with large damping, the damping will consume part of the energy when the tire vibrates violently with the road surface thus weakening the vibration effect of the road system. MS-L also can reduce noise by reducing low-frequency vibration, which is also the basis for the design of low-noise gradation (Ning 2019). By adding rubber powder to the low-noise cascade, the two noise reduction techniques will produce a stronger noise reduction effect.
2) Compared with MS-M, the low-noise gradation (MS-LN) can also reduce the noise by 3.1 dB, and MS-M-E can reduce the noise by 3.1 dB, which shows that MS-M-E can achieve noise reduction effect by MS-LN. Due to the good workability of construction mentioned in Texture Depth of Micro-Surface section, the internal porosity and the micro-texture can be increased, thus reducing the connected porosity and playing the role of reducing high-frequency noise (Fan 2020).
The 3D-DTM was used to construct six types of hypersurface (18 in total) based on all the spatial coordinates (x, y) and F(x, y) in the images of MS specimen, i.e., MS surface texture maps. The representative hypersurfaces of various MS are shown in Figure 11.
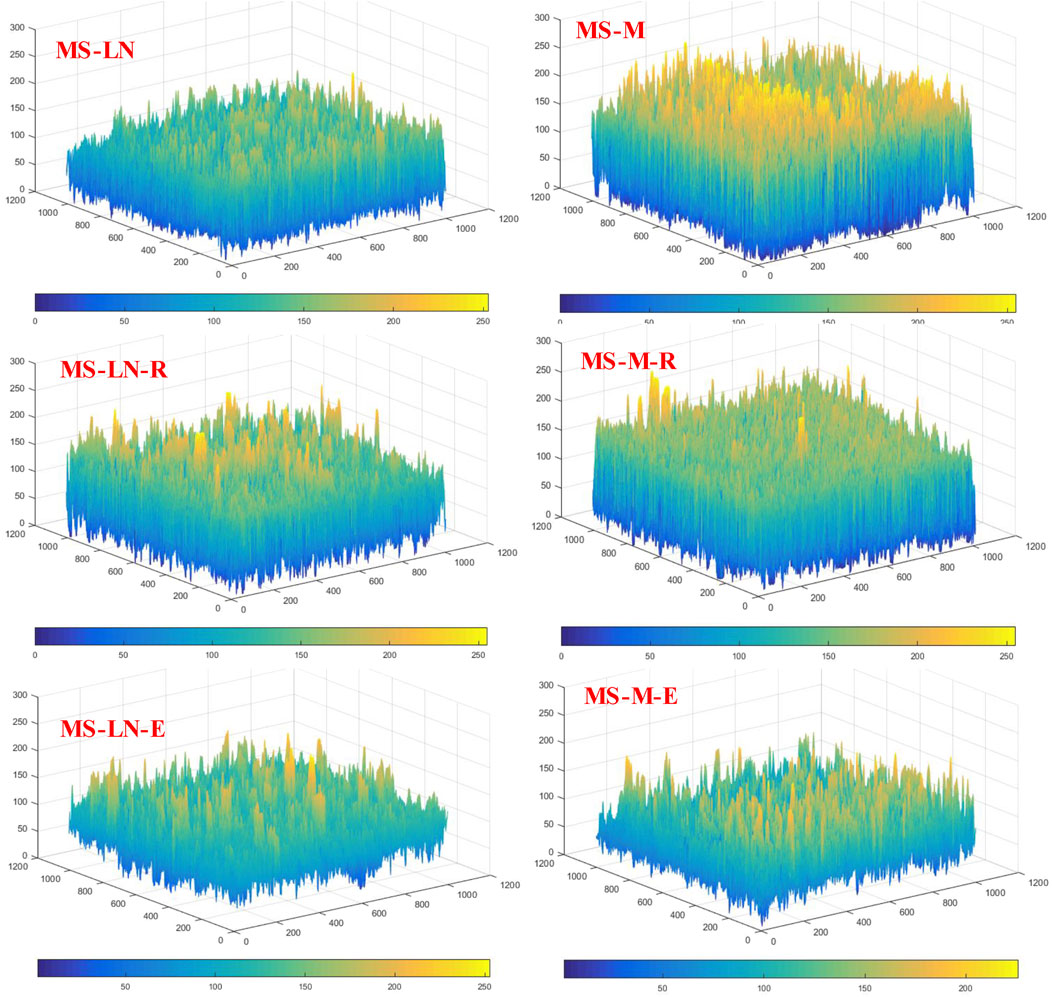
FIGURE 11. 3D hypersurface map of MS constructed by 3D-DTM.
The extreme value in Figure 11 can be depicted in dark blue and yellow, which represent the extremes values (lowest and highest) of F (x, y), respectively. It can be seen that the 3D hypersurface of the two graded MS shows significant differences under the same mixing conditions. The F (x, y) of the low noise gradation was lower than the median graduation, and there is relatively less distribution of the higher F (x, y) in the low noise gradation. More specifically, for MS-M, the height of the bulge is between 150 and 200, while for MS-LN it is mainly between 100 and 150, and the height is more evenly distributed with more micro-texture. The difference between MS-LN-E and MS-M-E is that the bumps are more evenly distributed and concentrated in the latter, which is due to more fine aggregates in the low-noise gradation, resulting in the height of the bump being more evenly distributed on the surface with more micro-texture. In addition, compared to MS with water-based epoxy, the bump distribution is less than MS with rubber powder due to better workability of construction. The above analysis shows that the 3D-DTM in this study can reflect the surface texture characteristics of MS. Therefore, the mean pixel difference Hpixel corresponding to each specimen can be calculated through 3D-DTM, then regression analysis of Hpixel and MTD can be performed based on 18 sets of data, as shown in Figure 12.
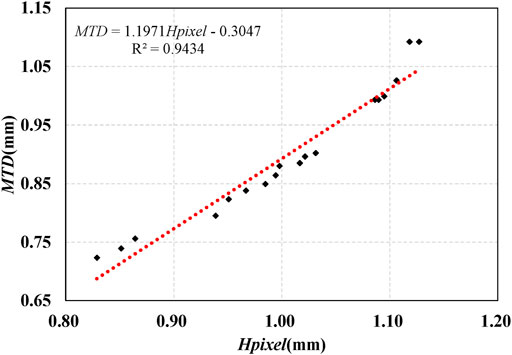
FIGURE 12. The relationship between digital image method and sand patch test results.
As can be seen from Figure 12, there was a dramatic linear model for the Hpixel calculated by the 3D-DTM and the MTD calculated by the sand patch test, with the correlation coefficient R2 = 0.9434. This indicates that the Hpixel calculated by 3D-DTM can accurately represent the actual mean texture depth of MS. This model provides a new detection method for indoor and field detection, which greatly simplifies the detection of MTD in practice. Moreover, the analysis process is easy to operate with computer programming and also conducive to large-scale detection.
The PCD under different CPH was obtained by statistical analysis, as shown in Figure 13.
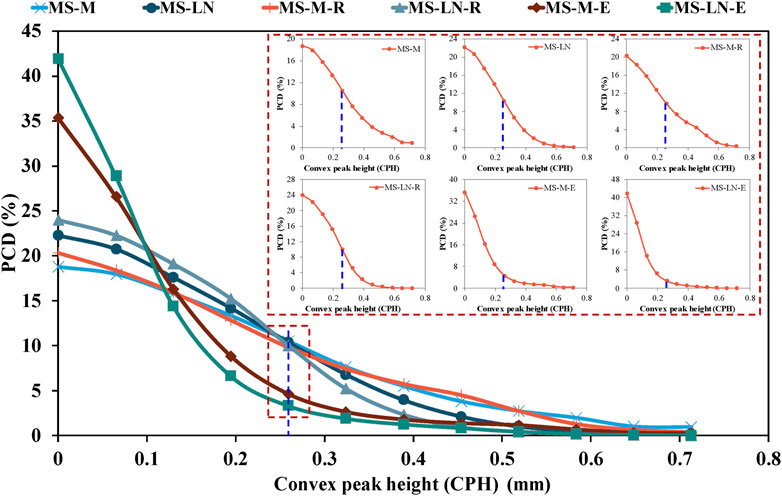
FIGURE 13. The PCD under different CPH.
A linear distribution trend of PCD under different CPH for the median graded MS can be obtained, while the MS with low noise gradation is normally distributed. In addition, it was found that adjusting the gradation can reduce the number of high convex peaks because the increase in the number of low-height convex peaks enriches the meso-texture of MS. On the other hand, the addition of rubber powder-fiber can also increase the meso-texture and decrease the number of high convex peaks.
The texture of MS-M-E or MS-L-E was significantly different from the others, and the PCD curves under different CPHs were closer to power distribution, while the others have a negative exponential distribution, and the surface meso-texture was enriched. It shows that WER can significantly enrich the meso-texture to reduce tire-road noise, which is different from low-noise gradation and rubber powder. Moreover, the number of convex peaks of MS-L-E was further reduced, and the meso-texture became more abundant due to the further reduction of large size aggregates in low-noise gradation.
The above analysis shows that the PCD at different CPH can reveal the surface texture and noise characteristics of MS. In this case, the PCA of each CPH was summed up and the proportions of different MS were further counted then compared with the corresponding noise. Apart from the MS-L-E or MS-M-E, other distribution curves were found to intersect at one point (0.25 mm for CPH), as shown by the blue dashed line (Figure 13). This indicates that the PCD at different CPH varies with the gradation and admixtures but has little effect on the distribution probability of the convex peak at CPH of 0.25 mm, meaning this point can be used as the turning point to classify the height of the higher peak and the lower peak. Theoretically, we can use the PCA with the convex peak height greater than 0.25 mm to establish the relationship with the noise level. In this way, Kh and Kh ≥ 0.25 of each MS specimen were calculated according to Eq. (6), and then the relationship with noise was established, as shown in Figure 14.
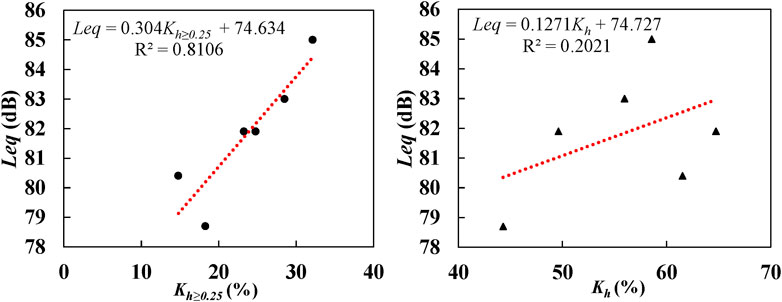
FIGURE 14. The relationship between the PCD and indoor noise.
The fitting results show a linear model between the PCA and the indoor noise based on all heights with a correlation coefficient R2 = 0.2021. However, the correlation coefficient between indoor noise and the Kh ≥ 0.25 was 0.8106, which indicates that Kh ≥ 0.25 can describe the noise of MS.
Combined with the mechanism of noise generation, it can be seen that the large noise of MS-M is due to the reduction of thickness after repeated rolling, and then the large size aggregates on the surface were bulged, which decreases the MTD, while the largest proportion of Kh ≥ 0.25 reduces the impact on the tire. For MS-M-R or MS-L-R, the elasticity of the rubber powder disperses part of the stress on the MS surface, which can reduce the vibration noise. In addition, the rubber powder absorbs noise so that the energy generated by vibration can be consumed to some extent. The small particle size of the MS-LN leads to a decrease in the proportions of Kh ≥ 0.25. The WEA improves the construction workability, MS-L-E or MS-N-E has rich meso-texture and little macro-texture, as well as the proportion of Kh ≥ 0.25 is lower than the others.
Although this research was conducted indoors, the results also reflect the noise and texture characteristics of MS. In particular, the surface was defined by the CPH (0.25 mm) as the critical point and varies in the range of CPH ≥0.25 and CPH <0.25. That is, the coarser gradations, the greater the proportion of higher bulges in the surface texture. Besides, the relationship between noise and Kh ≥ 0.25 can be used to gradation design and material composition design for low-noise MS. More specifically, on the basis of improving the mechanical properties and durability of MS, the design parameters of the mixture can be adjusted to reduce Kh ≥ 0.25 so that high performance and low-noise MS can be obtained.
In this study, the mechanism of five low-noise MS were analyzed and compared based on surface texture and noise tests. A general 3D-DTM was developed by using digital image processing technology, and the evaluation indicators of surface texture and noise for MS were proposed. The main conclusions are as follows:
1) Optimizing the gradation to reduce low-frequency vibration noise, adding sound-absorbing materials, and improving the workability of construction to reduce high-frequency noise, all of which can be used as an effective means to reduce tire-noise of MS. Among them, the MS prepared with sound-absorbing materials and low-noise gradation has the greatest noise reduction effect, with a maximum reduction of 6.3dB(A).
2) The 3D-DTM of MS surface texture constructed by using digital image processing technology can realize the 3D image reconstruction of surface texture. The probability of convex peak distribution (PCD) extracted from the 3D model can well reflect the surface texture of MS. In addition, we also find that the proportion of convex peak area (PCA) with peak heights greater than 0.25 mm (Kh ≥ 0.25) has a significant linear relationship with the tire-road noise, indicating that the meso-texture of MS is a key factor affecting the tire-road noise.
3) The results show that digital image processing techniques are helpful in analyzing pavement texture characteristics. We recommend using the 3D-DTM as an aided tool to optimize the design of low-noise MS.
Digital image technology can characterize the distribution characteristics of MS surface texture. Because the driving noise changes with the effect of vehicle load, subsequent research should consider the changes of texture parameters under different service life to characterize the attenuation characteristics of noise, and establish corresponding mathematical models to provide theoretical support for the construction of sustainable pavement.
The original contributions presented in the study are included in the article/Supplementary Material, further inquiries can be directed to the corresponding author.
WC: methodology, experiment, writing—original draft, writing—review and editing. MZ: conceptualization, supervision, project administration. HW: investigation, experiment, writing—review and editing.
This work was supported by the National Natural Science Foundation of China (Grant No. 52078051), Fundamental Research Funds for the Central Universities (310821163502), the Transportation Department of Shandong Province (Lujiaokeji 2017 28).
HW is employed by the Shandong Hi-Speed Group.
The remaining authors declare that the research was conducted in the absence of any commercial or financial relationships that could be construed as a potential conflict of interest.
Beckenbauer, T., Klein, P., Hamet, J. F., and Kropp, W. (2008). Tyre/road Noise Prediction: A Comparison between the SPERoN and HyRoNE Models ‐ Part 1. The J. Acoust. Soc. America 123 (5), 3388. doi:10.1121/1.2934048
Bennert, T., Hanson, D., and Maher, A. (2005). Influence of Pavement Surface Type on Tire/Pavement Generated Noise. J. Test. Eval. 33 (2), 94–100. doi:10.1520/jte12641
Cai, X., Huang, W., Liang, J., and Wu, K. (2020). Study of Pavement Performance of Thin-Coat Waterborne Epoxy Emulsified Asphalt Mixture. Front. Mater. 7, 88. doi:10.3389/fmats.2020.00088
Cesbron, J., Anfosso-Lédée, F., Yi, H. P., Duhamel, D., and Le Houédec, D. (2008). Influence of Road Texture on Tyre/Road Contact in Static Conditions. Numerical and Experimental Comparison. Road Mater. Pavement Des. 9 (4), 689–710. doi:10.3166/rmpd.9.689-710
Chen, D., Ling, C., Wang, T., Su, Q., and Ye, A. (2018). Prediction of Tire-Pavement Noise of Porous Asphalt Mixture Based on Mixture Surface Texture Level and Distributions. Constr. Building Mater. 173, 801–810. doi:10.1016/j.conbuildmat.2018.04.062
Chen, D., Roohi Sefidmazgi, N., and Bahia, H. (2015). Exploring the Feasibility of Evaluating Asphalt Pavement Surface Macro-Texture Using Image-Based Texture Analysis Method. Road Mater. Pavement Des. 16 (2), 405–420. doi:10.1080/14680629.2015.1016547
Chen, D. (2015). Study on Two Dimension Image-Based Texture Analysis Method and Prediction of Skid-Resistance & Tire/pavement Noise Reduction of HMA. Thesis (PhD). Xi’an, China: Chang’an University. (in Chinese).
Chen, L., Yao, Z., Xiao, W., Yan, X., and Chen, H. (2008). Prediction Model for Tire/road Noise Coupling. Tire Industry, 28 (1), 20–23. doi:10.3969/j.issn.1006-8171.2008.01.004
Chen, Z., Liu, L., and Xv, T. (2016). Relationship between Asphalt Pavement Surface Characteristics and Road Noise. Paper presented at the 16th COTA International Conference of Transportation Professionals, Shanghai, China. doi:10.1061/9780784479896.054
Du, H., Ni, F., Li, S., and Liu, G. (2018). Short-Term Cost-Effectiveness Evaluation of Maintenance Treatments for Asphalt Pavement in Jiangsu, China. Paper presented at the 4th GeoShanghai International Conference on Transportation Geotechnics and Pavement Engineering, Shanghai, China, MAY 27-30. 389–399. doi:10.1007/978-981-13-0011-0_42
El Gendy, A., Shalaby, A., Saleh, M., and Flintsch, G. W. (2011). Stereo-vision Applications to Reconstruct the 3D Texture of Pavement Surface. Int. J. Pavement Eng. 12 (3), 263–273. doi:10.1080/10298436.2010.546858
Fan, X. (2020). Performance Studies of Waterborne Epoxy Resin-SBR Modified Emusified Asphalt and its Micro-surfacingMaster (Master Thesis). Xi'an, China: Chang'an university.
Fang, J., Tu, J., and Wu, K. (2020). Analysis of Skid Resistance and Noise Characteristics for Varieties of Concrete Pavement. Adv. Mater. Sci. Eng. 2020 (1), 1–8. doi:10.1155/2020/7427314
Han, S., Dong, Y., Chen, H., Zhang, D., Lu, X., and Shi, Y. (2005). Noise Reduction Performance of Exposed Aggregate Cement concrete Pavement. J. Traffic Transportation Eng. 5 (2), 32–34. doi:10.3321/j.issn:1671-1637.2005.02.008
Hencken, J., Haas, E., Tulanowski, M., and Bennert, T. (2014). Noise related to pavement preservation surfaces in NJ. London.Taylor and Francis-Balkema, 245–252. doi:10.1061/9780784413586.067
Jae, H., Park, S., and Woo, L. (2015). The Effect of Texture Wavelength on the Tire-Pavement Noise in Asphalt Concrete Pavement. Korean Soc. Road Eng. 17 (1), 1–6. doi:10.7855/JHE.2015.17.1.001
Kogbara, R. B., Masad, E. A., Kassem, E., Scarpas, A., and Anupam, K. (2016). A State-Of-The-Art Review of Parameters Influencing Measurement and Modeling of Skid Resistance of Asphalt Pavements. Construction Building Mater. 114, 602–617. doi:10.1016/j.conbuildmat.2016.04.002
Kuijpers, A., and Blokland, G. V. (2001). Tyre/road noise models in the last two decades: A critical evaluation.,” in Paper presented at the INTER-NOISE and NOISE-CON Congress and Conference Proceedings, The Hague, Netherlands. 27 August 2001.
Li, S., Fan, M., Xu, L., Tian, W., Yu, H., and Xu, K. (2021). Rutting Performance of Semi-rigid Base Pavement in RIOHTrack and Laboratory Evaluation. Front. Mater. 7, 590604. doi:10.3389/fmats.2020.590604
Li, Z., Huang, X., and Chen, G. (2012). Mechanism of High Noise at Micro-surfacing and Multi-Support Denoising Model. J. Highw. Transport. Res. Develop. 29 (01), 1–10. doi:10.3969/j.issn.1002-0268.2012.01.001
Li, Z., Liu, H., Dong, Y., and Wang, Z. (2018). Design and Text Method of Indoor Noise for Micro-Surfacing Mixture. Paper presented at the Transportation Research Congress 2016: Innovations in Transportation Research Infrastructure: Proceedings of the Transportation Research Congress 2016, Beijing, China. June 6–8, 2016. doi:10.1061/9780784481240.025
Liao, G., Sakhaeifar, M. S., Heitzman, M., West, R., Waller, B., Wang, S., et al. (2014). The Effects of Pavement Surface Characteristics on Tire/pavement Noise. Appl. Acoust. 76, 14–23. doi:10.1016/j.apacoust.2013.07.012
Ling, S., Yu, F., Sun, D., Sun, G., and Xu, L. (2021). A Comprehensive Review of Tire-Pavement Noise: Generation Mechanism, Measurement Methods, and Quiet Asphalt Pavement. J. Clean. Prod. 287, 125056. doi:10.1016/j.jclepro.2020.125056
Liu, F., Zheng, M., Fan, X., Li, H., Wang, F., and Lin, X. (2021). Properties and Mechanism of Waterborne Epoxy Resin-SBR Composite Modified Emulsified Asphalt. Construct. Building Mater. 274, 122059. doi:10.1016/j.conbuildmat.2020.122059
Liu, Q., and Shalaby, A. (2017). Relating concrete Pavement Noise and Friction to Three-Dimensional Texture Parameters. Int. J. Pavement Eng. 18 (5), 450–458. doi:10.1080/10298436.2015.1095897
Liu, Y. h. (2016). Research on the Key Technology of Low-Noise Micro-surface Processing Technology. Nanjing, China: Southeast University. doi:10.7666/d.Y3186685
MOT (2019). JTG 3450-2019: Field Test Methods of Highway Subgrade and Pavement. Beijing, China: Ministry of Transport of People's Republic of China.
MOT (2011). JTG E20-2011: Standard Test Methods of Bitumen and Bituminous Mixtures for Highway Engineering. Beijing, China: Ministry of Transport of People's Republic of China.
MOT (2004). JTG F40-2004: Technical Specifications for Construction of Highway Asphalt Pavements. Beijing, China: Ministry of Transport of People's Republic of China.
NCAT (2010). Pavement Test Track Research Findings 2000-2010. Auburn, American: National Center for Asphalt Technology at Au- burn University.
Ning, Z. (2019). Preparation and Performance Evalution of Low Noise Rubber Particle-Fiber Micro-surfacingMaster (Master Thesis). Xi'an, China: Chang'an University.
Peng, B., and Huang, X. (2008). Investigation and Research on Pavement Noise at Micro-surface. J. China Foreign Highw. (04), 66–69. (in Chinese).
Staiano, M. A. (2018). Tire-Pavement Noise and Pavement Texture. J. Transport. Eng. B-Pavements 144 (3), 04018034. doi:10.1061/jpeodx.0000047
Sun, Z., Zhu, Z., Zhang, J., and Wu, C. (2020). Composition Optimization and Field Application of Colored Emulsified Asphalt Seal Mixture. Front. Mater. 7, 258. doi:10.3389/fmats.2020.00258
Wei, D. B., Li, B., Zhang, Z., Han, F., Zhang, X., Zhang, M., et al. (2018). Influence of Surface Texture Characteristics on the Noise in Grooving Concrete Pavement. Appl. Sciences-Basel 8 (11), 2141. doi:10.3390/app8112141
Wei, w. (2016). Study on Performances and Change Laws of the Noise Reduction Micro-surfacing Pavement. Beijing, China: Beijing University of Civil Engineering and Architecture.
Xiao, Y., Wang, F., Cui, P., Lei, L., Lin, J., and Yi, M. (2018). Evaluation of Fine Aggregate Morphology by Image Method and its Effect on Skid-Resistance of Micro-Surfacing. Materials (Basel) 11 (6), 920. doi:10.3390/ma11060920
Keywords: micro-surface, digital image, surface texture, tire/road noise, evaluation, low-noise
Citation: Chen W, Zheng M and Wang H (2021) Evaluating the Tire/Pavement Noise and Surface Texture of Low-Noise Micro-Surface Using 3D Digital Image Technology. Front. Mater. 8:683947. doi: 10.3389/fmats.2021.683947
Received: 22 March 2021; Accepted: 20 May 2021;
Published: 06 July 2021.
Edited by:
Ramadhansyah Putra Jaya, Universiti Malaysia Pahang, MalaysiaReviewed by:
Haryati Yaacob, University of Technology Malaysia, MalaysiaCopyright © 2021 Chen, Zheng and Wang. This is an open-access article distributed under the terms of the Creative Commons Attribution License (CC BY). The use, distribution or reproduction in other forums is permitted, provided the original author(s) and the copyright owner(s) are credited and that the original publication in this journal is cited, in accordance with accepted academic practice. No use, distribution or reproduction is permitted which does not comply with these terms.
*Correspondence: Mulian Zheng, emhlbmdtbEBjaGQuZWR1LmNu
†ORCID: Wang Chen, orcid.org/0000-0003-2445-0869
Disclaimer: All claims expressed in this article are solely those of the authors and do not necessarily represent those of their affiliated organizations, or those of the publisher, the editors and the reviewers. Any product that may be evaluated in this article or claim that may be made by its manufacturer is not guaranteed or endorsed by the publisher.
Research integrity at Frontiers
Learn more about the work of our research integrity team to safeguard the quality of each article we publish.