 Jun-Hong Xu
 Guang-Dong Zhou
 Tai-Yong Zhu2
- 1College of Civil Engineering, Nanjing Forestry University, Nanjing, China
- 2College of Civil and Transportation Engineering, Hohai University, Nanjing, China
- 3Key Laboratory of Large Structure Health Monitoring and Control, Shijiazhuang, China
Fatigue damage accumulations would dramatically reduce the reliability and service life of the orthotropic steel decks. Incorrect fatigue assessment results may be obtained when load sequence effects are omitted. In the present study, fatigue reliability assessments of rib-to-deck weld joints in orthotropic steel bridge decks are conducted with the consideration of load sequence effects. The method, which judiciously considers the fatigue loading history and is derived from the sequential law and the whole-range S-N curve, is first proposed for fatigue reliability calculation. And then, the whole-range S-N curve describing the fatigue propagating process of the rib-to-deck weld joint is introduced. Finally, the developed method is applied to evaluate the fatigue reliability of two rib-to-deck weld joints in an orthotropic steel deck based on long-term measured strain histories. The influence of traffic growth and initial damage on the fatigue reliability is discussed. The results indicate that it is advisable to consider load sequence effects when assessing the fatigue reliability of orthotropic steel decks equipped with long-term strain monitoring systems and the initial damage significantly reduces the fatigue reliability of orthotropic steel decks.
Introduction
The orthotropic steel deck is one of the most popular vehicle-supporting systems and widely used in steel bridges especially in these long-span cable-supported bridges because of its light weight, expedient construction, high load-carrying capacity, and structural redundancy (Heng et al., 2017; Maljaars et al., 2018; Yang et al., 2020). The orthotropic steel deck is typically composed of a thin steel plate strengthened by a series of closely spaced longitudinal ribs and transverse diaphragms (Sim and Uang, 2012). However, the typically different mechanical properties between the longitudinal direction and the transversal direction and tens of thousands of interlaced weld joints make the orthotropic steel deck extremely susceptible to repeated traffic loading and environmental factors (Liu et al., 2020; Saunders et al., 2005). As a result, fatigue cracks in orthotropic steel decks have been frequently reported in Europe, United States, Japan, and China (Fisher and Barsom, 2016). To this end, developing reliable methods for evaluating the fatigue performance of orthotropic steel decks and further making optimal decisions regarding structure replacement and other major retrofits becomes a research Frontier.
The fatigue processes preceding fracture are too complicated and it is still less understood in terms of the cause of formation and failure mechanism. In the past few decades, various simplified approaches have been proposed to assess the fatigue damage in steel bridges. Among them, the Miner’s rule integrating with the S-N curve method is a dominate one (Ye et al., 2014). The Miner’s rule assumes that the fatigue damage induced by a number of repeated stress cycles at a specific stress amplitude is proportional to the total number of stress cycles at that stress amplitude and the total fatigue damage is equal to the linear summation of damage induced by each stress repetition. And the S-N curve describes the relationship between the cyclic stress amplitude, S, and the number of cycles to failure, N. Because of its easy implementation, the Miner’s rule has been adopted in American, European, and Chinese bridge design specifications and employed to investigate the fatigue performance of many existing or novel weld joints in orthotropic steel decks (CEN, 1992; AASHTO, 2012). Luo et al. developed a statistical fatigue damage model incorporating the S-N curve and the Miner’s rule and applied it to the rib-to-deck joints of a steel box-girder bridge (Luo et al., 2017). Cui et al. investigated the influence of asphalt pavement conditions on the fatigue damage of deck-to-rib joints in orthotropic steel decks using the S-N curve method (Cui et al., 2018). Guo et al. compared the fatigue performance of cracked and uncracked orthotropic steel decks strengthened by glass fiber-reinforced polymer angles using the Miner’s rule (Guo et al., 2019; Guo et al., 2020). Fang et al. discussed the influence of the deck plate thickness and the weld foot length on the fatigue failure of double-sided weld joints in orthotropic steel bridge decks by the S-N method (Fang et al., 2020). Ma and Zhang conducted fatigue damage assessments of the weld joints for orthotropic steel bridge decks with the consideration of foundation scour of the bridge, in which the Miner’s rule is adopted to calculated the accumulated fatigue damage under the traveling trucks (Ma and Zhang, 2020). Di et al. evaluated the fatigue performance of typical weld joints in orthotropic steel decks under actual traffic flows based on the Miner’s rule and the S-N curves, including the deck-to-rib weld joint, the rib-to-diaphragm weld joint, and the cut-outs joint of the diaphragm (Di et al., 2020).
Although the Miner’s rule is commonly used to calculate the fatigue damage in orthotropic steel decks. However, it argues that the fatigue damage caused by a stress cycle is independent of where it occurs in the load history and ignores the load sequence effect. In consequence, fatigue damages may be under- or overestimated when variable amplitude loading is applied (Zakaria et al., 2016). This may be one of the main reasons why fatigue cracks have been found frequently in orthotropic steel decks only a few years after bridges were opened to traffic. Thus, a variety of improvements have been made to overcome the shortcomings of the Miner’s rule. The sequential law, which estimates the fatigue damage induced by present fatigue stress amplitudes based on prior fatigue conditions and can precisely capture the load sequence effect, is a distinguished one (Mesmacque et al., 2005). Siriwardane et al. applied the sequential law to evaluate the fatigue performance and predict the remaining fatigue life of an existing railway bridge based on field measured stress histories (Siriwardane et al., 2007; Siriwardane et al., 2008; Siriwardane et al., 2010; Karunananda et al., 2012). Aid et al. examined the capability of the sequential law in evaluating the fatigue damages of mechanical components under random loading histories using fatigue test data (Aid et al., 2011; Aid et al., 2012). All these research work demonstrated that the sequential law gives more realistic results than Miner’s rule when structures are subjected to variable amplitude loading.
In the service stage of the orthotropic steel deck, vehicles with different weights pass in a random way. As a result, almost all fatigue stress amplitudes in the orthotropic steel deck are different from each other, which shows typical variable-amplitude features. Therefore, it is significant to take the load sequence effects into account when computing the fatigue damage. In this paper, the fatigue reliability of rib-to-deck weld joints in orthotropic steel decks is assessed based on long-term field monitoring stress histories, in which the fatigue damage is calculated by the sequential law so that the load sequence effects could be reasonably considered. The remainder of the paper is organized as follows: Firstly, the methodology for fatigue reliability assessment considering the load sequence effects is presented. Secondly, an application of the developed fatigue reliability assessment method in two rib-to-deck weld joints located on the downstream side and upstream side of the orthotropic steel decks is provided. Finally, conclusions are drawn.
Methodology for Fatigue Reliability Assessment
The core work of fatigue reliability assessment is the calculation of fatigue damages in orthotropic steel bridge decks. As mentioned above, the lack of consideration on the load sequence effect may induce incorrect fatigue damages under the variable amplitude loading condition. On the contrary, the sequential law allows us to take into account the loading history and to correctly compute the fatigue damage in the orthotropic steel decks. In this section, the sequential law will be briefly described and the method assessing fatigue reliability based on the sequential law will be introduced.
Fatigue Damage Calculation
The sequential law defines the damage stress as the stress corresponding to, on the whole-range S-N curve (also named as the fully known Wöhler curve), the instantaneous residual life and the damage stress goes to the ultimate stress at the last cycle before failure (Mesmacque et al., 2005). It is supposed that a weld joint in the orthotropic steel deck is subjected to a certain stress amplitude
where
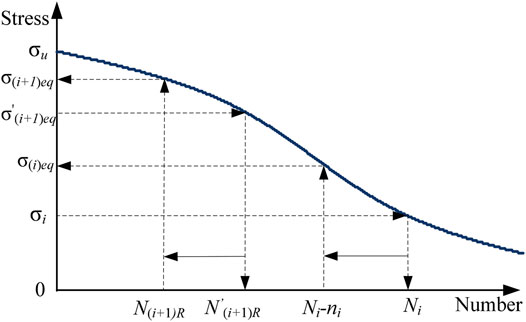
FIGURE 1. Schematic representation of parameters in the whole-range S-N curve.
Then, the damage is transferred to the beginning of applying the
where
By using the whole-range S-N curve again, the equivalent fatigue life
Finally, the damage indicator becomes
where
The fatigue damage could be calculated by iteration if a series of cyclic loading is applied. The flow chart of the sequential law is shown in Figure 2.
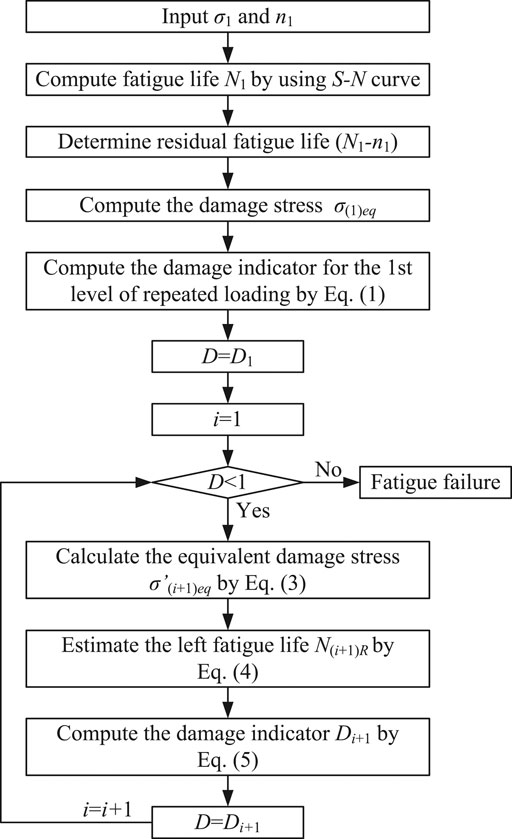
FIGURE 2. Flowchart for damage calculation using the sequential law.
Whole-Range S-N Curve
From the description of the sequential law, it can be seen that the practice of model to obtain the remaining fatigue lives completely depends on an appropriate whole-range S-N curve. In traditional fatigue problems of steel bridges, only these cyclic stress amplitudes in the finite life region are taken into account, and these cyclic stress amplitudes lower than the constant amplitude fatigue threshold and these cyclic stress with extremely high amplitudes are ignored. Hence, only the S-N curves in the finite life region is provided in bridge design specifications. For the fatigue damage in the orthotropic steel deck, all cyclic stress amplitudes should be considered since weld flaws and initial cracks inevitably lead to the propagation of fatigue cracks. It becomes important to extend the partially known S-N curve to the whole-range S-N curve covering the very low-cycle region, the low-cycle region, the finite life region, the high-cycle region, and the very high-cycle region.
The partially known S-N curve in bridge design specifications can be formulated by the well-known Basquin function, which is
where
The above equation can be rewritten as
where
By extending the S-N curve from the finite life region to the very high-cycle region (i.e.,
where
If the coefficient
By using about 400 fatigue test records, the fitted whole-range S-N curve of the rib-to-deck weld joint is (Zhou et al., 2018)
With consideration of the requirement of high reliability for rib-to-deck weld joints, the whole-range S-N curve with a 97.5% survival limit is formulated as
Fatigue Reliability Calculation
When the sequential law is applied to compute the fatigue damage, the limit state function for fatigue failure is defined as
where
The failure probability
where
Then, the fatigue reliability index
where
The sequential law computes the damage indicator according to the loading history, which is generally represented by a series of stress amplitudes
where
Application
Long-Term Strain Monitoring
The developed method is applied to a steel box-girder cable-stayed bridge with a main span of 406 m. The orthotropic steel deck is employed to support the vehicle flow. The dynamic stain of rib-to-deck weld joints located on the downstream side and upstream side of the middle-span section of the steel-box girder is long-term monitored by two tri-axial strain sensors. The layout of strain sensors is shown Figure 3. In the figure, RDd and RDu represent the strain sensors used to measure the strain of the rib-to-deck weld joints in the downstream side and upstream side, respectively. The two monitored rib-to-deck weld joints are typically below fast lanes, on which cars and trucks pass frequently. Strain monitored data from 2007 to 2010 are used to assess the fatigue reliability of the two rib-to-deck weld joints.
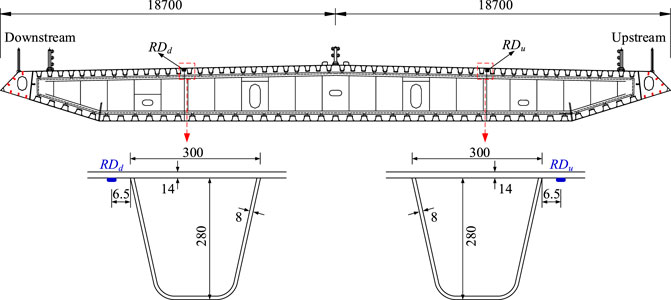
FIGURE 3. Layout of strain sensors on the orthotropic steel deck (Unit: mm).
Calculation of Equivalent Fatigue Loading Effects
As known, the stress in the transversal direction governing the fatigue life of the rib-to-deck weld joint. The strain measured in this direction is hence employed to analyze. Typical daily strain time histories measured by sensor RDd and sensor RDu are plotted in Figure 4. It can be seen that vehicles induce notable cyclic stress amplitudes, which undoubtedly reduce the durability of rib-to-deck weld joints. From the two figures, it can be found that the mean strain changes with time, which indicates that structural temperatures have great influence on the measured mean strain. According to the principle of the rainflow cycle counting method, the mean strain may cause the calculated fatigue stress amplitude to deviate from the real value. Therefore, the wavelet transfer method is adopted to remove the thermal strain from the strain time history. The processed strain is converted into stress by Young’s modulus of steel. A stress concentration factor obtained from the finite element model is used to adjust the stress difference between the measured point and the weld joint.
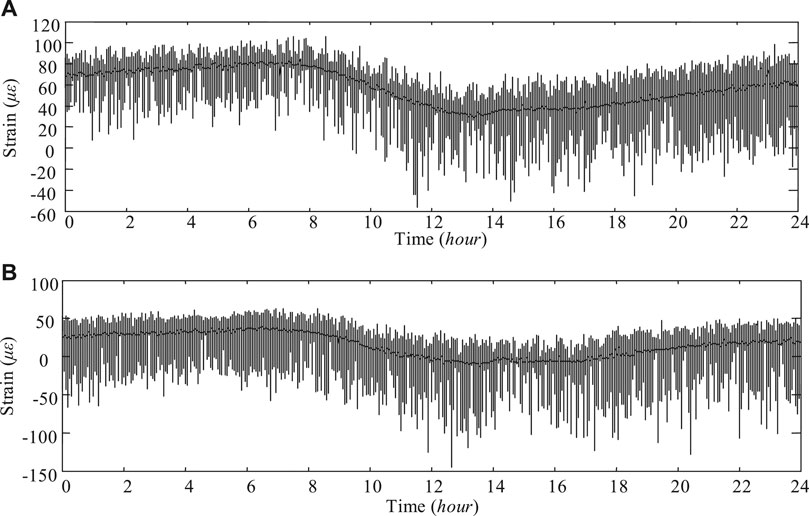
FIGURE 4. Typical daily strain time histories: (A) Sensor RDd, (B) Sensor RDu.
The rainflow cycle counting method is employed to extract the fatigue stress amplitude and cycle number from the stress time histories. Here, the influence of the average stress on the fatigue damage is ignored. The sequential law computes the fatigue damage induced by the present cyclic stress based on the previous fatigue damage. This process is performed in an iteration manner. Figure 4 shows that there are thousands of cycles within a day. The iteration may spend unaccepted time if measured strain data in several years are investigated. In this sense, it is assumed that the daily fatigue damage yields the linear accumulation model. As a consequence, the daily variable fatigue amplitudes and cycles can be replaced by a constant stress amplitude with a number of cycles based on the Miner’s rule and the S-N curve recommended in design codes.
In Eurocode (CEN, 1992), the S-N curve of the rib-to-deck weld joint is modeled by
where
Because of initial defects in weld joints, all cyclic stress amplitudes should be considered. The fatigue damage in the rib-to-deck weld joint is
where
It should be noted that most welded joints contain initial damages produced during fabrication. Although the initial damages may initially be small and not affected by these stress amplitudes lower than the constant amplitude fatigue limit, these stress amplitudes higher than the constant amplitude fatigue limit in the applied loading history may propagate the damage, and as the damage size increases it will be propagated by these stress amplitudes lower than the constant amplitude fatigue limit. The concept of a constant amplitude fatigue limit is therefore not appropriate. And all stress amplitudes are taken into account (Tong et al., 2008). Therefore, the equivalent stress amplitude
By taking 24 h as the basic time interval, the daily equivalent stress amplitude and cycle number can be computed by Eqs. 20 and 21 and are displayed in Figure 5. From the figure, it can be found that the daily equivalent stress amplitudes in the downstream side show similar variation patterns with that in the upstream side. Most of daily equivalent stress amplitudes are in the range of [15 25]. However, for the daily equivalent cycle number, the values in the upstream side are larger than that in the downstream side most of the time. The results imply that there may be larger fatigue damage in the rib-to-deck weld joint in the upstream side and more attention should be paid on the upstream side during the routine inspections and maintenances. It is also demonstrated that the residual fatigue life in rib-to-deck weld joints are unique even on symmetrical locations of a steel-box girder.
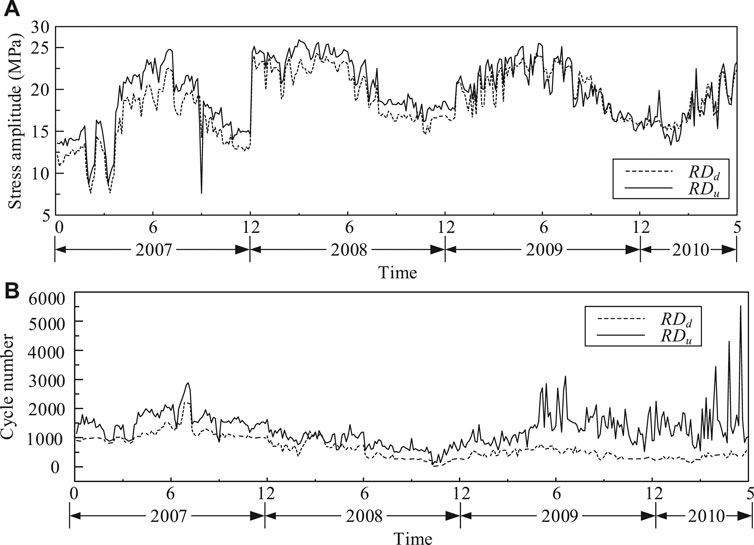
FIGURE 5. The daily equivalent stress amplitude and cycle number: (A) Daily equivalent stress amplitude, (B) Daily equivalent cycle number.
Statistical Model of Equivalent Fatigue Loading Effect
It can be seen, from Figure 5, that both the daily equivalent stress amplitude and cycle number are highly random, and the value varies from day to day in the 4 years. Therefore, it is reasonable to describe their characteristics through statistical models. To this end, the probability distribution histograms of the four random variables are plotted in Figures 6, 7. Since cars and trucks with different weights pass in this lane, the multi-peak distribution features can be easily found in the four figures. Classical statistical models with a single peak are incapable of capturing their randomness. A generalized mixed distribution (GMD) formulated by Eq. 22 is proposed in this study.
where
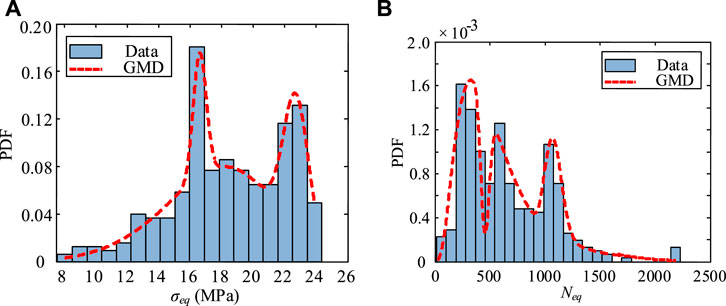
FIGURE 6. The statistical characteristics of equivalent fatigue loading effects in the downstream side: (A) Daily equivalent stress amplitude, (B) Daily equivalent cycle number.
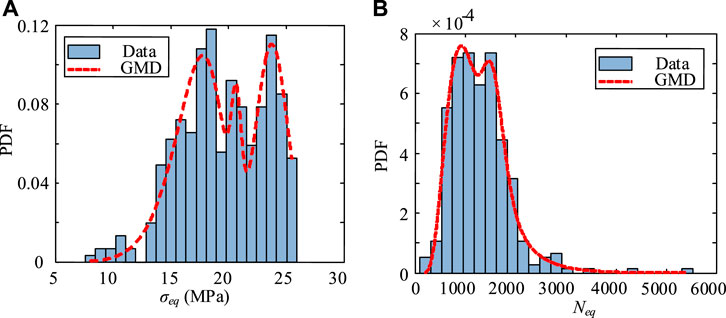
FIGURE 7. The statistical characteristics of equivalent fatigue loading effects in the upstream side: (A) Daily equivalent stress amplitude, (B) Daily equivalent cycle number.
The expectation–maximization (EM) algorithm is adopted to estimate parameters in GMD models (Moon, 1996). The EM iteration alternates between performing an expectation (E) step and a maximization (M) step. The E step creates a function for the expectation of the log-likelihood function evaluated using the current estimate for the parameters; and the M step computes parameters maximizing the expected log-likelihood function found in the E step. These parameters estimated in the M step are then used to determine the distribution of the latent variables in the next E step. The Akaike information criterion and Bayesian information criterion are employed to determine the optimal number of components.
The estimated PDFs for the daily equivalent stress amplitude and cycle number in downstream side and upstream side are shown in Figures 6, 7. The parameters of estimated PDFs are listed in Table 1 and Table 2. In the two tables,
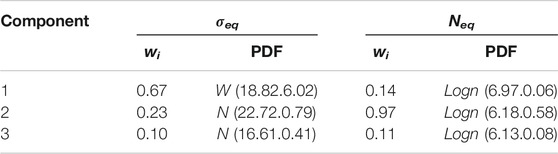
TABLE 1. The statistical model of equivalent fatigue loading effects in the downstream side.
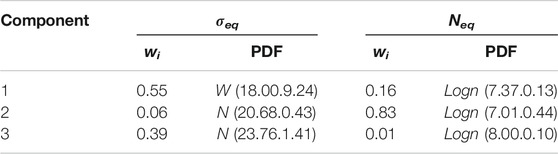
TABLE 2. The statistical model of equivalent fatigue loading effects in the upstream side.
Fatigue Reliability Calculation
According to the statistical model of equivalent fatigue loading effects in Tables 1, 2, the Monte Carlo method is employed to generate time histories of daily equivalent stress amplitudes and cycle numbers. The sampling number for reliability calculation follows the criterion in Eq. 15. The damage indicator in Eq. 1 is adopted to describe the fatigue damage in the rib-to-deck weld joint. As known, the traffic growth rate α is an important factor governing the fatigue reliability. In this study, the yearly traffic growth is modeled by the increase of the daily equivalent cycle number.
Figure 8 displays the variation of the fatigue reliability index with time. The fatigue reliability indexes of rib-to-deck weld joints both in the upstream side and downstream side show a general decreasing tendency with the increase of the service life. Furthermore, the fatigue reliability indexes notably decrease when considering the traffic growth. In the service life of 100 years, all the values are higher than the generally used target reliability index
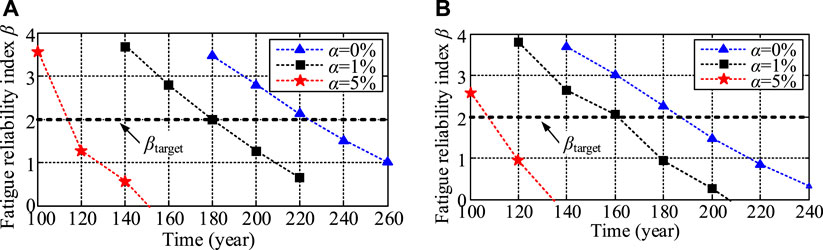
FIGURE 8. The fatigue reliability index integrating traffic growth: (A) Downstream side, (B) Upstream side.
In practical engineering, weld flaws will inevitably produce initial damages in the weld joint. It is supposed that there are 1% initial damages in the rib-to-deck weld joint. The change of the fatigue reliability index in the rib-to-deck weld joint with time is plotted in Figure 9. It can be found that, when the 1% initial damage is taken into account, the fatigue reliability index decreases sharply. In the service life of 100 years, the fatigue reliability indexes of rib-to-deck weld joints both in the upstream side and downstream side are less than 2 even if there is no traffic growth. It is deduced that the fatigue reliability of the rib-to-deck weld joint is very sensitive to the initial damage. Developing effective welding techniques to reduce weld flaws and thereby reduce initial damage is an effective way to avoid fatigue cracks in orthotropic bridge decks. Furthermore, manual on-site inspection is necessary. If the propagation of the fatigue crack is found, FRP reinforcement, steel plate reinforcement, and other reinforcement methods should be used to enhance the fatigue strength.
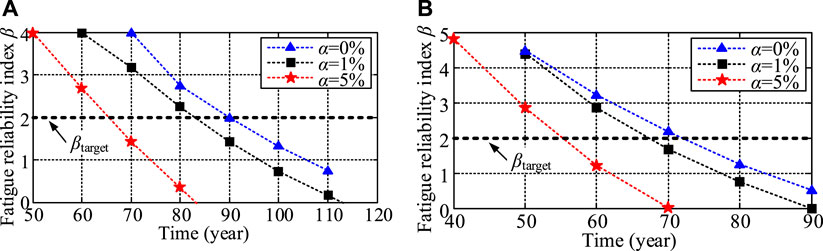
FIGURE 9. The fatigue reliability index integrating initial damage: (A) Downstream side, (B) Upstream side.
It is worth noting that from the point of view of the Miner’s rule, 1% of the initial damage will only shorten the service life by 1%, which is not consistent with the real case that fatigue cracks have been found in many orthotropic steel decks with a design life of 100 years after only a few years or more than 10 years of service. The necessity of considering load sequence effects is proved.
Conclusion
Fatigue reliability assessment is an indispensable issue when investigating the serviceability of long-span bridges equipped with orthotropic steel decks. These methods regardless of load sequence effects may cause unacceptable errors. In this paper, the sequential law, which calculates the fatigue damage induced by cyclic stress histories in an iterative manner, is introduced to calculate the fatigue damage and assess the fatigue reliability of orthotropic steel decks. The following conclusions can be drawn:
1) The sequential law quantifies the fatigue damage caused by present cyclic stress amplitudes based on previous fatigue damage by iteration calculation and has the capability of capturing the loading sequence effect. The whole S-N curve developed by extending the S-N curve in the finite life region can describes the fatigue propagation process in the very low-cycle region, the low-cycle region, the finite life region, the high-cycle region, and the very high-cycle region.
2) The developed GMD, which is formulated by the weighted sum of several classical distributions, integrating the EM algorithm is capable of describing any complex multi-peak distribution. The daily equivalent stress amplitude and cycle number show typical multi-peak distribution features. The daily equivalent stress amplitude yields the weighted sum of one Weibull distribution and two Gaussian distributions; and the daily equivalent cycle number yields the weighted sum of three lognormal distributions.
3) If there is no initial damage, even if the traffic volume increases by 5%, the fatigue reliability indexes of rib-to-deck weld joints both in the upstream side and downstream side are greater than 2 in the service life of 100 years. However, even if only 1% of the initial damage exists, the fatigue reliability cannot meet the design requirements. The fatigue reliability of the rib-to-deck weld joint is extremely susceptible to the initial damage.
Only the application of the proposed method in evaluating the fatigue reliability of rib-to-deck weld joints is provided in this paper. The proposed method can also be used to evaluate the fatigue reliability of other types of weld joints in the orthotropic steel deck.
Data Availability Statement
The original contributions presented in the study are included in the article/Supplementary Material, further inquiries can be directed to the corresponding author.
Author Contributions
J-HX wrote and revised the whole manuscript. G-DZ proposed the fatigue reliability assessment method. T-YZ performed the application of the developed method.
Funding
This research work was jointly supported by the Natural Science Fund for Excellent Young Scholars of Jiangsu Province (Grant No. BK20170097), the Natural Science Fund of Jiangsu Province (Grant No. BK20180776), the Natural Science Foundation of the Jiangsu Higher Education Institutions (Grant No. 18KJB560013), Science and Technology Project of Housing and Urban Rural Development Department (Grant No. 2018-K9-068), and the Research Fund of Key Laboratory of Large Structure Health Monitoring and Control (Grant No. KLLSHMC1912).
Conflict of Interest
The authors declare that the research was conducted in the absence of any commercial or financial relationships that could be construed as a potential conflict of interest.
References
Aid, A., Amrouche, A., Bouiadjra, B. B., Benguediab, M., and Mesmacque, G. (2011). Fatigue Life Prediction under Variable Loading Based on a New Damage Model. Mater. Des. 32 (1), 183–191. doi:10.1016/j.matdes.2010.06.010
Aid, A., Bendouba, M., Aminallah, L., Amrouche, A., Benseddiq, N., and Benguediab, M. (2012). An Equivalent Stress Process for Fatigue Life Estimation under Multiaxial Loadings Based on a New Non Linear Damage Model. Mater. Sci. Eng. A 538, 20–27. doi:10.1016/j.msea.2011.12.105
CEN (1992). Eurocode 3: Design of Steel Structures, Part 1–9: Fatigue. Brussels, Belgium: European Committee for Standardization.
Cui, C., Zhang, Q., Hao, H., Li, J., and Bu, Y. (2018). Influence of Asphalt Pavement Conditions on Fatigue Damage of Orthotropic Steel Decks: Parametric Analysis. J. Bridge Eng. 23 (12), 04018093. doi:10.1061/(asce)be.1943-5592.0001313
Di, J., Ruan, X., Zhou, X., Wang, J., and Peng, X. (2020). Fatigue Assessment of Orthotropic Steel Bridge Decks Based on Strain Monitoring Data. Eng. Struct. 228, 111437.
Fang, Z., Ding, Y., Wei, X., Li, A., and Geng, F. (2020). Fatigue Failure and Optimization of Double-Sided Weld in Orthotropic Steel Bridge Decks. Eng. Fail. Anal. 116, 104750. doi:10.1016/j.engfailanal.2020.104750
Fisher, J. W., and Barsom, J. M. (2016). Evaluation of Cracking in the Rib-To-Deck Welds of the Bronx–Whitestone Bridge. J. Bridge Eng. 21 (3), 04015065. doi:10.1061/(asce)be.1943-5592.0000823
Frangopol, D. M. (2008). Probability Concepts in Engineering: Emphasis on Applications to Civil and Environmental Engineering. Struct. Infrastructure Eng. 4, 413–414. doi:10.1080/15732470802027894
Guo, T., Liu, J., Deng, Y., and Zhang, Z. (2019). Fatigue Performance of Orthotropic Steel Decks with FRP Angles: Field Measurement and Numerical Analysis. J. Perform. Constructed Facil. 33 (4), 04019042. doi:10.1061/(asce)cf.1943-5509.0001308
Guo, T., Liu, Z., Correia, J., and de Jesus, A. M. P. (2020). Experimental Study on Fretting-Fatigue of Bridge Cable Wires. Int. J. Fatigue 131, 105321. doi:10.1016/j.ijfatigue.2019.105321
Heng, J., Zheng, K., Gou, C., Zhang, Y., and Bao, Y. (2017). Fatigue Performance of Rib-To-Deck Joints in Orthotropic Steel Decks with Thickened Edge U-Ribs. J. Bridge Eng. 22 (9), 04017059. doi:10.1061/(asce)be.1943-5592.0001095
Karunananda, K., Ohga, M., Dissanayake, R., Siriwardane, S., and Chun, P.-J. (2012). New Combined High and Low-Cycle Fatigue Model to Estimate Life of Steel Bridges Considering Interaction of High and Low Amplitudes Loadings. Adv. Struct. Eng. 15 (2), 287–302. doi:10.1260/1369-4332.15.2.287
Liu, Y., Zhang, H., Liu, Y., Deng, Y., Jiang, N., and Lu, N. (2017). Fatigue Reliability Assessment for Orthotropic Steel Deck Details under Traffic Flow and Temperature Loading. Eng. Fail. Anal. 71, 179–194. doi:10.1016/j.engfailanal.2016.11.007
Liu, Y., Zhang, Q., Bao, Y., and Bu, Y. (2020). Fatigue Behavior of Orthotropic Composite Deck Integrating Steel and Engineered Cementitious Composite. Eng. Structures. 220, 111017. doi:10.1016/j.engstruct.2020.111017
Luo, Y., Yan, D.-h., Yuan, M., and Lu, N.-w. (2017). Probabilistic Modeling of Fatigue Damage in Orthotropic Steel Bridge Decks under Stochastic Traffic Loadings. J. Highw. Transp. Res. Dev. (English Ed.) 11 (3), 62–70. doi:10.1061/jhtrcq.0000582
Ma, X., and Zhang, W. (2020). Fatigue Life of Weldment Details of Existing Orthotropic Steel Bridge Considering the Scour Effects. J. Bridge Eng. 25 (10), 04020078. doi:10.1061/(asce)be.1943-5592.0001612
Maljaars, J., Bonet, E., and Pijpers, R. J. M. (2018). Fatigue Resistance of the Deck Plate in Steel Orthotropic Deck Structures. Eng. Fracture Mech. 201, 214–228. doi:10.1016/j.engfracmech.2018.06.014
Mesmacque, G., Garcia, S., Amrouche, A., and Rubiogonzalez, C. (2005). Sequential Law in Multiaxial Fatigue, a New Damage Indicator. Int. J. Fatigue 27 (4), 461–467. doi:10.1016/j.ijfatigue.2004.08.005
Moon, T. K. (1996). The Expectation-Maximization Algorithm. IEEE Signal. Process. Mag. 13 (6), 47–60. doi:10.1109/79.543975
Saunders, J., Chen, Y., Marks, J. A., Hodgson, I., Sause, R., and Kozy, B. M. (2021). Finite-Element Fatigue Analysis of a New Rib-To-Floor Beam Connection for Orthotropic Steel Decks. J. Bridge Eng. 26 (2), 04020123. doi:10.1061/(asce)be.1943-5592.0001676
Sim, H.-B., and Uang, C.-M. (2012). Stress Analyses and Parametric Study on Full-Scale Fatigue Tests of Rib-to-Deck Welded Joints in Steel Orthotropic Decks. J. Bridge Eng. 17 (5), 765–773. doi:10.1061/(asce)be.1943-5592.0000307
Siriwardane, S. A. S. C., Ohga, M., Dissanayake, P. B. R., and Kaita, T. (2010). Structural Appraisal-Based Different Approach to Estimate the Remaining Fatigue Life of Railway Bridges. Struct. Health Monit. 9 (4), 323–339. doi:10.1177/1475921710361320
Siriwardane, S. C., Ohga, M., Dissanayake, R., and Taniwaki, K. (2007). Different Approaches for Remaining Fatigue Life Estimation of Critical Members in Railway Bridges. Steel Structures 7, 263–276.
Siriwardane, S., Ohga, M., Dissanayake, R., and Taniwaki, K. (2008). Application of New Damage Indicator-Based Sequential Law for Remaining Fatigue Life Estimation of Railway Bridges. J. Constructional Steel Res. 64 (2), 228–237. doi:10.1016/j.jcsr.2007.06.002
Tong, G., Aiqun, L., and Jianhui, L. (2008). Fatigue Life Prediction of Welded Joints in Orthotropic Steel Decks Considering Temperature Effect and Increasing Traffic Flow. Struct. Health Monit. 7 (3), 189–202.
Yang, H., Wang, P., and Qian, H. (2020). Fatigue Behavior of Typical Details of Orthotropic Steel Bridges in Multiaxial Stress States Using Traction Structural Stress. Int. J. Fatigue. 141, 105862. doi:10.1016/j.ijfatigue.2020.105862
Ye, X. W., Su, Y. H., and Han, J. P. (2014). A State-of-The-Art Review on Fatigue Life Assessment of Steel Bridges. Math. Probl. Eng. 2014, 1–13. doi:10.1155/2014/956473
Zakaria, K. A., Abdullah, S., Abdullah, S., and Ghazali, M. J. (2016). A Review of the Loading Sequence Effects on the Fatigue Life Behaviour of Metallic Materials. Jestr. 9 (5), 189–200. doi:10.25103/jestr.095.30
Keywords: steel bridge, orthotropic steel deck, rib-to-deck weld joint, fatigue reliability assessment, whole-range S-N curve
Citation: Xu J-H, Zhou G-D and Zhu T-Y (2021) Fatigue Reliability Assessment for Orthotropic Steel Bridge Decks Considering Load Sequence Effects. Front. Mater. 8:678855. doi: 10.3389/fmats.2021.678855
Received: 11 March 2021; Accepted: 03 May 2021;
Published: 14 May 2021.
Edited by:
Gangbing Song, University of Houston, United StatesCopyright © 2021 Xu, Zhou and Zhu. This is an open-access article distributed under the terms of the Creative Commons Attribution License (CC BY). The use, distribution or reproduction in other forums is permitted, provided the original author(s) and the copyright owner(s) are credited and that the original publication in this journal is cited, in accordance with accepted academic practice. No use, distribution or reproduction is permitted which does not comply with these terms.
*Correspondence: Guang-Dong Zhou, zhougd@hhu.edu.cn