- 1Department of Civil Engineering, Hefei University of Technology, Hefei, China
- 2Anhui Engineering Research Center for Civil Engineering Disaster Prevention and Mitigation, Hefei, China
- 3Anhui Engineering Laboratory for Infrastructural Safety Inspection and Monitoring, Hefei, China
- 4Anhui Transportation Holding Group Co., LTD, Hefei, China
In this paper, the novel gradient concrete is innovatively applied to the bridge towers of Chizhou Yangtze River Bridge to solve the cracking and insufficient durability problems of concrete towers. Fiber-reinforced concrete is used in the outer functional area of the bridge tower, to significantly improve its crack resistance during construction and service. Moreover, the integrated design of anti-cracking and mechanical properties of tower materials is achieved. To study the performance of the novel functional gradient concrete (FGC) tower, the mechanical properties of the FGC tower material are tested, and the overall finite element stress is analyzed. Based on the material properties, the mechanical behavior of the cable-stayed bridge tower is studied. The temperature and stress of the FGC tower during the generation of the hydration heat are compared with that of the ordinary concrete tower. The crack resistance of the FGC tower is analyzed by the finite element method. The results show that the FGC tower has good mechanical properties and durability for the cable-stayed bridge towers.
Introduction
As a critical component of cable-stayed bridges, towers need to improve their mechanical properties to resist cracks during construction and service life. However, construction cracking problems commonly exist in concrete towers due to the influence of traditional concrete materials, structural performance limitations, and harsh construction environments. These problems further lead to tower quality deficiency and reduce safety, applicability, and durability in service.
In recent years, with the development of material technology, high-performance materials have been increasingly used in bridge towers. Okamoto and Nakamura (2011) proposed a novel hybrid high tower using concrete-filled steel tubes for multi-span cable-stayed bridges. Son and Lee (2011) compared hollow steel box performance and concrete-filled composite towers subjected to the blast load. They concluded that concrete-filled composite towers show superior properties. Amiri and Nakamura (2015) found that the RC and hybrid tower have better seismic performance than the steel tower. Shao et al. (2018) designed a new three-tower with unequal-size fans to improve the overall stiffness of cable-stayed bridges.
Due to its low cost and simple maintenance, concrete is a common material frequently used in long-span bridge towers. Many researchers have been exploring to improve the performance of concrete. More recently, the FGM application in concrete has attracted more and more attention. According to engineering requirements, the FGM selects materials with different properties and adopts advanced composite technology. The properties and functions of this kind of material change along with the thickness. Concrete components are usually faced with various service conditions, which require that the properties of materials vary with the position of the components. Therefore, some scholars have applied the design ideas of the FGM to engineering materials and structures. Maalej et al. (2003) found that FGC beams have significantly higher corrosion resistance than traditional reinforced concrete beams. Wen et al. (2013) studied protective layer thickness on structural durability in FGC systems. The experimental results showed that the durability of the structure can be significantly improved when the thickness of the protective layer is 10 mm. Herrmann and Sobek (2015) proposed a design method to minimize the mass of FGC. components. Strieder et al. (2018) constructed a simplified mass concrete structure model and found that the gradient concrete can reduce cracking risk during hardening. Kovaleva et al. (2019) used the FGC shell in Rosenstein Pavilion and found that the FGC material application can reduce the weight of structural components. Chan et al. (2020) studied the influences of aggregate type, reinforcement layer thickness, fiber content, and other variables on the mechanical properties of the FGC. Torelli et al. (2020) reviewed the design objectives, manufacturing techniques, and challenges of FGC materials in recent years.
Based on the previous studies, the main performance enhancement of FGC materials can be summarized as follows: 1) it minimizes the self-weight of concrete structures without reducing its bearing capacity (Nes and Øverli, 2016; Herrmann and Sobek, 2017; Kiryu et al., 2018); 2) compared with the ordinary concrete, the FGC application improves the durability and cracks resistance (Mohamed and Victor, 1995; Roesler et al., 2007; Li and Xu, 2009; Xu and Li, 2009; Dias et al., 2010; Park et al., 2010; Sridhar and Prasad, 2019); 3) mechanical properties of concrete structures can be improved (Miyamoto et al., 1997; Han et al., 2016; Craveiro et al., 2017; Chan et al., 2020).
Given the severe construction cracking, and the lack of durability of cable-stayed bridge concrete towers, the FGC is innovatively applied to the towers based on the Chizhou Yangtze River Bridge. The researches in this paper improve the traditional method of designing concrete materials that regard strength as the core. Moreover, the integrated design of mechanical properties and durability of the tower is achieved. The effects of functionally gradient concrete layers on the mechanical properties and hydration heat effects of the tower are studied systematically. Refined finite element (FE) models are constructed to demonstrate the mechanical behaviors of the novel gradient concrete. The deformation and stress are close in the FGC model and the ordinary concrete model. There is no noticeable stress concentration appear. The difference in hydration heat and damage factors between the FGC and ordinary concrete tower models are also discussed. The temperature and stress of the FGC tower are higher than that of the ordinary concrete tower during the generation of the hydration heat. In the crack damage simulations, the FGC performs better than the ordinary concrete, and the durability of the FGC tower may be benefited by this.
Mechanical Property Tests of the FGC Material
To achieve the FGC material, a layer of 30 cm-thick white fiber high-performance concrete is installed on the surface of the ordinary concrete structure layer. Moreover, ordinary C50 concrete is applied in the structural layer. The cross-section of the structure is demonstrated in Figure 1. The structure and mechanical properties of the FGC tower will be further introduced in The Structure of the FGC Tower and Mechanical Property Tests of the Transition and Functional Layer.
The Structure of the FGC Tower
The FGC tower section is divided into the functional, transition, and structural layers from outside to inside. The structural layer is vertically designed with the fiber-reinforced concrete section and the ordinary high-strength concrete section from top to bottom, as shown in Supplementary Figure S1. The functional layer materials are mainly used for anti-cracking, and durability protection. The transition layer connects the functional layer and the structural layer. Besides, it achieves the gradient transition of material components and has no macroscopic interface.
Owing to its superior performance for crack resistance and ductility, the FGC material is located in the area where the tensile stress is likely to occur, that is, the reinforcement layer. The force transfer between the structural and functional layers is optimized through the bonding and friction of steel bars. It can coordinate the deformation and reduce the stress concentration at the interface.
Mechanical Property Tests of the Transition and Functional Layer
Mechanical properties tests were performed to determine the FGC performance in practice. The specimens with a size of 600 mm × 150 mm × 300 mm were made, and the galvanized steel wire mesh was placed. The diameter of the steel wires is 0.7 mm, and the mesh size is 9 mm × 9 mm. By cutting and sampling the transition layer concrete in the range of 75 mm around the wire mesh, the size of the sampling components is 150 mm × 150 mm × 300 mm and 150 mm × 150 mm × 150 mm. The block with a size of 150 mm × 150 mm × 300 mm is taken for elastic modulus test, and the 150 mm × 150 mm × 150 mm cube block is used for splitting tensile strength and compressive strength test. The size of the test block is shown in Figure 2. Supplementary Table S1 demonstrates the concrete mix proportion of the functional and structural layers.
According to the GB/T50081-2002, the strength, elastic modulus, and splitting tensile strength of the functional, transition, and structural layers were tested after 28 days. The experimental results are shown in Table 1. It can be seen from Table 1 that the compressive strength of the transition layer is 59.1 MPa, and the compressive elastic modulus is 45.0 GPa, which are between those of the structural layer and the functional layer. The split tensile strength of the functional layer is 31.1% larger than that of the structural layer.
The mechanical properties of the FGC, especially for the tensile strength, are obviously improved by adding the basalt fibers and silica-fume to the FGC. The test results show that the gradient variation of material causes gradient variation of mechanical property. Besides, there is no weak gradient transition zone during the tests, and the overall deformation is coordinated. The functional layer concrete with higher mechanical properties may improve the crack resistance of the concrete tower.
Pore Structure Reconstruction of FGC
To analyze the pore structure of the FGC, the X-CT (X-ray computed tomography) is used to observe the size, quantity and distribution of the pores (Du Plessis et al., 2016; Zhang et al., 2020). As shown in Figures 3, 3D images of the pore structures in different parts of the FGC are calculated by the reconstruction algorism after the X-CT scan. A color scale is used to indicate the size of the pore, with the color from blue to red representing the size of the pore from small to large. The porosity of the functional layer, transition zone and the structural layer are 0.31, 0.35, and 0.47%, respectively.
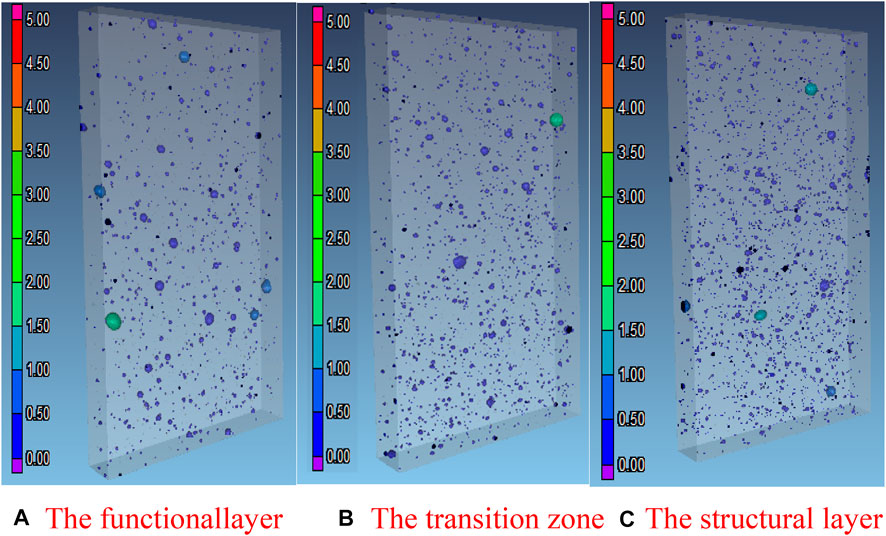
FIGURE 3. The pore volume of the concrete (unit mm3). (A) The functional layer (B) The transition zone (C) The structural layer.
The porosity of the gradient concrete presents gradient changes. Besides, the average volume of the pores in functional layer concrete is smaller than that in other area. The functional layer concrete contains fewer and smaller pores than the structural layer concrete, and the durability of the FGC can be benefitted from the low porosity.
Mechanical Behavior and Microstructure Analysis of the FGC Tower
The Chizhou Yangtze River Bridge, which is 1,448 m long, adopts an equal height double-tower cable-stayed bridge with an asymmetric mixed beam. Its main tower is 243 m high, and each tower has 108 stay cables. Supplementary Figure S2 shows the overall layout of this bridge.
The main tower of the cable-stayed bridge is designed as a vase-shaped reinforced concrete structure. It comprises the lower, middle, and upper towers, the upper and lower cross beams. The Z4 north tower is 237 m high. The width of the main tower along the bridge is 9.5 m in the upper tower and 9.5–13 m in the middle and lower tower s. The tower is a reinforced concrete structure, the upper crossbeam is a steel structure, and the lower one is a prestressed concrete structure. The upper tower is 109.7 m high, 5 ∼ 6 m wide, and 9.5 m wide along the bridge. Supplementary Figure S3 shows the elevation map of the main tower.
The FE Model
The finite element software ABAQUS is used to create the tower model. In this paper, the model is partially simplified: 1) the influence of different internal forces on the two limbs is ignored; 2) the symmetric loading boundary condition is considered; 3) the monolithic rigid frame and anchor rod are used instead of steel beam; 4) the improvement of stress concentration due to the chamfer of the horizontal plate hole is not considered.
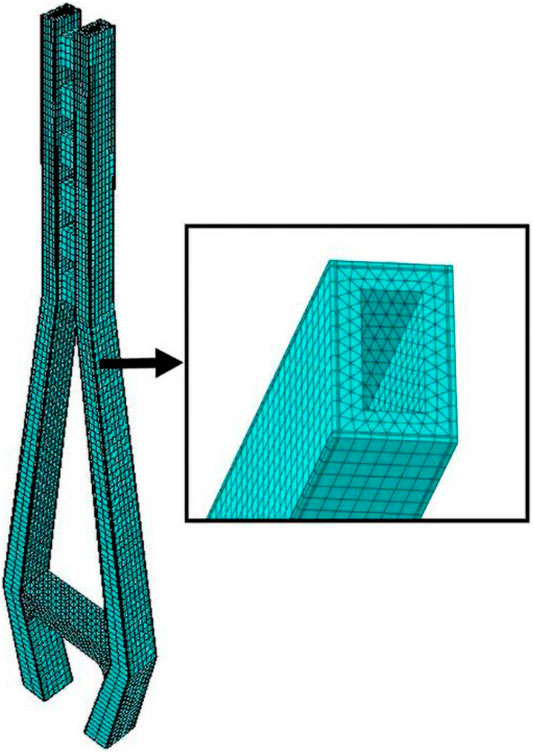
The C3D8R hexahedral solid element is adopted in the concrete of the functional layer and the transition layer of the bridge tower main structure. Due to the irregular shape of the structural layer and the lower beam concrete, the C3D10 tetrahedral solid element is selected for free meshing. The truss element is used to simulate the bolt, and the embedded function is used to embed the bolt into the concrete. For the mechanical properties of the FGC, the C3D8R hexahedral solid element is used to simplify the analysis of steel beams. The numerical analysis of functionally graded materials is based on the layered FE modeling method, which assigns each layer with different gradient variation functions of material parameters. According to material properties, the bridge tower entity model is divided into the functional, transition, and structural layers. The thickness of the functional layer and transition layer is 22.5 and 15 cm, respectively. According to the experimental results, the elastic modulus of concrete in the structural layer, functional layer, and transition layer is 44.2, 46.5, and, 45.0 GPa, respectively. Figure 4 demonstrates the FE model mesh and section of the tower. The concrete density is tested as 2625 kg/m3, the steel beam is the Q370qE steel; the dead load is a combination of self-weight, the vertical reaction of the beam, and the cable force. The loading is set 1–2.5 times of the dead load, with an interval of 0.5 times.
Stress and Strain Analysis of the FGC Tower
To study the mechanical behaviors of the FGC tower, a comparison model of the ordinary concrete tower is also created. The size, mesh division, and load application of the ordinary compared model are completely consistent with the FGC tower model. The difference is that the properties of concrete materials of the second model are consistent, and its elastic modulus is 44.2 GPa. By comparing the calculation results of the two models, the influence of the gradient concrete on the deformation and stress distribution is studied. Figures 5A,B show the axial stress cloud chart of the FGC and the ordinary concrete cable towers under 2.5 times dead load. It can be found that the results of the FGC tower and the ordinary concrete tower are consistent. Furthermore, there is no stress concentration when the load increases. Under 2.5 times dead load, the maximum compressive stress is 22.4 MPa.
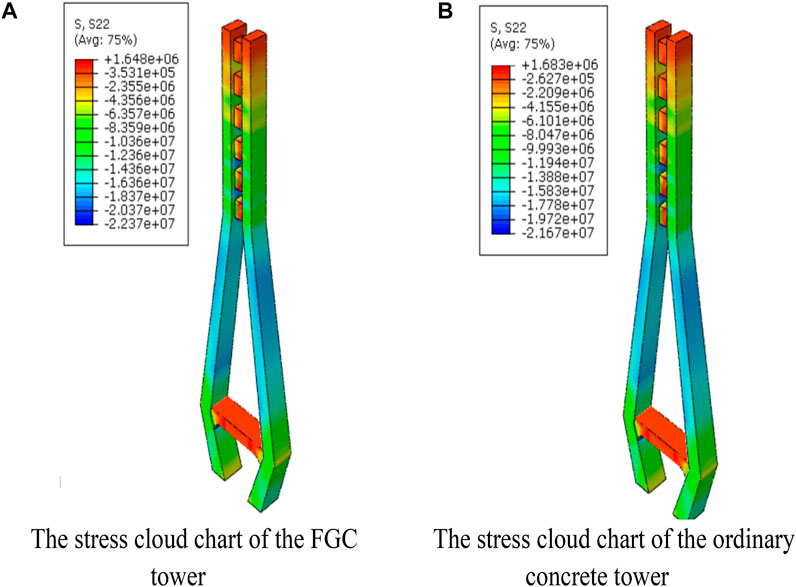
FIGURE 5. The axial stress cloud chart of the concrete tower under 2.5 times dead load. (A) The stress cloud chart of the FGC tower. (B) The stress cloud chart of the ordinary concrete tower.
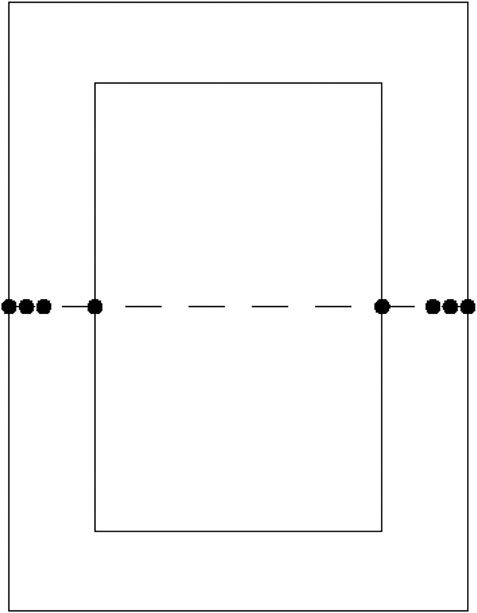
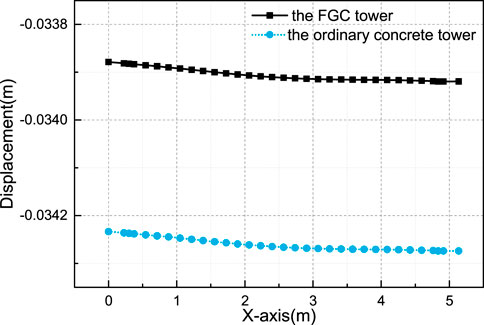
According to the stress distribution characteristics, the transition cross-section between the upper and middle tower (at the height of 144.8 m) is selected to analyze the stress distribution. The stresses of the measuring points at the midline of the cross-section are obtained. The measuring points are shown in Figure 6. Through the changing trend of node stress value on the midline, the effect of FGC on the tower is further analyzed. The distribution curves of stress and strain of the upper tower section on the FGC tower and the ordinary concrete tower are shown in Figures 7A–D. Through the stress and strain analysis and comparison between the FGC tower and the ordinary concrete tower, it can be found that the stiffness of the FGC tower is slightly improved. Moreover, the difference in stress and strain is less than 4 and 1.5%, respectively. The strain and stress distributions of the FGC and the ordinary concrete tower are consistent. The vertical displacements at the midline of the tower top are obtained and presented in Figure 8.
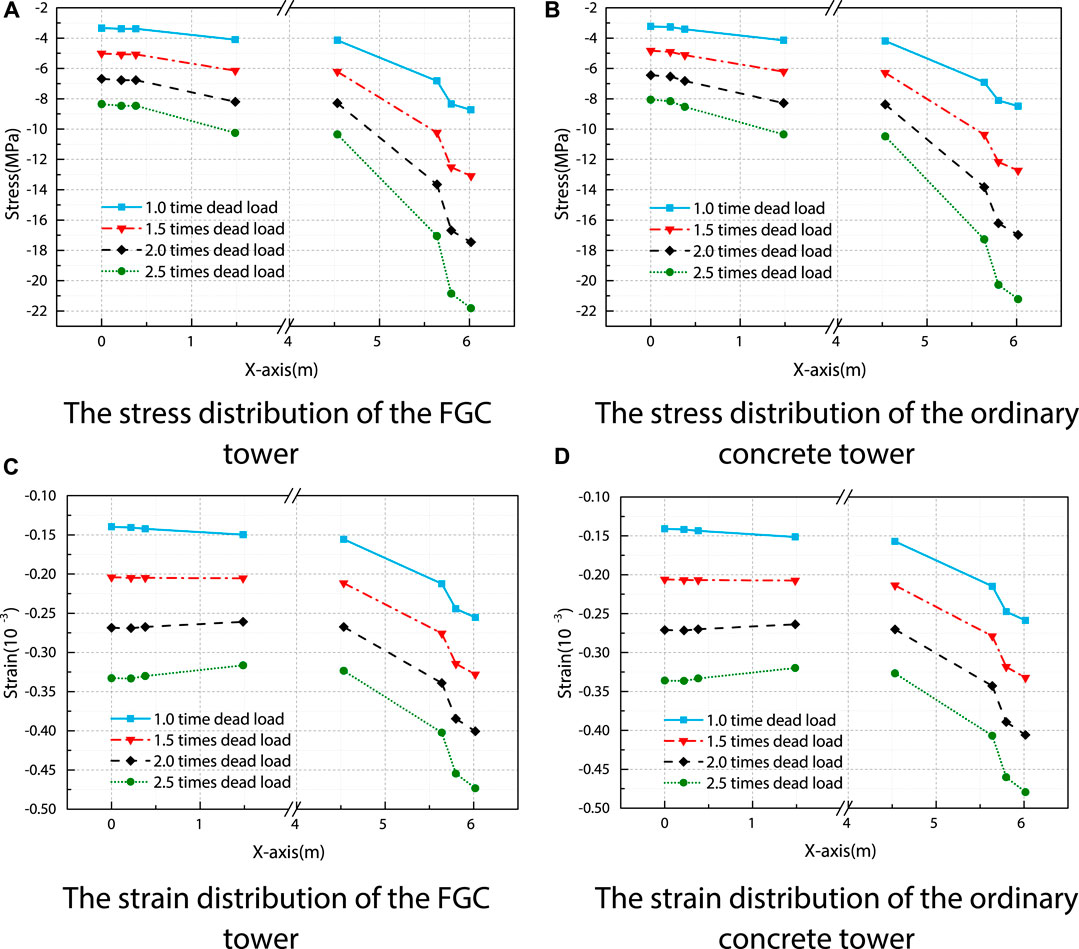
FIGURE 7. The midline stress and strain distribution of the cross-section at the height of 144.8 m. (A) The stress distribution of the FGC tower. (B) The stress distribution of the ordinary concrete tower. (C) The strain distribution of the FGC tower. (D) The strain distribution of the ordinary concrete tower.
According to the comparisons, the stress and displacements of the FGC tower are smaller than that of the ordinary concrete tower, and the trends of the stress distribution and displacements of FGC tower and ordinary concrete tower are almost the same. It indicates that the usage of the FGC has not cause nonuniform stress distribution in the transition zone of two kinds of concrete, and the FGC improved the vertical stress distribution and the stiffness of the tower.
The Thermal Stress of the FGC Tower
Bridges are usually influenced by internal and external factors such as the hydration heat state, the construction environment, daily and seasonal fluctuations in temperature, and solar radiation, which leads to the internal and external temperature difference. Temperature action causes considerable stress and deformation. These thermal effects are likely to induce cracking, support and expansion joint damage, and even collapse (Potgieter and Gamble, 1989; Catbas et al., 2008; Cross et al., 2013; Abid et al., 2016; Kromanis and Kripakaran, 2016; Sousa Tomé et al., 2018). In this section, the temperature stress of the FGC tower under the effect of gradient temperature load and hydration heat effect is studied, respectively. Moreover, the simulated results are compared with those of ordinary concrete towers.
The Stress of the FGC Tower due to the Gradient Temperature
The concrete tower is deformed by the effects of natural temperature changes and sunshine radiation. When the surface temperature of the tower rises/decreases rapidly, the internal temperature is still in the original state. Thus a large temperature gradient will be generated. It further keeps each part of the tower at a different temperature state and produces different temperature deformation. When the deformation is subject to internal and external constraints, considerable constraint stress will be generated inside the tower. Such constraint stress is sometimes even larger than the stress generated by the load.
According to Chinese specifications JTGD60-2015 and JTG-T3365-01-2020, the temperature difference between the left and right side of the central tower is ±5°C, the linear expansion coefficient of steel structure is 1.2 × 10⁻⁵/°C, and the linear expansion coefficient of concrete and reinforced concrete and prestressed concrete structures is 1 × 10⁻⁵/°C. The dead load includes the cable force and the bridge reaction force of the lower beam support. As a result of the difference between the linear expansion coefficient of steel and concrete, the stress due to the gradient temperature at the fixed position of the upper tower steel beam and the dense reinforcement is enormous. The maximum temperature stress appears at the transition cross section between the top and the middle tower, located at the height of 144.8 m. Figures 9A,B compare the Von Mises stress of the two models with different materials due to the dead load and gradient temperature load. The maximum Von Mises stress of the ordinary concrete and FGC tower is 4.26 and 4.39 MPa (tensile stress). The maximum Von Mises stress of the ordinary concrete tower is slightly smaller than that of the FGC tower. The main reason is that the FGC has a larger stiffness and is more affected by gradient temperature than the ordinary concrete. Affected by the gradient temperature, the stress from the sunny side to the shady side gradually decreases.
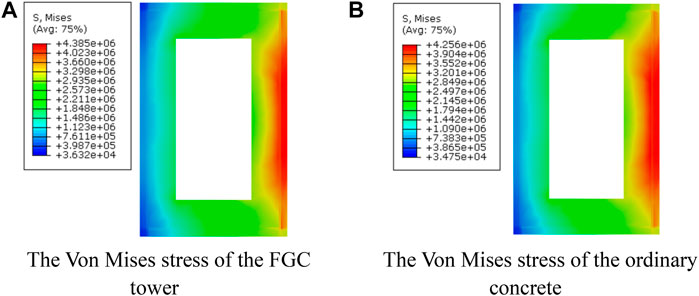
FIGURE 9. The Von Mises stress at the transition section of the upper tower and the middle tower due to the dead and gradient temperature loads. (A) The Von Mises stress of the FGC tower. (B) The Von Mises stress of the ordinary concrete.
The Hydration Heat Analysis
The Hydration Heat Theory and FE Model
The expansion and shrinkage caused by the thermal changes can strongly influence the stress distribution of the mass concrete structures (Huang et al., 2018; Do et al., 2020). According to Zhu’s research (Zhu, 2013), the exponential function is adopted to calculate the hydration heat. The function is defined as:
where
The elastic modulus of concrete varies with age, and the elastic modulus is calculated by Eq. 2.
in which,
The hydration heat is applied by the heat generation of concrete in unit time which is determined by the heat generation rate (HGEN) function. It is applied as a volume load on the element to simulate the chemical reaction of cement. The expression of HGEN is expressed as:
where,
Under hydration heat, the maximum deformation of bridge towers is 0.018 m in the transverse direction, 0.015 m in the longitudinal direction, and 0.02 m in the vertical direction. Due to the constraint conditions, the deformation of the lower part is relatively small, while that of the upper area is relatively large. The whole model shows a tendency of outward expansion under the hydration heat. The thickness of the functional layer also has a certain influence on the temperature stress of the model. Therefore, in temperature stress analysis, the FGC model with the functional layer thickness of 30 cm is constructed.
The Temperature and Stress Comparison
The FGC model is compared with the ordinary concrete model for temperature and stress, and the cross-section at the height of 4 m is selected. When the temperature and the stress reach their maximum values, respectively, the stress and temperature cloud charts of the two models are shown in Figures 10, 11. The internal temperature of the FGC tower and the ordinary concrete tower reached the maximum value at about 84 h after pouring. The internal temperature of the FGC tower is 50.4°C, and the internal hydration temperature of the ordinary concrete tower is 47.6°C. The maximum tensile stress of the FGC tower and the ordinary concrete tower is 4.01 and 3.78 MPa, respectively. The maximum tensile stress appears at the corners of the cross-sections and the stress reaches the highest at about 48 h after pouring.
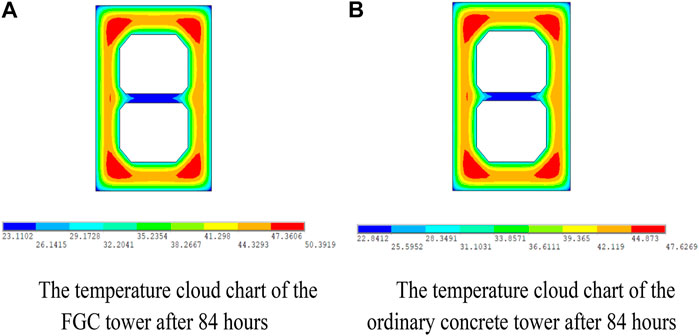
FIGURE 10. The temperature cloud chart under the hydration heat. (A) The temperature cloud chart of the FGC tower after 84 h. (B) The temperature cloud chart of the ordinary concrete tower after 84 h.
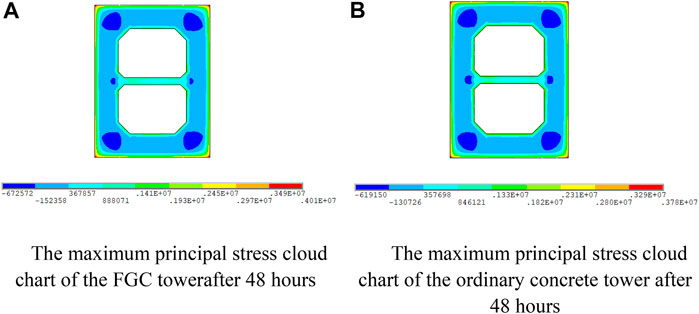
FIGURE 11. The maximum principal stress cloud chart under the hydration heat. (A) The maximum principal stress cloud chart of the FGC tower after 48 h. (B) The maximum principal stress cloud chart of the ordinary concrete tower after 48 h.
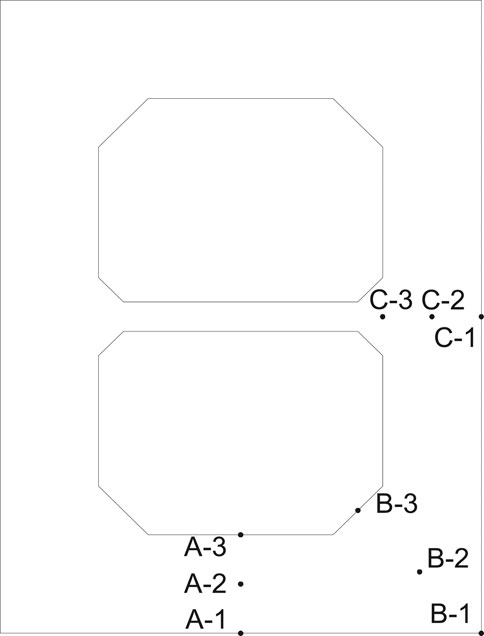
To further compare the changing of temperature and stress between the FGC tower and the ordinary concrete tower, the values at the measuring points in the first 10 days are collected. The locations of the measuring points in the cross-section are shown in Figure 12. The time-history curves of different measuring points are shown in Figures 13, 14. As presented in Figure 13, the temperatures at points A-2, B-2, and C-2 increased to the maximum values, and then become decreasing. Due to the heat exchanging between the concrete surface and the external environment, the temperatures of the surface are low. The temperature of the FGC tower is higher than that of the ordinary concrete tower. The main reason is that the higher content of cement in the FGC makes the higher heat generation of hydration.
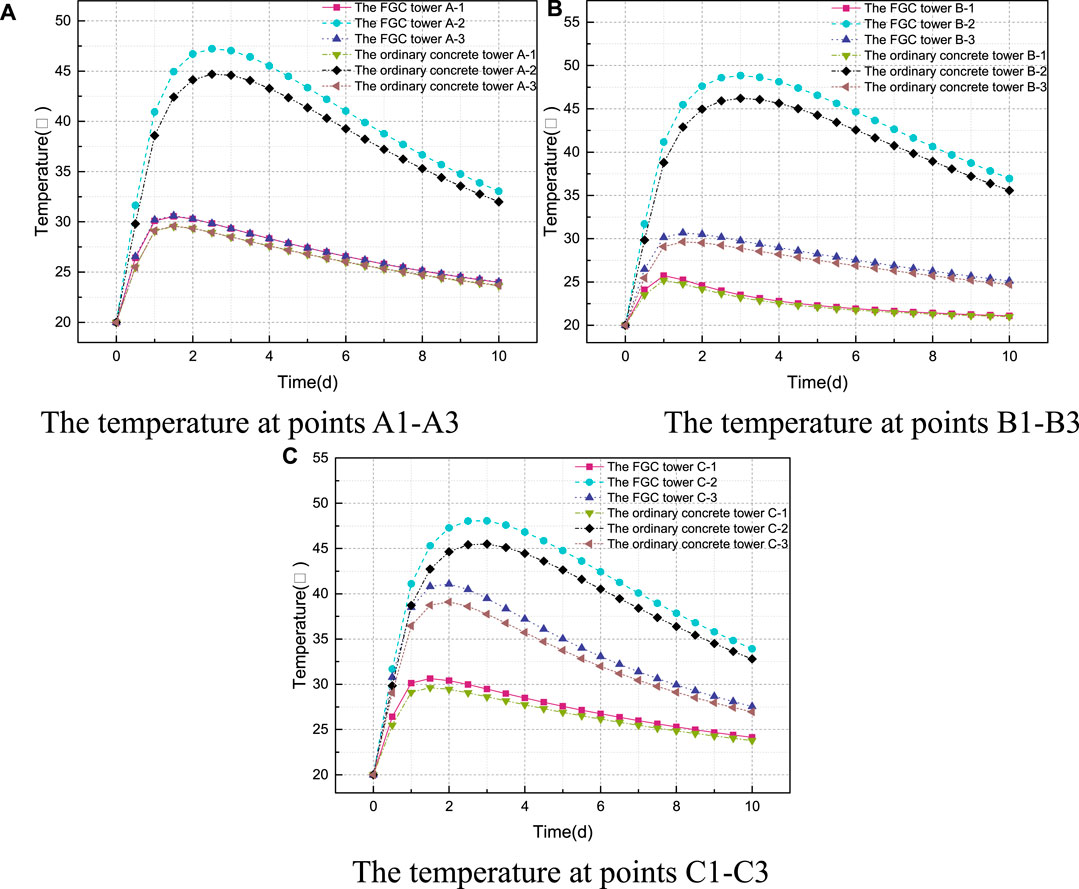
FIGURE 13. The time-history curve of temperature. (A) The temperature at points A1–A3 (B) The temperature at points B1–B3. (C) The temperature at points C1–C3.
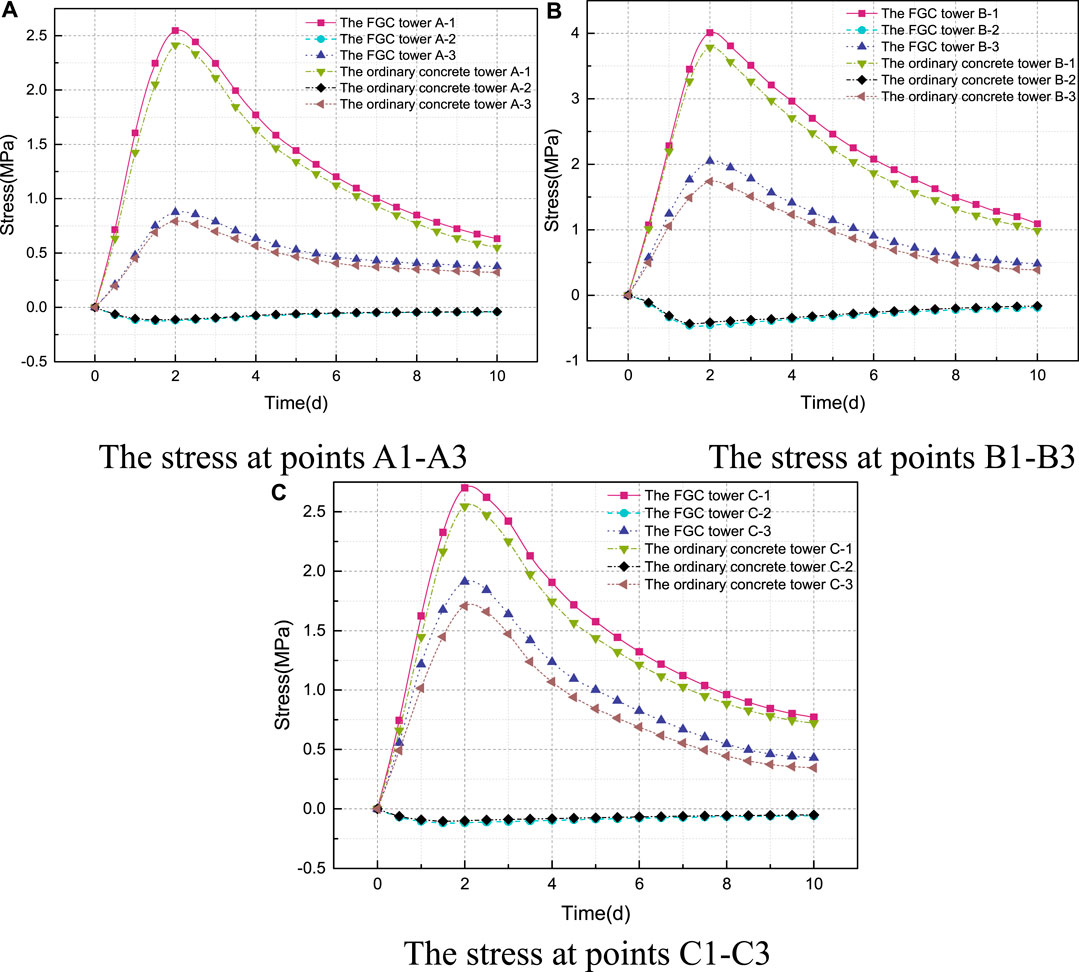
FIGURE 14. The time-history curves of the maximum principal stress. (A) The stress at points A1–A3. (B) The stress at points B1–B3. (C) The stress at points C1–C3.
As presented in Figure 14, during the generation of the hydration heat, the internal area is under compression and the concrete at the surface of the tower is under tensile. The stress of the FGC caused by the hydration heat is higher than that of the ordinary concrete because the hydration heat of FGC is higher than that of ordinary concrete. At the same time, the FGC with high strength at early age makes concrete tower external tensile stress increased. It can be concluded that the stress of the FGC tower is larger than that of the ordinary concrete tower under the hydration heat effect.
Crack Resistance of the FGC Tower
The existence of cracks reduces the stiffness of the bridge and weakens the material strength. Even minor cracks may affect the durability of the bridge. Thus, it is essential to analyze the crack resistance of the FGC.
The Plasticity Damage Model
In this section, the concrete plasticity damage model provided by ABAQUS is used. The damage plasticity model was proposed by Lubliner et al. (1989) and then developed by Lee and Fenves (1998). It assumed that the elastic behavior of the material is isotropic and linear. The constitutive relation of concrete is determined according to the GB50010-2010. The stress-strain (
1,
The stress-strain (
where
The damage factors are determined for the usage of the plasticity damage model in ABAQUS. The damage factors calculation formulas are given in GB 50010-2010. The uniaxial compression damage factor:
where
The uniaxial tensile damage factor:
in which,
The material parameters selected in the model are presented in Table 2 αf is the ratio of biaxial ultimate compressive strength to one cycle ultimate compressive strength of the concrete. K is the ratio of second stress invariants on the tensile meridian and compressive meridian. The damage factor calculation curve and the stress-strain curves can be obtained by putting the FGC parameters into the above formulations, respectively, and the results are further presented in Figures 15, 16.
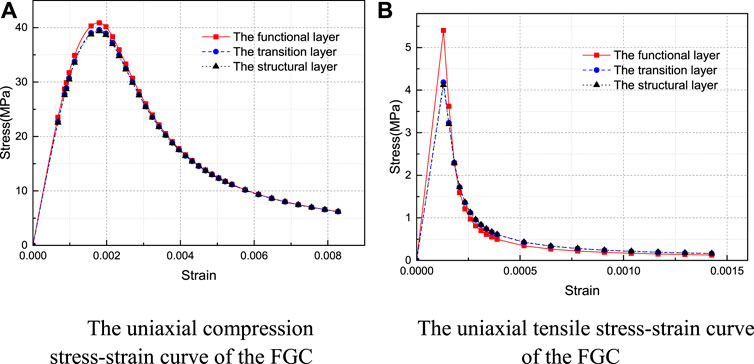
FIGURE 15. The uniaxial stress-strain curve of the FGC. (A) The uniaxial compression stress-strain curve of the FGC. (B) The uniaxial tensile stress-strain curve of the FGC.
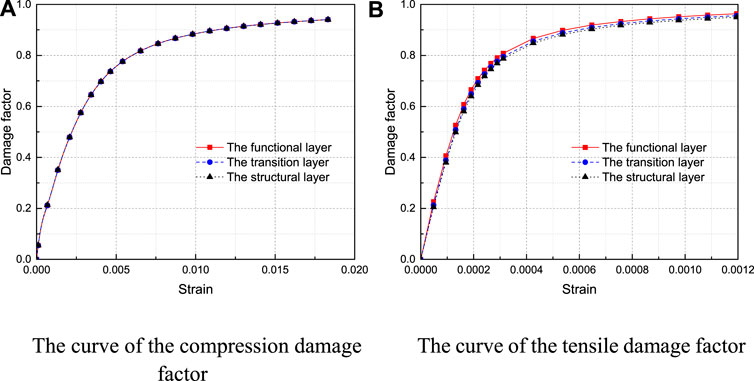
FIGURE 16. The curve of the damage factor. (A) The curve of the compression damage factor. (B) The curve of the tensile damage factor.
Failure Analysis of the FGC and the Ordinary Concrete Towers
Based on the FE model, the failure analysis of the FGC and the ordinary concrete towers is further conducted, and the results are presented in Figures 17, 18. In Figures 17, 18, the red area represents the failure area. In the tensile cloud image, the red areas represent areas of concrete cracking. While in the compression cloud image, the red areas represent areas where concrete is crushed and spalling. It can be seen from Figure 17 that the compressive damaged area of the ordinary concrete tower and the FGC tower is almost the same. Besides, the compression damage degree of the ordinary concrete tower is slightly larger than that of the FGC tower. Figures 18A,B show that in the anchor zone of cable and upper tower, the upper tower of each model has a local compression damage zone due to the action of cable force. However, the outer layer of the FGC tower is the functional layer of concrete, its tensile strength is relatively large, and so the local tensile damage is relatively small. It can also be seen from Figure 18 that the tensile damage at the anchorage of the lower tower and beam is relatively extensive. Also, there is some tensile damage at the bottom of the lower tower.
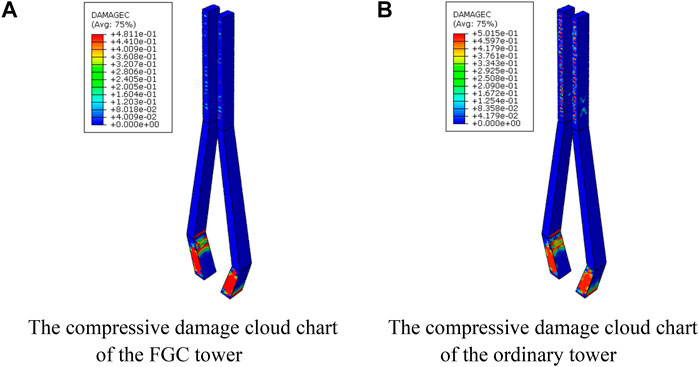
FIGURE 17. The compressive damage cloud chart of the two different materials models. (A) The compressive damage cloud chart of the FGC tower. (B) The compressive damage cloud chart of the ordinary tower.
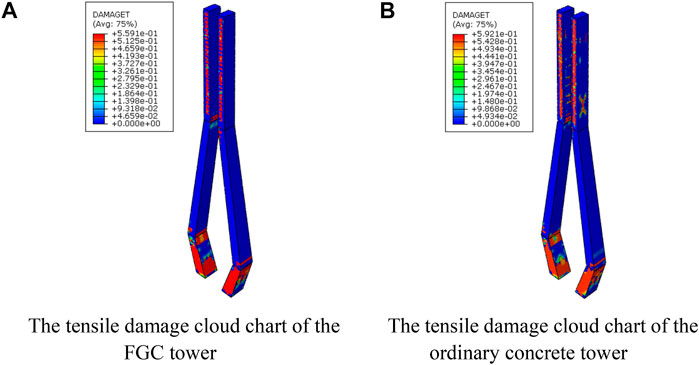
FIGURE 18. The tensile damage cloud chart. (A) The tensile damage cloud chart of the FGC tower. (B) The tensile damage cloud chart of the ordinary concrete tower.
The damage degree of the FGC tower at this section is lower than that of the ordinary concrete one, and the reasons can be concluded as: 1) the crack resistance of the FGC tower is strengthened due to the improved mechanical properties of the functional layer concrete; 2) the usage of FGC material reduces the maximum stress of the concrete tower which can also reduce the damage of the concrete; 3) the functional layer concrete is set at the outer layer of the tower where the stress is large.
Conclusion
The functionally gradient concrete is innovatively introduced into the towers of the Chizhou Yangtze River Bridge. It achieves the integrated design of mechanical properties and durability of the tower, and expands the application of FGC in engineering. Through the mechanical properties tests and the FE model simulations, the following conclusions can be drawn:
(1) To study the performance of the gradient concrete tower, the mechanical properties of the novel gradient concrete tower material are tested. The obtained mechanical properties of the functional layer, transition layer, and structural layer can be further used for the mechanical behavior analysis of the bridge tower.
(2) Based on the calculated stress and deformation of the FGC and ordinary towers, the stiffness of the FGC cable tower increases slightly, and the vertical displacement is smaller than that of the ordinary concrete cable tower.
(3) During the concreting, the high-performance concrete in the functional layer may generate the hydration heat. The influence of the hydration heat caused by the functional layer is relatively small. However, the crack resistance of the tower increases due to the FGC material.
Data Availability Statement
The raw data supporting the conclusion of this article will be made available by the authors, without undue reservation.
Author Contributions
The corresponding author is responsible for ensuring that the descriptions are accurate. ZW: writing the original draft, and providing conceptualization and Methodology. DD: creating the FE model, implementation of the experiments and data processing. SW: creating the FE model and numerical analysis. YM: modifying the draft and data analysis. YY: modifying and editing the draft.
Funding
This study was partly supported by the National Natural Science Foundation of China under grand No. 51922036, by the key research and development project of Anhui province under grand No. 1804a0802204, by the Fundamental Research Funds for the Central Universities under grand No. JZ2020HGPB0117, and by the Natural Science Funds for Distinguished Young Scholar of Anhui province under grand No.1708085J06.
Conflict of Interest
Author YY was employed by Anhui Transportation Holding Group Co., LTD.
The remaining authors declare that the research was conducted in the absence of any commercial or financial relationships that could be construed as a potential conflict of interest.
Supplementary Material
The Supplementary Material for this article can be found online at: https://www.frontiersin.org/articles/10.3389/fmats.2021.676440/full#supplementary-material
References
Abid, S. R., Tayşi, N., and Özakça, M. (2016). Experimental Analysis of Temperature Gradients in concrete Box-Girders. Construction Building Mater. 106, 523–532. doi:10.1016/j.conbuildmat.2015.12.144
Amiri, I., and Nakamura, S. (2016). Structural Characteristics of Multi-Span cable-stayed Bridges with Hybrid, RC and Steel Towers. Brs 11 (4), 141–148. doi:10.3233/brs-160095
Catbas, F. N., Susoy, M., and Frangopol, D. M. (2008). Structural Health Monitoring and Reliability Estimation: Long Span Truss Bridge Application with Environmental Monitoring Data. Eng. Structures 30 (9), 2347–2359. doi:10.1016/j.engstruct.2008.01.013
Chan, R., Liu, X., and Galobardes, I. (2020). Parametric Study of Functionally Graded Concretes Incorporating Steel Fibres and Recycled Aggregates. Construction Building Mater. 242, 118186. doi:10.1016/j.conbuildmat.2020.118186
Craveiro, F., Bartolo, H. M., Gale, A., Duarte, J. P., and Bartolo, P. J. (2017). A Design Tool for Resource-Efficient Fabrication of 3d-Graded Structural Building Components Using Additive Manufacturing. Automation in Construction 82, 75–83. doi:10.1016/j.autcon.2017.05.006
Cross, E. J., Koo, K. Y., Brownjohn, J. M. W., and Worden, K. (2013). Long-term Monitoring and Data Analysis of the Tamar Bridge. Mech. Syst. Signal Process. 35 (1), 16–34. doi:10.1016/j.ymssp.2012.08.026
Dias, C. M. R., Savastano Jr., H., and John, V. M. (2010). Exploring the Potential of Functionally Graded Materials Concept for the Development of Fiber Cement. Construction Building Mater. 24 (2), 140–146. doi:10.1016/j.conbuildmat.2008.01.017
Do, T. A., Hoang, T. T., Bui-Tien, T., Hoang, H. V., Do, T. D., and Nguyen, P. A. (2020). Evaluation of Heat of Hydration, Temperature Evolution and thermal Cracking Risk in High-Strength concrete at Early Ages. Case Stud. Therm. Eng. 21, 100658. doi:10.1016/j.csite.2020.100658
Du Plessis, A., Olawuyi, B. J., Boshoff, W. P., and Le Roux, S. G. (2016). Simple and Fast Porosity Analysis of concrete Using X-ray Computed Tomography. Mater. Struct. 49, 553–562. doi:10.1617/s11527-014-0519-9
Han, A., Gan, B. S., and Pratama, M. M. A. (2016). Effects of Graded Concrete on Compressive Strengths. IJTech 7, 732–740. doi:10.14716/ijtech.v7i5.3449
Herrmann, M., and Sobek, W. (2017). Functionally Graded concrete: Numerical Design Methods and Experimental Tests of Mass-Optimized Structural Components. Struct. Concrete 18 (1), 54–66. doi:10.1002/suco.201600011
Herrmann, M., and Sobek, W. (2015). Gradientenbeton - Numerische Entwurfsmethoden und experimentelle Untersuchung gewichtsoptimierter Bauteile. Beton- und Stahlbetonbau 110 (10), 672–686. doi:10.1002/best.201500035
Huang, Y., Liu, G., Huang, S., Rao, R., and Hu, C. (2018). Experimental and Finite Element Investigations on the Temperature Field of a Massive Bridge Pier Caused by the Hydration Heat of concrete. Construction Building Mater. 192, 240–252. doi:10.1016/j.conbuildmat.2018.10.128
Kiryu, S., Han, A. L., Nurhuda, I., and Gan, B. S. (2018). “Analysis of Steel Reinforced Functionally Graded concrete Beam Cross Sections,” in 4th International Conference on Rehabilitation and Maintenance in Civil Engineering. 195, 02031. doi:10.1051/matecconf/201819502031
Kovaleva, D., Gericke, O., Kappes, J., Tomovic, I., and Sobek, W. (2019). Rosenstein Pavilion: Design and Structural Analysis of a Functionally Graded concrete Shell. Structures 18, 91–101. doi:10.1016/j.istruc.2018.11.007
Kromanis, R., and Kripakaran, P. (2016). SHM of Bridges: Characterising thermal Response and Detecting Anomaly Events Using a Temperature-Based Measurement Interpretation Approach. J. Civil Struct. Health Monit. 6 (2), 237–254. doi:10.1007/s13349-016-0161-z
Lee, J., and Fenves, G. L. (1998). Plastic-damage Model for Cyclic Loading of concrete Structures. J. Eng. Mech. 124 (8), 892–900. doi:10.1061/(asce)0733-9399(1998)124:8(892)
Li, Q., and Xu, S. (2009). Experimental Investigation and Analysis on Flexural Performance of Functionally Graded Composite Beam Crack-Controlled by Ultrahigh Toughness Cementitious Composites. Sci. China Ser. E-technol. Sci. 52 (6), 1648–1664. doi:10.1007/s11431-009-0161-x
Lubliner, J., Oliver, J., Oller, S., and Oñate, E. (1989). A Plastic-Damage Model for concrete. Int. J. Sol. Structures 25 (3), 299–326. doi:10.1016/0020-7683(89)90050-4
Maalej, M., Ahmed, S. F. U., and Paramasivam, P. (2003). Corrosion Durability and Structural Response of Functionally-Graded Concrete Beams. Act 1 (3), 307–316. doi:10.3151/jact.1.307
Miyamoto, Y., Niino, M., and Koizumi, M. (1997). “FGM Research Programs in japan -from Structural to Functional Uses,” in Functionally Graded Materials 1996. Editors I. Shiota, and Y. Miyamoto (Amsterdam: Elsevier Science B.V.), 1–8. doi:10.1016/B978-044482548-3/50002-0
Mohamed, M., and Victor, C. L. (1995). Introduction of Strain-Hardening Engineered Cementitious Composites in Design of Reinforced Concrete Flexural Members for Improved Durability. ACI Struct. J. 92 (2). doi:10.14359/1150
Nes, L. G., and Øverli, J. A. (2016). Structural Behaviour of Layered Beams with Fibre-Reinforced LWAC and Normal Density Concrete. Mat. Struct. 49 (1), 689–703. doi:10.1617/s11527-015-0530-9
Okamoto, Y., and Nakamura, S. (2011). Static and Seismic Studies on Steel/concrete Hybrid Towers for Multi-Span cable-stayed Bridges. J. Constructional Steel Res. 67 (2), 203–210. doi:10.1016/j.jcsr.2010.08.008
Park, K., Paulino, G., and Roesler, J. (2010). Cohesive Fracture Model for Functionally Graded Fiber Reinforced Concrete. Cement Concrete Res., 40 (6), 956–965. doi:10.1016/j.cemconres.2010.02.004
Potgieter, I. C., and Gamble, W. L. (1989). Nonlinear Temperature Distributions in Bridges at Different Locations in the United States. pcij 34 (4), 80–103. doi:10.15554/pcij.07011989.80.103
Roesler, J., Paulino, G., Gaedicke, C., Bordelon, A., and Park, K. (2007). Fracture Behavior of Functionally Graded Concrete Materials for Rigid Pavements. Transportation Res. Rec. 2037 (1), 40–49. doi:10.3141/2037-04
Shao, X., Deng, F., and Deng, L. (2018). Conceptual Design of a New Three-Tower Cable-Stayed Bridge System with Unequal-Size Fans. J. Bridge Eng. 23 (7). doi:10.1061/(ASCE)BE.1943-5592.0001257
Son, J., and Lee, H.-J. (2011). Performance of cable-stayed Bridge Pylons Subjected to Blast Loading. Eng. Structures 33 (4), 1133–1148. doi:10.1016/j.engstruct.2010.12.031
Sousa Tomé, E., Pimentel, M., and Figueiras, J. (2018). Structural Response of a concrete cable-stayed Bridge under thermal Loads. Eng. Structures 176, 652–672. doi:10.1016/j.engstruct.2018.09.029
Sridhar, R., and Prasad, D. R. (2019). Damage Assessment of Functionally Graded Reinforced concrete Beams Using Hybrid Fiber Engineered Cementitious Composites. Structures 20, 832–847. doi:10.1016/j.istruc.2019.07.002
Strieder, E., Hilber, R., Stierschneider, E., and Bergmeister, K. (2018). FE-study on the Effect of Gradient Concrete on Early Constraint and Crack Risk. Appl. Sci. 8 (2), 246. doi:10.3390/app8020246
Torelli, G., Fernández, M. G., and Lees, J. M. (2020). Functionally Graded concrete: Design Objectives, Production Techniques and Analysis Methods for Layered and Continuously Graded Elements. Construction Building Mater. 242, 118040. doi:10.1016/j.conbuildmat.2020.118040
Wen, X.-d., Tu, J.-l., and Gan, W.-z. (2013). Durability protection of the Functionally Graded Structure concrete in the Splash Zone. Construction Building Mater. 41, 246–251. doi:10.1016/j.conbuildmat.2012.11.119
Xu, S., and Li, Q. (2009). Theoretical Analysis on Bending Behavior of Functionally Graded Composite Beam Crack-Controlled by Ultrahigh Toughness Cementitious Composites. Sci. China Ser. E-technol. Sci. 52 (2), 363–378. doi:10.1007/s11431-008-0337-9
Zhang, Y., Xu, S., Gao, Y., Guo, J., Cao, Y., and Zhang, J. (2020). Correlation of Chloride Diffusion Coefficient and Microstructure Parameters in concrete: A Comparative Analysis Using NMR, MIP, and X-CT. Front. Struct. Civ. Eng. 14, 1509–1519. doi:10.1007/s11709-020-0681-9
Keywords: gradient concrete, cable-stayed bridge, fiber reinforced concrete, mechanical behavior, crack resistance
Citation: Wang Z-C, Duan D-Y, Wang S-H, Mo Y and Yin Y-G (2021) Mechanical Behavior of the Novel Gradient Concrete Tower of a Cable-Stayed Bridge. Front. Mater. 8:676440. doi: 10.3389/fmats.2021.676440
Received: 09 March 2021; Accepted: 18 May 2021;
Published: 02 June 2021.
Edited by:
Gangbing Song, University of Houston, United StatesReviewed by:
Peng Zhang, National Natural Science Foundation of China, ChinaPing Duan, China University of Geosciences, China
Copyright © 2021 Wang, Duan, Wang, Mo and Yin. This is an open-access article distributed under the terms of the Creative Commons Attribution License (CC BY). The use, distribution or reproduction in other forums is permitted, provided the original author(s) and the copyright owner(s) are credited and that the original publication in this journal is cited, in accordance with accepted academic practice. No use, distribution or reproduction is permitted which does not comply with these terms.
*Correspondence: Zuo-Cai Wang, d2FuZ3p1b2NhaUBoZnV0LmVkdS5jbg==
 Zuo-Cai Wang
 Da-You Duan1


