 Zhitian Shen
 Jie Xu2,3
 Xiaohua Jian
94% of researchers rate our articles as excellent or good
Learn more about the work of our research integrity team to safeguard the quality of each article we publish.
Find out more
ORIGINAL RESEARCH article
Front. Mater., 09 April 2021
Sec. Smart Materials
Volume 8 - 2021 | https://doi.org/10.3389/fmats.2021.663109
This article is part of the Research TopicNew Piezoelectric Materials and Devices: Fabrication, Structures, and ApplicationsView all 11 articles
The equivalent circuit simulation plays an important role in the design of ultrasound transducer. However, the existing methods are difficult to achieve the effect of matching and backing layer, and not able to accurately simulate the transducer with cable. Especially in the application of high frequency ultrasound, the long cable has a great influence on the performance of the transducer. To overcome these limitations, this paper proposed an improved equivalent circuit method, which combined Leach model and transmission line model. It can realize the complete simulation of ultrasound transducer with a long cable, matching layer, and backing layer in PSPICE circuit simulation software when the parameters were measured. Its principles were briefly introduced, and ultrasound transducers with different frequencies (12 and 20 MHz), different matching layers, and different cable lengths (0.5–2.5 m) were designed and fabricated to verify the effectiveness of the method, which is also compared with the traditional KLM method using PiezoCAD. The experiment results showed that the long cable, matching layer, and backing layer have a significant impact on the performance of high frequency ultrasound transducers, and this proposed method has good agreement with these results. Moreover, for the simulation of the complete transducer, the effect of this method is better than KLM model. Besides, this method does not need to know the specific equivalent circuit of matching, backing layer, or cable wire, it can accurately predict the impedance and phase of the transducer through the material parameters, which is very helpful for the material selection and optimization of subsequent transducer design and fabrication. The study indicates that this improved equivalent circuit method is suitable to be applied in the general circuit simulation software and provides strong support for the high frequency transducer and system design.
Simulation plays an important role in the design of ultrasound transducers and helps designers to understand the effects of system parameters (Tarpara and Patankar, 2018). Excellent simulation can usually obtain very accurate results, save the time and cost consumed in the experimental development of prototype equipment, and also reduce the number of iterations of the product (Jensen, 2004).
However, with the emergence of high-frequency and even ultra-high-frequency ultrasound applications, such as intravascular ultrasound imaging, ophthalmic ultrasound imaging, small animal ultrasound imaging, ultrasound microscopy, etc (Pandian et al., 1990; Turnbull et al., 1993; Pavlin and Foster, 1998; Sahai, 1998), the design of transducers has become more complex. The number of matching layers is increasing and the materials are not readily available. This leads to the need to estimate the impedance of the transducer based on the material or for establishing impedance matching networks (Wu and Chen, 1999). Therefore, high requirements are put forward to the simulation.
The design and performance prediction of ultrasound transducers require appropriate software tools, which involve a variety of knowledge of acoustics, electronics, and ultrasonic properties of the propagation medium (Merdjana et al., 2014; Rathod, 2020). The finite element model and equivalent circuit model are the main research methods (Zheng et al., 2018). For example, Comsol, a commercial software based on the finite element model, divides the transducer into many small units for calculation (Fan et al., 2014). This method has high precision, but it requires a lot of computation time and computation resources. In contrast, the equivalent circuit model has a very fast calculation speed and high calculation accuracy. The classical equivalent circuit model of the transducer was first proposed by Mason (1942). The equivalent circuit uses an ideal transformer to separate the piezoelectric material into an electrical port and two acoustic ports, which describes the conversion of mechanical quantity to electrical quantity (Tarpara and Patankar, 2018). Later, Redwood (1961) introduced the transmission line model to solve the transient response of the transducer on this basis, and described the propagation of mechanical signals from one surface of the transducer to another. Krimholtz et al. (1970) proposed a different equivalent circuit model for piezoelectric transducers. Its circuit consists of a transformer connected to the middle of a transmission line. It is suitable for the simulation of multi-layer structure (Van Deventer and Lofqvist, 2000; Kim et al., 2020). BVD (Butterworth-Van Dyke) model is the simplest model (Aouzale et al., 2008; Kim et al., 2020; Zhou et al., 2020), which only needs four common components to realize the transducer simulation, and the implementation of multi-frequency BVD model is also very simple. In 1994, Leach proposed to replace the frequency-dependent transformer in Mason’s model with a controllable current source and a controllable voltage source to simulate the transducer, and achieved good results (Leach, 1994). However, these models have some limitations. The negative capacitance C0 contained in Mason model and the frequency dependent transformer contained in KLM model are difficult to be realized in PSPICE software. BVD model is not suitable for high frequency transducer performance from material parameters. Leach model is widely used, but most of the applications lack the modeling of matching layer, backing layer and cable (Van Deventer and Lofqvist, 2000; Johansson and Martinsson, 2001; Roa-Prada et al., 2007; Aouzale et al., 2008; Chahal and Reddy, 2013; Tarpara and Patankar, 2018; Takahashi et al., 2019; Zheng et al., 2019).
Moreover, high frequency ultrasound transducer usually consists of a piezoelectric ceramic layer, a matching layer, a backing layer, and a cable. Performance is easily affected by long cables and systems (Jian et al., 2018). Therefore, it is necessary to establish a complete equivalent circuit model of the transducer, which can be implemented in PSPICE circuit simulation software, to complete the simulation and performance prediction of the transducer. Based on Leach model and transmission line theory, this paper established a complete equivalent circuit model to study the performance of high frequency transducers. The simulation of a transducer with a long cable, matching layer, and backing layer was realized. Based on the measured material parameters, this model predicted the impedance of the transducer with and without cable. The actual measured results were compared with the theoretical calculation results. For transducers with different lengths of cable, the simulation results were verified that the long cables have a great effect on the performance, and the simulation results accorded with the measured results. It is also compared with PiezoCAD software based on KLM model and achieved better results. For high frequency ultrasound transducer, this method allows researchers to consider the influence of cable and system while studying the performance of the transducer, and even further adjust the circuit design of the transducer.
In order to establish the equivalent circuit model of the multi-layer ultrasound transducer structure, the controlled source model and the lossy transmission line are used to simulate the physical structure of the piezoelectric ultrasound transducer and cable which is bonded to the transducer. The theory uses a typical structure of transducer consisted of a piezoelectric ceramic layer as the active layer, a matching layer, a backing layer, and a cable.
Figure 1 shows the controlled source model used to simulate the sensor.
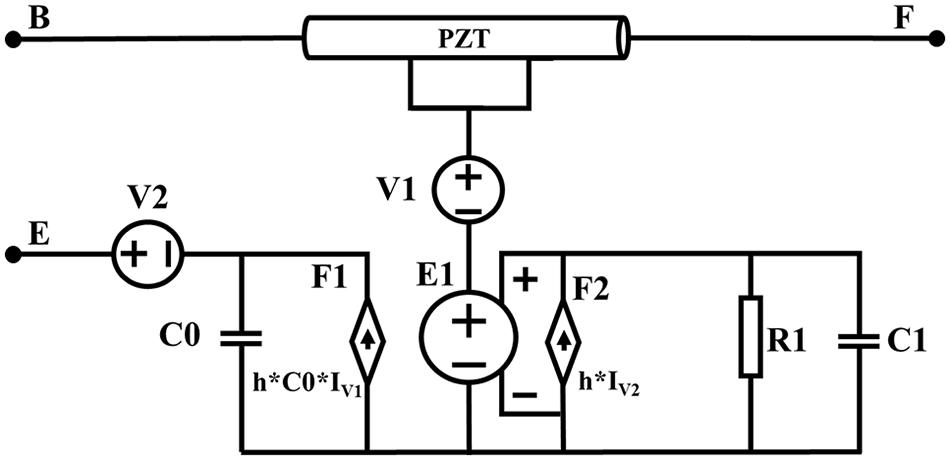
Figure 1. The Leach model of transducer.
In the model, B, E, and F are the ports of the piezoelectric ultrasonic transducer. Port E is used to connect the excitation source of the transducer, port B is used to connect the backing layer, and port F is used to connect the matching layer. The model uses the controllable voltage and current sources to model the piezoelectric phenomenon. By comparing the wave equation and the telegraph equation of the acoustic wave in the piezoelectric material, the controllable source equivalent circuit model of the piezoelectric ultrasonic transducer is established. The specific derivation can be found in reference (Leach, 1994). So, the piezoelectric effect simulation is realized. All parameters in the model are derived from the material characteristics of the transducer. The required parameters in the model are as follows:
Where, d(m) represents the thickness of piezoelectric ceramics, which determines the center frequency of the sensor f(Hz), c(m/s) represents the speed of sound in piezoelectric ceramics, C0(F) represents the static capacitance, εS is the relative clamped dielectric constant, A(m2) represents the cross-sectional area of the piezoelectric material along the direction of sound wave propagation, h(N/C) represents piezoelectric constant, e33(10−12m2/N) represents the short circuit elastic constants,R1 and C1 represent an integrator, which is 1 kΩ and 1 F, respectively.
The PZT part in Figure 1 can be simulated as a lossy transmission line by comparing the propagation equations of wave in electric transmission line and acoustic medium (Van Deventer and Lofqvist, 2000), we can use a lossy transmission line to simulate the propagation of the acoustic wave in the medium. To simulate the propagation of sound waves through the transducer, the parameters of the piezoelectric ceramic transmission line are calculated as follows:
Where ρ(kg/m3) represents the density of piezoelectric materials, α(NP/m) represents the attenuations.
The electric transmission line model is usually described in Figure 2.
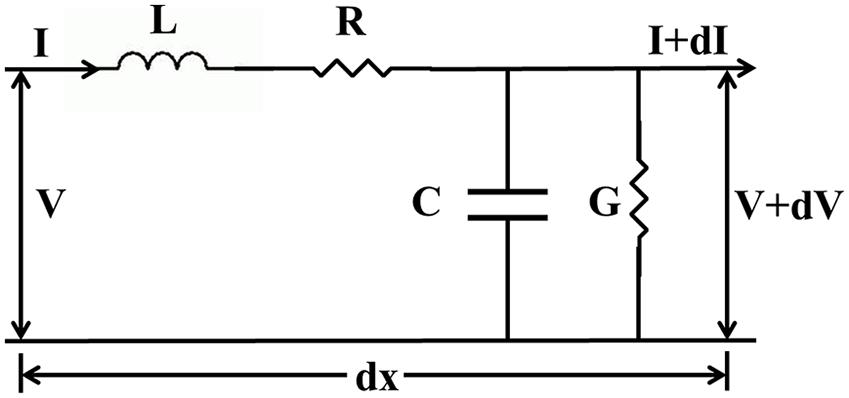
Figure 2. The transmission line model of cable.
The telegraph equation can be derived that (Magnusson et al., 2000):
Where γ represents the propagation constant,α represents attenuation constant,β represents phase constant, Z_0 represents the characteristic impedance.
The input impedance of the cable is (Peres and Lopes, 1998; de Souza et al., 2003):
The L is the length of the cable, Z_0 is the characteristic impedance, Z_L is the load impedance.
When the load circuit is short and open, respectively, we can measure the input impedance of the transmission line. When the terminal of the cable is short, the load impedance of the cable Z_L is 0. In the same way, when the terminal of the cable is open, the load impedance Z_L is infinite. According to Eq. 10, the two variables could derive the characteristic impedance Z_0 and γ. And then, according to Eqs. 8 and 9, the lumped circuit parameters could also be derived. Further, the distribution parameters of the transmission line can be calculated:
The complete ultrasound transducer includes the matching layer, piezoelectric ceramic, backing layer, adhesive layers, and cable. The typical structural diagram of a transducer is shown in Figure 3.
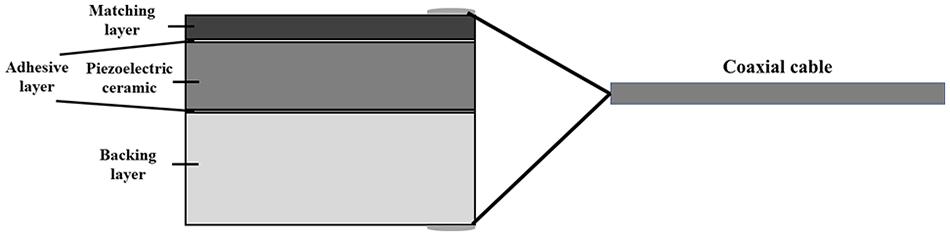
Figure 3. The structural diagram of complete transducer.
According to this diagram, we established the improved equivalent circuit simulation in Figure 4.
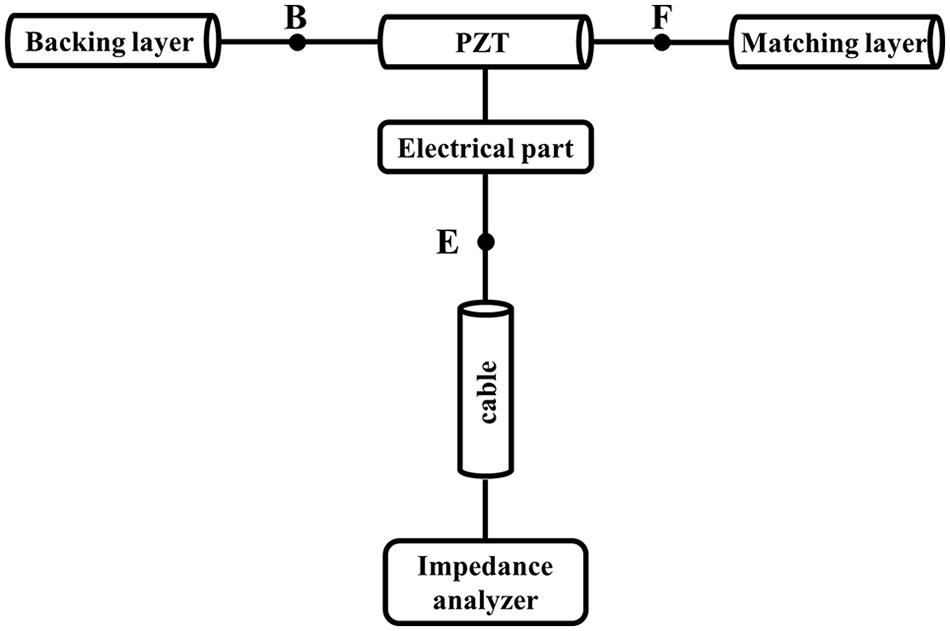
Figure 4. The improved equivalent circuit simulation diagram of complete transducer.
In general, the adhesive layer is very thin, which has little effect on the performance of the piezoelectric ultrasonic transducer. So, the adhesive layers are ignored in this model.
To verify above theoretical equivalent circuit simulation model, the high frequency transducers were fabricated in Figure 5 and their models in Figure 3 were also established.
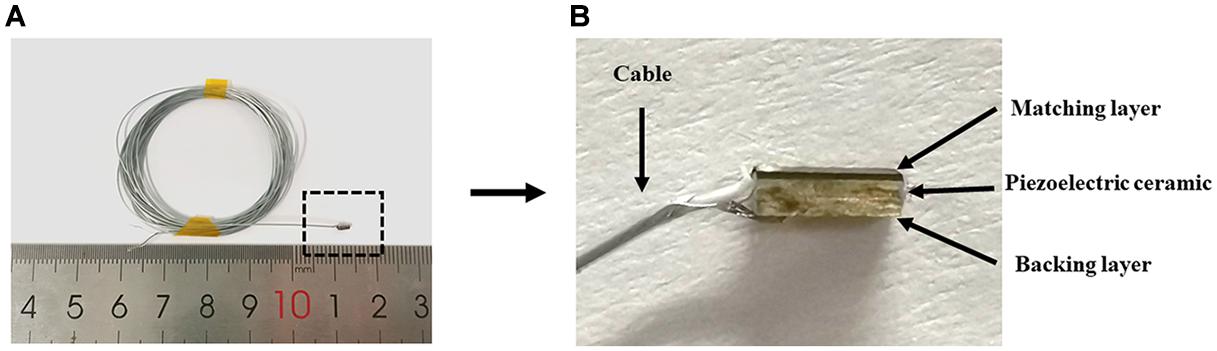
Figure 5. (A) the complete transducer (B) the detail of transducer.
It consists of a piezoelectric ceramic layer, a matching layer, a backing layer, and a long cable. Among them, the PZT part is PZT-5H (CTS Electronic Components, Inc., Elkhart, IN, United States), the backing layer part is the conductive silver epoxy (E-Solder 3022, Von Roll Insulation, Isola, MS, United States), the matching layer is self-made materials, and the cable is a 42 AWG coaxial wire. Adhesive layers are made of epoxy (epo–tek 301, Epoxy Technology, Billerica, MA, United States). Usually, these layers are very thin so that it has little effect on the performance of the transducer and these will be ignored in our model. According to the structure, the equivalent circuit model of this transducer was established using LTspice software (Analog Device, Norwood, MA, United States), as shown in Figure 6.
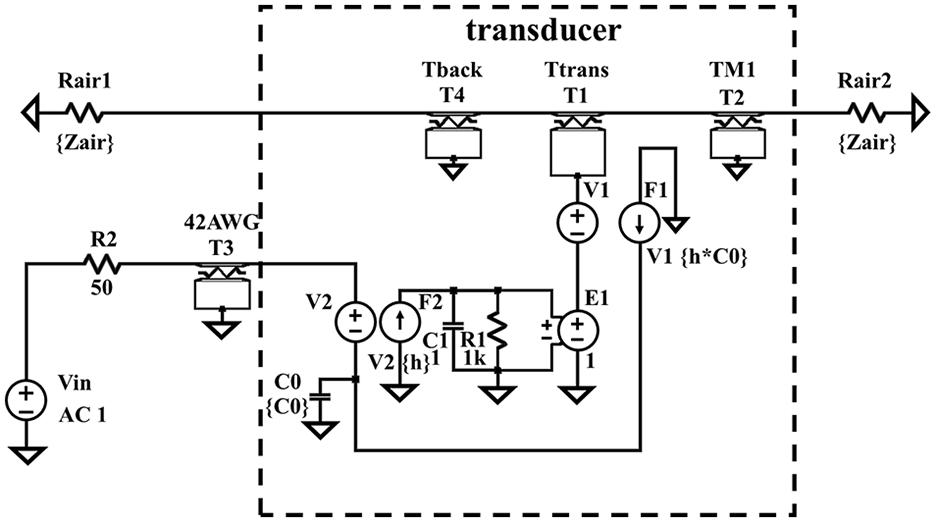
Figure 6. The equivalent circuit simulation diagram by using LTspice software.
The equivalent circuit model is composed of three parts: piezoelectric material part, backing part, and matching layer part. The piezoelectric material is composed of T1 and a controlled source model (E1, F1, F2) to complete the simulation of the piezoelectric effect of piezoelectric materials. T2 and T4 were used to simulate the matching layer and the backing part, respectively. A lossy transmission line model was used to simulate the cable. In the experiment, the impedance analyzer was used to measure the impedance curves at both ends of the transducer. LTspice software is used to realize the equivalent circuit simulation of the transducer. Finally, the measured results were compared with the simulation results to verify the feasibility of the model. To verify the practicability of the model for transducers of different frequencies, different matching layers, and different cable lengths, two kinds of frequency transducers were made, and two kinds of matching layer materials were used. The simulation was carried out in the case of cable and without cable, respectively, and made the comparison with the actual test.
In this experiment, the practicability of the model for the transducer without cable is verified. Two kinds of frequency transducers are made. The piezoelectric ceramic part used the same material, PZT-5H. The matching layer part used two kinds of self-made materials, and the backing layer was also made of the same material. At the same time, considering the influence of technology in the process of making the transducer, the parameters will be slightly adjusted during the actual simulation. The measured parameters of the material are shown in Table 1. For No. 1 transducer, the thickness of piezoelectric ceramic part is 170 μm, and the matching layer is 57 μm thick; For No. 2 transducer, the PZT layer is 185 μm, and the matching layer is 53 μm; For No. 3 transducer, the PZT layer is 100 μm, and the matching layer is 35 μm.
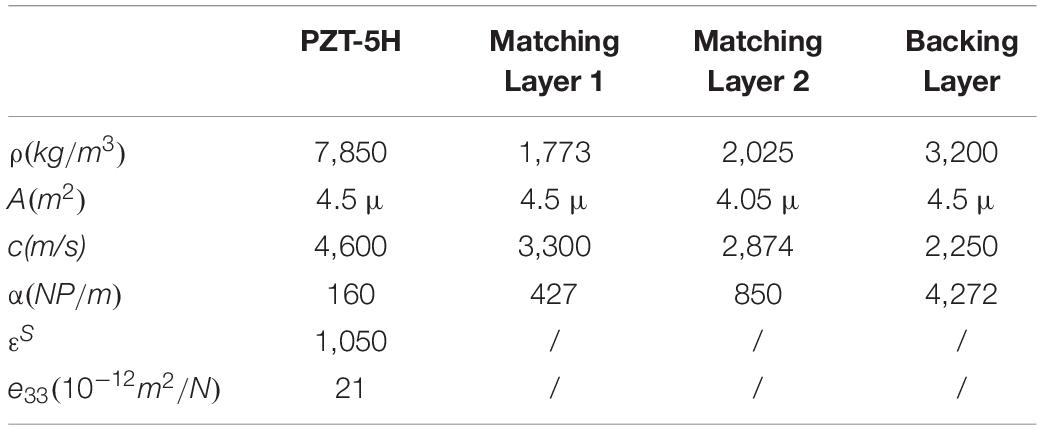
Table 1. The parameters of PZT-5H for Leach model.
In this experiment, three transducers in the previous section were used to bond long cable and carried out measurements. A 42 AWG cables were used and the length of cables was 2.5 m. For the cable, we used the impedance analyzer to measure the input impedance of the open circuit and short circuit. According to equation 10, γ, and Z_0 can be derived. The required parameters of the transmission line can also be derived according to equation 11∼14. Typical parameters are shown in Table 2.
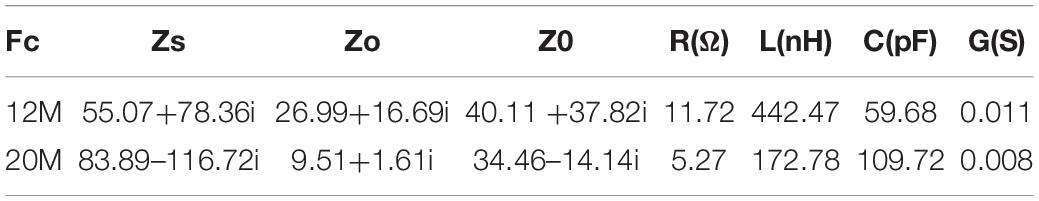
Table 2. The input impedance of the open circuit and short circuit.
Because the different lengths of cable have a great impact on the high frequency transducers, it has to study the transducer performance at different cable lengths. In this experiment, we measured the open circuit and short circuit input impedance of 42AWG cable at 20 MHz and calculated the lumped circuit parameters to support the transmission line model in LTspice software. The parameters which used in Leach model were close to those mentioned in Table 1. To verify the practicability of the model for transducers of different cable lengths, the aforementioned No. 3 transducers with 42 AWG cables of different lengths were used. The cable lengths were 0.5, 1.5, and 2.5 m, respectively. The impedance of the transducer was measured and compared with the simulation results. The consistency between the simulation results and the measured results of transducers with different lengths confirms that the model can be used to simulate transducers of different lengths, not just one length.
In the experiment of the transducer without cables, we compared the simulation results of the three transducers with the measured results, as shown in Figure 7. It can be seen that the simulation results are in good agreement with the measured results, especially at the position of the resonance. The simulated and measured center frequencies of the No. 1 transducer are 11.76 MHz and 11.75 MHz. The amplitudes at the center frequencies are 93.76Ω and 89.58Ω. The phases at the center frequencies are −46.90° and −34.35°. The errors of frequency, amplitude, and phase are, respectively, 0.08%, 4.18Ω, and 12.55°. The simulated and measured center frequencies of the No. 2 transducer are 11.13 MHz and 11.3MHz. The amplitudes are 91.2Ω and 82.65Ω. The phases are −53.07° and −43.95°. The errors are 1.5%, 8.55Ω, and 9.12°. The simulated and measured center frequencies of the No. 3 transducer are 19.68Ω and 19.63MHz. The amplitudes are 38.04Ω and 41.67Ω. The phases are −47.08° and −43.35°. The errors are 0.25%, 3.63Ω, and 3.73°. It is obvious that the simulation results are close to the measured results. Besides, because of the addition of the matching layer, the second resonance peak appears in all three transducers.

Figure 7. The simulated and measured results of transducers without cable (A) the amplitude of No. 1 transducer (B) the phase of No. 1 transducer (C) the amplitude of No. 2 transducer (D) the phase of No. 2 transducer (E) the amplitude of No. 3 transducer (F) the phase of No. 3 transducer.
In the experiment of transducer with cable, we compared the simulation results and measured results of three kinds of transducers, as shown in Figure 8. Under the influence of the long cable, the resonance was shifted, and the simulation results of the three transducers matched well with the measured results. In Figure 8B the phase of No. 1 transducer has a high deviation above 35MHz because in our experiments, the parameters of cable were measured and calculated at the center frequency of transducer, which is 12MHz. So, when the frequencies reach 35MHz, the parameters of the cable will become different. But in the software, the used parameters of the transmission line were not frequency dependent. So, the deviation is bigger in higher frequencies. Besides this, the individual differences between transducers we make, the processing methods, and the uniformity of the materials will all have an impact on the phase, especially the high frequency part. Moreover, the phase results are also easily affected by test conditions, polarization, and other conditions, so these factors lead to relatively large phase deviation.
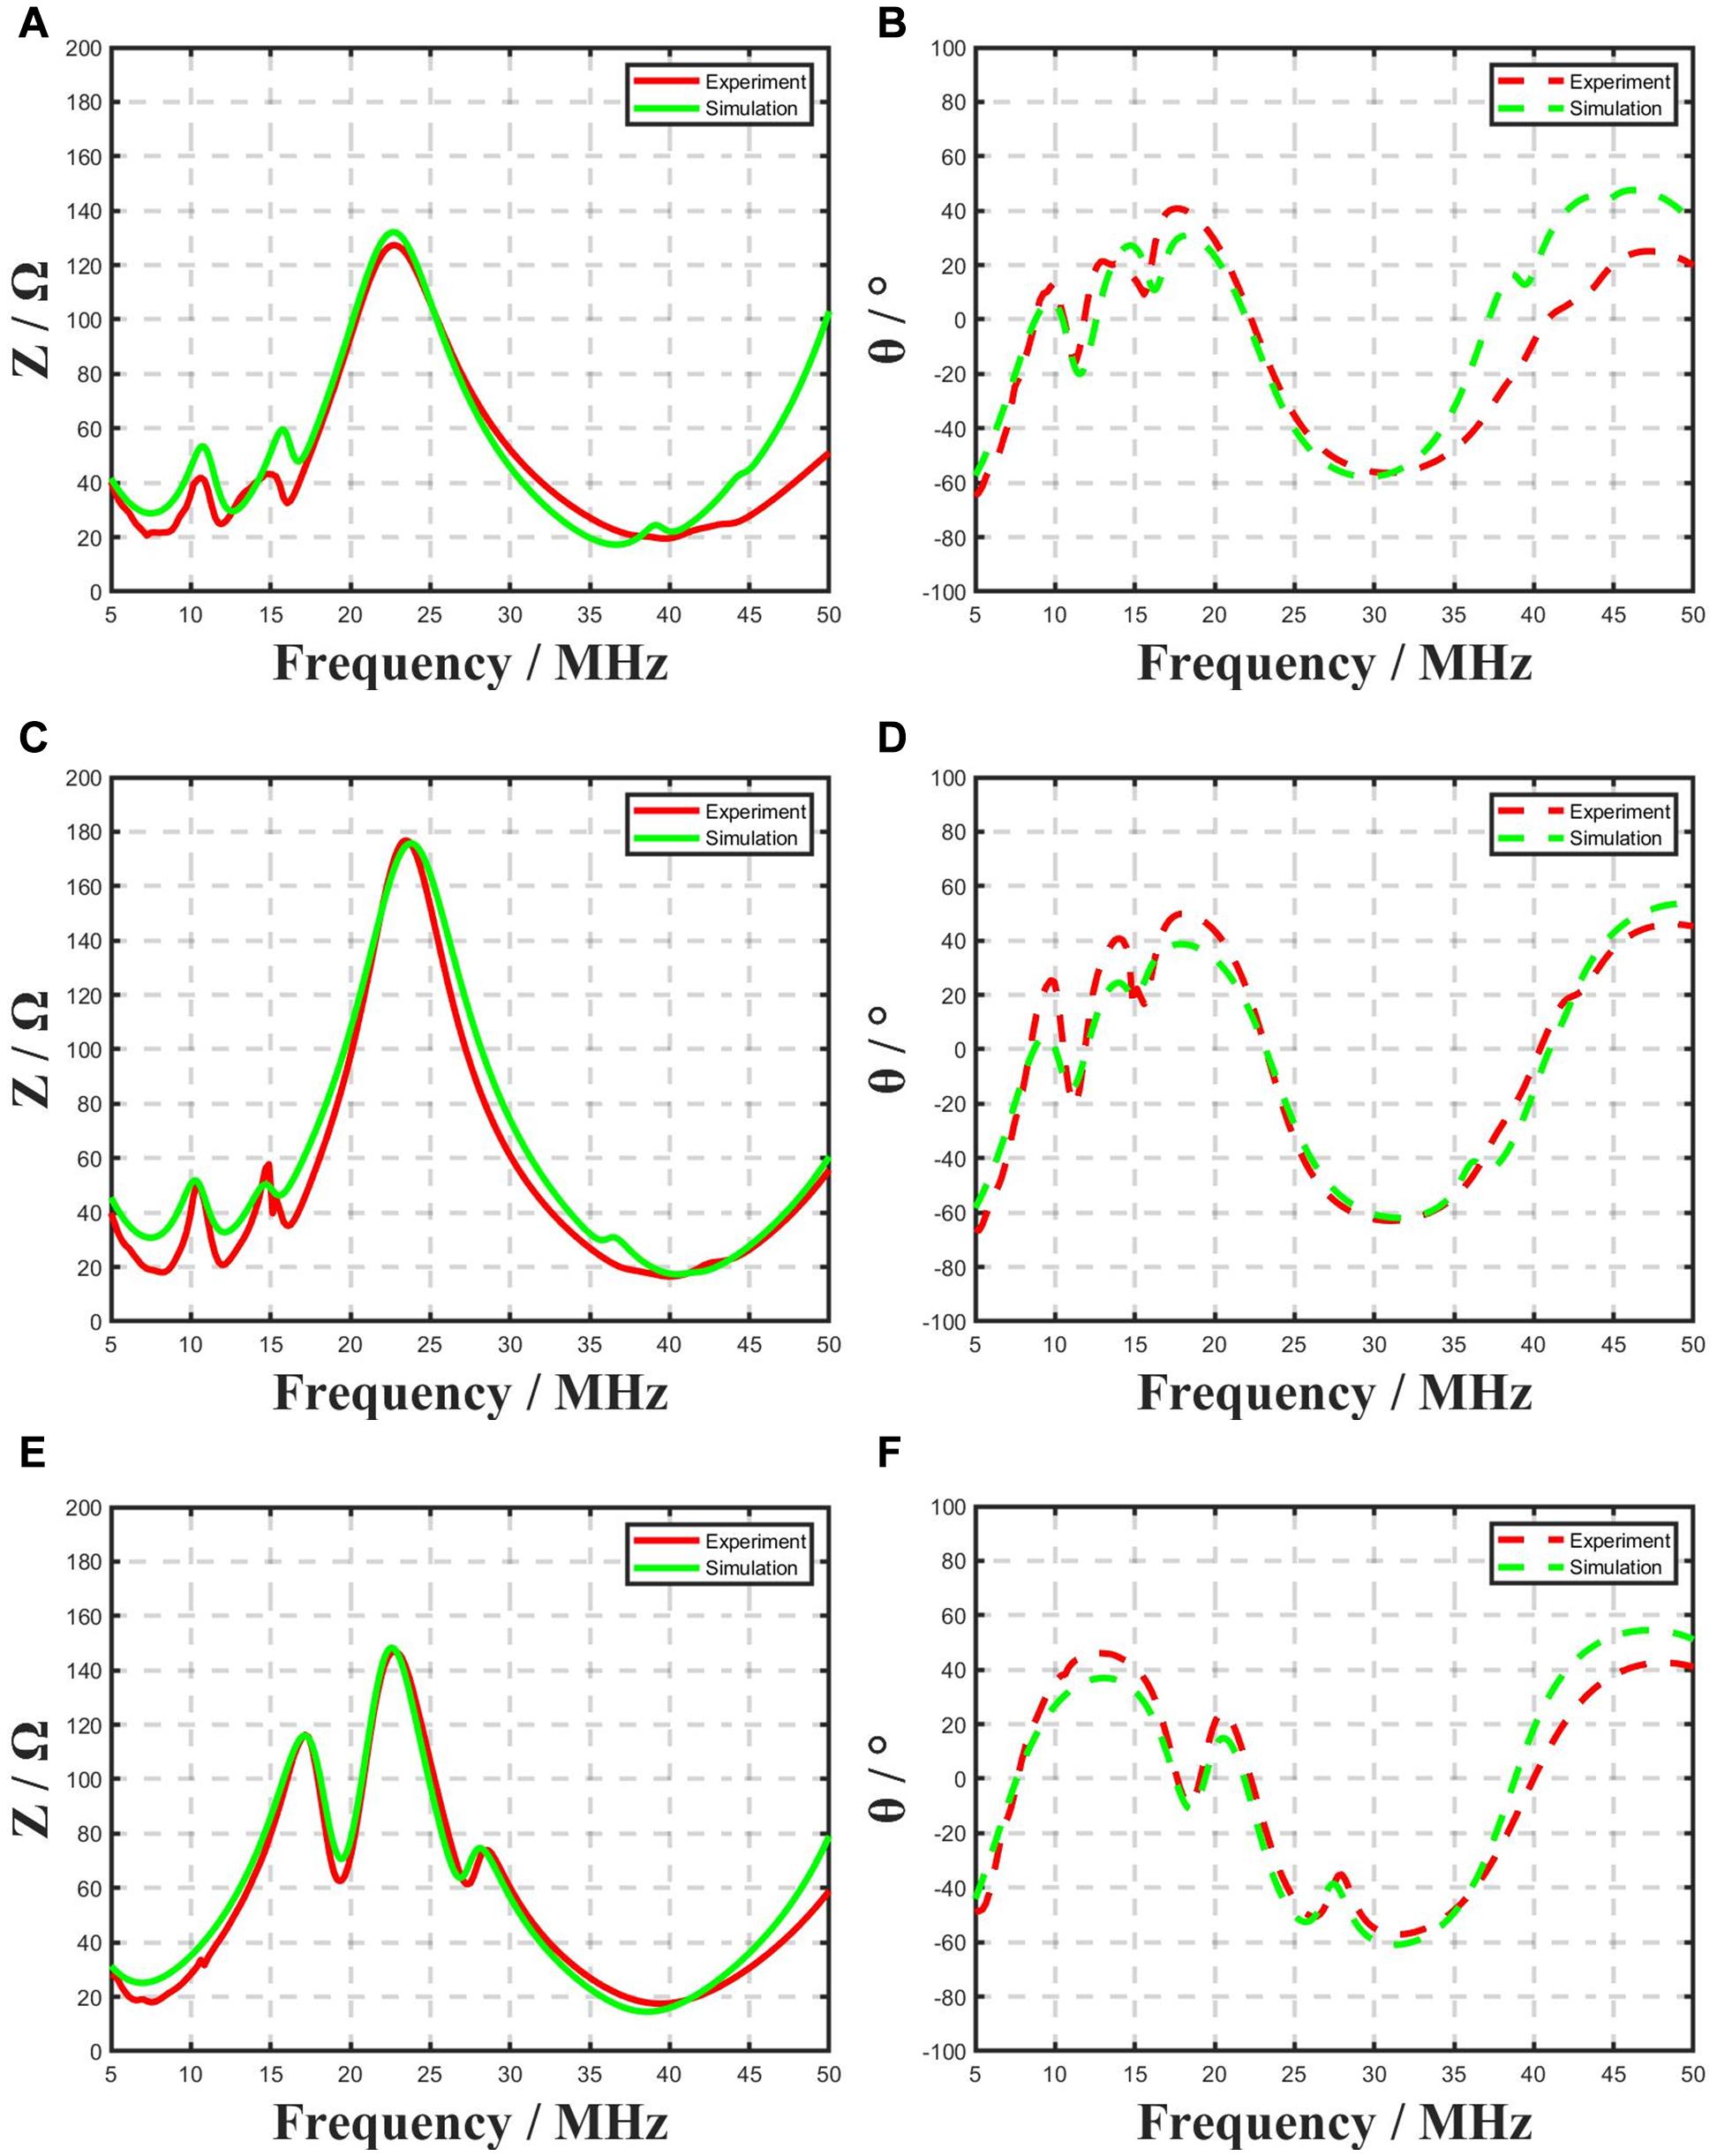
Figure 8. The simulated and measured results of transducer with cable (A) the amplitude of No. 1 transducer (B) the phase of No. 1 transducer (C) the amplitude of No. 2 transducer (D) the phase of No. 2 transducer (E) the amplitude of No. 3 transducer (F) the phase of No. 3 transducer.
In experiments with different cable lengths, we compared the simulation results and measured results of three kinds of wire length transducers, as shown in Figure 9. It can be seen that for high frequency transducers, the cable length has a significant effect on the transducer. The longer cable length is, the greater influence of performance is made. Especially at the center frequency, the amplitude of the impedance has been increased. It means that the attenuation of the center frequency is also influenced by the cable.
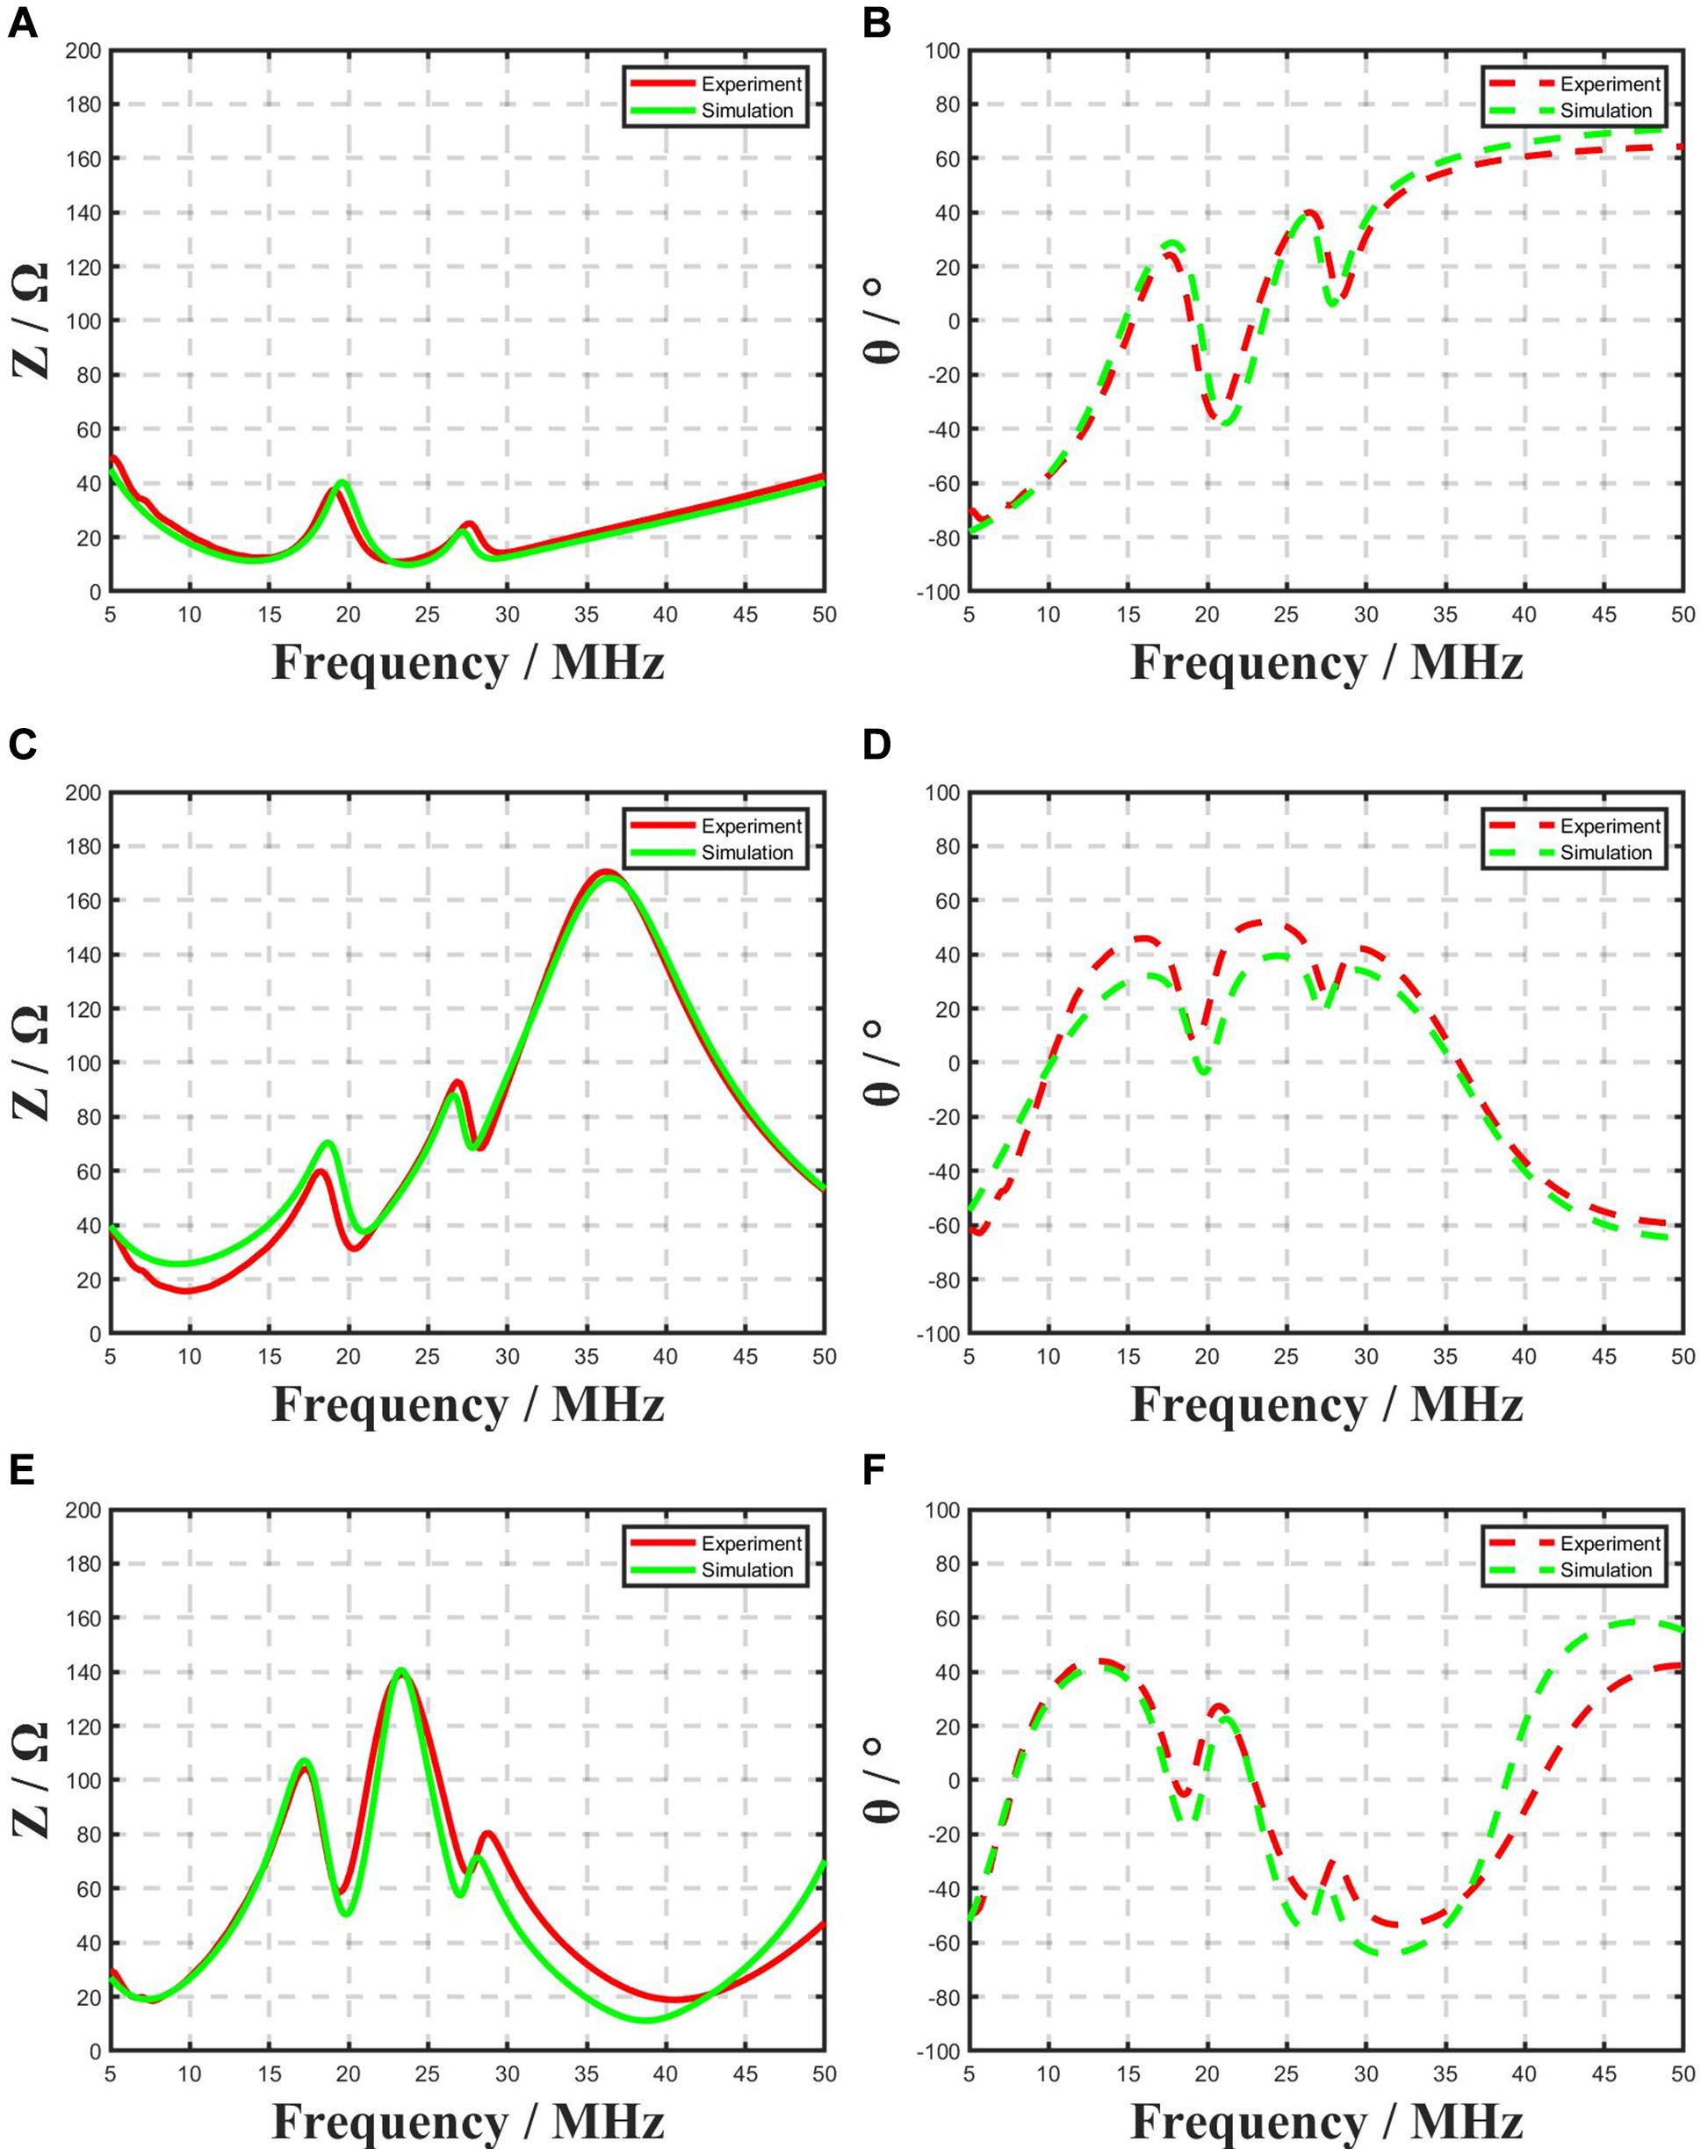
Figure 9. The simulated and measured results of (A) the amplitude of 20MHz transducer with 0.5 m cable (B) the phase of 20MHz transducer with 0.5 m cable (C) the amplitude of No. 3 transducer with 1.5 m cable (D) the phase of 20MHz transducer with 1.5 m cable (E) the amplitude of No. 3 transducer with 2.5 m cable (F) the phase of 20MHz transducer with 2.5 m cable.
In the experiment, we compared the simulation results and the measured results of the transducer with and without cables, respectively. Obviously, in the simulation results without cable, no matter what frequency or any kind of matching layer, the resonance impedances matched well with the actual results. Among them, the designed center frequencies calculated according to Eq. 1 are 13.5Ω, 12.4Ω, and 23 MHz, respectively. The measured values are 11.75Ω, 11.3Ω, and 19.63 MHz. These results are also close to the theoretical values. Moreover, due to the existence of the matching layer, the second resonance appeared in both the measured results and the simulation results. In addition, the part above 25 MHz in the simulation results did not match the measured parameters. That’s because in our experiment, some parameters like attenuations which the Leach model part used are measured and calculated at a fixed frequency and not changed by frequencies. It will have impact on the simulation results. Besides this, some parameters cannot be measured, and there is deviation between the theoretical value and the actual value. During the model optimization, we selected the impedance of the transducer as the optimization benchmark, so our impedance simulation results were closer to the measured value than the phase simulation results. Of course, if the phase is selected for model parameter optimization, the result can be closer to the actual value. In the following research, we will further improve our model, so that the simulation can be done well in both phase and impedance amplitude. So, it caused that the deviations about phase are higher than amplitude in Figure 7. We used the same material parameters to simulate 20 MHz transducer with PiezoCAD software. The results are shown in Figure 10, at the position of the resonance, the center frequency is 23.72 MHz, the amplitude is 2.11Ω and lower than the measured values, the phase is −44.04°. The compared results between this improved model and PiezoCAD are shown in Table 3. It is showed that the effect of this improved model is more suitable for complete transducer than PiezoCAD software based on KLM model. In KLM model, a frequency dependent transformer was used and it is not easy to achieve in PSPICE software. One of the main advantages in Leach model is easy to achieve. Besides, for the high frequency transducers, the different lengths of cable have a great impact on the transducers. In traditional KLM model, the influence of cable has not been considered because most transducers’ applications did not include long cable. But in some applications like IVUS, the influence of cable cannot be ignored. So, the biggest difference between this model and KLM model is that this model contained cable model. It could give the simulation results of transducer with cable, and use the circuit simulation software to achieve the circuit simulation.
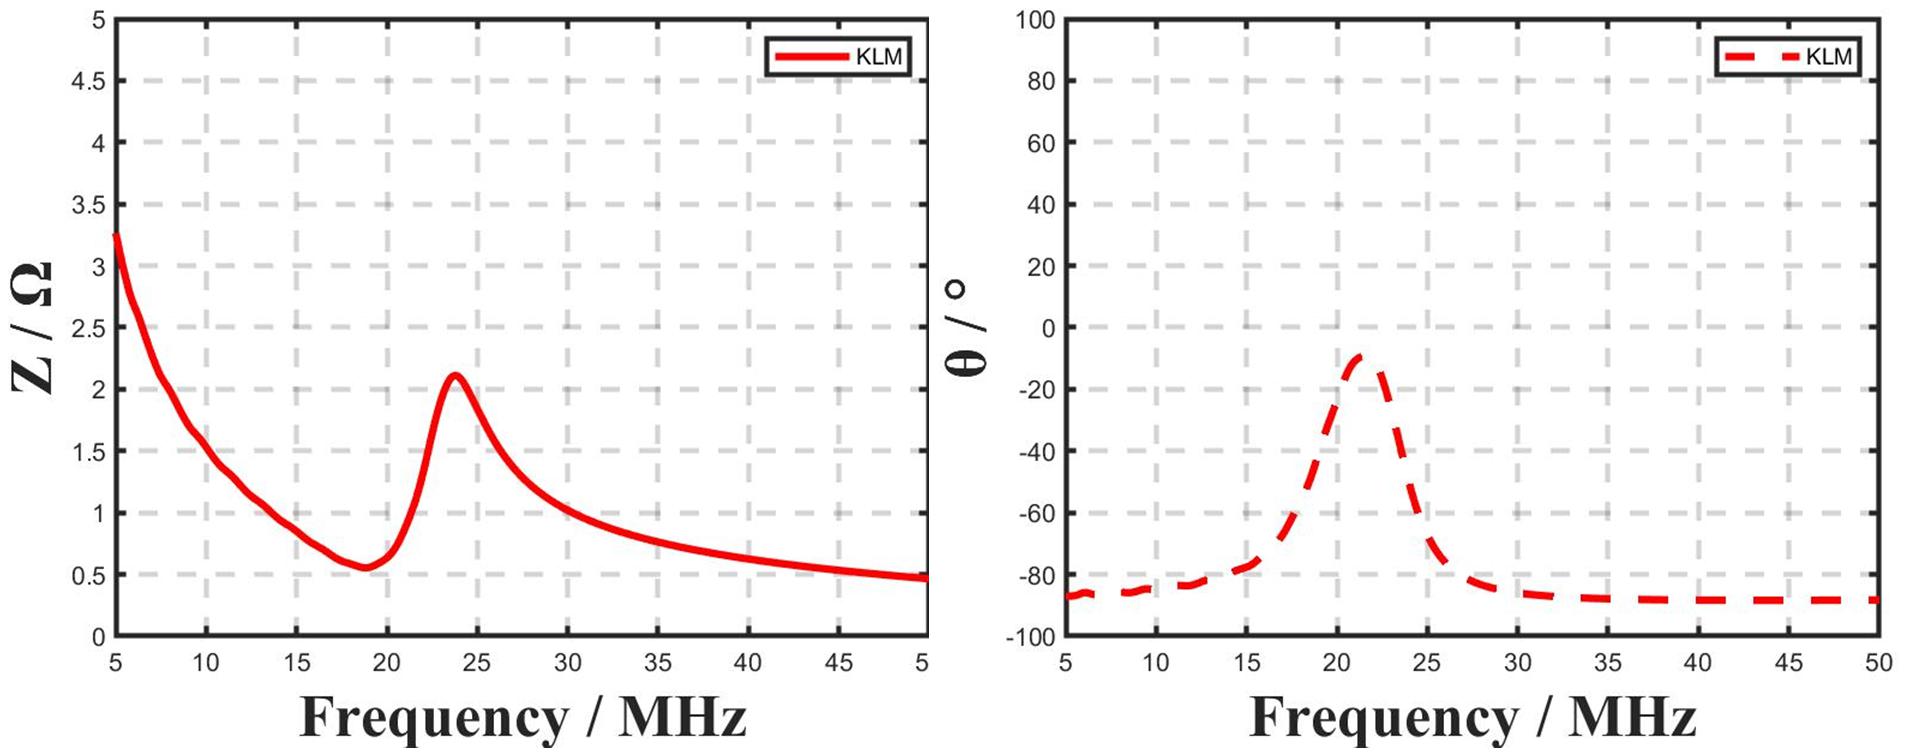
Figure 10. The amplitude and phase of 20M transducer by using PiezoCAD.

Table 3. The comparison of the improved model and PiezoCAD.
Simulation is important for the design of high frequency ultrasound transducer. Considering the influence of transmission lines, backing and matching layers, this paper established an improved complete ultrasound transducer model which can be realized in the circuit simulation software LTspice. This improved model can be used to predict the performance of transducer by measuring the parameters of material. And it includes the simulation of piezoelectric ceramic, matching layer, backing layer, and cable. In this paper, the model was simulated and compared with the measured results. This paper tested the comparison between the transducer and the actual situation under various circumstances. The results showed that the proposed model is in good agreement with the actual results for various frequencies, various matching layer materials, and various cable lengths. The errors of the simulated center frequencies are less than 1.5% and the errors of amplitudes are less than 10Ω. The simulation results are closer to the measured results than those of PiezoCAD based on KLM model. In conclusion, the complete transducer simulation model can be implemented in general circuit simulation software. The influence of cable and system can also be considered, which can be better used in the simulation of the whole system including the transducers.
The original contributions presented in the study are included in the article/supplementary material, further inquiries can be directed to the corresponding authors.
ZS proposed the concept and performed the simulations. JX and ZL fabricated the transducer. YCh contributed to the PiezoCAD simulation. YCu contributed to the discussions on the concept. XJ supervised the project and contributed to the writing of the manuscript. All authors contributed to the article and approved the submitted version.
This work was supported in part by the National Key Research and Development Program of China (Grant Nos. 2019YFC0120500 and 2018YFC0116201), National Natural Science Foundation of China (Grant Nos. 21927803 and 11704397), the Funds of Youth Innovation Promotion Association, Chinese Academy of Sciences (Grant Nos. Y201961, 20A122062ZY, and YJKYYQ20180031), and Funds of Suzhou Science and Technology Project (SS202062).
The authors declare that the research was conducted in the absence of any commercial or financial relationships that could be construed as a potential conflict of interest.
Aouzale, N., Chitnalah, A., Jakjoud, H., and Kourtiche, D. (2008). PSpice modelling of an ultrasonic setup for materials characterization. Ferroelectrics 372, 107–114. doi: 10.1080/00150190802382058
Chahal, J. S., and Reddy, C. C. (2013). Modeling and simulation of pulsed electroacoustic measurement method. IEEE Syst. J. 8, 1283–1292. doi: 10.1109/jsyst.2013.2292452
de Souza, C. R., Peres, P. L. D., and Bonatti, I. S. (2003). ABCD matrix: a unique tool for linear two-wire transmission line modelling. Int. J. Elect. Eng. Educ. 40, 220–229. doi: 10.7227/ijeee.40.3.5
Fan, X., Ma, S., and Zhang, X. (2014). Simulation analysis of piezoelectric ceramic chip PZT based on Ansys. Piezoelectr. Acoustooptics 36, 416–420.
Jensen, J. A. (2004). Simulation of advanced ultrasound systems using Field II. 2 IEEE Int. Symp. Biomed. Imag. Macro Nano 1-2, 636–639.
Jian, X., Li, Z., Han, Z., Xu, J., Liu, P., Liu, Y., et al. (2018). The study of cable effect on high frequency ultrasound transducer performance. IEEE Sens. J. 18, 5265–5271. doi: 10.1109/jsen.2018.2838142
Johansson, J., and Martinsson, P.-E. (2001). “Incorporation of diffraction effects in simulations of ultrasonic systems using PSpice models,’ in Proceedings of the 2001 IEEE Ultrasonics Symposium: An International Symposium (Cat. No. 01CH37263), Vol. 1, (New York, NY: IEEE), 405–410.
Kim, G., Hwang, Y.-I., Seo, M.-K., and Kim, K.-B. (2020). Electrical tuning for sensitivity enhancement of a piezo-electric ultrasonic transducer: Simulation and fabrication. J. Mech. Sci. Technol. 34, 3155–3164. doi: 10.1007/s12206-020-0707-1
Krimholtz, R., Leedom, D. A., and Matthaei, G. L. (1970). New equivalent circuits for elementary piezoelectric transducers. Electr. Lett. 6, 398–399. doi: 10.1049/el:19700280
Leach, W. M. (1994). Controlled-source analogous circuits and spice models for piezoelectric transducers. IEEE T Ultrason. Ferr. 41, 60–66. doi: 10.1109/58.265821
Magnusson, P. C., Weisshaar, A., Tripathi, V. K., and Alexander, G. C. (2000). Transmission Lines and Wave Propagation. Boca Raton, FL: CRC press.
Merdjana, T., Chaabi, A., and Rouabah, S. (2014). “VHDL-AMS and PSPICE modeling of ultrasonic piezoelectric transducer for biological mediums application,” in Proceedings of the 2014 International Conference on Advanced Technologies for Signal and Image Processing (ATSIP). (Sousse: IEEE)
Pandian, N. G., Weintraub, A., Kreis, A., Schwartz, S. L., Konstam, M. A., and Salem, D. N. (1990). Intracardiac, intravascular, two-dimensional, high-frequency ultrasound imaging of pulmonary artery and its branches in humans and animals. Circulation 81, 2007–2012. doi: 10.1161/01.cir.81.6.2007
Pavlin, C. J., and Foster, F. S. (1998). Ultrasound biomicroscopy: high-frequency ultrasound imaging of the eye at microscopic resolution. Radiol. Clin. North Am. 36, 1047–1058.
Peres, P. L. D., and Lopes, B. A. (1998). Transmission line modeling: a circuit theory approach. Siam Rev. 40, 347–352. doi: 10.1137/s0036144597316048
Rathod, V. T. (2020). A review of acoustic impedance matching techniques for piezoelectric sensors and transducers. Sensors (Basel) 20:4051. doi: 10.3390/s20144051
Redwood, M. (1961). Transient performance of a piezoelectric transducer. J. Acoustic. Soc. Am. 33, 527–536. doi: 10.1121/1.1908709
Roa-Prada, S., Scarton, H. A., Saulnier, G. J., Shoudy, D. A., and Gavens, A. J. (2007). “Modeling of an ultrasonic communication system,” in Proceedings of the Asme International Mechanical Engineering Congress & Exposition, (New York, NY: ASME), 133–146.
Sahai, A. (1998). Prospective assessment of the ability of endoscopic ultrasound to diagnose, exclude, or establish the severity of chronic pancreatitis found by endoscopic retrograde cholangiopancreatography. Gastrointest Endosc. 48, 18–25. doi: 10.1016/s0016-5107(98)70123-3
Takahashi, V. L., Kubrusly, A. C., Braga, A., Quintero, S. M., Figueiredo, S. W., and Domingues, A. B. (2019). Ultrasonic power and data transfer through multiple curved layers applied to pipe instrumentation. Sensors 19:4074. doi: 10.3390/s19194074
Tarpara, E. G., and Patankar, V. (2018). Lossless and lossy modeling of ultrasonic imaging system for immersion applications: Simulation and experimentation. Comput. Electr. Eng. 71, 251–264. doi: 10.1016/j.compeleceng.2018.07.054
Turnbull, D. H., Starkoski, B. G., Harasiewicz, K. A., Lockwood, G. R., and Foster, F. S. (1993). “A 40–100 MHz B-scan ultrasound backscatter microscope for skin imaging,” in Proceedings of the IEEE Ultrasonics Symposium, (New York, NY: IEEE)
Van Deventer, J., and Lofqvist, T. (2000). PSpice simulation of ultrasonic systems. IEEE Trans. Ultrason. Ferroelectr. Freq. Control 47:1014. doi: 10.1109/58.852085
Wu, L., and Chen, Y. C. (1999). PSPICE approach for designing the ultrasonic piezoelectric transducer for medical diagnostic applications. Sens. Actuat. A Phys. 75, 186–198. doi: 10.1016/s0924-4247(99)00067-9
Zheng, D.-D., Mao, Y., and Lv, S.-H. (2019). Research and validation of design principles for PVDF wideband ultrasonic transducers based on an equivalent circuit model. Measurement 141, 324–331. doi: 10.1016/j.measurement.2019.04.050
Zheng, D.-D., Mao, Y., Cui, Z., and Lv, S.-H. (2018). “Optimization of equivalent circuit model for piezoelectric ultrasonic transducer,” in 2018 IEEE International Instrumentation and Measurement Technology Conference (I2MTC), (New York, NY: IEEE), 1–5.
Keywords: equivalent circuit, simulation, high frequency, transducer, cable, PSPICE
Citation: Shen Z, Xu J, Li Z, Chen Y, Cui Y and Jian X (2021) An Improved Equivalent Circuit Simulation of High Frequency Ultrasound Transducer. Front. Mater. 8:663109. doi: 10.3389/fmats.2021.663109
Received: 02 February 2021; Accepted: 22 March 2021;
Published: 09 April 2021.
Edited by:
Chunlong Fei, Xidian University, ChinaReviewed by:
Laiming Jiang, University of Southern California, Los Angeles, United StatesCopyright © 2021 Shen, Xu, Li, Chen, Cui and Jian. This is an open-access article distributed under the terms of the Creative Commons Attribution License (CC BY). The use, distribution or reproduction in other forums is permitted, provided the original author(s) and the copyright owner(s) are credited and that the original publication in this journal is cited, in accordance with accepted academic practice. No use, distribution or reproduction is permitted which does not comply with these terms.
*Correspondence: Xiaohua Jian, amlhbnhoQHNpYmV0LmFjLmNu; Yaoyao Cui, Y3VpeXlAc2liZXQuYWMuY24=
Disclaimer: All claims expressed in this article are solely those of the authors and do not necessarily represent those of their affiliated organizations, or those of the publisher, the editors and the reviewers. Any product that may be evaluated in this article or claim that may be made by its manufacturer is not guaranteed or endorsed by the publisher.
Research integrity at Frontiers
Learn more about the work of our research integrity team to safeguard the quality of each article we publish.