 Marina Schwan
 Sarah Nefzger
 Behdad Zoghi1,2
 Christina Oligschleger
 Barbara Milow
94% of researchers rate our articles as excellent or good
Learn more about the work of our research integrity team to safeguard the quality of each article we publish.
Find out more
ORIGINAL RESEARCH article
Front. Mater., 09 April 2021
Sec. Polymeric and Composite Materials
Volume 8 - 2021 | https://doi.org/10.3389/fmats.2021.662487
This article is part of the Research TopicAdvances in Functional Aerogels: Preparation, Properties, and ApplicationsView all 5 articles
The solvent exchange as one of the most important steps during the manufacturing process of organic aerogels was investigated. This step is crucial as a preparatory step for the supercritical drying, since the pore solvent must be soluble in supercritical carbon dioxide to enable solvent extraction. The development and subsequent optimization of a suitable system with a peristaltic pump for automatic solvent exchange proved to be a suitable approach. In addition, the influence of zeolites on the acceleration of the process was found to be beneficial. To investigate the process, the water content in acetone was determined at different times using Karl Fischer titration. The shrinkage, densities, as well as the surface areas of the aerogels were analyzed. Based on these, the influence of various process parameters on the final structure of the obtained aerogels was investigated and evaluated. Modeling on diffusion in porous materials completes this study.
Aerogels are open porous solid materials typically produced via the sol-gel process. The drying procedure is the most crucial step in producing nanostructured aerogels in order to avoid shrinkage or fractures in the structure caused by strong capillary forces while drying. To prevent this, a sophisticated method, such as drying in supercritical carbon dioxide (scCO2), is needed (Kistler, 1932; Hüsing and Schubert, 1998). The supercritical drying is usually performed in an autoclave. The pressure and temperature are increased until they exceed the corresponding critical values of the solvent. In the supercritical state, there are no liquid-vapor-interfaces which can destroy the structure by means of surface tension and capillary forces. After the pore solvent (e.g., ethanol, isopropanol, acetone, or other non-polar solvents) is replaced by scCO2, the pressure and temperature can be decreased and brought back to the room conditions. When dry gels are exposed to air, the carbon dioxide is replaced by air and the subsequent gels are called aerogels.
An important step prior to drying is solvent exchange or so-called washing, as shown in Figure 1. In wet gels, the pores are filled with unreacted educts, oligomers and solvent used during synthesis, e.g., the synthesis of resorcinol-formaldehyde aerogels is typically done in an aqueous solution (Pekala, 1989; Tannert et al., 2015), silica gels are generally produced in ethanol or methanol solutions (Hüsing and Schubert, 1998). The goals of the washing step are:
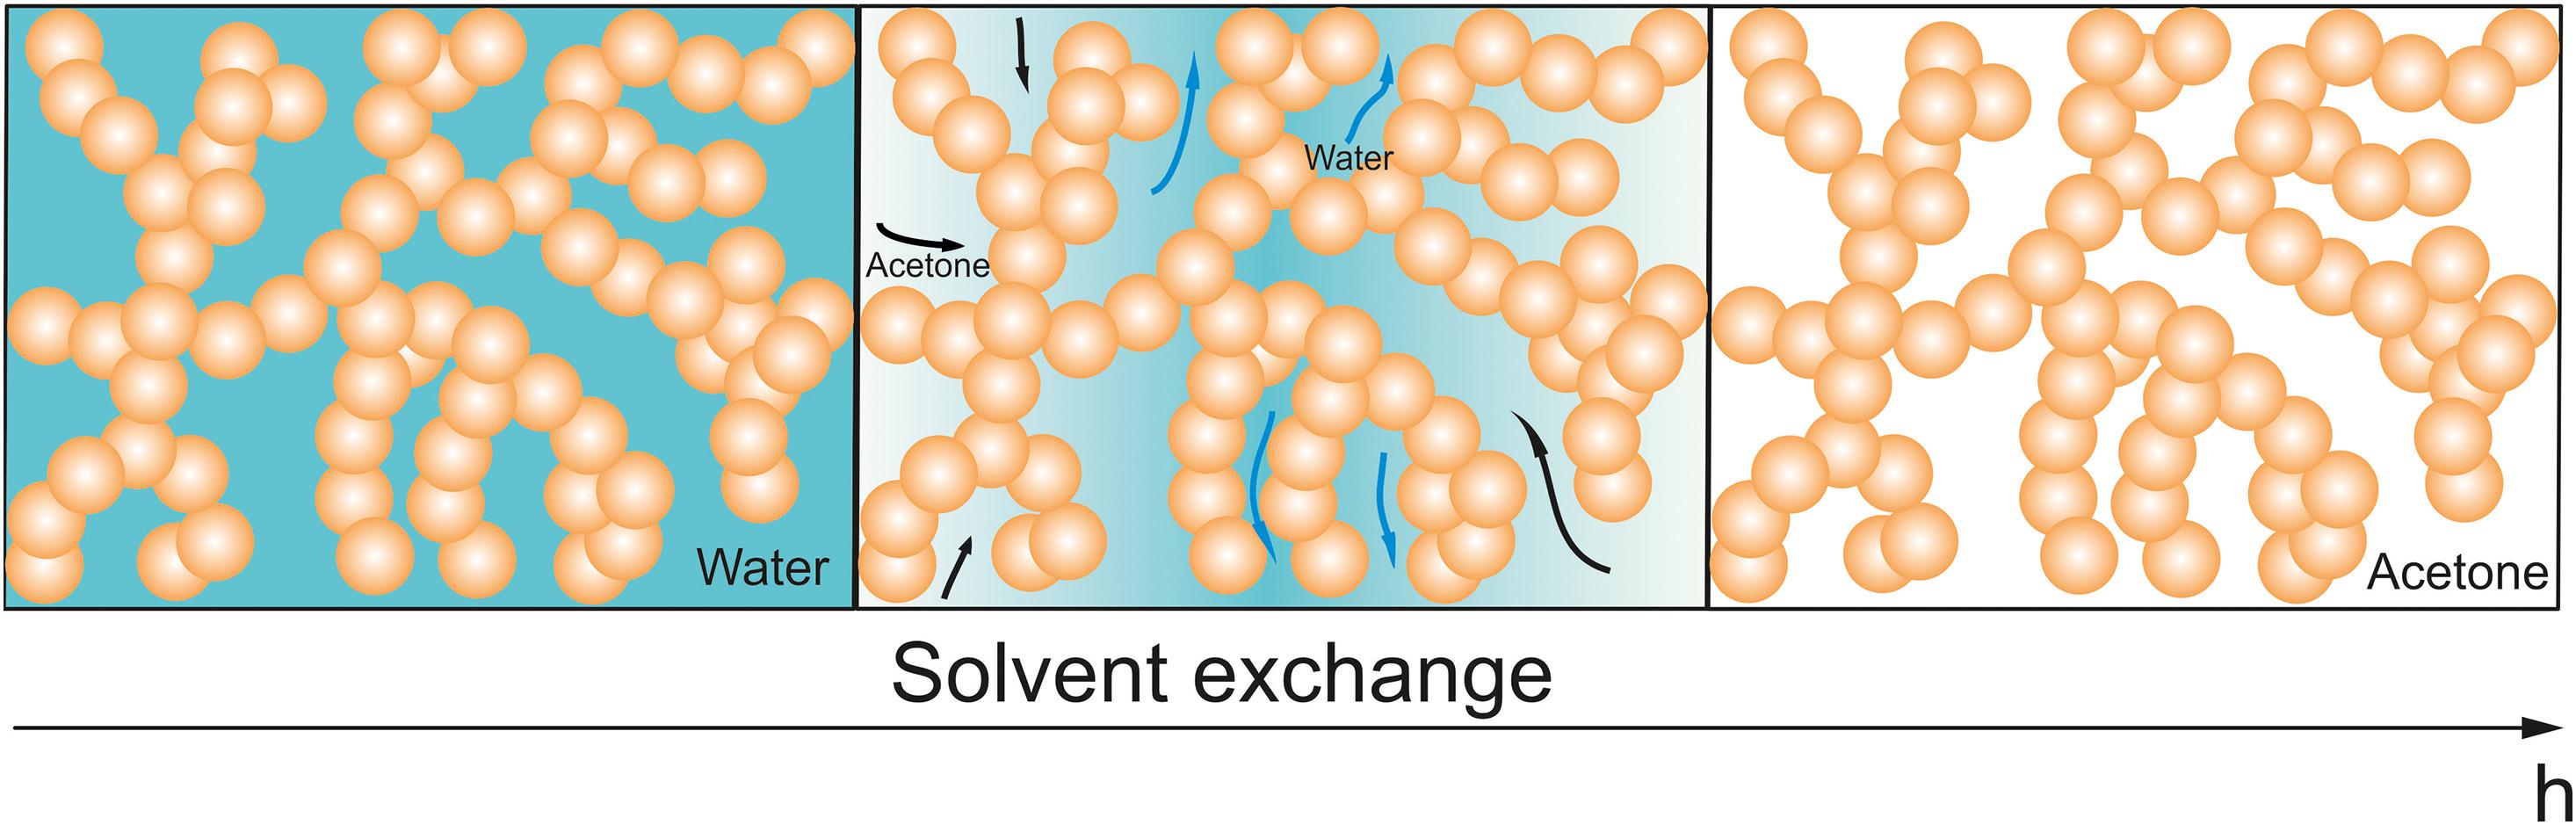
Figure 1. Scheme of solvent exchange of RF aerogels. Left: After sol-gel process, the pores are filled with water and unreacted chemicals. Middle: During solvent exchange, water inside of the pores is replaced by acetone. Right: Finally, only acetone is present in the pores.
(1) Removal of unreacted chemicals;
(2) Exchange of the pore solvent by the drying solvent. The drying solvent should be a solvent which is soluble in supercritical carbon dioxide (at 304 K and 7 bar).
For wet gels produced in aqueous solutions, such as resorcinol-formaldehyde (RF), the washing step plays a very important role, since water is not soluble in scCO2. The presence of remaining water inside of pores leads to a high surface tension, thus causing cracks and shrinkage of aerogels. Synthesis of shrinkage-free aerogels is only possible after sufficient solvent exchange, followed by supercritical drying.
The solvent exchange mostly is performed in the same way: the wet gels are placed in the corresponding solvent, which could be stirred and is frequently replaced with fresh solvent until the exchange is completed. Several studies describe this procedure with a whole duration of washing of about 3 days (Saliger et al., 1997; Petričević et al., 1998; Czakkel et al., 2005; Alshrah et al., 2017).
The influence of the solvent type on the RF aerogel structure was studied by Lambert et al. (1997), where they observed a swelling of gels during washing with isopropanol. Bangi et al. (2010) investigated the effects of washing temperature and washing periods and similar to Lambert et al., they varied the washing solvents. They found out that elevated temperature crumbled the gel network leading to high shrinkage of about 70% (Bangi et al., 2010). The variation of washing periods was indicated as a strengthening method for silica aerogels by using of acidic or basic catalysts. Increased period of washing led to strengthened gels and reduced shrinkage (Einarsrud et al., 2001; Bangi et al., 2010). Robitzer et al. (2008) observed shrinkage of wet calcium alginate gels even during solvent exchange, where the exchange of water by ethanol led to a 4% volume shrinkage. Moreover, the solvent exchange procedure in biopolymer-based aerogels was investigated recently (Gurikov et al., 2019). The chitin- (Ganesan et al., 2018) and cellulose-based (Karadagli et al., 2015) aerogels are mostly washed in ethanol, as well as bi-component natural aerogels based on alginate-gelatin and chitosan-gelatin (Baldino et al., 2015). In this work, the aging process and the shape of the wet gels were found to have a crucial influence on the shrinkage of the corresponding aerogels. Furthermore, the critical solvent concentration, above which the supercritical drying can be performed without a risk of pore collapse, has been investigated.
Due to the increased industrial interests in aerogels, the up-scaling, time- and energy-less synthesis, fast and effective drying became very important aspects. Supercritical drying has been studied for several years in great detail (Lebedev et al., 2015; Lázár and Fábián, 2016; Şahin et al., 2018, 2019). The understanding of diffusion and mass transport mechanisms during extraction of the pore solvent leads to optimized, cost reduced drying technique. Raman, UV and IR spectroscopies, NMR have been used for analysis of scCO2 and solvent mixtures (Tajiri et al., 1995; Novak and Knez, 1997; Wawrzyniak et al., 2001; Innerlohinger et al., 2006; Griffin et al., 2014; Sanz-Moral et al., 2014; Quiño et al., 2016). The influence of aerogel sample thickness on duration and costs of supercritical drying has also been studied (van Bommel and de Haan, 1995; Szczurek et al., 2011).
In this paper, an optimization of the solvent exchange procedure is presented. The primary aims of this study are:
• Decrease and optimization of the duration of solvent exchange;
• Development of a measurement method for the determination of water amount in the pore fluid.
The measurement of water amount is an important step during solvent exchange, as it indicates the progress of solvent exchange. First, with the help of Karl Fischer titration, the content of the pore solvent was analyzed and the duration of washing optimized. Second, the usage of zeolites led to a further decrease in time, due to their high water adsorbance capacity. Third, dynamic solvent exchange accelerated the diffusion of water and solvent molecules thus leading to faster washing of aerogels. Thus, a solvent exchange setup was built, where the solvent was pumped through aerogels and a zeolite bath. A solvent sample for Karl Fischer titration can be taken through a small opening using a syringe.
Formaldehyde (24% w/w, not stabilized) was purchased from VWR International (Germany), resorcinol (≥98%) and anhydrous sodium carbonate (≥99.8%) from Sigma Aldrich (Germany). Acetone (≥99%) was obtained from Chemsolute (Germany). A solution of nitric acid (2.0 N) was supplied by AppliChem Panreac (Germany). The reagents for Karl Fischer titration were purchased from Merck (Germany). Zeolites with pore width of 3 Å were supplied by ThermoFischer Scientific (Germany).
Resorcinol (R) was dissolved under stirring in deionized water (≤1 μS cm–1) at room temperature (24 ± 2°C) with a stirring velocity of approx. 250 rpm and molar ratio R:W = 0.019. Formaldehyde (F) together with sodium carbonate as a catalyst (C) were added under stirring (R:F = 0.5) The molar ratio was adjusted to R:C = 200. After the addition of F and C, the solution was stirred for five more minutes to ensure homogeneity. SevenEasy pH (Mettler Toledo, Germany) was utilized to adjust the pH to 6.5 adding nitric acid drop by drop. The stirring was continued for 30 min at room temperature. The transparent solution was poured in 60 mL closeable polypropylene containers with inner diameter of 50 mm and treated in the oven for a period of 2 days. On the first day, the temperature was adjusted to 60°C, and was increased to 80°C on the second day. During gelation and curing, the hydrogels changed their color to red and became opaque.
Afterward, the samples were transferred into an acetone bath and were washed. For this study, the solvent exchange process was carried out in three different ways (Figure 2):
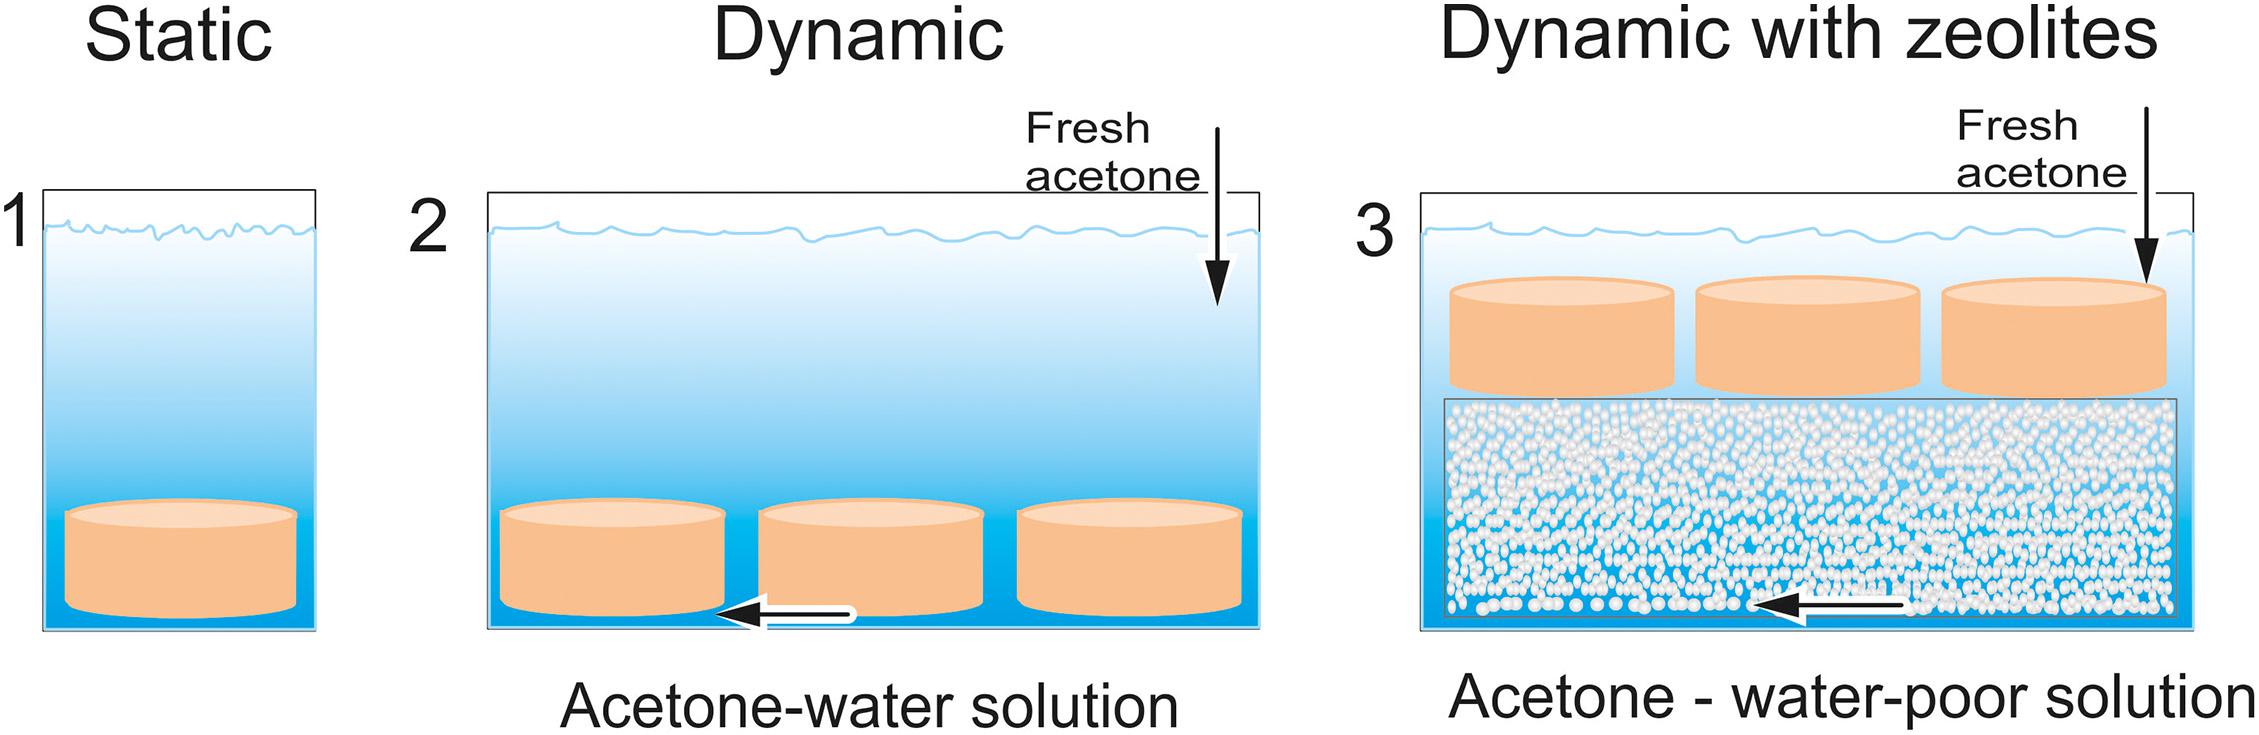
Figure 2. Three different setups for solvent exchange: (1) static method with placing samples in acetone bath; (2) Dynamic solvent exchange by use of pump; (3) Dynamic solvent exchange with additional use of zeolites as adsorptive.
(1) Conventional static solvent exchange method. The samples were placed in an acetone bath at room temperature, and the acetone was refreshed twice a day. The whole process took 3 days. The driving force in conventional method is the diffusion.
(2) Dynamic solvent exchange by use of pump. The samples were placed in acetone bath, where the acetone was pumped. The dynamic solvent exchange accelerated the diffusion. In this study, we investigated the influence of pump speed on the solvent exchange procedure.
(3) Dynamic solvent exchange with additional use of zeolites as adsorptive. The samples and zeolites were placed in acetone bath, where the acetone was pumped. The zeolites adsorbed water from acetone-water solution, so that the concentration gradient always remained high, until the adsorption capacity of zeolites was exhausted. Thus, diffusion was promoted by pumping and by keeping the concentration gradient high. Different zeolite volumes were investigated in this study.
The samples were named as follows: Samples number-pump speed-volume of zeolite, e.g., 3-150-2.2; meaning that 3 wet gels were washed dynamically with pump speed of 150 rpm and 2.2 L of zeolite.
In order to protect and separate the samples during the supercritical drying in the autoclave (Eurotechnica, Germany), each sample was wrapped in Light-Duty Tissue Wipers (VWR, Germany). 100 mL of acetone was poured into the sample container to ensure a saturated atmosphere during the loading. After loading, the autoclave was closed. Then, CO2 was introduced with a flow rate between 1.5 and 3.5 kg h–1 until a pressure equilibrium was reached both in the gas cylinder and in the sample container of the autoclave. The samples were dried at a temperature of 50°C and a pressure of 100 bar with a flow rate of 15 kg h–1 until no acetone was left in the drain container of the autoclave (16–32 h).
The samples were characterized by its envelope and skeletal density, inner surface area, pore size distribution, as well as by scanning electron microscopy (SEM) and shrinkage. The samples were weighed using UniBloc AUW220 (Shimadzu, Japan) and the volume was determined by GeoPyc 1360 (Micromeritics, United States) in order to calculate the envelope density and the relative shrinkage. Skeletal volume was measured using an AccuPyc II instrument (Micromeritics, United States) in order to determine the skeletal density. This device measures the pressure in a sample chamber by using a known volume of helium gas as an inert gas. The inner surface area and pore size distribution were determined by BET and BJH method. The samples were prepared by heating at a temperature of 110°C (18–22 h) in vacuum (0.2–0.3 mbar) to remove the residual adsorbates.
The water content in the drying solvent acetone was determined by Karl Fisher titration with volumetric TitroLine 7500 KF (SI Analytics, Germany) using the one-component reagent AquaStar Combititrant and Karl Fischer Solvent K reagent as a working medium.
The main reaction of Karl Fisher titration is the oxidation of iodide to iodine at the anode, while iodine is simultaneously reduced to iodide at the cathode:
No current flows as long as reducing agents (e.g., water) are still present in the sample, added iodine is consumed immediately. When all the reducing components have been consumed, iodine and iodide are presented as a reversible redox pair and current can flow between the electrodes. Besides water and iodine, an alcohol, sulfur dioxide, and a base participate in the reaction (Reining, 2018).
It should be noted that, a one-component reagent is required for water determinations in aldehydes and ketones. Since, the standard reagent contains alcohol (e.g., methanol), and carbonyl groups of aldehydes or ketones react with methanol under formation of acetal or ketal and water (Bruttel and Schlink, 2006; Ausbildungszentrum Muttenz, 2017). This water-producing reaction is shown in Figure 3.
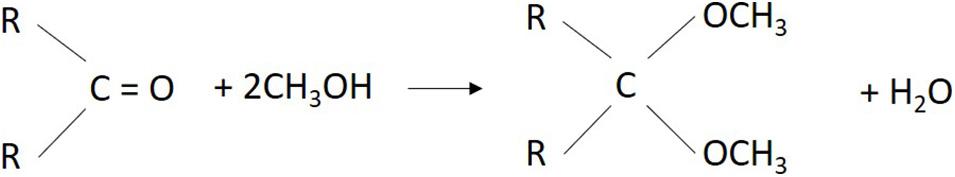
Figure 3. Side reaction of aldehydes or ketones with methanol during Karl Fischer titration. Forming water can falsify the results of water determination.
This leads to higher water contents and dwindling endpoints, since the equivalence point is difficult to determine due to the formation of water during the titration. Although, ketones are less reactive than aldehydes, the ketal formation is still fast in acetone. The reactivity decreases with increasing chain length of ketones. Since, the titration is faster than the ketal formation, it is important to carry out the determination as quickly as possible. The second side reaction that interferes with the investigation is bisulfite addition, in which the water in the sample is consumed and the water content to be determined appears too low. Thus, the choice of reagents for the Karl Fisher titration is important depending on the solvent where water is dissolved. In this study, methanol-free reagents were used to avoid the side reactions.
The Karl Fischer titrator determines the mass fraction of water ωwater in the solvent. This is defined as the ratio of the mass of water mwater in relation to the total mass, which is composed of the mass of water and the mass of acetone macetone.
This value depends on the mass of acetone used for solvent exchange. Since, different acetone masses or volumes were used in this work, the contained mass of water was determined by transforming the above equation for a better comparison of the measured values (Nefzger, 2020):
The results of three different solvent exchange techniques are presented in this section.
Table 1 shows differences between four experiment series (A–D) and general properties of produced aerogels. The envelope density of aerogels was between 0.14 and 0.15 g/cm3 and the skeletal density was found to be about 1.5 g/cm3, which is typical for RF aerogels (Reichenauer et al., 1995). The measured surface areas were all nearly 350 m2/g. Differences in washing conditions did not lead to significant changes. The radial shrinkage varied from 3.2 to 10.2% and strongly depended on the solvent exchange conditions and the final water amount in the pores prior drying.
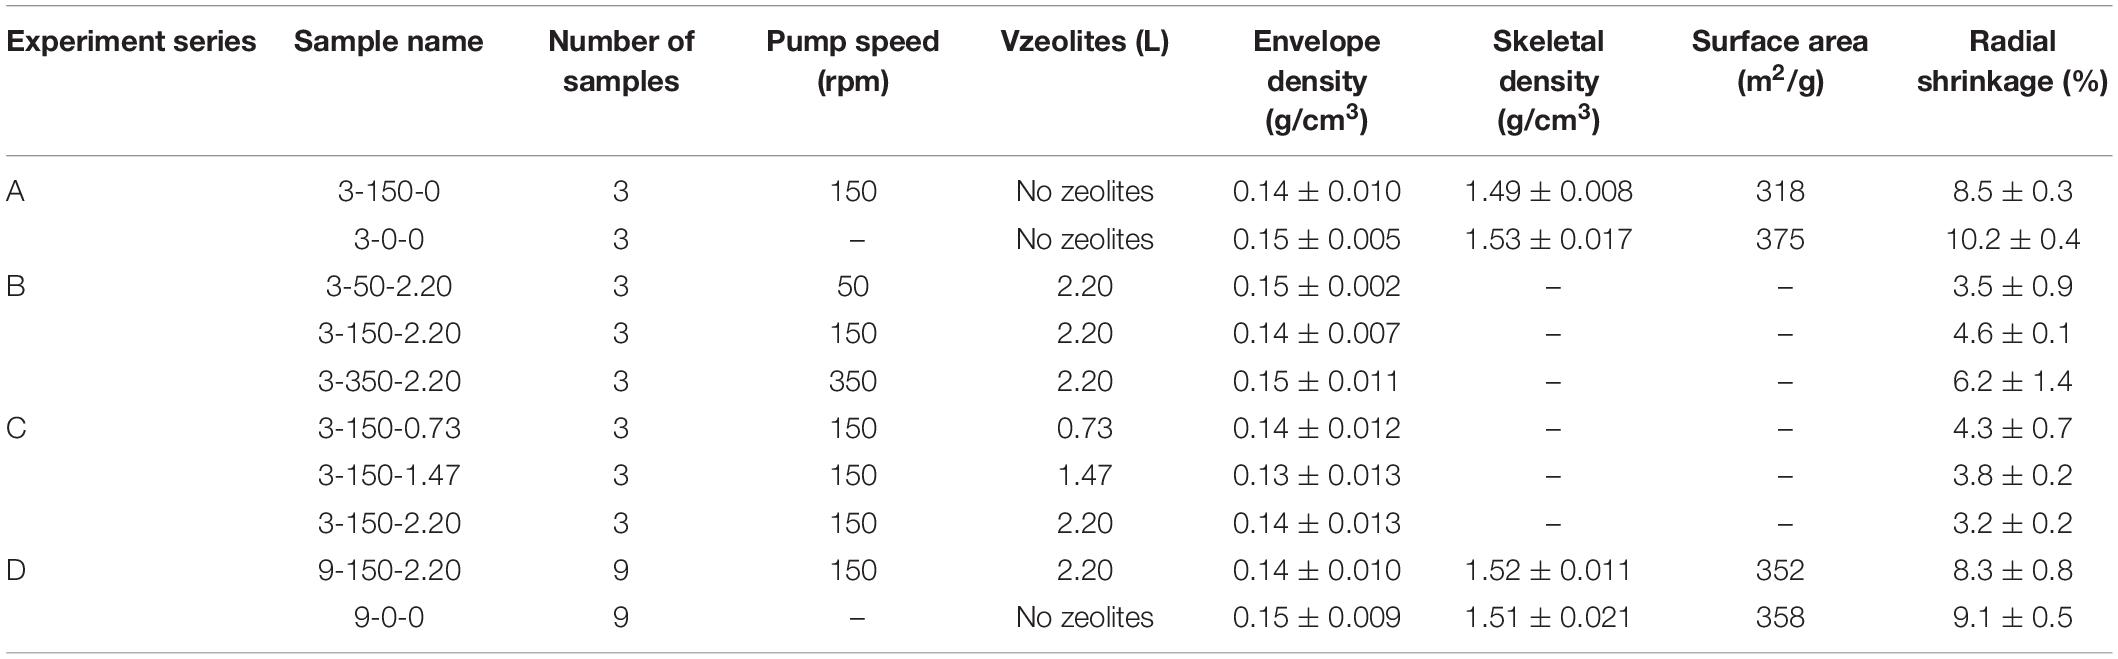
Table 1. Washing conditions and material properties of the RF aerogels.
The microstructure and a photograpf of RF aerogels is shown in Figure 4 (right). The network of static washed aerogel consisted of small particles of about 100 nm. Figure 4 (left) shows the morphology and the sample of a dynamically washed aerogel with the usage of pump and zeolite. The structure of both samples was similar, suggesting that the dynamic solvent exchange did not cause some significant changes.
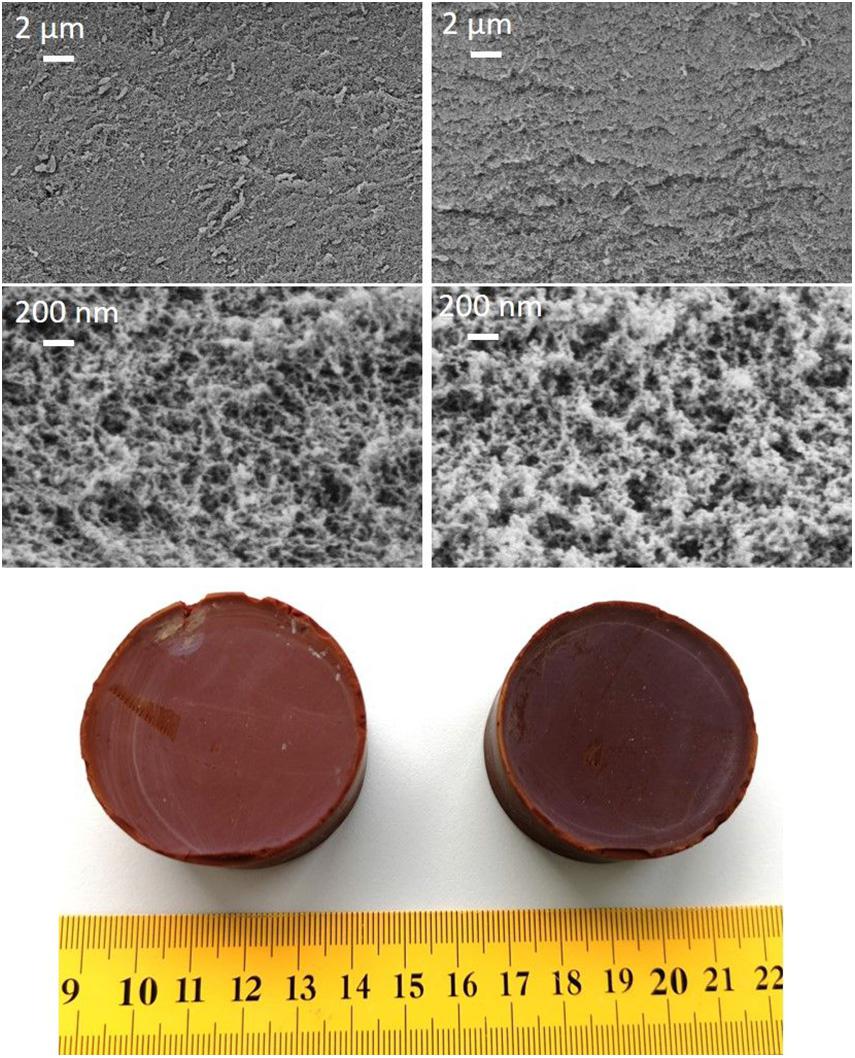
Figure 4. (left) SEM images with different magnifications and a photograph of dynamic (with pump and zeolite) washed RF aerogel; (right) SEM images with different magnifications and a photograph of static washed RF aerogel.
First, the concentration of water in acetone was monitored during static solvent exchange. For this, wet gels were placed in acetone, the solvent exchange was carried out one up to six times. The samples, which were washed only once and twice, showed high water concentration in the water-acetone mixture, and were subsequently neither dried nor characterized. The water amount, shrinkage and envelope densities are summarized in Figure 5. As expected, the water amount decreased with rising steps of solvent exchange. After six steps, the pore fluid contained only 2.5 g (1 wt.-%) of water (Table 2). Moreover, similar trend could be seen for radial shrinkage of samples. Gels washed 5 or 6 times, containing low water concentration (1–3 wt.-%), showed only 4.5–4.7% of shrinkage. This was expected, due to the deleterious effect of water, high surface tension, and capillary forces during drying, which resulted in the destruction of the structure. Thus, the water content was reduced to only a few percent, before the gels could be dried, without creating capillary forces. This was in agreement with the phase diagram of scCO2/H2O/Acetone mixture at 333 K and 100 bar (Panagiotopoulos and Reid, 1987). As a result of the shrinkage, the envelope density also changed.
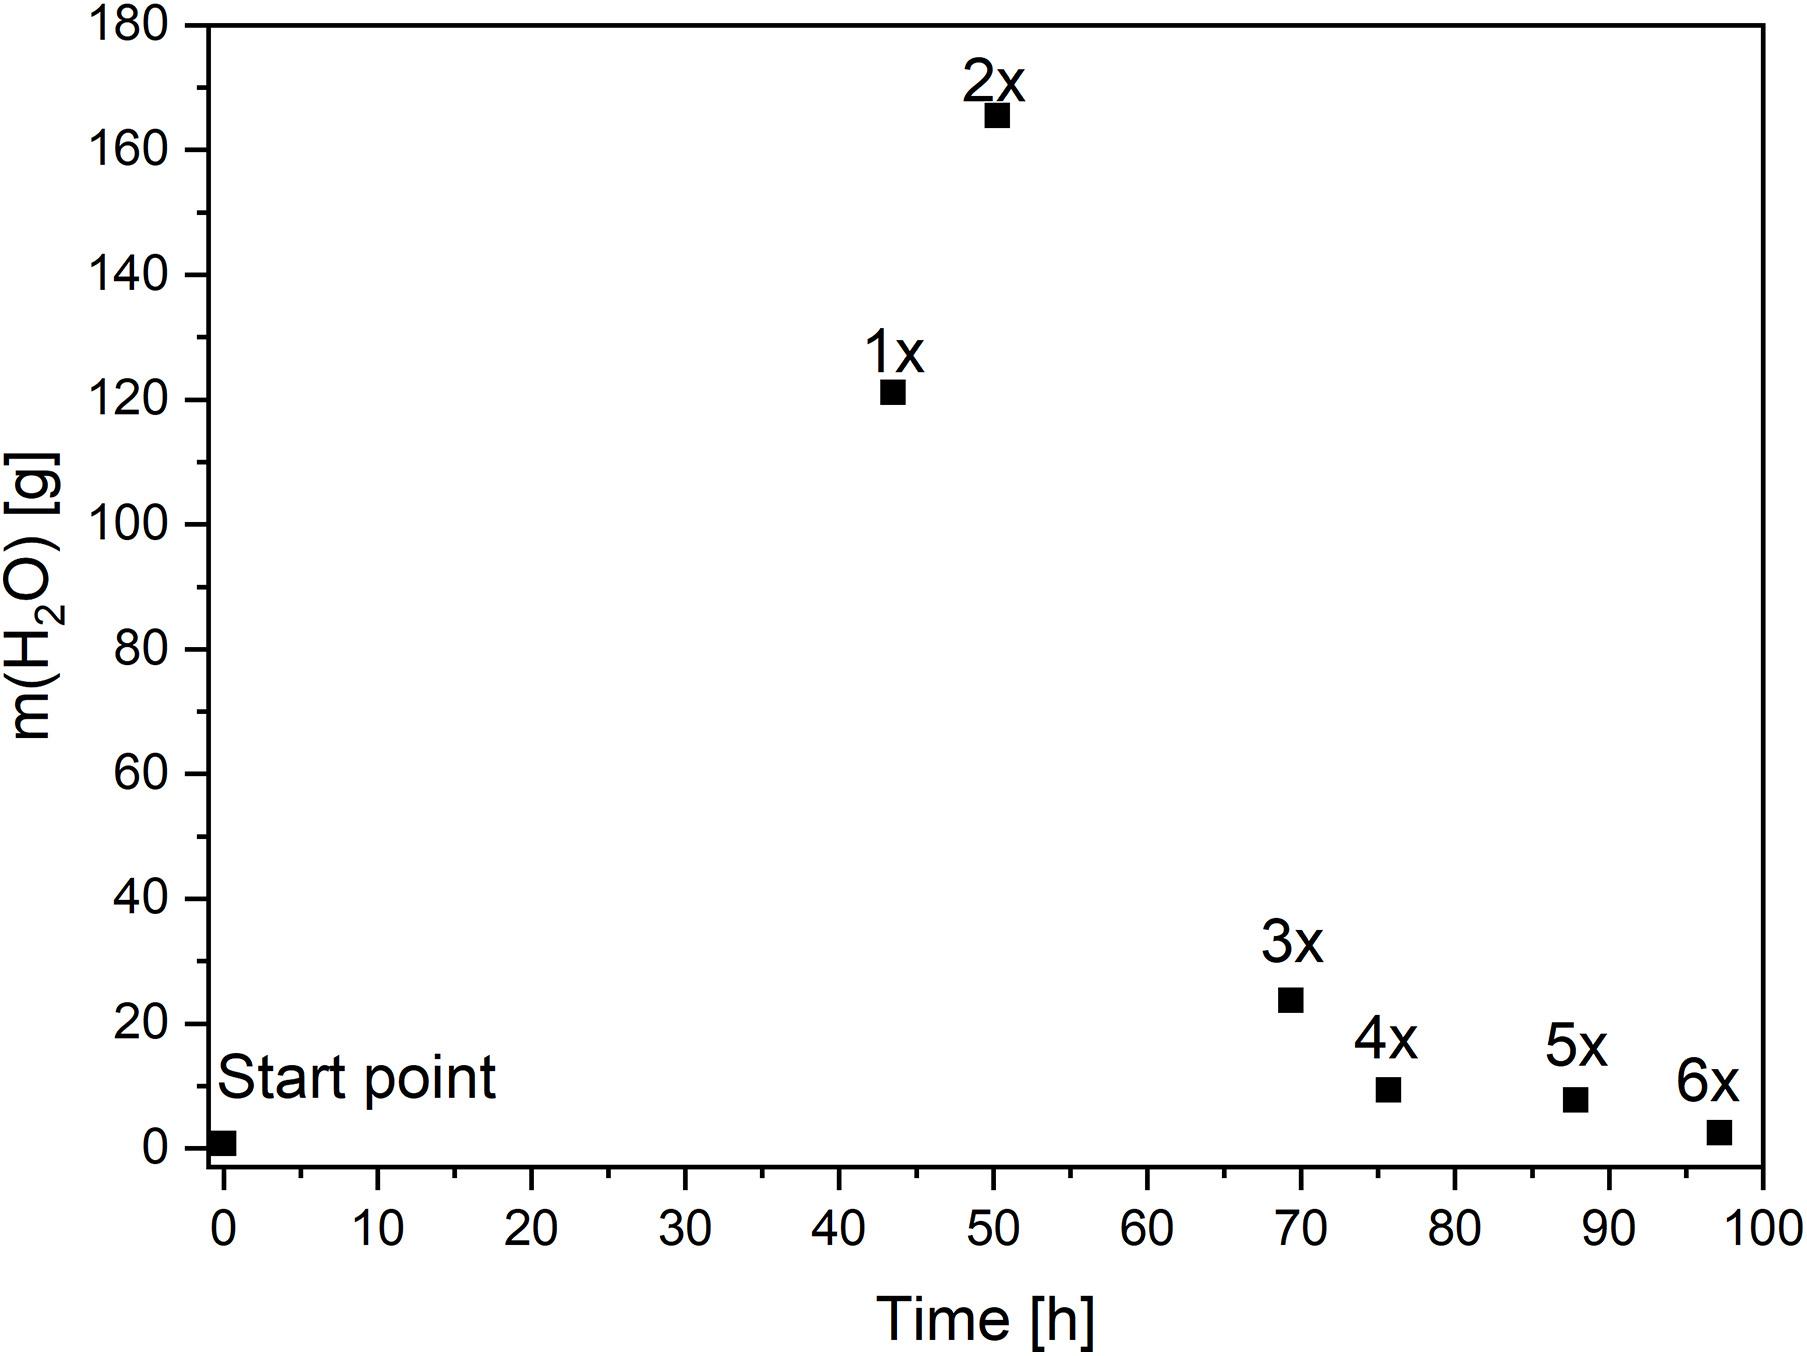
Figure 5. Changes of water concentration over time during static solvent exchange. More than 95 h and 6 washing steps are needed to achieve acceptable for drying water amount.
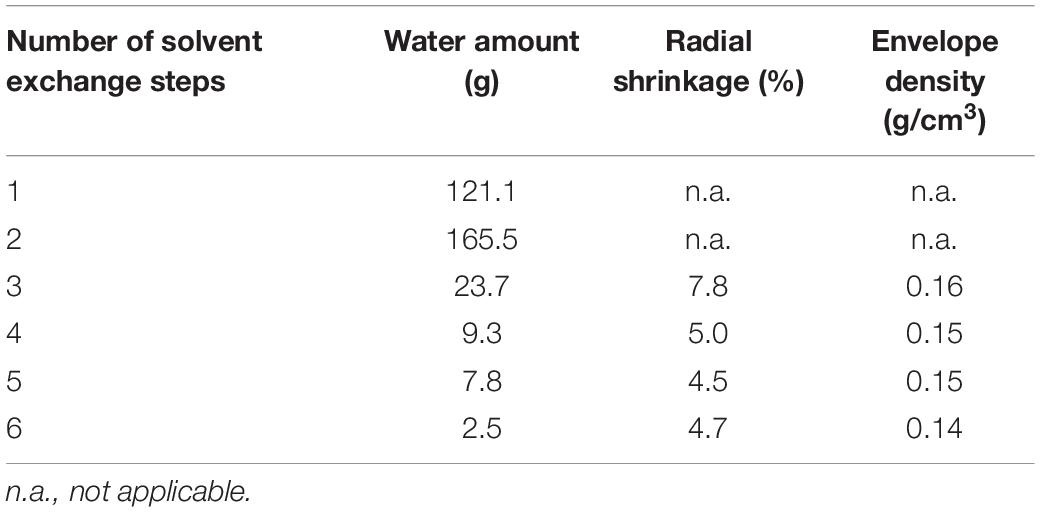
Table 2. Properties of static washed samples and corresponding water amounts.
The most used static solvent exchange method was very slow. Figure 5 demonstrates the change of water amount over the time. The first washing step was carried out after 41 h. The increase of water concentration was high, due to fast diffusion caused by high concentration gradients. In spite of the less time between the first and the second washing (only 10 h), the water mass in acetone was even higher, which indicated that the diffusion is much faster. After nearly 50 h and two acetone exchanges, the water concentration reached its maximum. Then, the diffusion was slower, since the concentration of water in pores decreased. Almost a further 46 h were needed to replace water in the pores by acetone and in order to reach an acceptable water concentration for drying.
Slow diffusion observed after 70 h could be accelerated by increase of the solvent temperature or increase of washing steps in short time intervals. Higher temperatures would increase the energy costs and more washing steps would lead to higher solvent consumption and generation of additional wastes. Thus, an optimization of solvent exchange was needed.
The measurements of water content allowed to determine a critical water concentration, which allowed drying of shrinkage-less or shrinkage-free aerogels. The measurements showed, that the target values of water concentration were 1–3 wt.-%.
The dynamic solvent exchange fastened the diffusion process and optimized this important step in the preparation of aerogels. For dynamic solvent exchange, a self-made setup was used. The samples were placed in a tight lockable container, which was connected by acetone resistant tubes to with a peristaltic pump (Figure 6). The container was filled with acetone, so that the samples were completely covered. The solvent was circulated using the pump. For solvent exchange with zeolites, a perforated box (sieve basket) filled with zeolites was placed at the bottom of the container. The sieve basket used for the zeolites allowed easy exchange of the zeolites and prevented the contact between samples and zeolites. The setup was placed in a separate steel collection tray to collect solvent in case of damage of tubes or connection places.
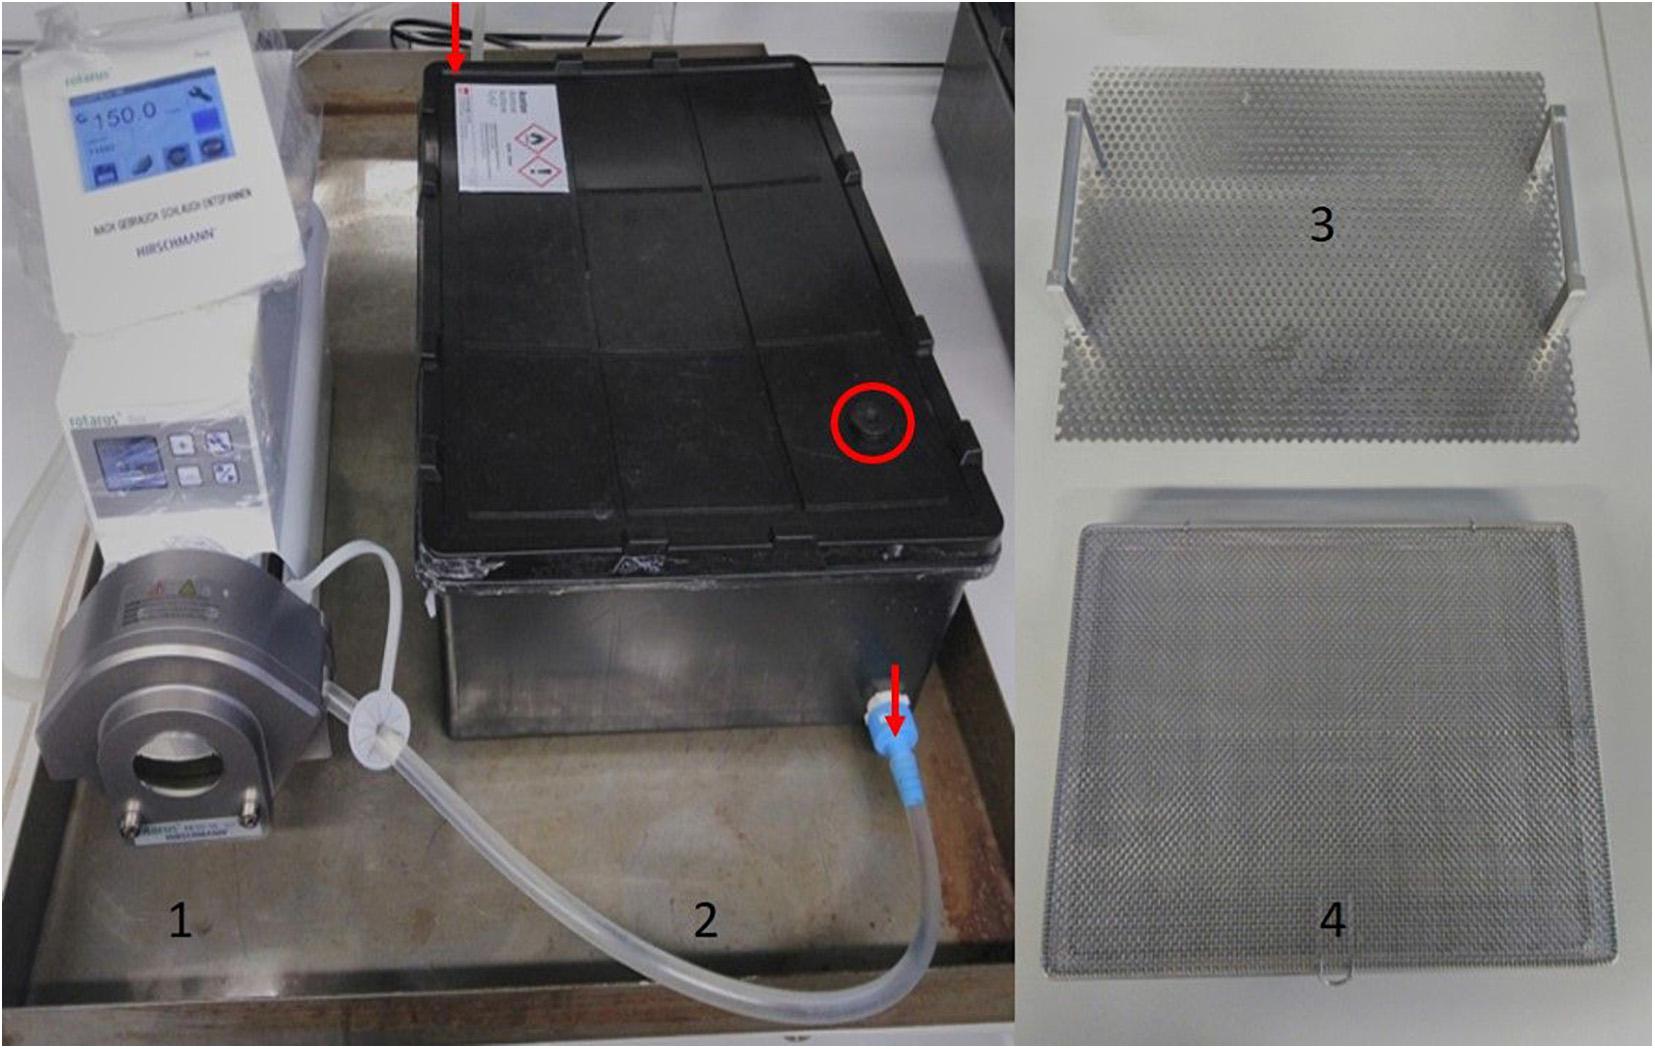
Figure 6. Setup for dynamic solvent exchange with zeolites: (1) tube pump with adjustable speed; (2) container for samples, solvent, zeolites with a lockable window (marked with red circle) as a sampling point; (3) steel plate for sample placing ant transport; (4) lockable perforated box for zeolites. During solvent exchange the perforated box (4) filled with zeolite is placed on the bottom of container (2), on the top of the box is placed the plate (3) with wet gels. The direction of circulation of solvent is marked with red arrows.
Figure 6 gives an overview on experiments. In the first experiment series, two techniques were compared: static (without pump) and dynamic (with pump). The acetone volume and number of samples were the same for both experiments. In the second series, the effect of pump velocity on water concentration was investigated. The wet gels were placed in an acetone bath and the solvent was pumped with different speeds ranging from 50 to 350 rpm. The zeolite volume was changed in the third series. There, wet gels were placed in an acetone bath with different volumes of zeolites. Finally, static solvent exchange and dynamic with zeolite were compared.
The circulation of solvent shall accelerate the diffusion of fluids. The changes of water content over time were investigated for samples placed in acetone baths with and without pump. The water content of the solvents was monitored to gain information about the progress of the solvent exchange and for the optimization of the important process parameters.
The water amount in standing acetone bath increased with the time, although the water content did not raise continuously (Figure 7). After 7–11h, a sudden drop could be seen, beyond which, for 3 h, the concentration remained constant. The discontinuity could be explained by non-homogeneous fluid: in the standing acetone, the water concentration was higher close to the wet gel and decreased proportionally with the distance. Thus, depending on the sampling point (close to the sample or to the walls of the container), the data could be very different. The values with the pump raised continuously, howbeit small discontinuity could be observed. The water mass after 24 h with the pump was nearly 24% higher than that without the pump indicating an acceleration of diffusion.
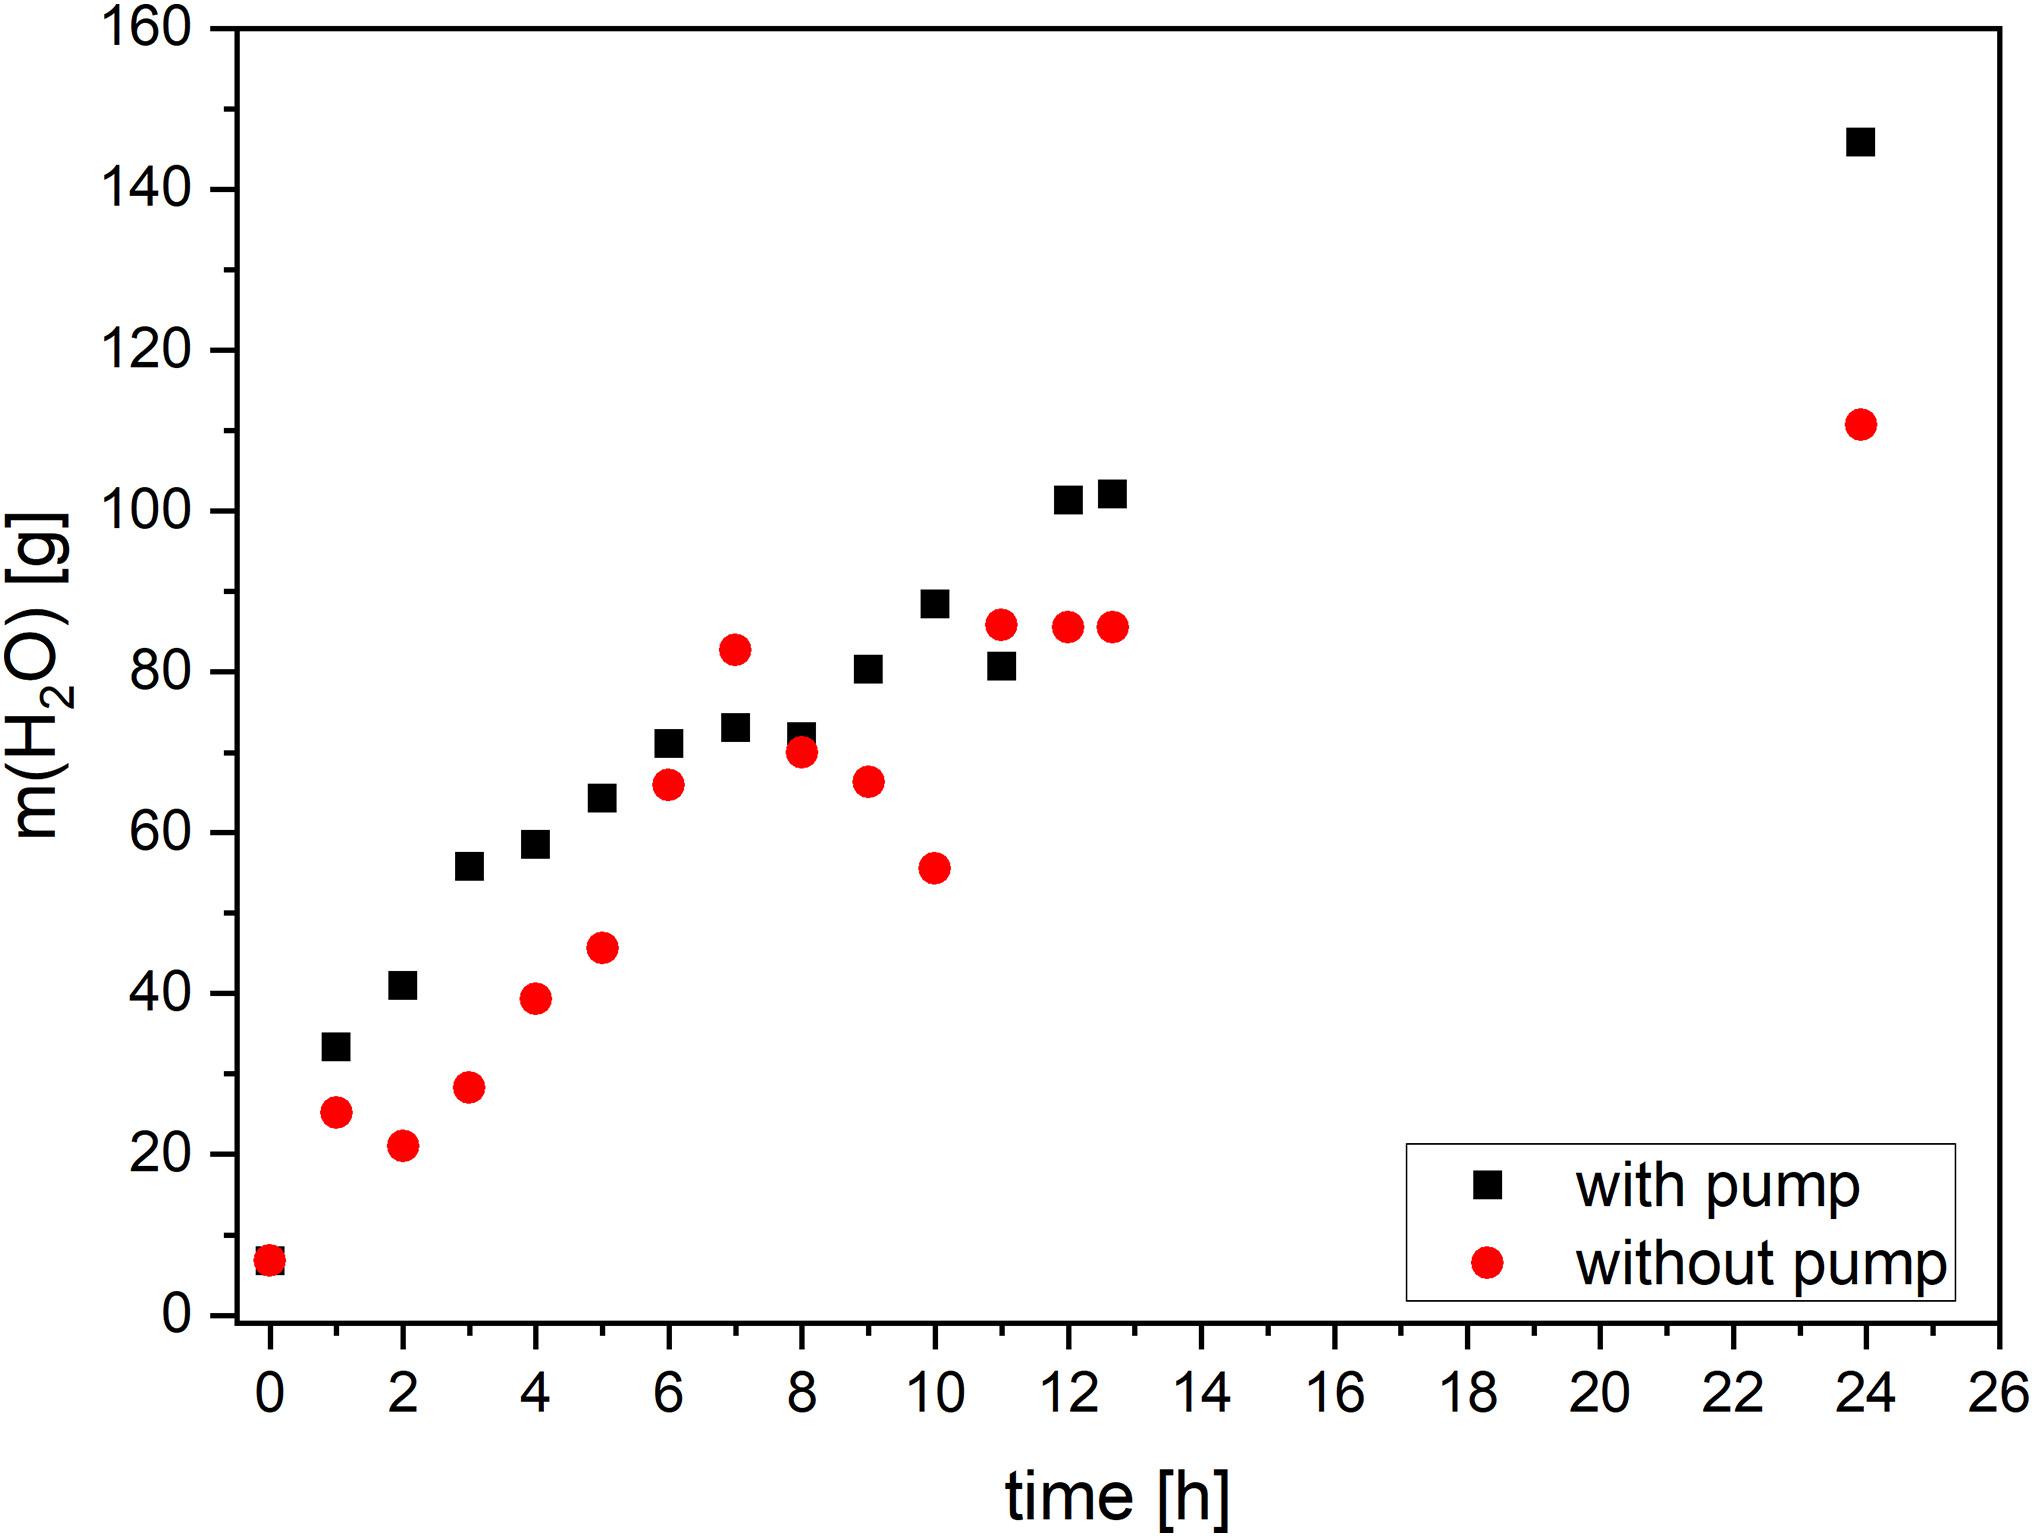
Figure 7. The effect of pumping on water content in acetone as a function of the process time within a system with and without pump.
The experiments clearly showed the benefits of the pump. The forced diffusion significantly decreased the duration of solvent exchange. Interestingly, the sample washed with pump showed higher shrinkage of about 10.2%, compared to the sample washed statically (8.5%). While pumping the water, concentration in pores and outside of pores was identical. The water-acetone mixture was homogeneous. Thus, the solvent consisted of about 140 g of water in gel bodies as well as in the solvent bath. In contrast, during static washing, concentration gradients were formed. The measured water content of about 110 g was local (only outside of pores). The concentration inside of pores may differ and was probably lower, than that outside. Thus, higher water amount by pumping caused higher shrinkage.
Next, the influence of the pump speed on the extraction process was examined with 50, 150, and 350 rpm.
Figure 8 shows that the higher the pump speed, the faster the water mass increased in the drying solvent and the higher the water content was at the end of the process. At velocity 50 rpm the water content was nearly constant through the entire duration of the process. The shrinkage of the dried gels being a characteristic material property was monitored. It was also seen to rise with higher pump speed; the lower the pump speed, the lower the shrinkage. However, the high pump speed of 350 rpm led to high abrasion of the tubing. Therefore, a speed of 150 rpm was chosen as a compromise between a high exchange speed and good material properties.
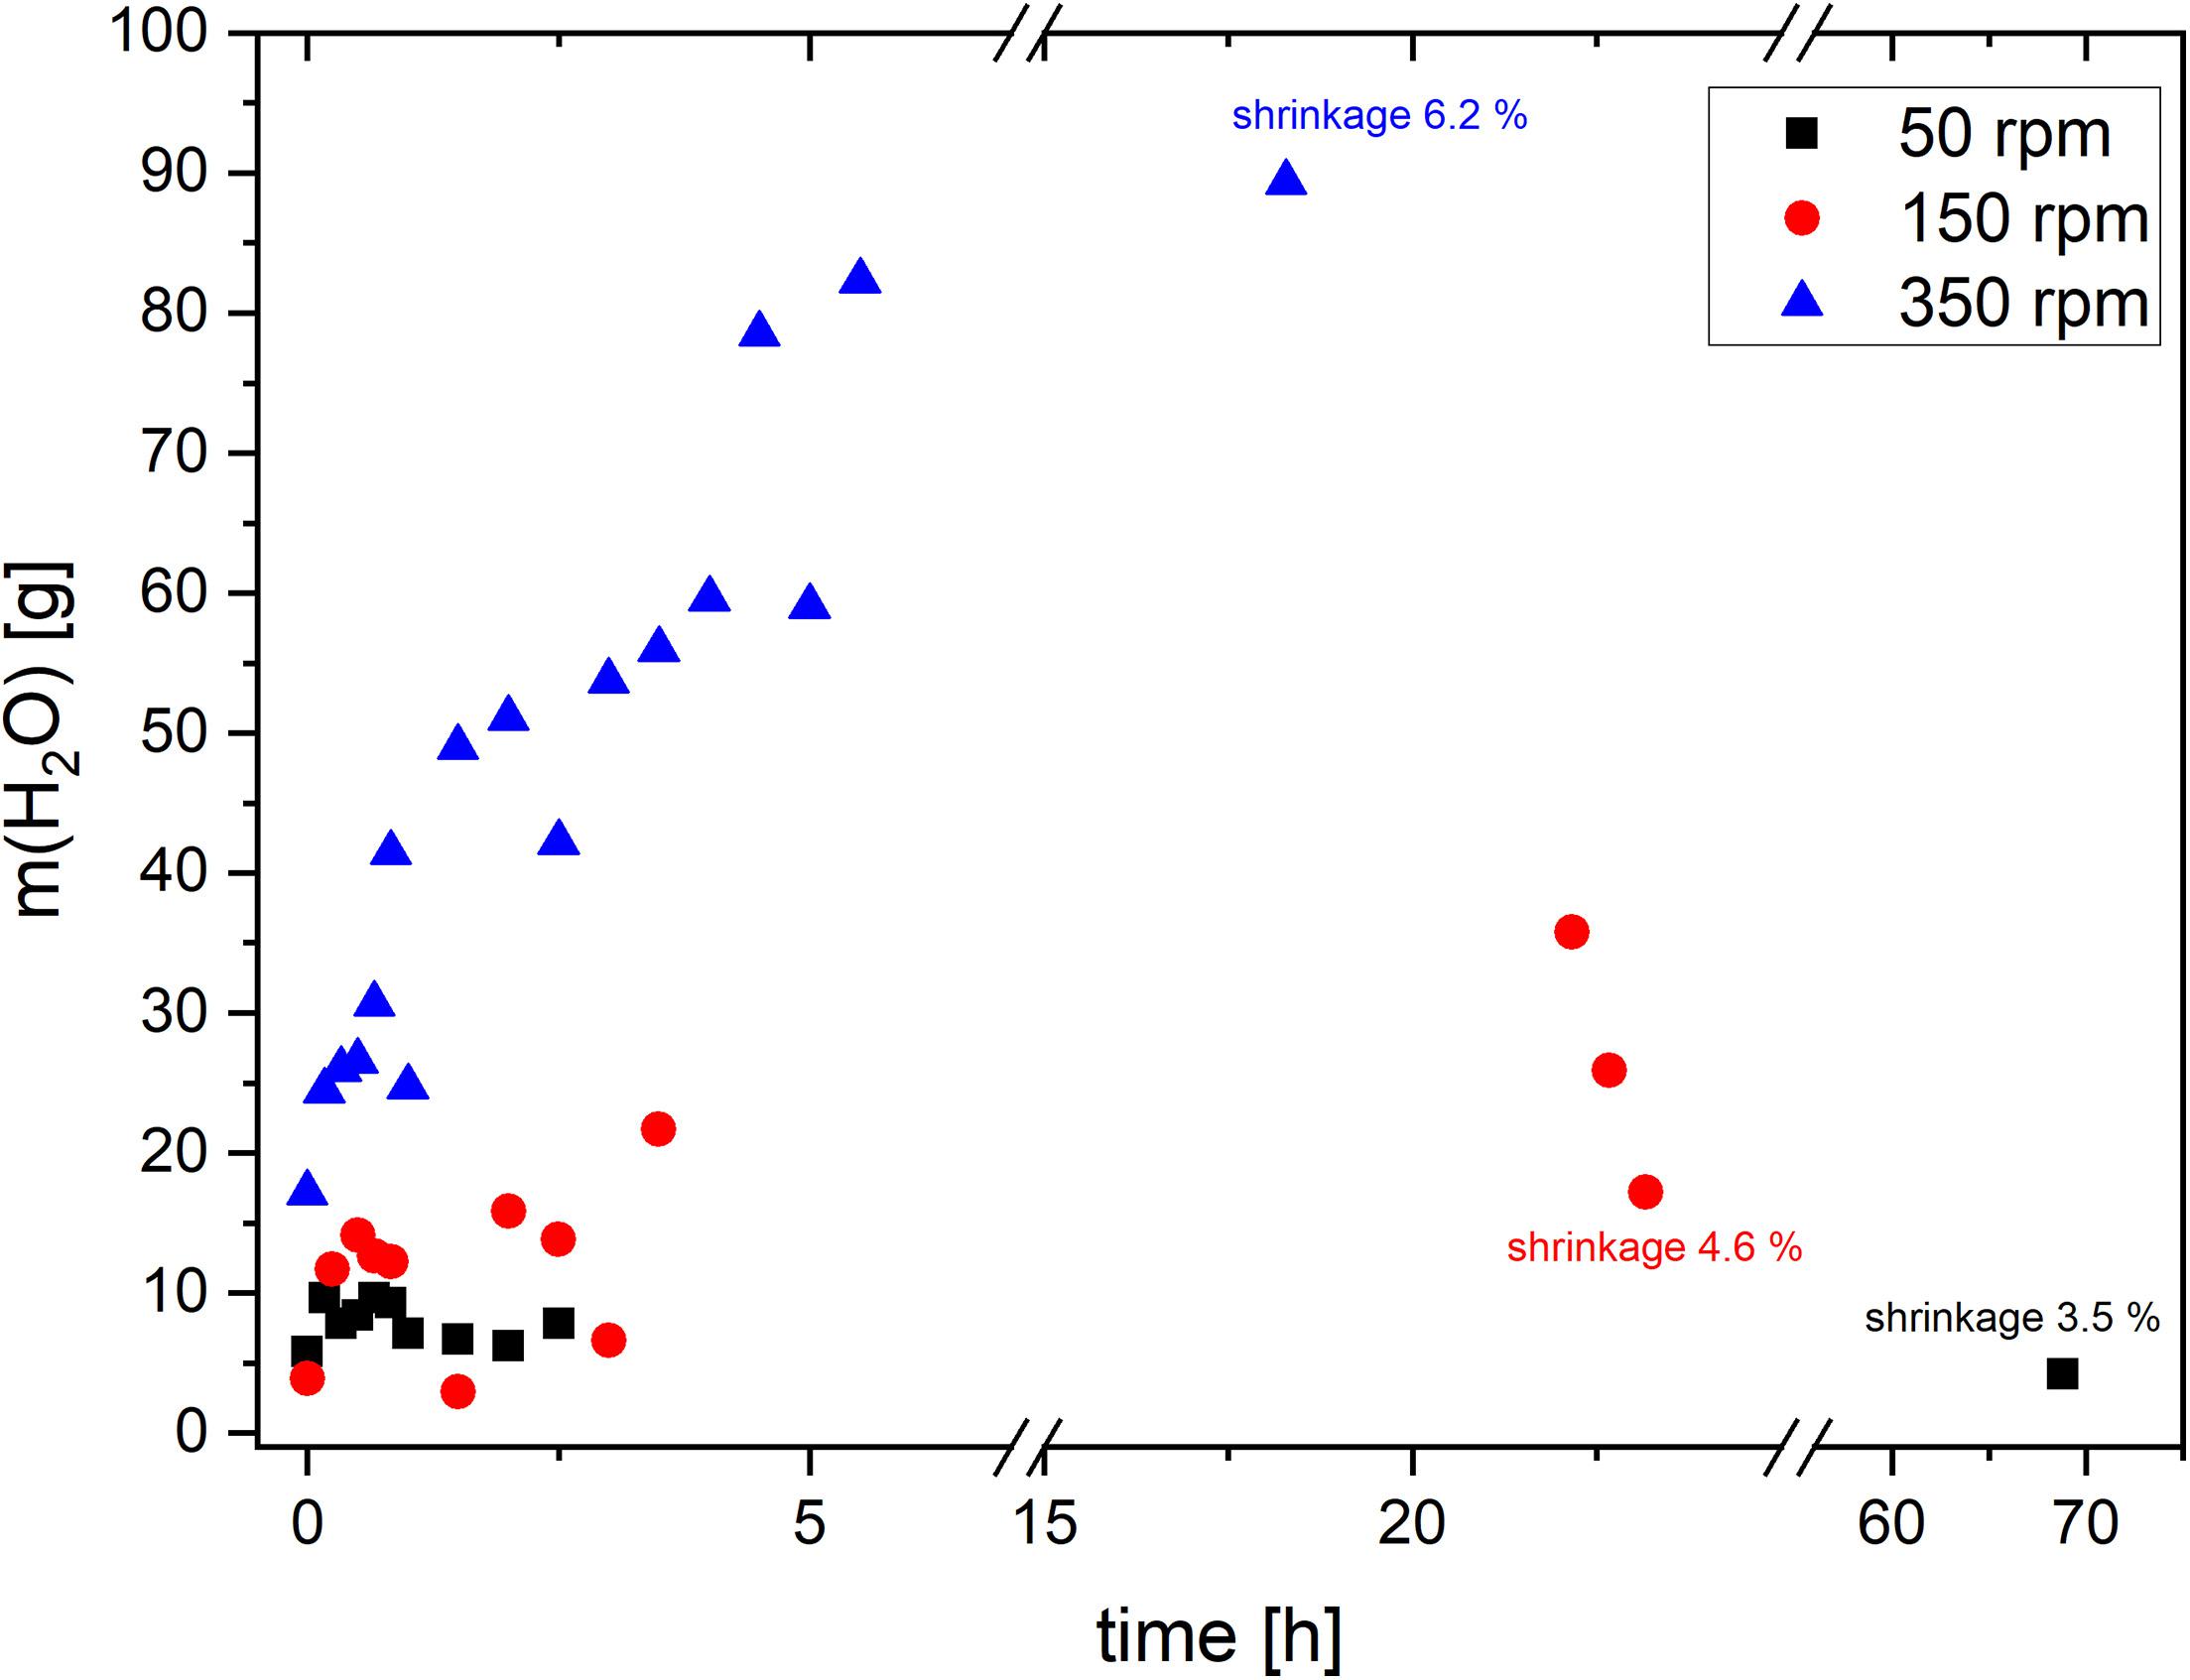
Figure 8. Water content/mass in the acetone as a function of the process time at 3 different pump speeds.
The concentration gradient is one of the driving forces of diffusion. The diffusion process in wet gels becomes slow when the concentration of water in acetone, in the pores and in the surrounded medium, is approximately identical. An acceleration of diffusion can be achieved by continuous extract of water from solvent. The zeolites are well-known adsorbers for different fluids. On their large surface area, water can be adsorbed. The adsorption capacity of the zeolites used in this study, was given by the manufacturer to be ≥ 20% at a relative humidity of 60% (FischerScientific, 2021). Prior to the use of zeolite, the maximum amount of possible adsorbed water was calculated. A completely filled perforated basket contained 2.20 L of zeolite.
In this study, only cylindrical samples with a radius r of 25 mm and a height h of 20 mm were used. Using the following equation, a sample volume Vsample of 39.3 mL was calculated:
By multiplying the sample volume with porosity Φ of the dried gel bodies, one can estimate the pore volume Vpore of the wet gel bodies. Therefore, a porosity of 91% was investigated in previous studies (Zoghi, 2017):
Within this study, it was assumed, that at the beginning, the complete pore volume was filled with water. By multiplying the pore volume with the density of water (ρ = 997 kg/m3 at T = 25°C), the mass of water mpore water within the sample was obtained:
(or for 3 samples: 107.3 g; 9 samples 321.9 g). A completely filled basket (2.2 L) allowed the adsorption of at least 337 g of water, which was equivalent to 9 samples.
The influence of zeolite amount was investigated with 0.73, 1.47, and 2.2 L of zeolite. Figure 9 (left) shows the higher the amount of zeolites, the lower the water content in the acetone. The resulting shrinkage of the samples increased slightly with higher water content. With 1.47 and 2.2 L of zeolite, nearly 10 g of water was measured after 70 h of solvent exchange. As expected, high amount of water was adsorbed on the surface of the zeolite. Remarkably, the concentration of water in the experiment with the lowest zeolite volume (0.73 L) increased continuously. The adsorption capacity of small volume of zeolites was probably exhausted in the first hours. In comparison, with 1.47 L, the mass of water increased at the beginning and started to decrease after 1.5 h. Similarly, the experiment with 2.20 L of zeolite showed higher water amount at the beginning and became nearly constant over time.
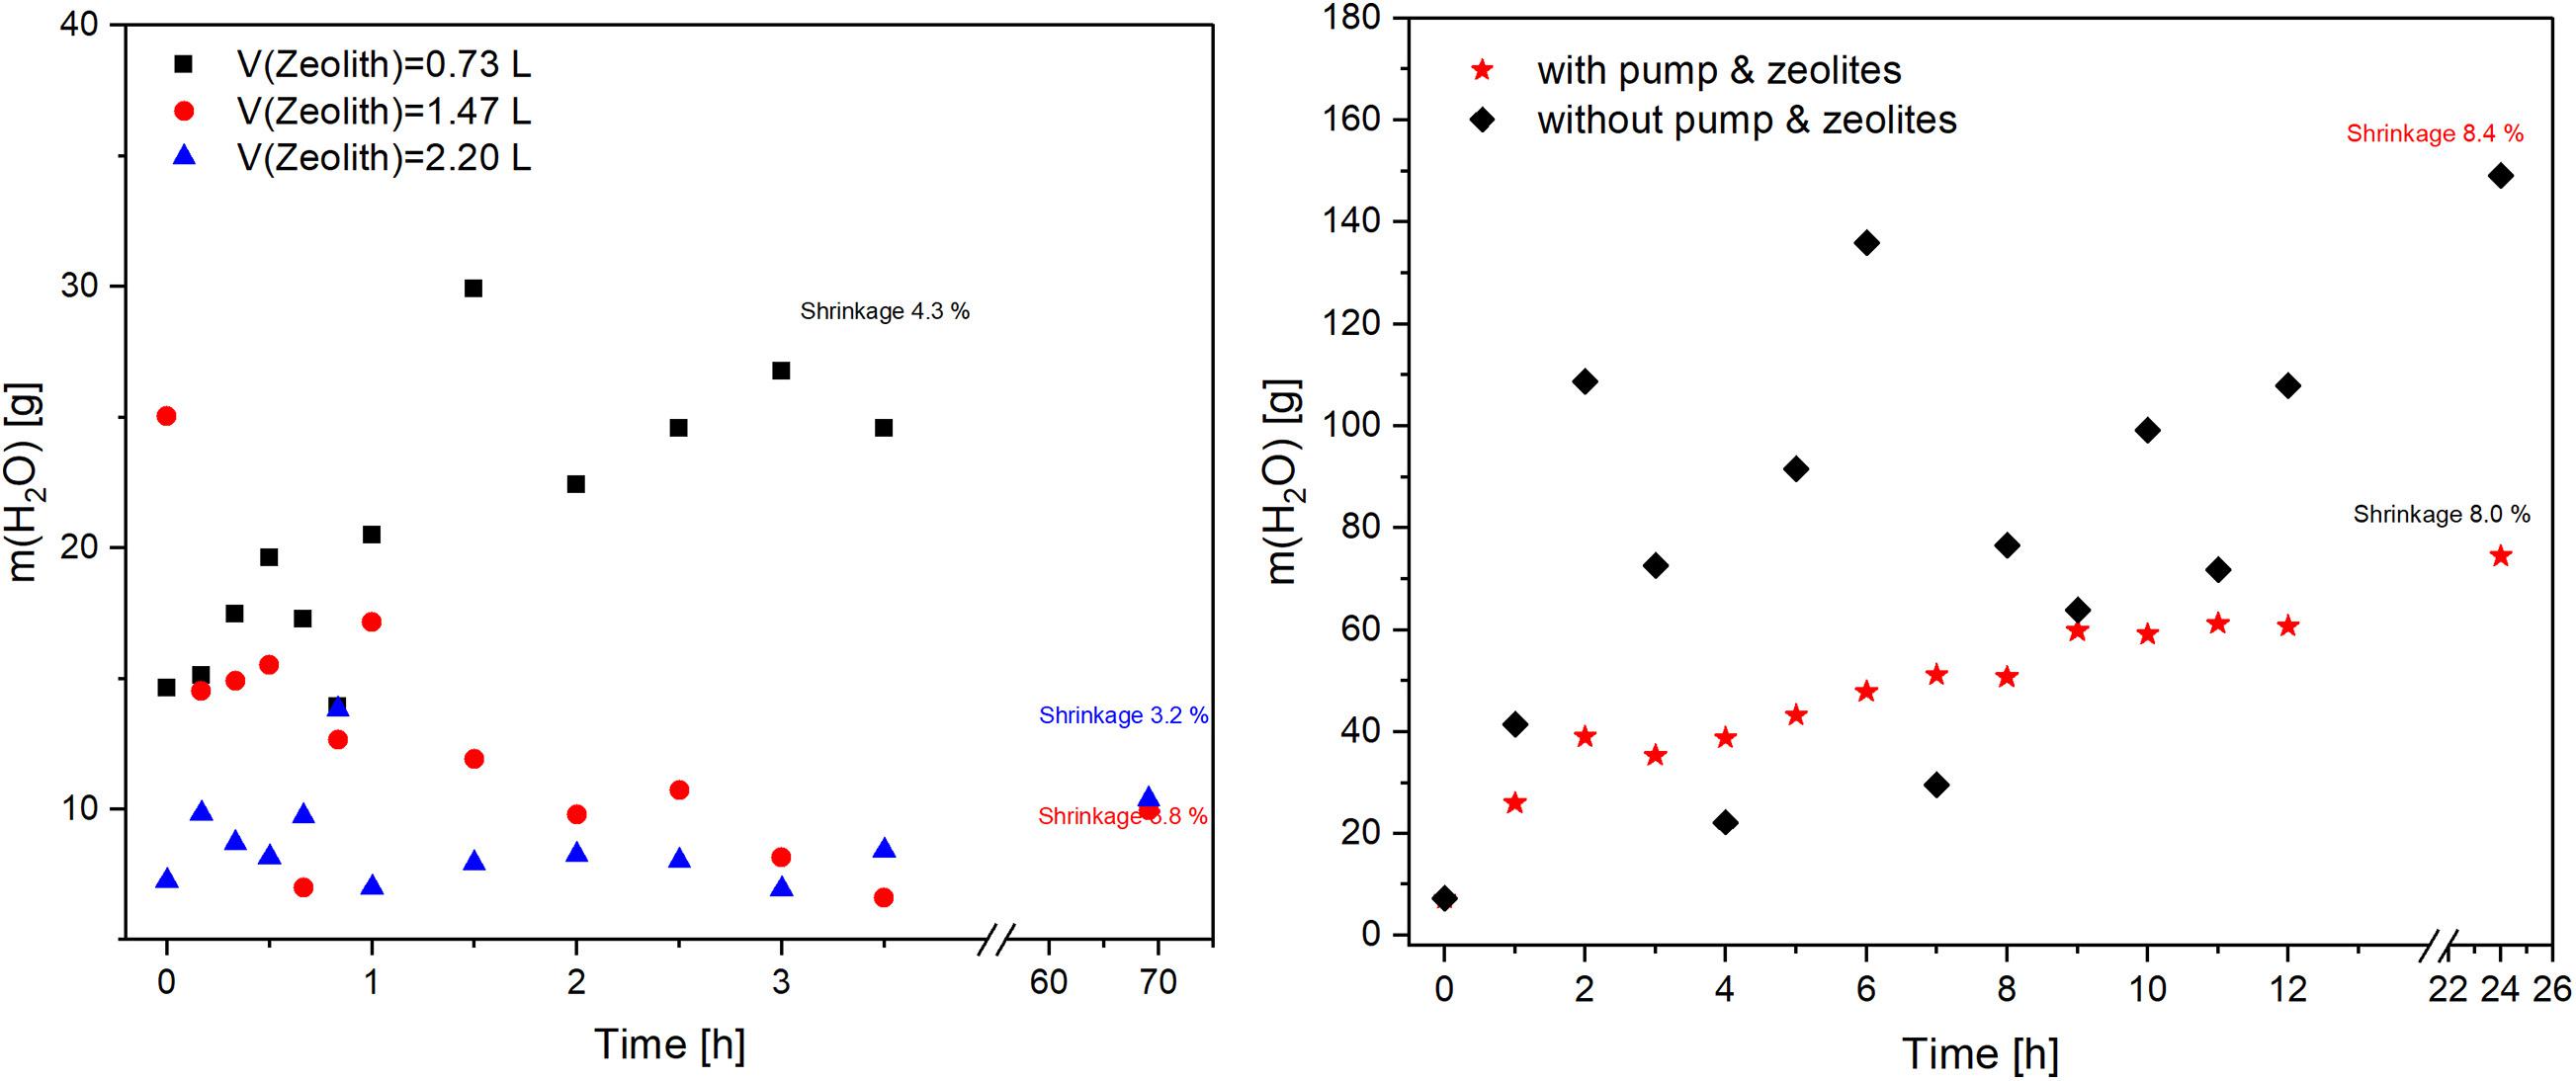
Figure 9. (left) Water content in the solvent acetone as a function of the process time at 3 different volumes of zeolites; (right) Water content in the solvent acetone as a function of the process time and used setups.
The results demonstrate that the adsorption of water in the first hour was slower than the diffusion. This corresponded with the work of Karge and Nießen (1991) on the investigations of diffusion and counter-diffusion in zeolites. The diffusivities in the case of counter-diffusion were found to be decreased by 50–60% compared to the single-component diffusivities in benzene and ethylbenzene systems. The amount of water decreased over time once enough zeolite was made available. The final values were significantly lower than in the previous series (Figure 8) and the values for the standing systems (Figure 7). This was due to the adsorption of water by the zeolites. Their influence in combination with the pump can be clearly observed. The value was nevertheless higher than initially assumed, since the amount of zeolite used was sufficient to adsorb the amount of water from 9 samples. Apparently, the adsorptive capacity in reality was lower than that indicated on the data sheet. Several reasons could explain this behavior. The most likely errors can be caused by the regeneration process or in the subsequent storage. If the adsorbed water was not completely removed or if the air humidity was adsorbed during storage, the resulting adsorption capacity of the zeolites would be correspondingly lower.
Furthermore, it was believed that the adsorption of water molecules by the zeolites was faster compared to the other processes. The replacement of the pore fluid within the gels, however, slowed down due to kinetic inhibition through the pore structure, the tortuosity and thus represented the rate-determining step of the system.
In the last experiment, the system with pump and zeolite was compared with a static setup. 9 samples were used, to increase the efficiency, and zeolites were added to the system with pump. The results are presented in Figure 9 (right). The water content was significantly higher than in the previous experiment due to the higher sample amount. The measured values of both systems differ strongly. The values for the water concentration of static setup fluctuated strongly, which was caused by concentration gradients in the solvent. These were particularly pronounced in the resting system due to insufficient mixing. In comparison, the values of dynamic system increased linearly over the time. The amount of water in dynamic system with zeolites was significantly lower due to the adsorption of water from the acetone. The exchange velocity remained constant after about 16 h.
Summing up, the solvent exchange time could be reduced from 3 to 1 day. Both, the usage of the pump and zeolites led to optimized and accelerated washing. Moreover, the use of zeolites not only accelerated the diffusion, but also reduced the exhausted solvent. The experiments on static solvent exchange showed that 6 washing steps were needed to wash out around 350 g of water. There, around 2.4 L of acetone was consumed. The theoretical capacity of zeolites (in this study) allowed to adsorb around 337 g. Thus, numerous washing steps were avoided. Furthermore, the dynamic washing was fully automatic, the requirement of man hours and corresponding costs could be eliminated as well.
During operating the solvent exchange system to exchange the water in pores of the gel body with acetone using zeolites, various diffusion processes take place in parallel. On the one hand, the water diffuses out of the pores of the gel body due to the concentration gradient and mixes with the surrounding acetone. At the same time, acetone also diffuses into the pores of the gels. On the other hand, the zeolites adsorb water molecules which are dissolved in the acetone. To simplify the calculations, the replacement of the pore fluid of the gel body was considered separately from the adsorption processes of water molecules on the zeolite particles. The content of the pore liquid during the drying process significantly determines the properties of the resulting aerogel.
The experimental setup was best described by a cylindrical surface through which an acetone/water mixture flowed. Figure 10 demonstrates the setup which was used in the calculations. The inflow of acetone into the cylinder was kept constant as marked by the blue arrows in the plot. The mixture of water and acetone can diffuse through the walls (lid/bottom and surface) of the container.
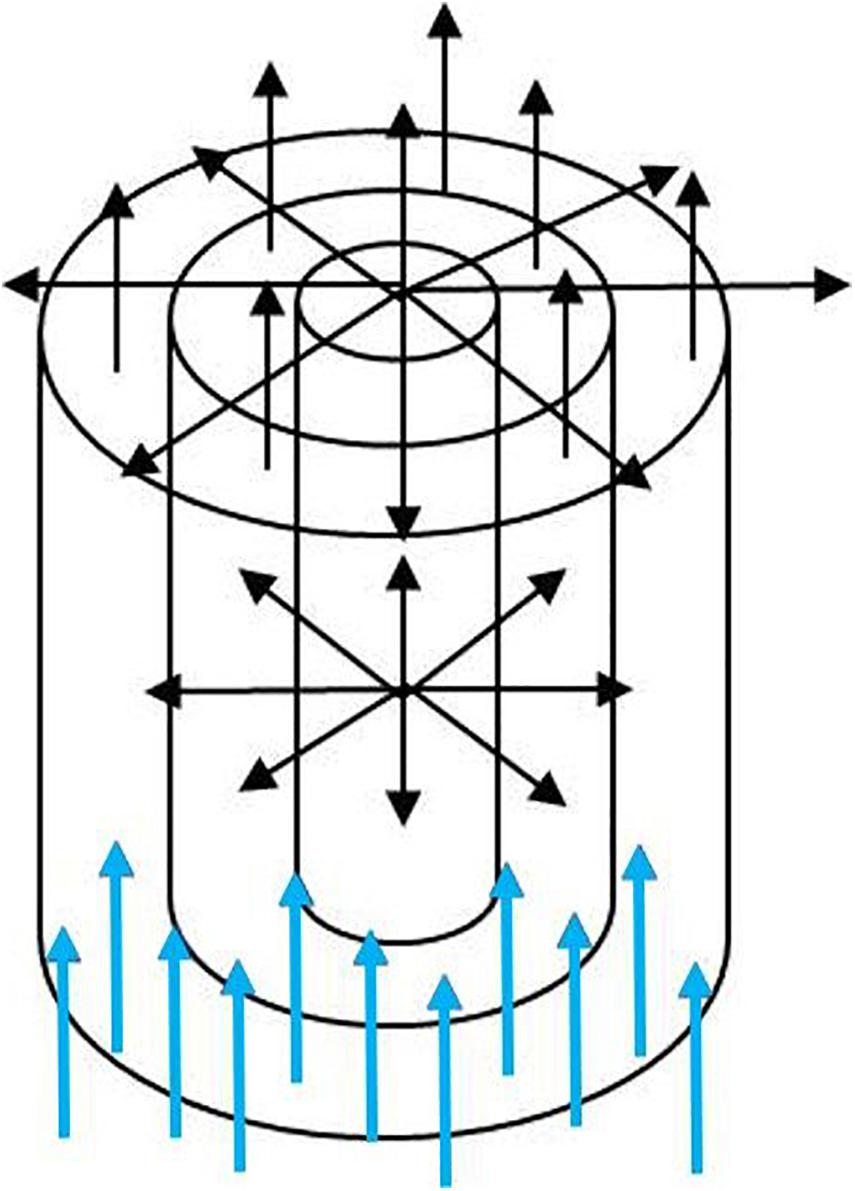
Figure 10. The constant inflow of acetone (blue arrows) into the cylinder established a diffusion of the mixture/fluid. The acetone/water mixtures can flow through surface and lid/bottom of the cylinder (shown are some radial layers which the fluid is passing through).
The appropriate diffusion equation is given by:
In this equation, u and D denote the amount/concentration of the fluid (Crank and Nicolson, 1947; Crank, 1975; Wawrzyniak et al., 2001), and the (effective) diffusion constant of the fluid, while rand t represent the radial position and time, respectively.
In order to numerically solve such a differential equation, application of appropriate boundary and initial conditions was necessary. As starting condition, an initially uniform concentration of water was assumed. Outside the cylinder, the concentration of the fluid was set to zero, i.e., the fluid instantaneously evaporates into the surrounding atmosphere. This caused a depletion of the fluid at the segments of the border zone of the vessel.
For a numerical solution of the differential equation, the finite difference method was used. To this end, the cylinder radius and the time were discretized. The amount of fluid flowing through a radial element (ri = i⋅Δr) per time unit (tj = jΔt) was calculated from central differences (Press et al., 1990; Deuhard and Hohmann, 2008) of the diffusion equation:
In this equation, ui,j+1which is the concentration of the fluid in radial element ri = iΔrat time step tj + 1 = (j + 1)Δtwas calculated. The concentration in this radial element depends on the amount of the previous time step tj = j⋅Δt, and on the diffusion from the neighboring radial elements (ri + 1 = (i + 1)⋅Δr and ri−1 = (i−1)⋅Δr). Introducing the constant , which depends on the integration time step Δt and on the radial discretization Δr, Eq. 2 can be expressed as:
The initial condition for each radial segment within the vessel was given by , where Utot denotes the total amount of the fluid and Δr and R represent the thickness of the segment and the radius of the cylinder, respectively. Thus, within the container, a constant/uniformly distributed density of the fluid was assumed at the beginning.
Since in the experimental setup, the flow of the acetone/water mixture also takes place through the cylinder bottom/lid, we take this into account by means of a corresponding diffusion equation. The respective diffusion equation is that of a plane sheet: which is solved via ui,j + 1 = ui,j + αb(ui + 1,j−2ui,j + ui−1,j). The constant refers to the dimensionless coefficient and includes the thickness of the cylinder bottom/lid.
The calculation was performed for a total amount of Utot = 38.5g, a diffusion constant D = 3.954⋅10−6mm2/s and cylinder dimensions R=25mm and L=10mm (radius and length, resp.). The concentration of the fluid was ρ = 0,874g/cm3. The integration/discretization steps were Δt = 180s, Δr = 0.25mm and Δx = 0.1mm, respectively. The total observation time was ttotal = 17820s = 4.95h.
In Figure 11, the time-dependence of the relative concentration/amount of fluid at the edge of the container is illustrated. One can clearly see a reduction of the fluid with increasing time. At the beginning of the simulation, the relative amount/concentration was 1.0 on the edge of the cylinder. With ongoing diffusion, the relative amount of the fluid within the vessel’s edge decreased to a value of less than 50%.
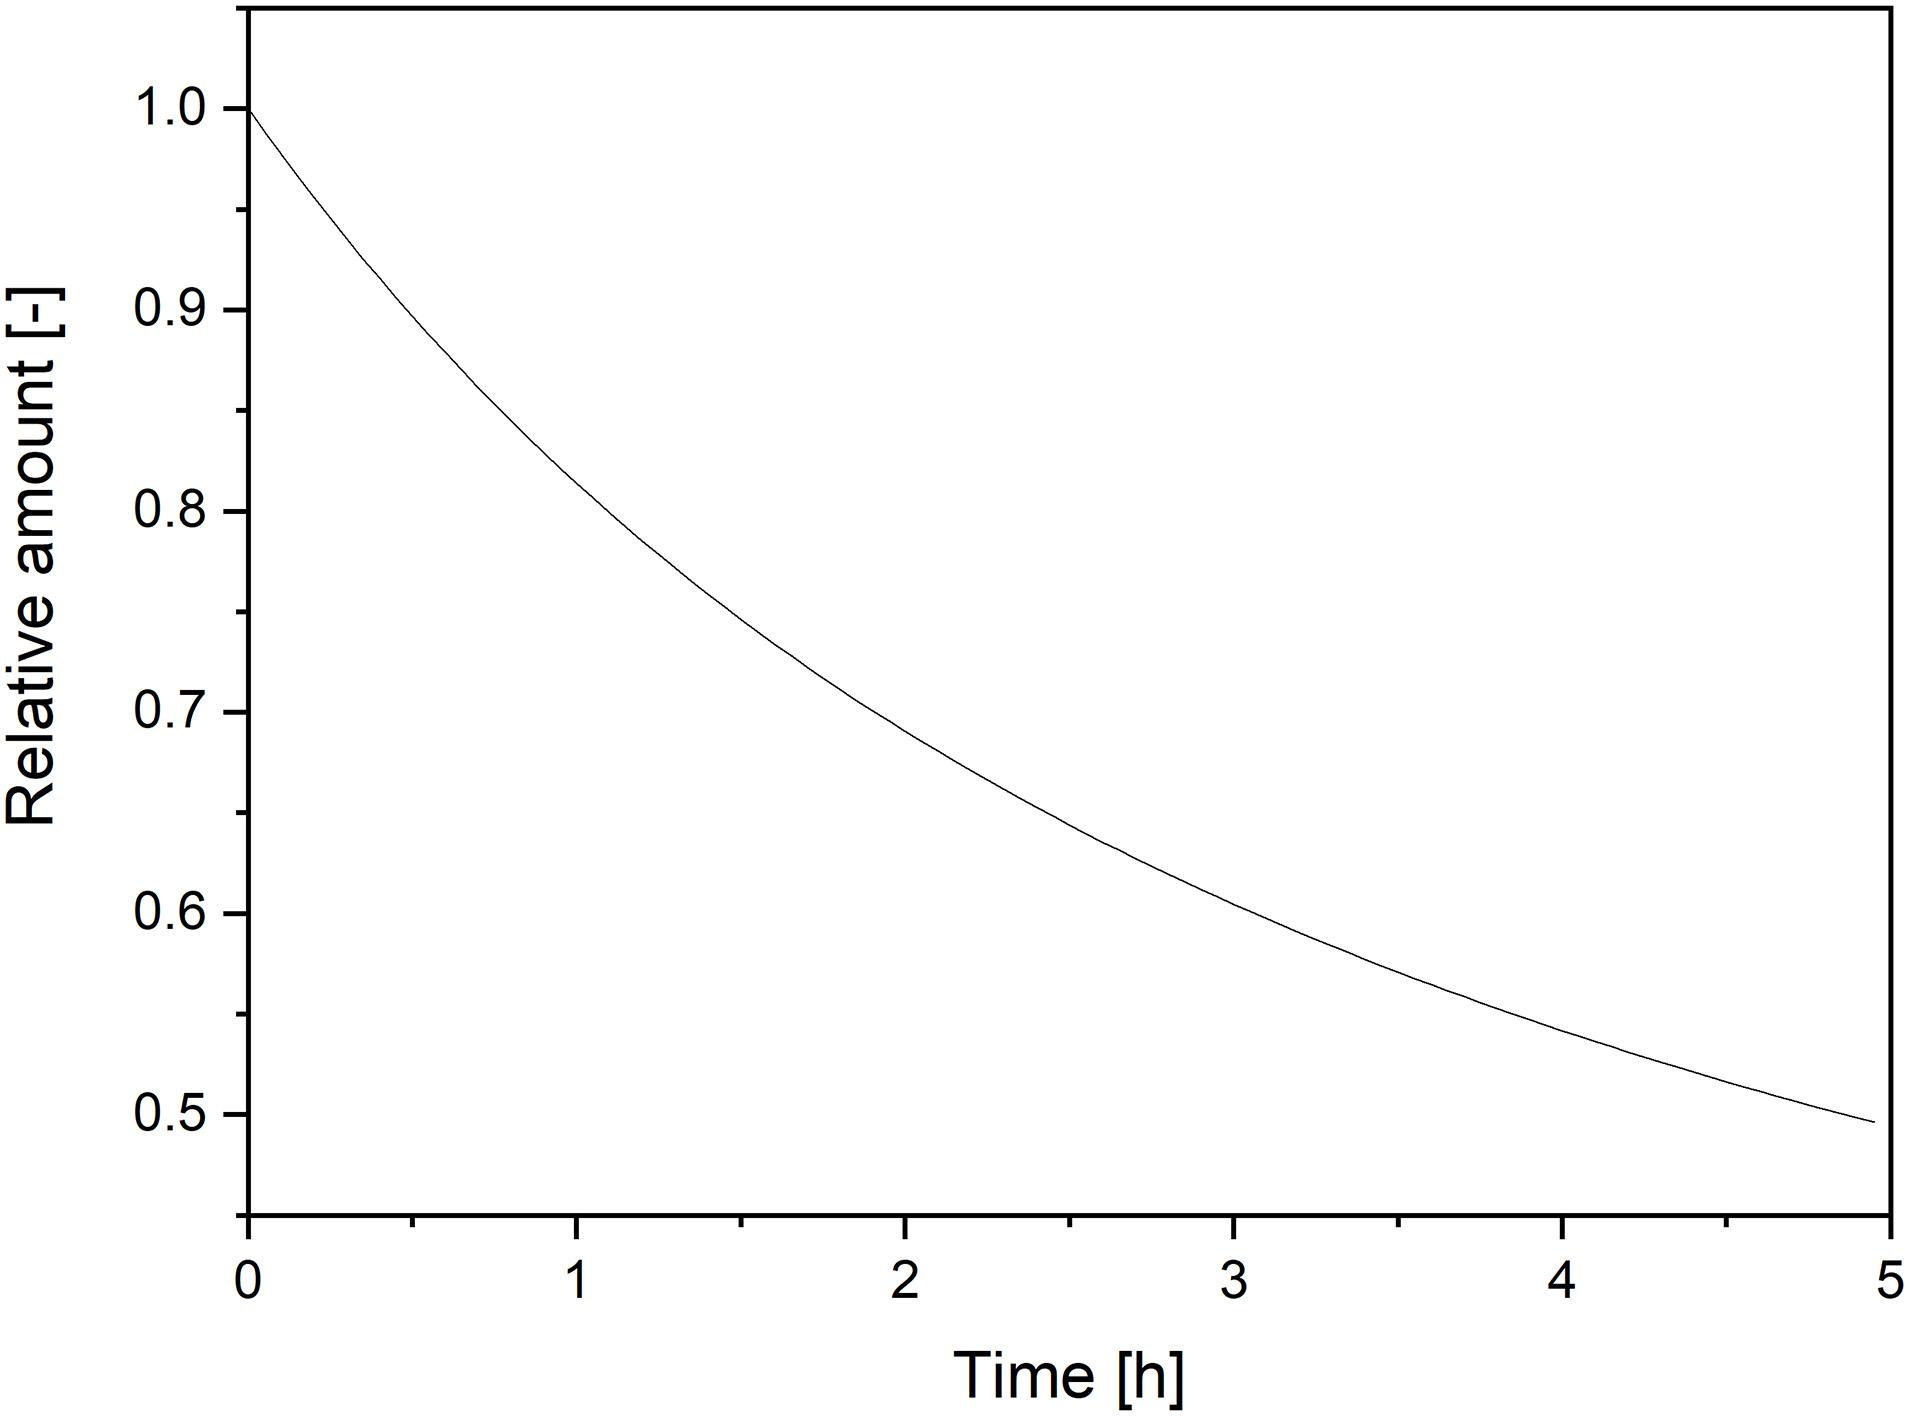
Figure 11. Relative amount of fluid at the boundary of the cylinder plotted vs. time.
In Figure 12, the concentration of water was plotted against time. A significant drop of the water concentration depending on the amount of inflowing acetone was observed after a total observation time of approximately 5 h. The higher the amount of inflowing acetone is the lower the concentration of water will be.
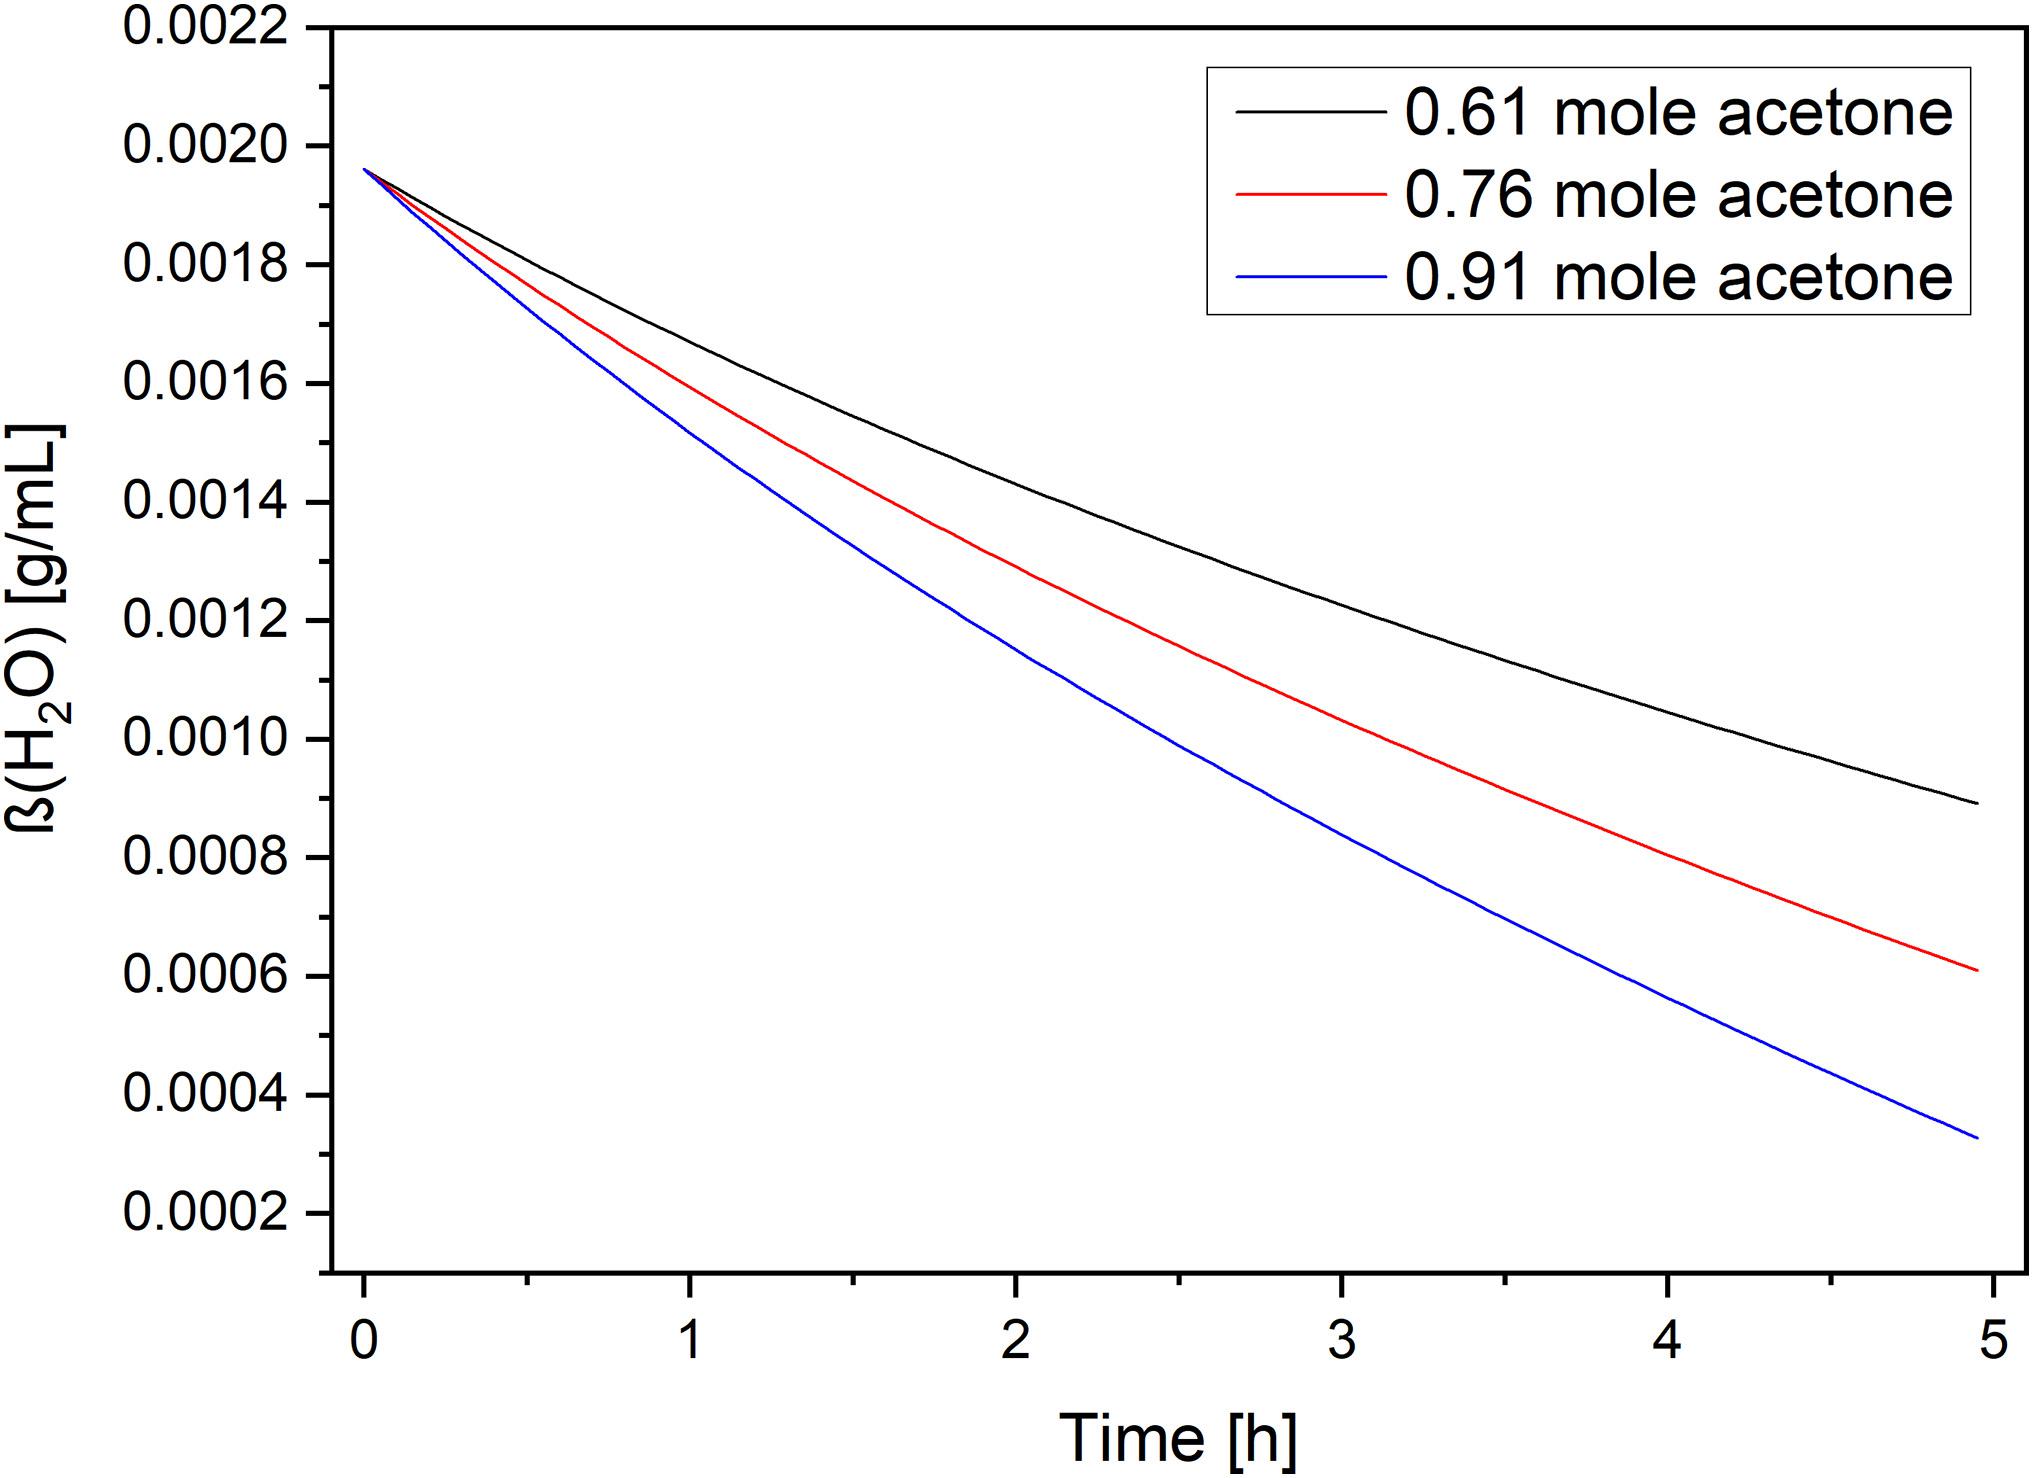
Figure 12. Concentration of water plotted vs. time in h.
The total outflow (mixture of acetone/water) is depicted in Figure 13. Here, the time dependence of the outflow for the three different amounts of inflowing acetone can be seen. The amount of fluid flowing out of the container increased with the observation time, and it also correlated with the flow of acetone. However, the increase softened with time.
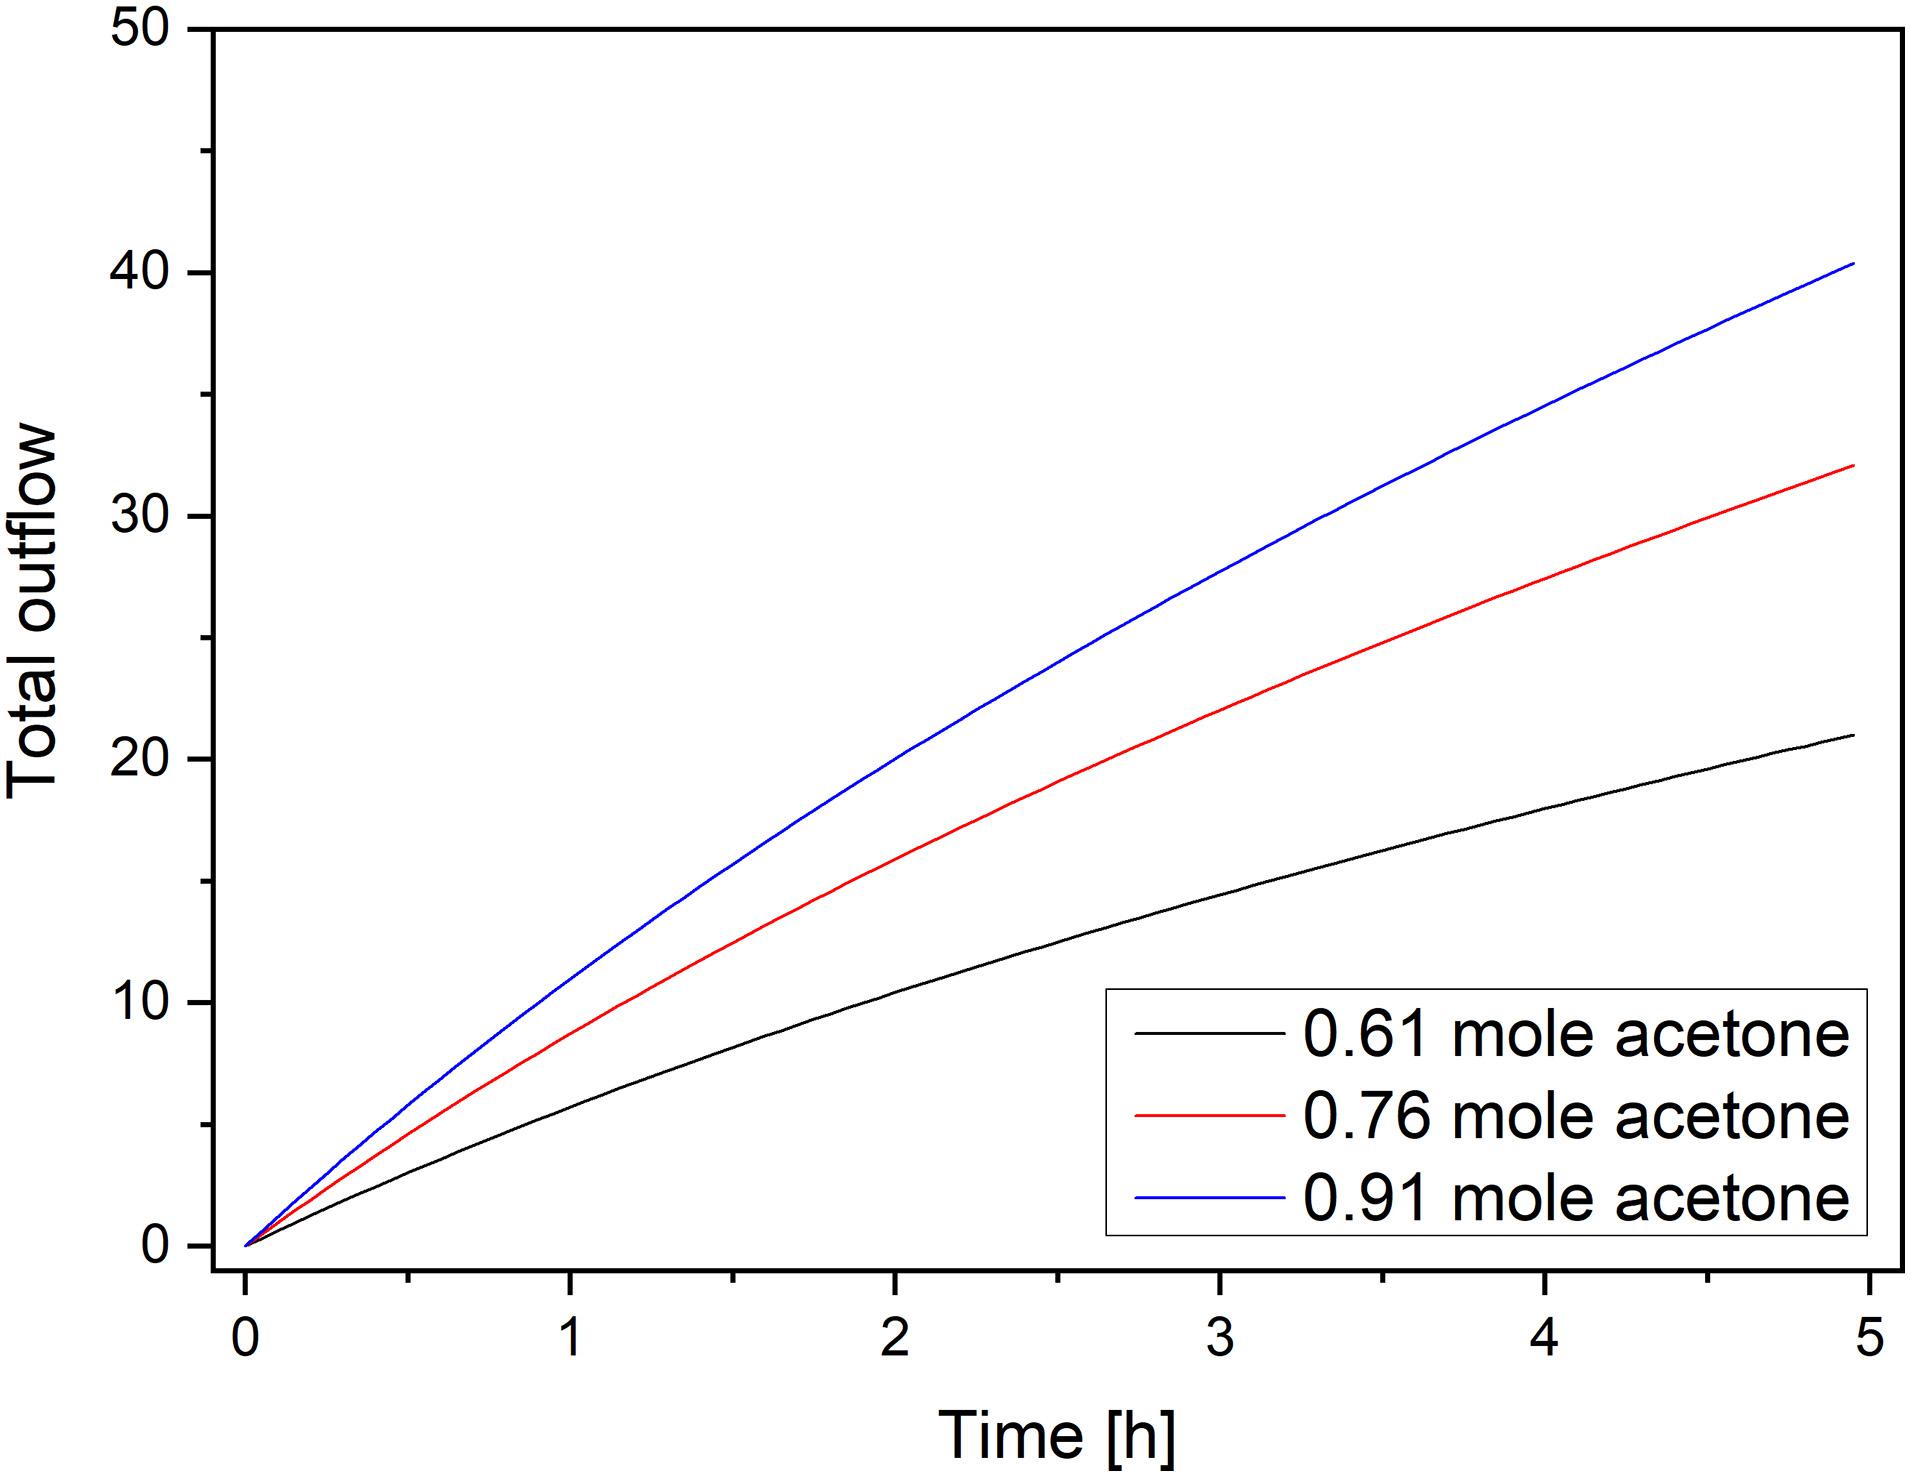
Figure 13. Total outflow (mixture of acetone/water) for three different amounts of acetone vs. time.
The solvent exchange is a very important step in the production of supercritical dried aerogels. This study shows that the Karl Fischer titration is an appropriate method in order to determine the water concentration in the solvent. Thus, the duration, the number of washing steps, and amount of used solvent can be shortened and optimized. The dynamic solvent exchange instead of static reduces the duration of solvent exchange significant. The influence of the pump speed on the extraction process was examined with 50, 150, and 350 rpm. It was shown, that the higher the pump speed, the faster the water mass increased in the drying solvent and the higher the water content was at the end of the process. While the usage of zeolite also leads to optimization, continuous adsorption of water from solvent assures high concentration gradients. Furthermore, the amount of solvent consumed during washing can also be reduced.
Moreover, the diffusion of porous medium was modeled in this work. It could be shown, that with ongoing diffusion, the relative amount of the fluid within the vessel’s edge decrease to a value of less than 50%. The total outflow was calculated for three different acetone concentrations.
The original contributions presented in the study are included in the article/supplementary material, further inquiries can be directed to the corresponding author/s.
MS, SN, BZ, and CO were done the conceptualization, methodology, modeling, writing, and original draft preparation. BM and CO were done the review and editing. All authors contributed to the article and approved the submitted version.
This work was funded by the DLR internal project “Next Generation Car.”
The authors declare that the research was conducted in the absence of any commercial or financial relationships that could be construed as a potential conflict of interest.
We thank Rebekka Probst for SEM images.
Alshrah, M., Tran, M.-P., Gong, P., Naguib, H. E., and Park, C. B. (2017). Development of high-porosity resorcinol formaldehyde aerogels with enhanced mechanical properties through improved particle necking under CO2 supercritical conditions. J. Colloid Interface Sci. 485, 65–74. doi: 10.1016/j.jcis.2016.09.030
Ausbildungszentrum Muttenz (2017). “Wasserbestimmung nach karl fischer,” in Laborpraxis Band 4: Analytische Methoden, ed. aprentas (Cham: Springer International Publishing), 105–111.
Baldino, L., Cardea, S., and Reverchon, E. J. C. E. T. (2015). Natural aerogels production by supercritical gel drying. Chem. Eng. Trans. 43, 739–744.
Bangi, U. K. H., Dhere, S. L., and Venkateswara Rao, A. (2010). Influence of various processing parameters on water-glass-based atmospheric pressure dried aerogels for liquid marble purpose. J. Mater. Sci. 45, 2944–2951. doi: 10.1007/s10853-010-4287-9
Bruttel, P., and Schlink, R. (2006). Wasserbestimmung durch Karl-Fischer-Titration. Weinheim: GIT Verlag.
Crank, J., and Nicolson, P. (1947). A practical method for numerical evaluation of solutions of partial differential equations of the heat-conduction type. Proc. Camb. Philos. Soc. 43, 50–67.
Czakkel, O., Marthi, K., Geissler, E., and László, K. (2005). Influence of drying on the morphology of resorcinol–formaldehyde-based carbon gels. Microporous Mesoporous Mater. 86, 124–133. doi: 10.1016/j.micromeso.2005.07.021
Deuhard, P., and Hohmann, A. (2008). Numerische Mathematik 1,2,3: Eine algorithmisch orientierte Einführung. Berlin: deGruyter.
Einarsrud, M. A., Nilsen, E., Rigacci, A., Pajonk, G. M., Buathier, S., Valette, D., et al. (2001). Strengthening of silica gels and aerogels by washing and aging processes. J. Non Crystalline Solids 285, 1–7. doi: 10.1016/S0022-3093(01)00423-9
FischerScientific (2021). Available online at: https://www.fishersci.com/shop/products/molecular-sieves-3a-8-12-mesh-acros-organics-3/AC197255000 (accessed January 29, 2021).
Ganesan, K., Heyer, M., Ratke, L., and Milow, B. (2018). Facile preparation of nanofibrillar networks of “Ureido-Chitin” containing ureido and amine as chelating functional Groups. Chemistry 24, 19332–19340. doi: 10.1002/chem.201804405
Griffin, J. S., Mills, D. H., Cleary, M., Nelson, R., Manno, V. P., and Hodes, M. (2014). Continuous extraction rate measurements during supercritical CO2 drying of silica alcogel. J. Supercrit. Fluids 94, 38–47. doi: 10.1016/j.supflu.2014.05.020
Gurikov, P., Subrahmanyam, P. R., Griffin, J. S., Steiner Iii, S. A., and Smirnova, I. (2019). Solvent exchange in the processing of biopolymer aerogels: current status and open questions. Ind. Eng. Chem. Res. 58, 18590–18600. doi: 10.1021/acs.iecr.9b02967
Hüsing, N., and Schubert, U. (1998). Aerogele – luftige materialien: chemie, struktur und eigenschaften. Angewandte Chemie 110, 22–47.
Innerlohinger, J., Weber, H. K., and Kraft, G. (2006). Aerocellulose: aerogels and aerogel-like materials made from cellulose. Macromol. Symp. 244, 126–135. doi: 10.1002/masy.200651212
Karadagli, I., Schulz, B., Schestakow, M., Milow, B., Gries, T., and Ratke, L. (2015). Production of porous cellulose aerogel fibers by an extrusion process. J. Supercrit. Fluids 106, 105–114. doi: 10.1016/j.supflu.2015.06.011
Karge, H. G., and Nießen, W. (1991). A new method for the study of diffusion and counter-diffusion in zeolites. Catal. Today 8, 451–465. doi: 10.1016/0920-5861(91)87023-G
Kistler, S. S. (1932). Coherent expanded-aerogels. J. Phys. Chem. 36, 52–64. doi: 10.1021/j150331a003
Lambert, S. M., Overturf, G. E. III, Wilemski, G., Letts, S. A., Schroen-Carey, D., and Cook, R. C. (1997). Fabrication of low-density foam shells from resorcinol-formaldehyde aerogel. J. Appl. Polym. Sci. 65, 2111–2122.
Lázár, I., and Fábián, I. (2016). A continuous extraction and pumpless supercritical CO2 drying system for laboratory-scale aerogel production. Gels 2:26.
Lebedev, A. E., Katalevich, A. M., and Menshutina, N. V. (2015). Modeling and scale-up of supercritical fluid processes. Part I: supercritical drying. J. Supercrit. Fluids 106, 122–132. doi: 10.1016/j.supflu.2015.06.010
Nefzger, S. (2020). Optimierung des Lösungsmittelaustausches für die Aerogelsynthese. Master Thesis, Hochschule Bonn-Rhein-Sieg, Sankt Augustin.
Novak, Z., and Knez, Ž (1997). Diffusion of methanol–liquid CO2 and methanol–supercritical CO2 in silica aerogels. J. Non Crystal. Solids 221, 163–169. doi: 10.1016/S0022-3093(97)00342-6
Panagiotopoulos, A. Z., and Reid, R. C. (1987). “High-pressure phase equilibria in ternary fluid mixtures with a supercritical component,” in Supercritical Fluids, ed. A. Z. Panagiotopoulos (Washington: American Chemical Society), 115–129.
Pekala, R. W. (1989). Organic aerogels from the polycondensation of resorcinol with formaldehyde. J. Mater. Sci. 24, 3221–3227.
Petričević, R., Reichenauer, G., Bock, V., Emmerling, A., and Fricke, J. (1998). Structure of carbon aerogels near the gelation limit of the resorcinol–formaldehyde precursor. J. Non Crystal. Solids 225, 41–45. doi: 10.1016/S0022-3093(98)00006-4
Press, W. H., Flannery, B. P., Teukolsky, S. A., and Vetterling, W. T. (1990). Numerical Recipes. Cambridge: Cambridge University Press.
Quiño, J., Ruehl, M., Klima, T., Ruiz, F., Will, S., and Braeuer, A. (2016). Supercritical drying of aerogel: in situ analysis of concentration profiles inside the gel and derivation of the effective binary diffusion coefficient using Raman spectroscopy. J. Supercrit. Fluids 108, 1–12. doi: 10.1016/j.supflu.2015.10.011
Reichenauer, G., Stumpf, C., and Fricke, J. (1995). Characterization of SiO2, RF and carbon aerogels by dynamic gas expansion. J. Non Crystal. Solids 186, 334–341. doi: 10.1016/0022-3093(95)00057-7
Reining, R. (2018). Titration Handbook. Theory and Practice of Titration. Germany: Xylem Analytics Germany.
Robitzer, M., David, L., Rochas, C., Di Renzo, F., and Quignard, F. (2008). Nanostructure of calcium alginate aerogels obtained from multistep solvent exchange route. Langmuir 24, 12547–12552. doi: 10.1021/la802103t
Şahin, İ, Özbakır, Y., İnönü, Z., Ulker, Z., and Erkey, C. (2018). Kinetics of supercritical drying of gels. Gels 4:3.
Şahin, İ, Uzunlar, E., and Erkey, C. (2019). Investigation of kinetics of supercritical drying of alginate alcogel particles. J. Supercrit. Fluids 146, 78–88. doi: 10.1016/j.supflu.2018.12.019
Saliger, R., Bock, V., Petricevic, R., Tillotson, T., Geis, S., and Fricke, J. (1997). Carbon aerogels from dilute catalysis of resorcinol with formaldehyde. J. Non Crystal. Solids 221, 144–150.
Sanz-Moral, L. M., Rueda, M., Mato, R., and Martín, Á (2014). View cell investigation of silica aerogels during supercritical drying: analysis of size variation and mass transfer mechanisms. J. Supercrit. Fluids 92, 24–30. doi: 10.1016/j.supflu.2014.05.004
Szczurek, A., Amaral-Labat, G., Fierro, V., Pizzi, A., Masson, E., and Celzard, A. (2011). The use of tannin to prepare carbon gels. Part I: carbon aerogels. Carbon 49, 2773–2784. doi: 10.1016/j.carbon.2011.03.007
Tajiri, K., Igarashi, K., and Nishio, T. (1995). Effects of supercritical drying media on structure and properties of silica aerogel. J. Non Crystal. Solids 186, 83–87. doi: 10.1016/0022-3093(95)00038-0
Tannert, R., Schwan, M., and Ratke, L. (2015). Reduction of shrinkage and brittleness for resorcinol-formaldehyde aerogels by means of a pH-controlled sol–gel process. J. Supercrit. Fluids 106, 57–61. doi: 10.1016/j.supflu.2015.06.021
van Bommel, M. J., and de Haan, A. B. (1995). Drying of silica aerogel with supercritical carbon dioxide. J. Non Crystal. Solids 186, 78–82. doi: 10.1016/0022-3093(95)00072-0
Wawrzyniak, P., Rogacki, G., Pruba, J., and Bartczak, Z. (2001). Effective diffusion coefficient in the low temperature process of silica aerogel production. J. Non Crystal. Solids 285, 50–56. doi: 10.1016/S0022-3093(01)00431-8
Keywords: solvent exchange, aerogels, Karl Fischer titration, supercritical drying, diffusion
Citation: Schwan M, Nefzger S, Zoghi B, Oligschleger C and Milow B (2021) Improvement of Solvent Exchange for Supercritical Dried Aerogels. Front. Mater. 8:662487. doi: 10.3389/fmats.2021.662487
Received: 01 February 2021; Accepted: 18 March 2021;
Published: 09 April 2021.
Edited by:
Guoqing Zu, Tongji University, ChinaReviewed by:
Ernesto Reverchon, University of Salerno, ItalyCopyright © 2021 Schwan, Nefzger, Zoghi, Oligschleger and Milow. This is an open-access article distributed under the terms of the Creative Commons Attribution License (CC BY). The use, distribution or reproduction in other forums is permitted, provided the original author(s) and the copyright owner(s) are credited and that the original publication in this journal is cited, in accordance with accepted academic practice. No use, distribution or reproduction is permitted which does not comply with these terms.
*Correspondence: Marina Schwan, bWFyaW5hLnNjaHdhbkBkbHIuZGU=
Disclaimer: All claims expressed in this article are solely those of the authors and do not necessarily represent those of their affiliated organizations, or those of the publisher, the editors and the reviewers. Any product that may be evaluated in this article or claim that may be made by its manufacturer is not guaranteed or endorsed by the publisher.
Research integrity at Frontiers
Learn more about the work of our research integrity team to safeguard the quality of each article we publish.