 Yannis De Luna1
 Nasr Bensalah1*
- Department of Chemistry and Earth Sciences, College of Arts and Sciences, Qatar University, Doha, Qatar
The potential application of rechargeable multivalent ion batteries in portable devices and renewable energy grid integration have gained substantial research interest in aqueous Zn-ion batteries (ZIBs). Compared to Li-based batteries, ZIBs offer lower costs, higher energy density, and safety that make them more attractive for energy storage in grid integration applications. Currently, more research is required to find a suitable cathode material for ZIBs with high capacity and structural stability during charge/discharge cycling. Vanadium phosphate (VOP) compounds as cathode material for ZIBs have been of particular interest, owing to vanadium’s diverse oxidation states. In this present work, two VOP compounds, [H0.6(VO)3(PO4)3(H2O)3].4H2O and VOPO4.2H2O, were synthesized from phosphoric acid and different sources of vanadium via a simple hydrothermal method. Various characterization techniques were carried out, revealing the layered structure of both products and high purity of [H0.6(VO)3(PO4)3(H2O)3].4H2O. Zn/VOP batteries were prepared using Zn metal as counter and reference electrode and 3 M ZnSO4.7H2O as electrolyte. Electrochemical tests were conducted to evaluate the cycling performance of VOPs as cathode material for aqueous Zn-ion batteries. Based on the results, both compounds have shown highly reversible Zn-ion intercalation and deintercalation. VOPO4.2H2O achieved a higher specific capacity of up to 85 mAh/g during discharging, as opposed to 65 mAh/g for the hydrated VOP complex. However, [H0.6(VO)3(PO4)3(H2O)3].4H2O is more stable with higher reproducibility than VOPO4.2H2O during cycling. Nevertheless, more research is still required to enhance the specific capacity and improve the cycling performance of VOP-based cathodes for their prospective use in aqueous ZIBs.
Introduction
With the rapid advancement of technology, the need for an effective energy storage solution has become even more crucial than ever. Energy storage has an array of applications such as electronic devices, electric vehicles and grid integrated with renewable energy systems. Currently, lithium-ion batteries (LIBs) are dominating the market on account of their high energy density, long life cycle, and light weight (Tarascon and Armand, 2001). However, LIBs are not capable of covering all the needs for these applications due to high manufacturing cost, safety issues, and limited energy density. Safety is a major concern of LIBs due to high flammability of the organic carbonate-based electrolytes. Although incidents with hand-held devices powered by LIBs are few in numbers, having no incident is ideal in order for a battery to be deemed completely safe by the general public (Zubi et al., 2018). Furthermore, the use of LIBs in electric vehicles raises some concern related to limited specific capacities of conventional electrode materials, reaching their maximum theoretical values of 370 mAh/g for graphite anodes (Sato et al., 1994), and 274 mAh/g for lithium cobalt oxide (Liu et al., 2018). The potential applications of LIBs in power grids integrated with renewable energy systems also require guaranteed safety and high energy density to meet demands in a more economical and conservational approach (Shin et al., 2020).
Due to the urgency to overcome these drawbacks, the possible transition from Li-ion to aqueous multivalent batteries should be explored further. Aqueous zinc-ion battery (ZIB) is a good candidate due to its low cost, high energy density, and safety (Konarov et al., 2018). ZIBs utilize zinc metal as the anode and an aqueous electrolyte, thereby being safer and cheaper than its Li-ion counterparts, whilst also being recyclable and eco-friendly (Song et al., 2018). The concept of aqueous ZIBs is not new; however, commercially sold ZIBs are mostly non-rechargeable or primary batteries (Manickam et al., 2004; Minakshi et al., 2011; Shin et al., 2020). In recent times, the demand for rechargeable (secondary) batteries has significantly increased as the world shifts into sustainable practices. Therefore, the development of rechargeable aqueous Zn-ion batteries with high energy density and stable electrochemical performance is extensively targeted by research and development entities. Furthermore, the cathode material used with the Zn anode has a significant influence on the overall performance of the battery. Various cathode materials, such as MnO2 and V2O5, have been tested and findings have shown that different crystal structures resulted in varying capacities, which are considered relatively low. Additionally, such cathode materials experienced capacity fading at a high rate due to unstable structures, as well as slow diffusion of Zn ions during intercalation/deintercalation (Minakshi and Singh, 2012; Biswal et al., 2014; Deng et al., 2020). However, vanadium-based cathode materials have been found to have higher capacity and greater stability than manganese-based cathodes due to vanadium’s wider range of oxidation states and coordination geometry (Ming et al., 2019). Layered cathode material, based on the intercalation of Zn2+ ions, showed better performance, especially layered V-based cathodes such as vanadium oxides and phosphates (Kundu et al., 2016, 2018; Verma et al., 2019). Among other morphologies, layered cathode materials are ideal for storing Zn2+ through intercalation between the layers. A large interlayer spacing in layered materials allows for an easier insertion of multivalent cations, like Zn2+, as electrostatic repulsion between the cathode material and cation is minimized (Kundu et al., 2016). The interlayer spacing can vary in size, which can be increased further by the intercalation of mono- and multivalent cations, or water molecules during the synthesis of cathode material (Novák and Desilvestro, 1993). Furthermore, these cations or water molecules maintain the structure of the cathode during intercalation and deintercalation, essentially acting as pillars that can prolong the cycling performance of batteries (Alfaruqi et al., 2017; Kundu et al., 2018). The search for more stable layered cathode materials for Zn2+ intercalation is necessary for the potential use of aqueous rechargeable Zn-ion batteries in various applications. Vanadium phosphates are a promising intercalation material for Zn2+, particularly the layered and hydrated compounds (Sun et al., 2009). The water molecules in VOP compounds can potentially increase the interlaying space, which would improve the stability of the cathode material during cycling. Therefore, synthesizing layered, hydrated VOP compounds are preferred. The preparation of vanadium phosphate dihydrate (VOPO4.2H2O) using reflux method of a mixture of V2O5 and H3PO4 in water was reported in literature by several authors (Trchová et al., 1999; Bartley et al., 2001; Griesel et al., 2004; Taufiq-Yap et al., 2007). Hydrothermal synthesis is simple method, making it ideal for the preparation of VOP as the reaction is completed in one-step. In addition, this method is opted for the preparation of nanomaterials compared to other methods, such as wet chemistry, sol-gel, and mechanochemical methods.
In this work, hydrated vanadium phosphates will be prepared and tested as cathode materials for aqueous Zn-ion batteries to investigate the effect of vanadium source on the structure and electrochemical performance of the synthesized products. Oxovanadium phosphates (VOPs) will be prepared by hydrothermal treatment using two different vanadium sources (NH4VO3 and V2O5) and phosphoric acid as phosphate source. The as-prepared materials will be characterized using different analytical methods: X-ray diffraction (XRD), Raman spectroscopy, scanning electron microscopy (SEM), energy dispersive spectroscopy (EDS), thermogravimetric analysis (TGA), differential scanning calorimetry (DSC), and transmission electron microscopy (TEM). VOP-based cathode materials will be tested in half-cells using zinc as counter and reference electrodes, and ZnSO4.7H2O as aqueous electrolyte under mildly acidic conditions. The electrochemical performance of Zn/VOP batteries will be evaluated using cyclic voltammetry (CV), and galvanostatic charge-discharge (GCD).
Experimental Procedure
Chemicals
The vanadium sources used in this study, NH4VO3 and V2O5, were purchased from BDH Chemicals Ltd., and VWR Chemicals, respectively. Phosphoric acid (85%) was purchased from Fluka Chemika. N-methyl-2-pyrrolidone (NMP) and Zn foil were from Sigma-Aldrich. Carbon black was from TIMCAL Graphite and Carbon. Polyvinylidene fluoride (PVDF) was purchased from Arkema. ZnSO4.7H2O was from Fisher Scientific. Ti foil was purchased from Baoji Hanz Metal Material Co., Ltd., Glass fiber filter paper was purchased from Glaswarenfabrik Karl Hecht GmbH & Co., KG.
Methods
Synthesis of Hydrated [H0.6(VO)3(PO4)3(H2O)3] by Hydrothermal Method
5.85 g of NH4VO3 and 10 mL H3PO4 were dissolved in 30 mL distilled water. The mixture was heated at 50−60°C for 3 h with continuous stirring under the fume hood, transferred to a Teflon-lined autoclave, tightly sealed using a stainless steel vessel, and kept inside the oven at 180°C for 24 h. The resulting solid products were separated by centrifugation and washed with deionized water several times until a neutral pH was achieved. The collected products (denoted by VOP1) were dried overnight at 80 °C inside a vacuum oven.
Synthesis of Hydrated VOPO4 by Hydrothermal Method
In a similar manner, 4.50 g of V2O5 and 15 mL H3PO4 were dissolved in 70 mL distilled water. The mixture was heated at 50−60°C for 3 h with continuous stirring under the fume hood, transferred to a Teflon-lined autoclave, tightly sealed using a stainless steel vessel, and kept inside the oven at 180°C for 24−48 h. The resulting solid products were separated by centrifugation and washed with deionized water several times until a neutral pH was achieved. The collected products (denoted by VOP2) were dried overnight at 80°C inside a vacuum oven.
Preparation of Zn/VOP Coin Cells
For each of the two vanadium phosphate products, 0.75 g active material (VOP), 0.15 g carbon, and 0.10 g PVDF were mixed with 2 mL NMP in a ball mill agate jar. The sealed agate jars were placed in a ball mill machine (Changsha Tianchuang Powder Technology Co., Ltd.) for 1 h at 400 rpm using agate balls (diameter 6 mm). The slurries were casted on a titanium foil using a thick film coater (MTI, MSK-AFA-I), and then dried in an oven under vacuum at 60°C overnight. The casted materials and zinc were cut into disks using a disk cutting machine (MTI, MSK-T10). The cathode was placed in the center of the positive case, followed by electrolyte (3 M ZnSO4.7H2O), glass fiber filter paper as separator, electrolyte, zinc, spacer, and spring. The negative case was placed on top then crimped using a hydraulic crimping machine (MTI, MSK-110).
Characterization and Electrochemical Techniques
X-ray diffraction analysis was conducted using PANalytical Empyrean X-ray Diffractometer (40 mA, 45 kV) to identify the crystal structure, purity of the products, and mean crystallite size using Scherrer equation (Eq. 1). XRD analysis was carried out within 5 to 90° (2θ) and a step size of 0.0130° at λ = 1.54 Å. Raman spectroscopy was conducted using Thermo Fisher Scientific DXR Raman Microscope at (wavelength) nm to identify the synthesized products. Thermal analysis, specifically TGA and DSC, were utilized to determine if the products synthesized are anhydrous or hydrated, and their thermodynamic properties, respectively. TGA was carried out using PerkinElmer Pyris 6 TGA 4000 under nitrogen atmosphere (flow rate = 20 mL/min) from 30 to 800°C at a rate of 5°C/min with sample weights of 3.659 mg (VOP1) and 4.288 mg (VOP2). DSC was performed using PerkinElmer Pyris 6 DSC 4000 under nitrogen atmosphere between 30 to 445°C at a rate of 5°C/min with sample weights of 3.570 mg (VOP1) and 5.140 mg (VOP2). SEM was performed using FEI Nova NanoSEM 450 to obtain micrographs of the physical structure of the products. With the same instrument, the elemental composition of each products were analyzed through EDS. TEM was conducted using FEI Tecnai G2 TEM TF20 to obtain further information about the structure of the crystal lattice. Electrochemical tests, including cyclic voltammetry and galvanostatic charge-discharge, were carried out to assess the performance of the as-prepared VOP products as cathode material for aqueous Zn-ion batteries using Zn metal as counter and reference electrodes and 3 M of aqueous electrolyte, ZnSO4.7H2O (pH ≈ 4.5). Cyclic voltammetry is an electrochemical technique that was used to measure the current produced by the VOP cathode materials in cells, as well as the reproducibility and recyclability, against a specified range of voltages vs. Zn2+/Zn at a rate of 1 mV/s. CV was conducted using CorrTest CS350 Potentiostat/Galvanostat Galvanostatic charge-discharge is a technique in electrochemistry that was used to test the overall cycling performance of VOP as cathode materials, including reversibility, reproducibility, stability, specific capacity, and efficiency, at different current densities 0.1–1.0 A/g. This test was conducted using MTI 8 Channels Battery Analyzer BST8-WA.
Results and Discussion
In this work, vanadium phosphates were prepared by hydrothermal treatment from two sources of vanadium: V2O5 and NH4VO3. The goal in this work is to investigate the effect of vanadium source on the structure and morphology of vanadium phosphate and its electrochemical performance for storing Zn2+ in aqueous electrolyte. The solid materials were separated by centrifugation after 24 h hydrothermal treatment at 180 °C. After drying in oven at 80 °C under vacuum, the as-prepared materials were characterized by different techniques including spectroscopy (Raman, XRD), microscopy (SEM, EDS, and TEM), and thermal analysis (TGA, DSC). The prepared vanadium phosphate products were tested as cathode material for aqueous Zn-ion battery in half coin cells using Zn metal as counter and reference electrode and 3 M ZnSO4 as aqueous electrolyte at pH ≈ 4.5.
Characterization
X-ray Diffraction
XRD analysis was performed in this work to determine the crystal structure of the synthesized products. The indexation of the peaks in Figure 1A confirms the presence of only one phase with very small amount of impurities. The peaks in the XRD pattern of VOP1 are consistent with the peaks of hydrogen oxovanadium phosphate (V) hydrate, [H0.6(VO)3(PO4)3(H2O)3].4H2O, in the database (ICDD:98-009-2847) (Shpeizer et al., 2001). In particular, the peak with highest intensity at 2θ = 12.7° corresponds to the (100) crystal plane of [H0.6(VO)3(PO4)3(H2O)3].4H2O. The reaction between NH4VO3 and H3PO4 in the autoclave did not form the expected compound, VOPO4. Instead, the formation of the hydrated complex, [H0.6(VO)3(PO4)3(H2O)3].4H2O, has occurred. It is assumed that heat treatment at temperature greater than 500°C would transform the hydrated complex into anhydrous oxovanadium phosphate by dehydration. This can be investigated further in future work.
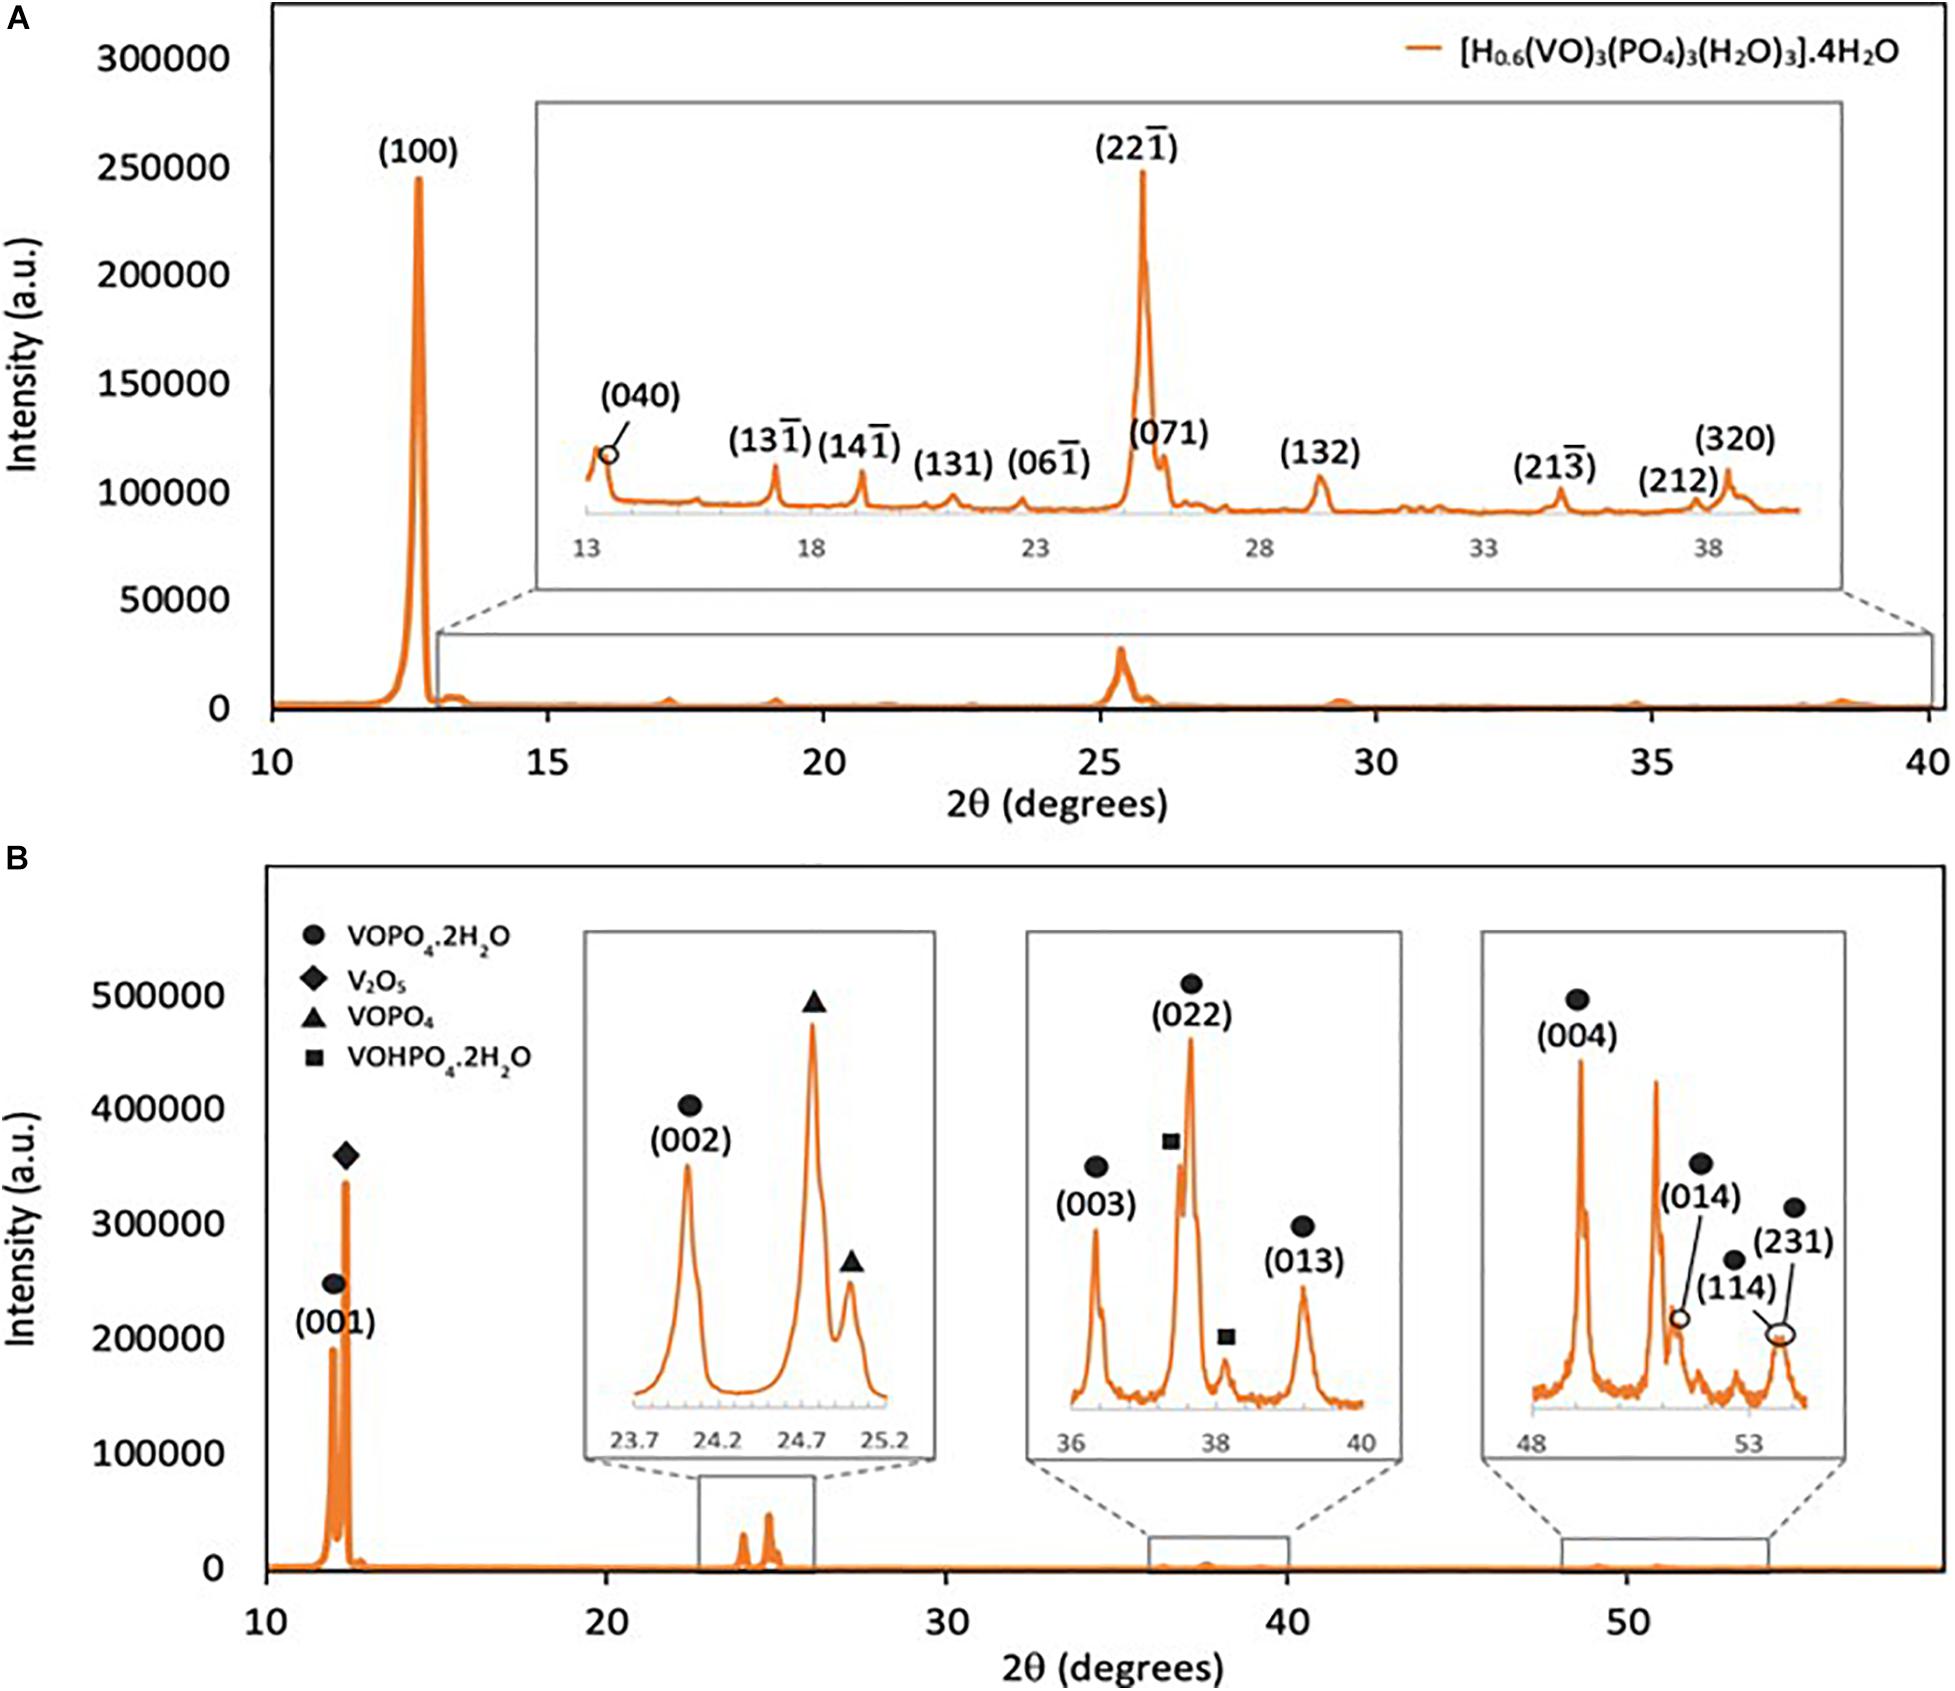
Figure 1. XRD spectra of (A) VOP1 and (B) VOP2.
The XRD spectrum of VOP2 in Figure 1B shows two out of three of the main distinct crystal faces for VOPO4.2H2O, which are (001) and (002) planes located at 2θ = 11.9° and 23.9° (Wong and Taufiq-Yap, 2011), respectively. In addition, several more of the indexed peaks matched that of oxovanadium phosphate dihydrate from the database (ICDD:98-020-0884) (Tietze, 1981). However, the peak with the highest intensity at 2θ = 12.3° corresponds to V2O5 phase (Rownaghi et al., 2009). Peaks of significant intensity that corresponds to VOPO4 and VOHPO4.2H2O were identified in the XRD pattern of VOP2. Therefore, XRD results indicate that a substantial amount of reacting material has remained in VOP2 product, whilst some undesired products formed in the process.
Using the XRD results, the crystallite size of the products were calculated using Scherrer equation,
where D represents the average size of crystallites, K is the dimensionless shape factor with a value of 0.9, λ is the X-ray wavelength with a value of 1.54 × 10⁻¹⁰ m (1.54 Å), β is the line broadening at half of the maximum intensity in radians, and θ is the Bragg angle in degrees. The crystallite size of VOP1 is 46.8 nm, whilst that of VOP2 is 88.6 nm. These calculations confirm that the VOP products formed are nanoparticles, although the crystallite size of VOP2 is almost twice the size of VOP1.
Raman Spectroscopy
Raman spectroscopy was conducted to identify the presence of vanadium phosphates in the synthesized compounds. Based on the Raman spectra of anhydrous oxovanadium phosphate (VOPO4), typical Raman shifts at 917 and 1,035 cm–1 are observed that accounts for the symmetrical stretching modes of O–P–O and V = O (Trchová et al., 1999). As shown in Figure 2A, two intense peaks at 909 and 1,023 cm–1 were observed in VOP1, which are slightly lower than the typical Raman shifts for O–P–O and V = O bond stretching in anhydrous VOPO4. The slight decrease in Raman shift values are commonly observed with hydrated vanadium phosphates, which confirms that anhydrous VOPO4 was not synthesized in the hydrothermal reaction of NH4VO3 and H3PO4. The results from Raman spectroscopy support the finding from XRD analysis on the formation of the hydrated hydrogen oxovanadium phosphate complex.
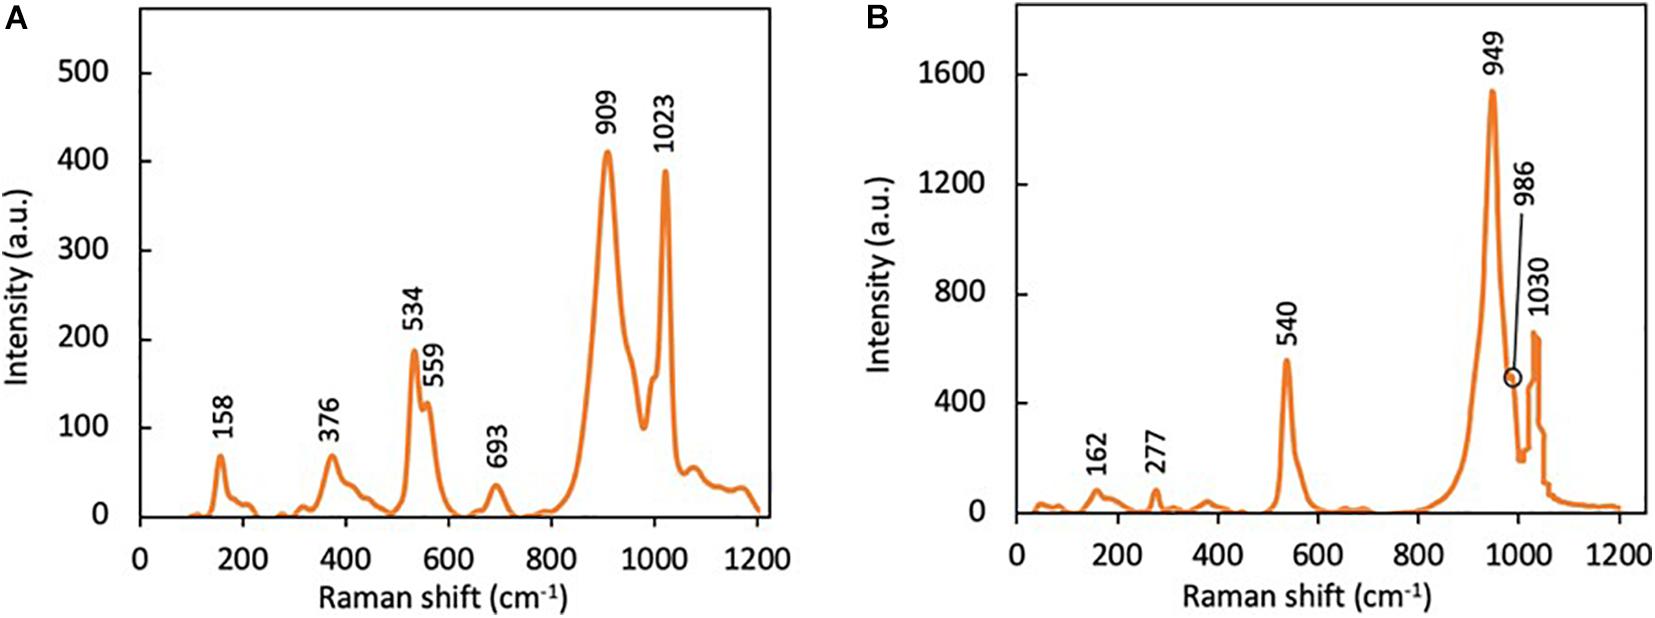
Figure 2. Raman spectra of (A) VOP1 and (B) VOP2.
In a different study, vanadyl phosphate dihydrate (VOPO4.2H2O) was observed to have peaks at 953, 987, and 1,038 cm–1. These peaks correspond to the stretching vibrations of P–O bond in the tetrahedral phosphate ion, V–O, and V–O–P bond, respectively (Griesel et al., 2004). In this present study, Raman shifts at 949, 986, and 1,030 cm–1 were observed in the Raman spectrum of VOP2 in Figure 2B, which are slightly lower than literature values. The difference in value may have been caused by the presence of impurities, as revealed in XRD analysis. Nevertheless, results from Raman spectroscopy confirm the presence of VOPO4.2H2O in VOP2 product.
Thermal Analysis (TGA and DSC)
Thermogravimetric analysis (TGA) was conducted to determine the level of hydration and possible thermal decomposition mechanism of VOP1 and VOP2. TGA has shown that VOP1 decomposed in two steps (Figure 3A), with mass loss of 11.2 and 3.6%, respectively. The first decomposition step corresponds to the loss of 3.8 mol of non-coordinated water molecules in [H0.6(VO)3(PO4)3(H2O)3].4H2O, occurring below 300°C. The second decomposition is consistent with the loss of the remaining non-coordinated water molecules with one coordinated water molecule between 300 and 450°C. The decomposition steps of [H0.6(VO)3(PO4)3(H2O)3].4H2O are represented in Eq. 2 and 3 as follows:
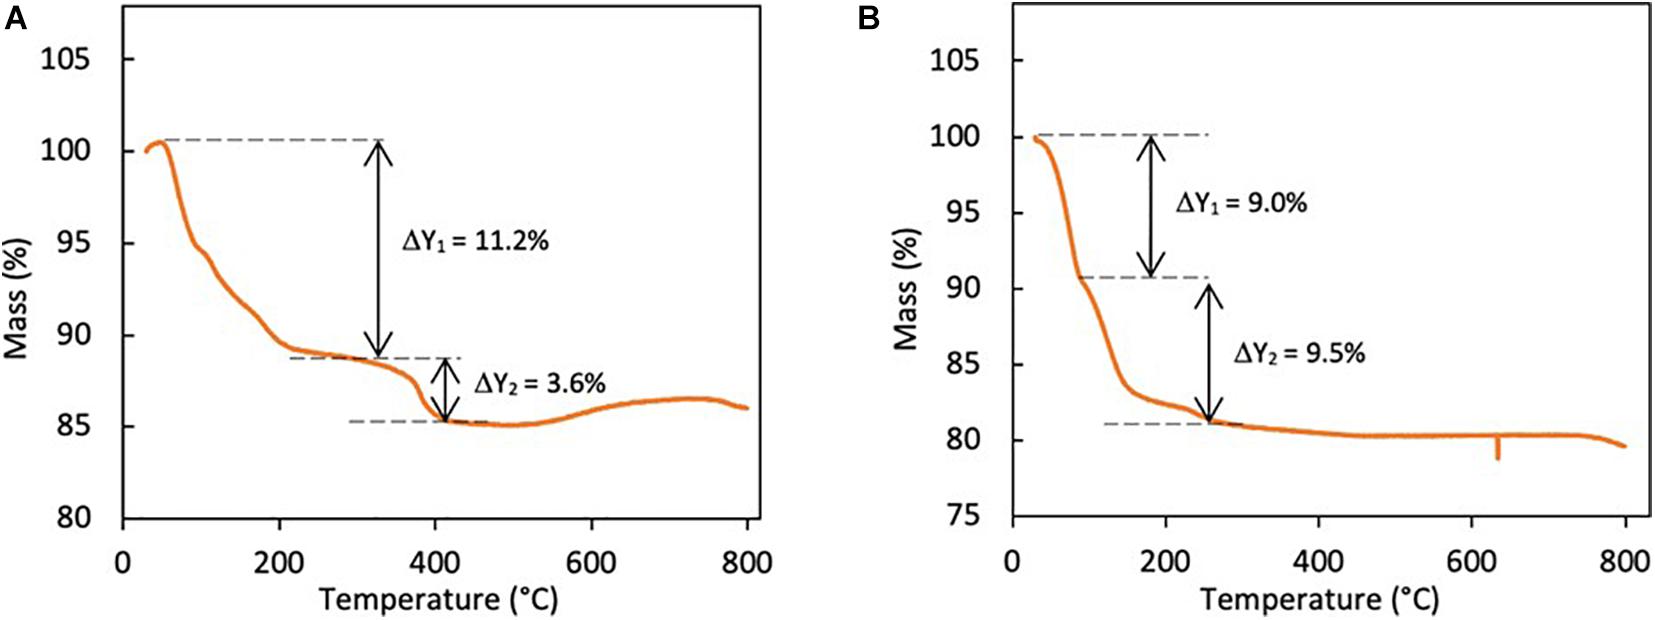
Figure 3. TGA of (A) VOP1 and (B) VOP2.
Results from thermogravimetric analysis of VOP2 showed that it underwent two decompositions (Figure 3B), which are consistent with the loss of one water molecule in each step. This is consistent with the thermal decomposition of VOPO4.2H2O (Beneš et al., 2000). The decomposition of VOPO4.2H2O occurred as follows:
Therefore, the results from the thermogravimetric analyses of the cathode materials support the findings from XRD and Raman spectroscopy on the formation of hydrated vanadium phosphate compounds.
Differential scanning calorimetry (DSC) was carried out to determine the thermodynamic parameters of the synthesized compounds. Based on the DSC plot of VOP1 in Figure 4A, three exothermic peaks were observed at 118.11, 271.38, and 375.67°C. These three peaks correspond with enthalpy of phase transition (ΔH) values of 44.47, 172.80, and 7.83 J/g, respectively. In a similar manner, two exothermic peaks were observed for VOP2 in Figure 4B at 128.51 and 204.18°C with ΔH values of 247.78 and 123.62 J/g, respectively.
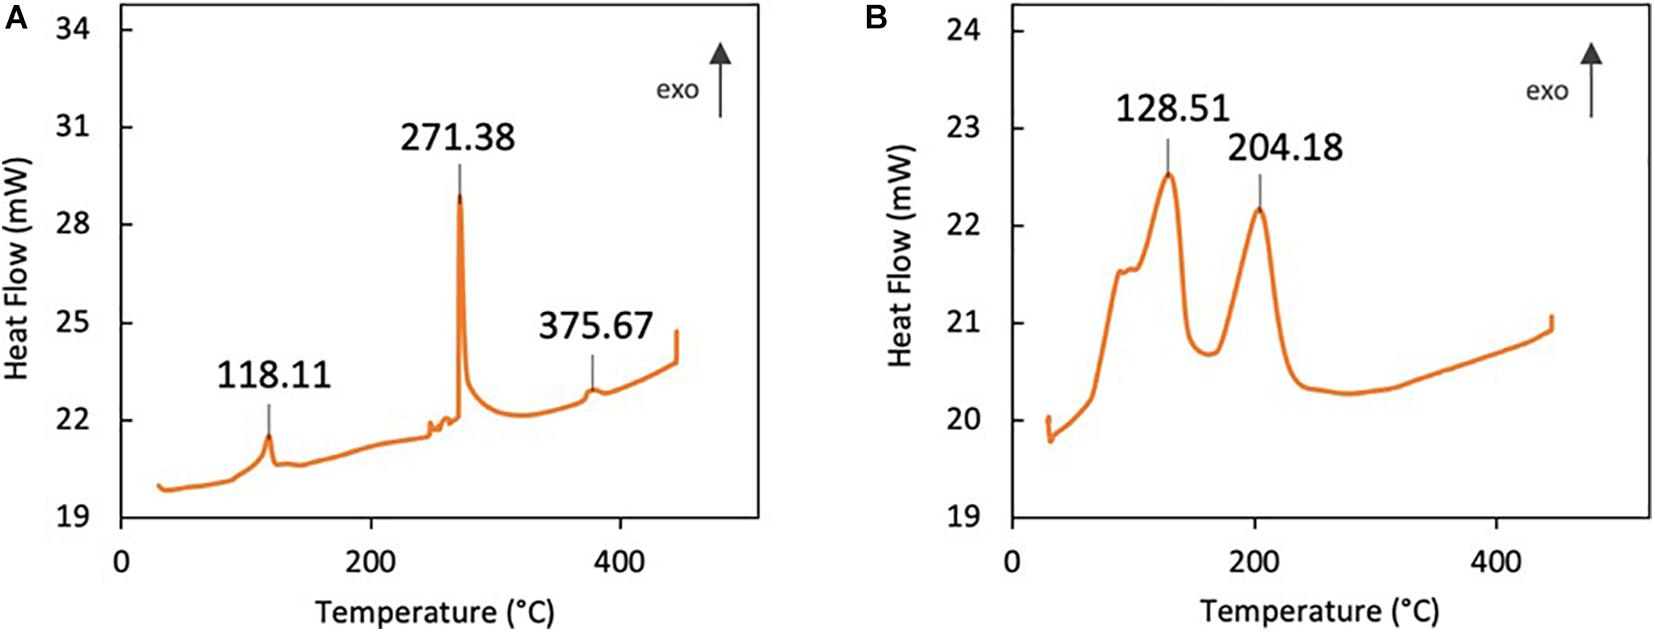
Figure 4. DSC of (A) VOP1 and (B) VOP2.
Scanning Electron Microscopy
Scanning electron microscopy is a technique used to produce micrographs that reveal the surface structure of compounds, which can be used as a tool to estimate the size of the sample. Scanning electron micrographs in Figures 5A,B shows that the hydrothermal synthesis of VOP1 and VOP2 produced layered structures. On average, each layer in VOP1 is approximately 1 μm, ranging from 0.3 to 2 μm. For VOP2, the average is much smaller, at approximately 0.4 μm, with values ranging from 0.1 to 0.8 μm.
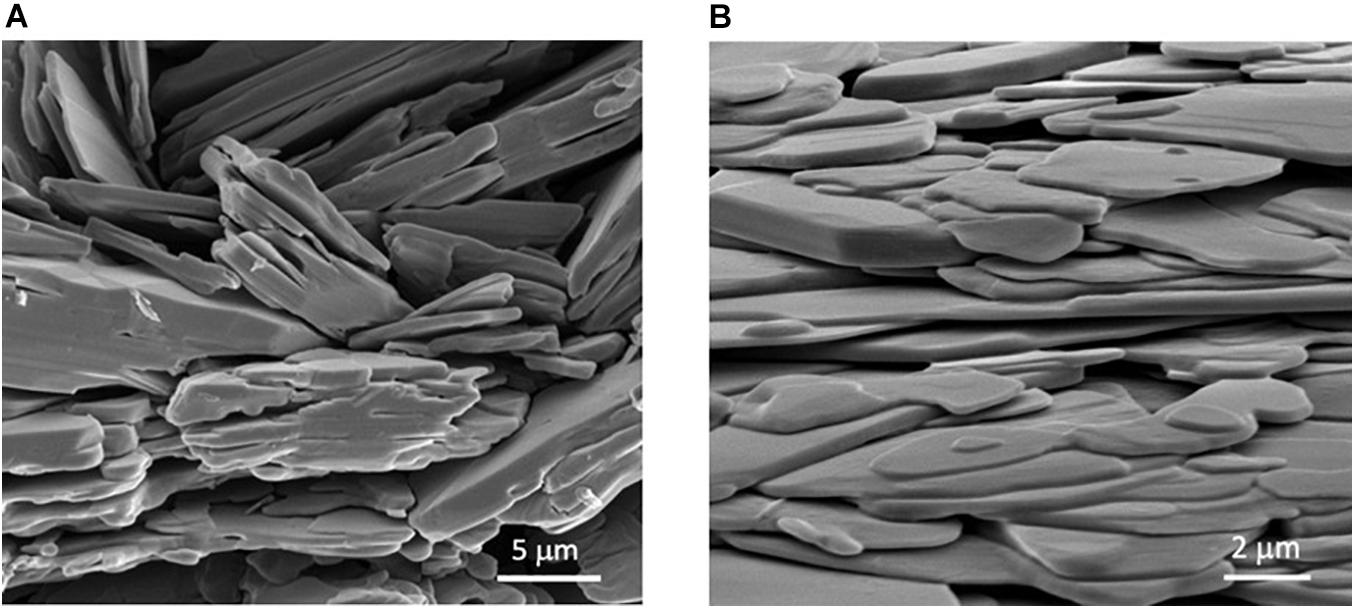
Figure 5. SEM images (A) VOP1 and (B) VOP2.
Energy Dispersive Spectroscopy
Energy dispersive X-ray spectroscopy (EDS) was conducted with SEM to determine the elemental composition of the synthesized products. Figures 6A,B shows that vanadium, phosphorus, and oxygen are all present in VOP1 and VOP2, suggesting that vanadium phosphates have been produced. However, nitrogen was detected in VOP1, which may imply that part of NH4+ is intercalated between the layers of the oxovanadium phosphate complex.
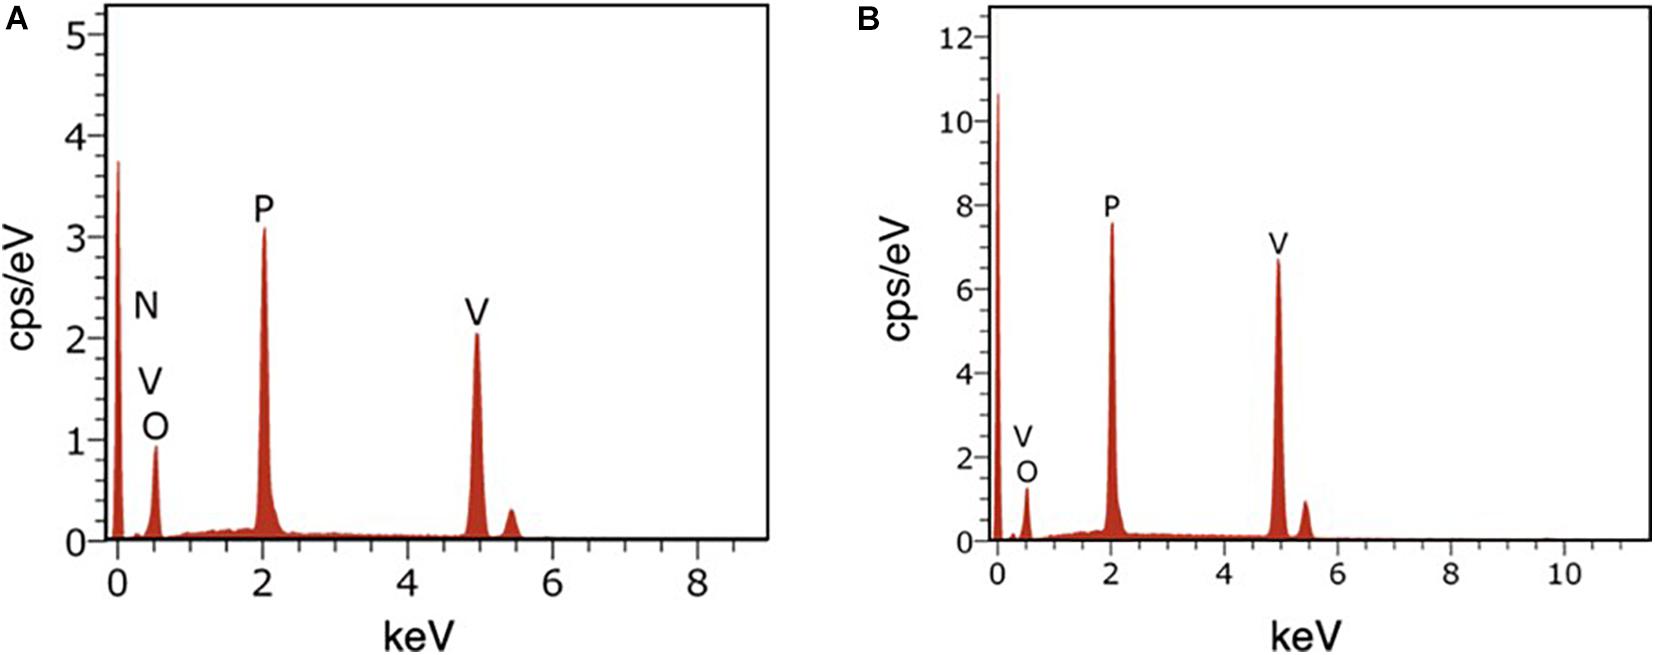
Figure 6. EDS analysis of (A) VOP1 and (B) VOP2.
Transmission Electron Microscopy
Transmission electron microscopy is a technique that can provide images of the internal structure of a sample, including the crystal lattice. Along with XRD analysis, TEM was used to determine the crystal planes present in the samples. Transmission electron micrographs (Figures 7a,d) revealed that the approximate particle sizes of VOP1 and VOP2 are similar, ranging from 1.8 to 2.7 μm. High resolution transmission electron microscopy (HRTEM) images were used to estimate the interlayer distance, which were compared with the XRD results and literature values. On one hand, HRTEM image for VOP1 (Figure 7b) showed unclear grains; hence, no distinct crystal faces were identified. On the other hand, HRTEM image for VOP2 (Figure 7e) has shown several grains with the same interplanar distance (d = 1.85 Å), corresponding to (004) plane. In the enlarged portion, (122) plane has been identified with interplanar distance of 2.22 Å (Tietze, 1981). Selected area electron diffraction (SAED) pattern of VOP1 (Figure 7c) showed the (212) plane with interplanar distance of 2.38 Å (Shpeizer et al., 2001). For VOP2, SAED pattern (Figure 7f) displayed the (013) plane with interplanar distance of 2.29 Å (Tietze, 1981). The SAED patterns indicate that VOP1 and VOP2 are monocrystalline.
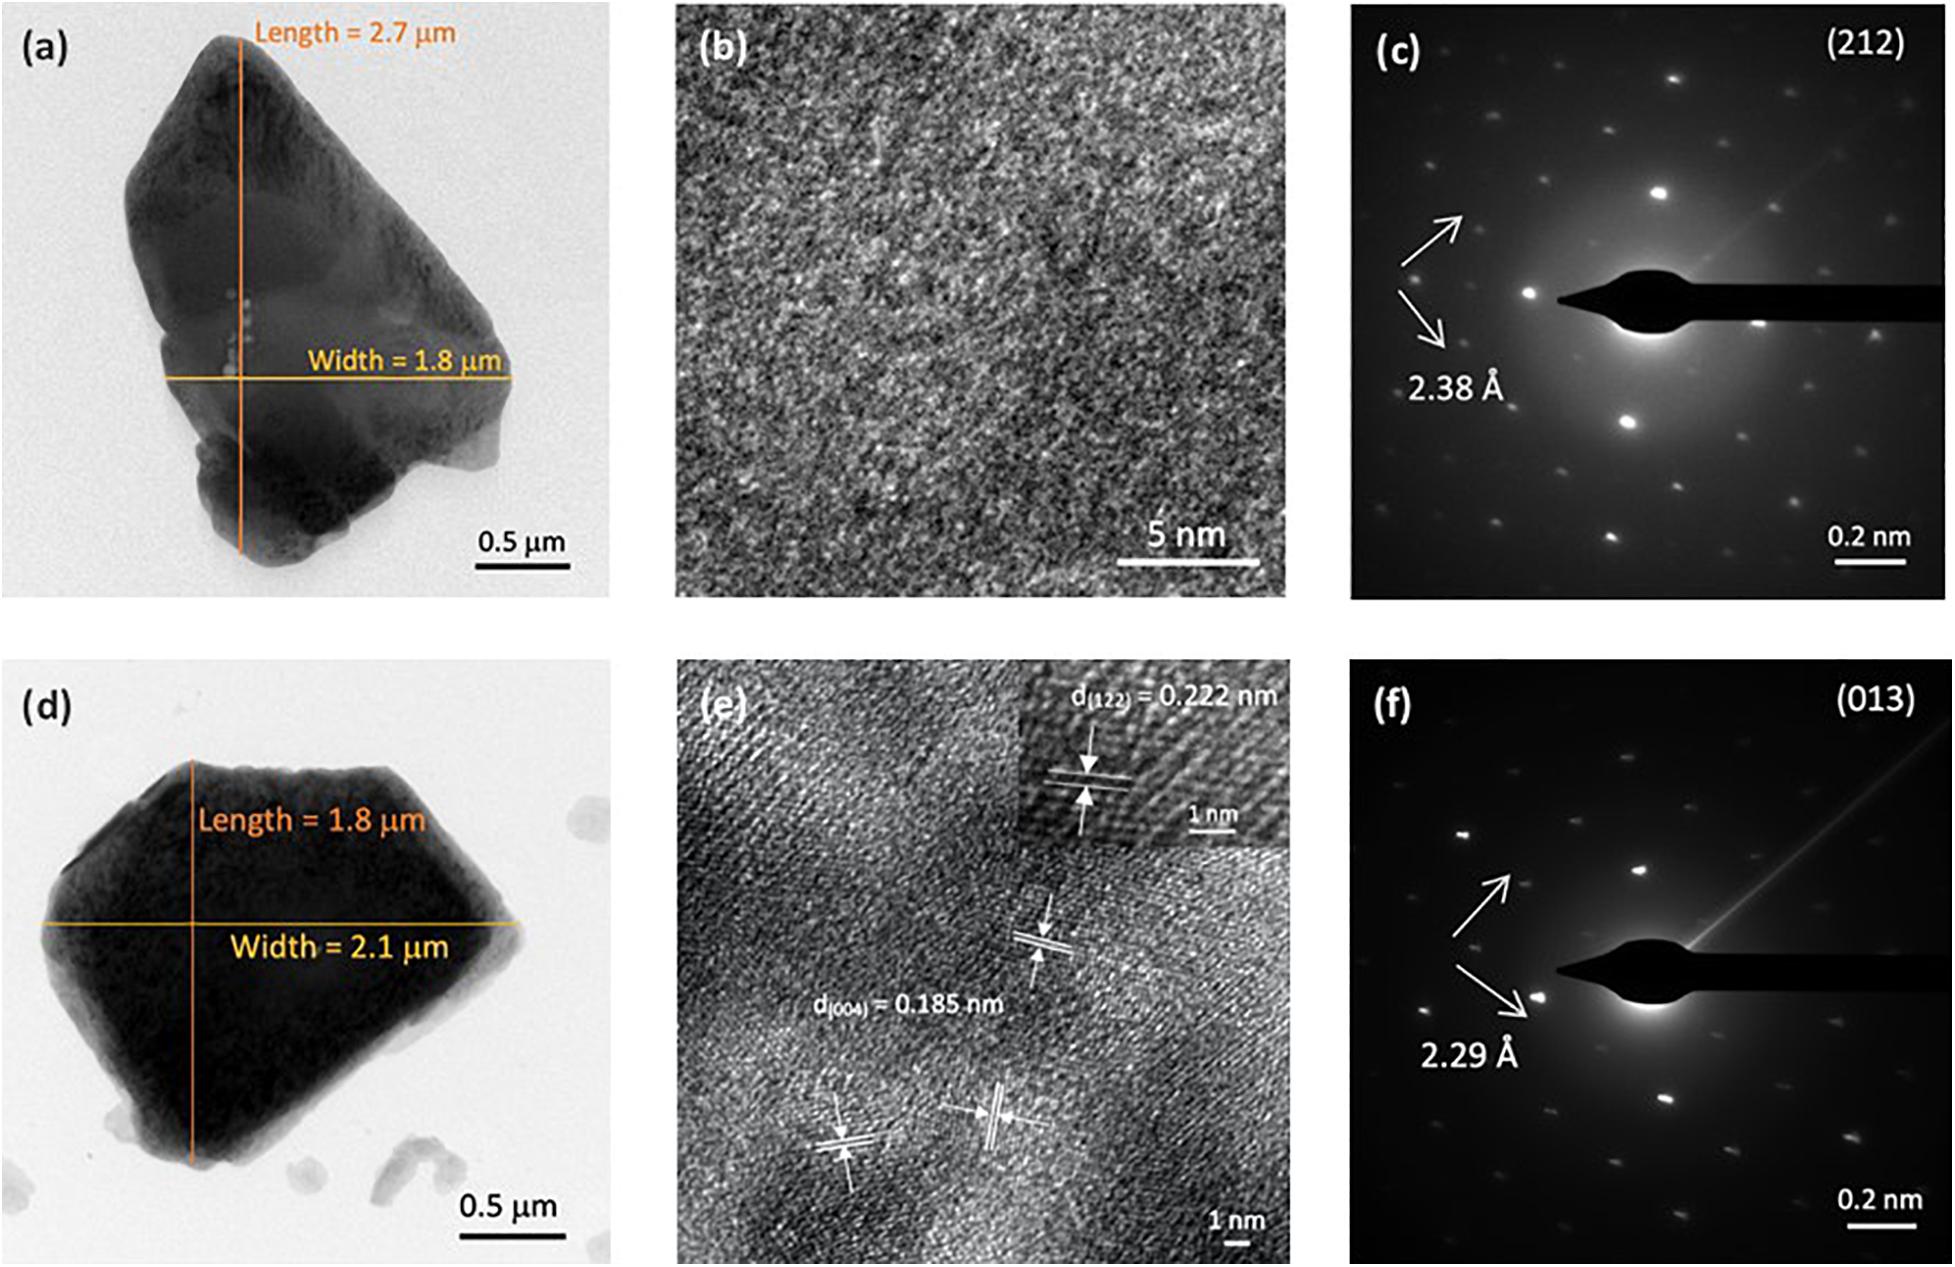
Figure 7. (a) TEM, (b) HRTEM, and (c) SAED pattern of VOP1. (d) TEM, (e) HRTEM, and (f) SAED pattern of VOP2. The inset in panel (e) shows another crystal plane identified in a different region.
Electrochemical Measurements
Cyclic Voltammetry
Cyclic voltammetry (CV) is a type of electrochemical technique that measures the flow of current of a cell against a range of voltages. CV was conducted at a scan rate of 1 mV/s between 0.5 and 2.25 V vs. Zn2+/Zn. All peaks identified in Figures 8A,B are summarized in Table 1 below. In Figure 8A, five anodic (oxidation) peaks are observed in cycle 1, with five corresponding cathodic (reduction) peaks in the lower half of the voltammogram. The same number of anodic and cathodic peaks at similar positions were observed in cycles 2 and 3. However, a significant decrease in intensity of peaks at 1.67, 1.92, and 2.07 V was observed from cycle 2, followed by a smaller decrease from cycle 3 onward. Furthermore, it is evident that a new peak has emerged at 1.33 V from cycle 3 onward, along with the fading of the last two peaks between 1.90 and 2.05 V. In cycles 4 and 5, four identical anodic/cathodic pairs were observed. In Figure 8B, five anodic peaks were observed for the initial cycle of VOP2, which correspond to five cathodic peaks. Four redox pairs were identified in cycle 2 due to the disappearance of the first peak, whilst three redox pairs were observed in cycle 3 with the fading of the first and last peaks. Beyond the first cycle, the intensity of the anodic and cathodic peaks continued to decrease significantly.
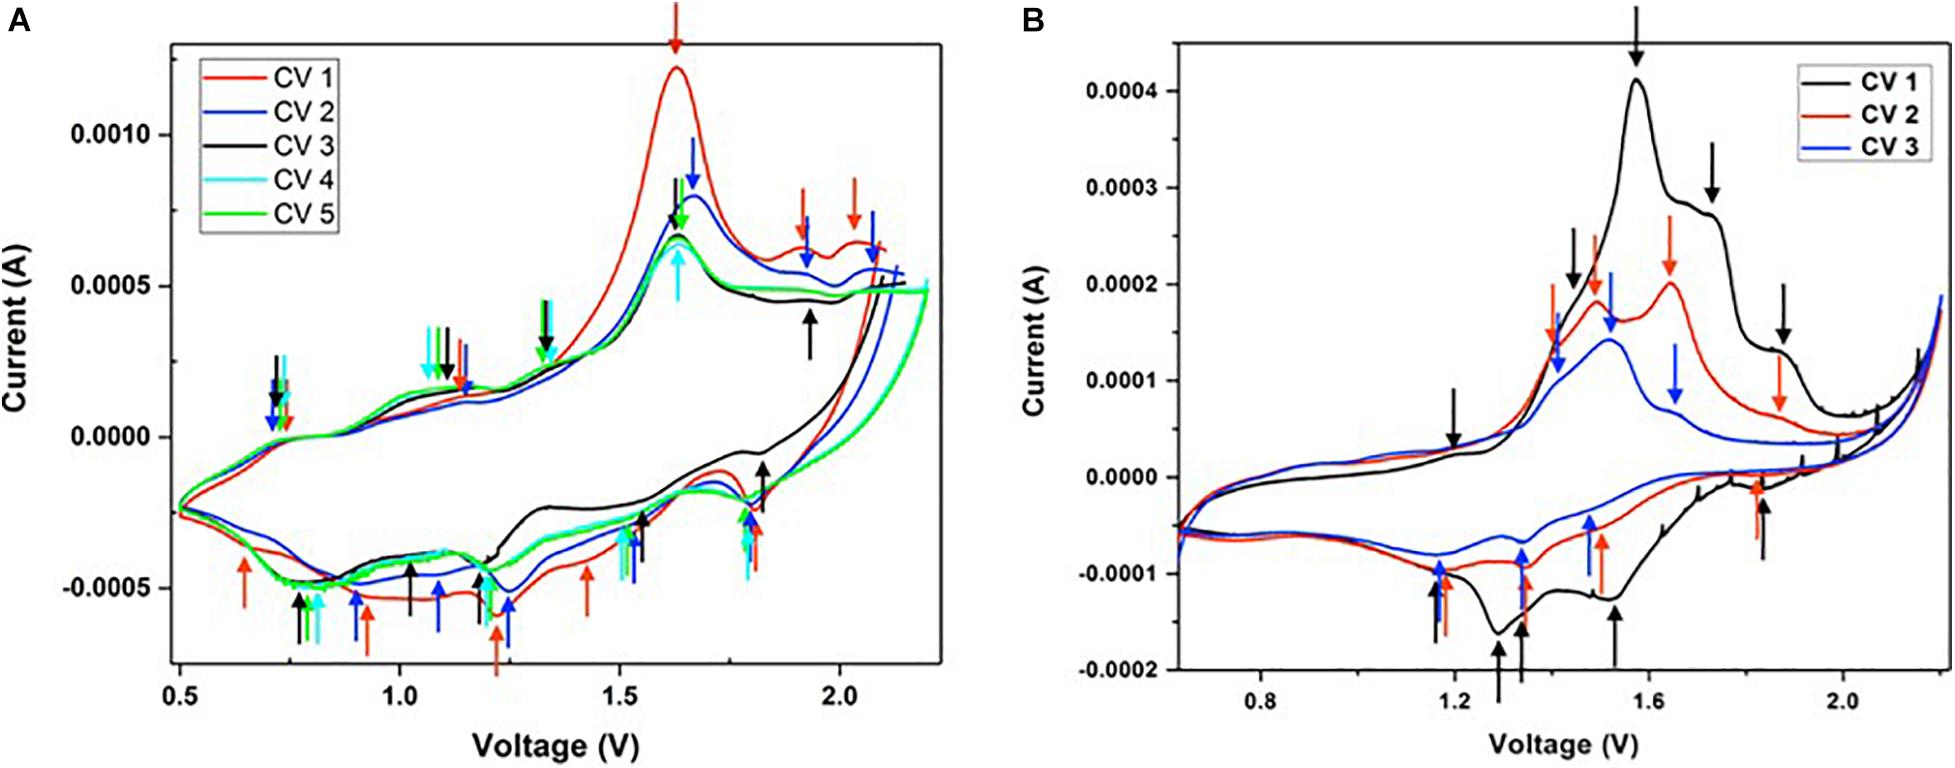
Figure 8. Cyclic voltammograms of (A) VOP1 and (B) VOP2 in half-cells using Zn as reference and counter electrodes and 3 M ZnS04.7H20 as electrolyte at 1 mV/s.
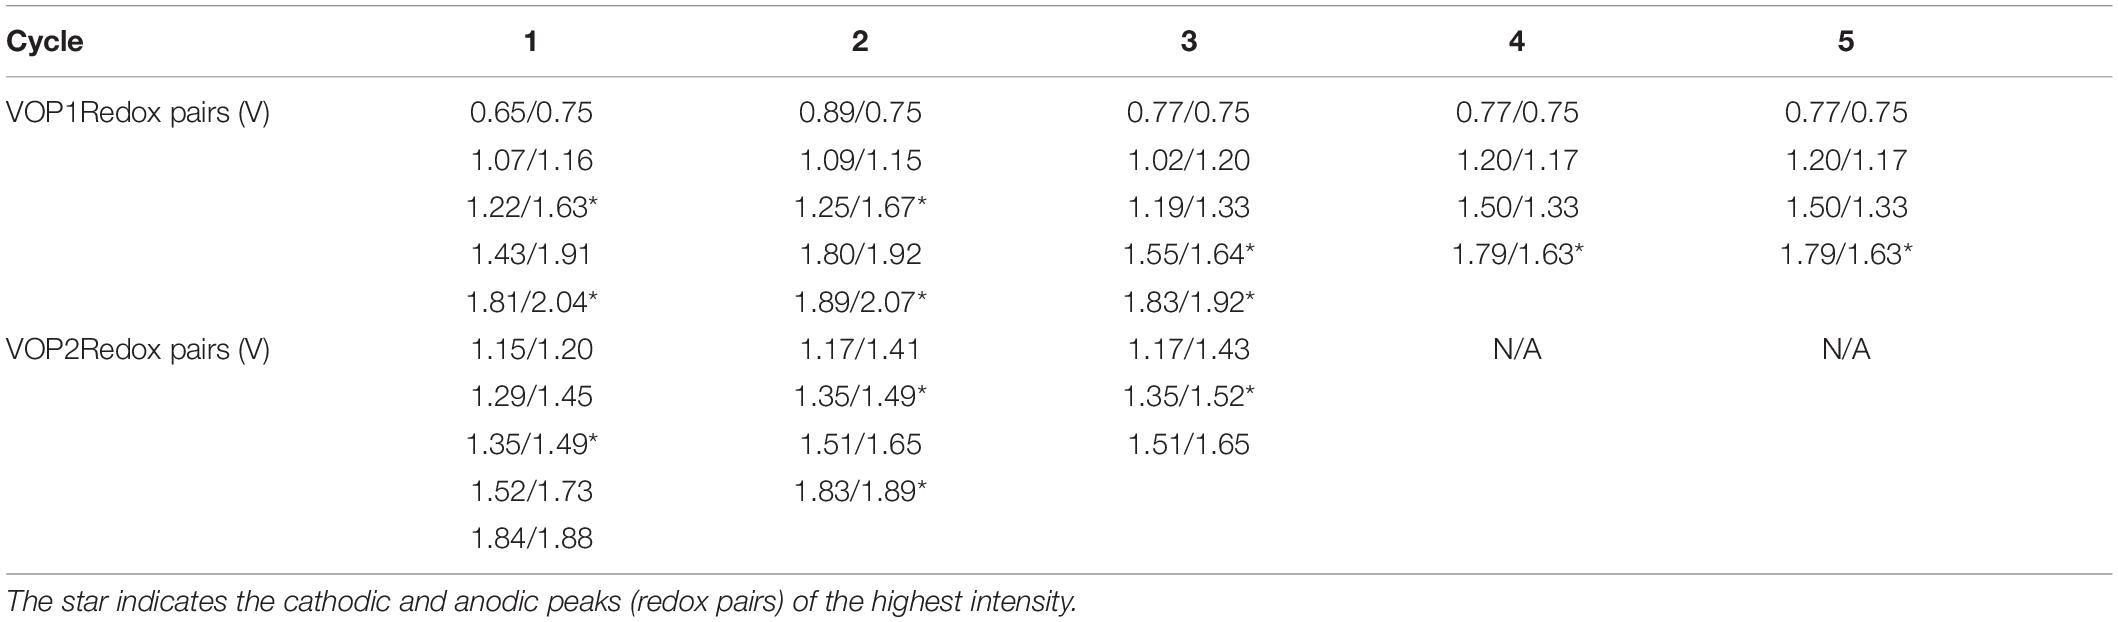
Table 1. Summarized redox pairs of VOP1 in 5 cycles and VOP2 in 3 cycles.
Based on these observations, the redox reactions are highly reversible for both VOP1 and VOP2, as the same number of cathodic and anodic peaks were present for each cycle. Furthermore, the matching peak positions and intensity observed between cycles 3 to 5 in VOP1 indicates higher reproducibility than VOP2. The intercalation/deintercalation of Zn2+ ions into/from the interlayer space is represented by the cathodic and anodic peaks (redox pairs) of highest intensity in VOP1 and VOP2, marked by (∗) in Table 1. According to literature, oxygen redox pair occur at 1.82/2.02 V, higher than vanadium redox pairs occurring at 1.20/1.50, 1.34/1.59, and 1.53/1.71 V (Wan et al., 2019). The reported value of oxygen redox pair matches well with the last peak of VOP1 in cycle 1–3 and VOP2 in cycle 1–2, marked by (∗) in Table 1. Other redox pairs in VOP1 and VOP2 correspond to the redox reactions of vanadium cation.
The kinetics of Zn/VOP batteries were analyzed using cyclic voltammetry characterizations. Specifically, Zn/VOP2 battery has been subjected to cyclic voltammetry tests at varied scan rates, from 0.25 to 2 mVs–1 between 0.6 and 2.2 V. The voltammograms in Figure 9A show that two pairs of redox peaks are present at each scan rate. Peaks 1 and 2 are anodic peaks, whilst peaks 3 and 4 are cathodic peaks. The capacitive contribution was determined by plotting the logarithmic values of peak current against scan rate (Figure 9B), based on the following formula (Lindström et al., 1997):
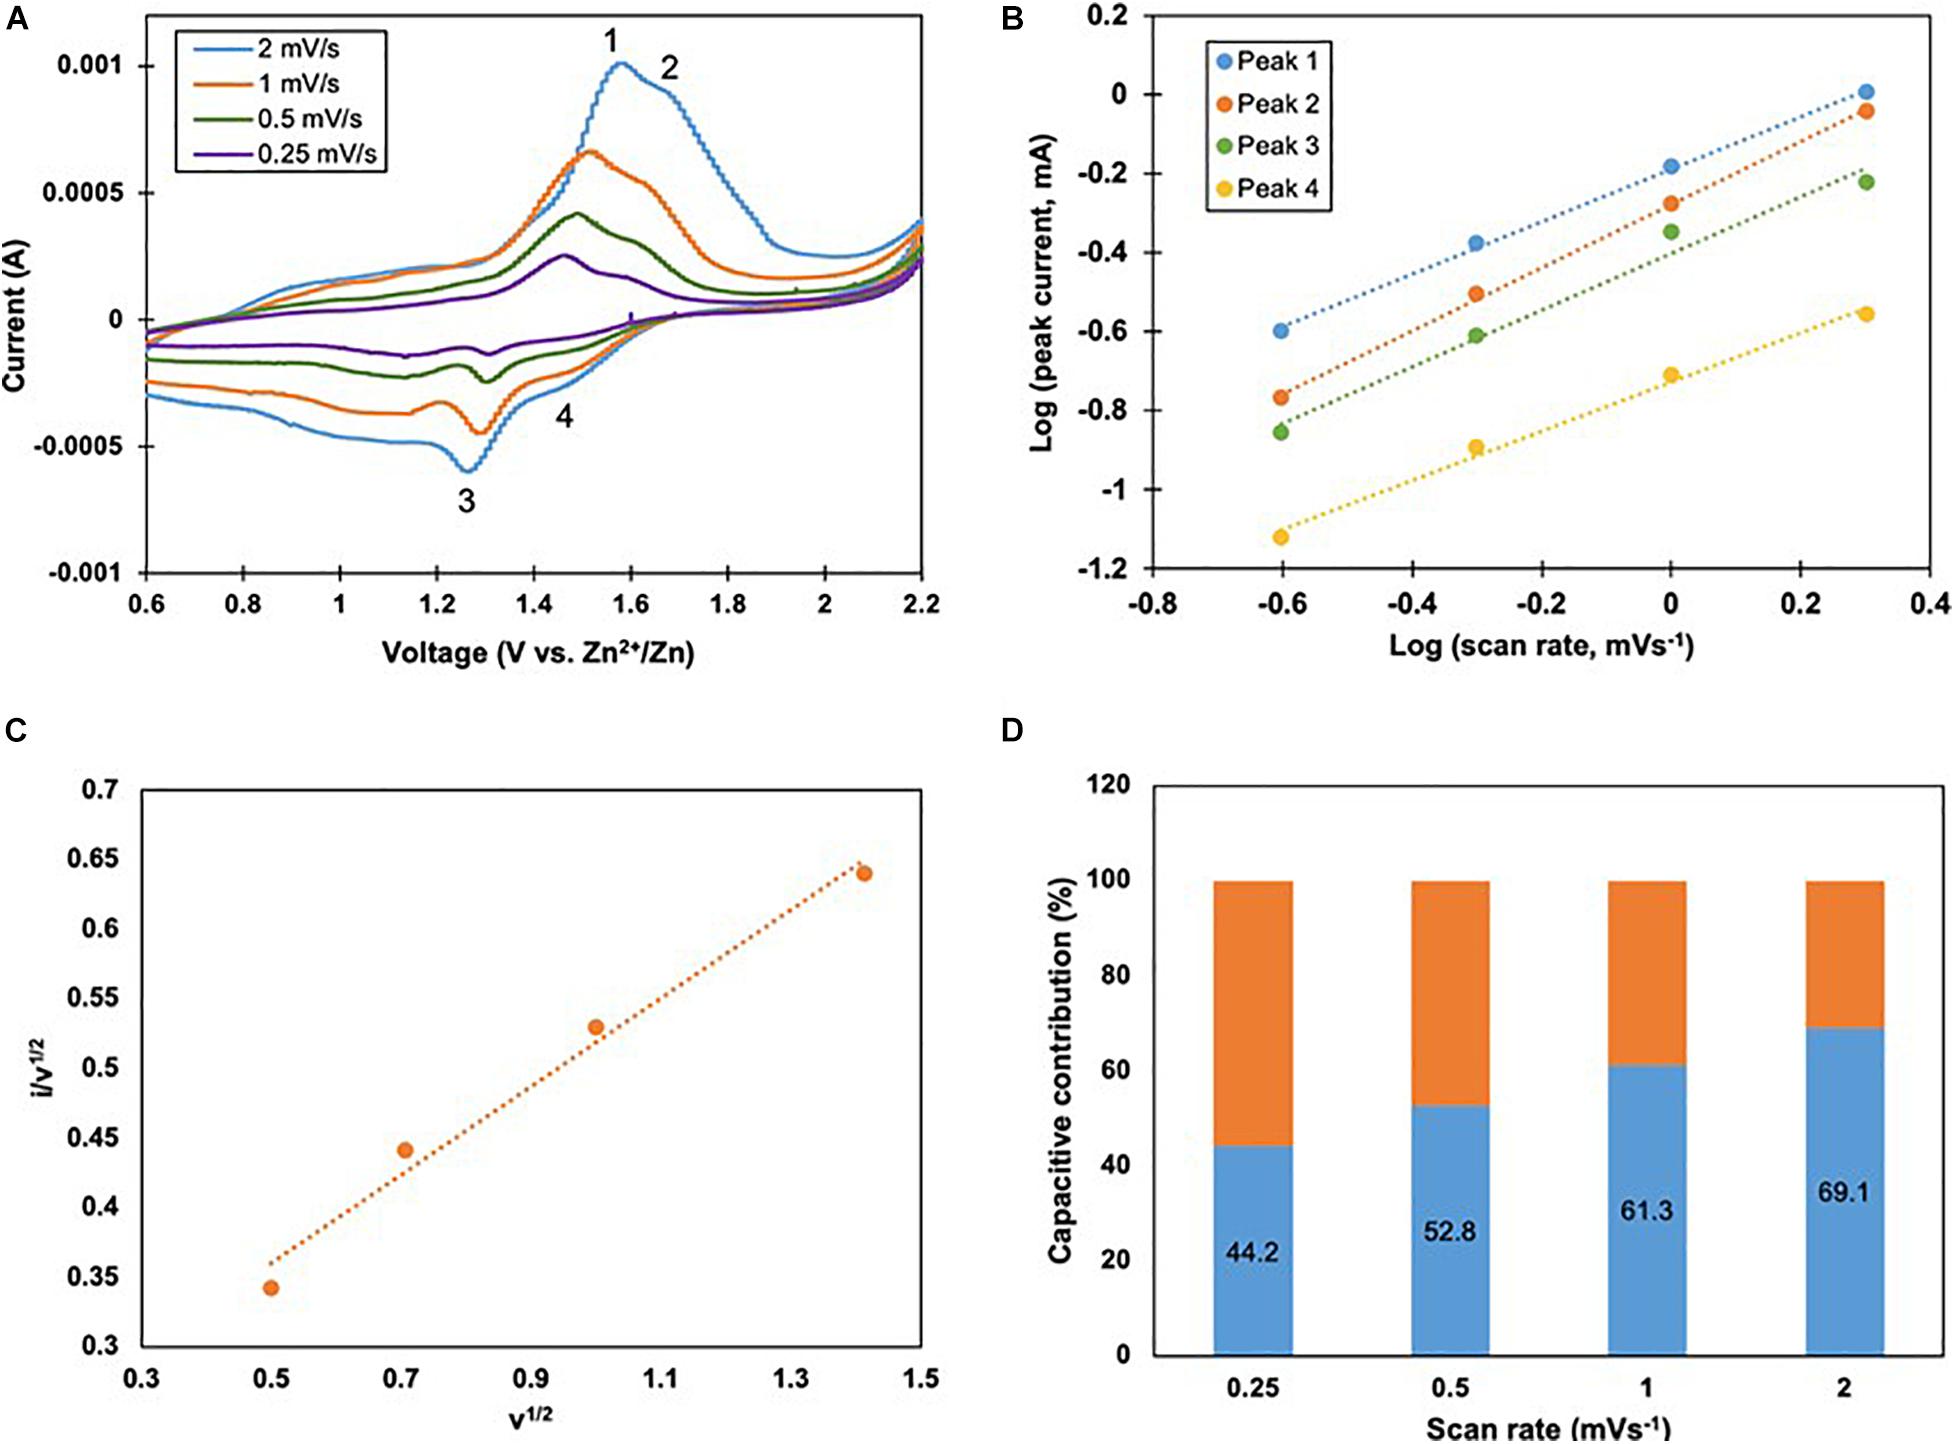
Figure 9. Kinetic analysis of Zn2+ storage in VOP2, (A) Cyclic voltammograms at different scan rates, (B) Logarithmic plots of peak current against scan rate of each peak, (C) Plot of i/v1/2 vs v1/2 for peak 2. (D) Capacitive contributions at 0.25 to 2 mVs1 {blue region).
where i is current, v is scan rate, and a and b are adjustable parameters. The same formula can be rewritten as follows:
The corresponding slopes, b, range between 0.5 and 1. A slope value of 0.5 indicates a diffusion-controlled charge/discharge process, whilst a value of 1 fully represents pseudocapacitance. The slopes for peaks 1, 2, 3, and 4 are 0.66, 0.80, 0.72, and 0.62, respectively. This indicates that Zn/VOP2 battery is controlled by ionic diffusion and pseudocapacitance alternatingly. Using Dunn’s method and the following formula,
where the product of k1 and v represents capacitive current and that of k2 and v1/2 represents diffusion-controlled current. The plot of i/v1/2 against v1/2 gives k1 as the slope and k2 as the y-intercept. In Figure 9C, the current value of peak 2 was used, which provided the slope and intercept values of 0.32 and 0.20, respectively. The percentage of capacitive contribution in Zn/VOP2 battery at different scan rates is displayed as the blue regions in Figure 9D, whilst the remaining orange regions represent the contribution of diffusion-controlled process. It is evident that the capacitive contribution increased from 44.2 to 69.1% as the scan rate increased from 0.25 to 2 mVs–1, indicating favorable kinetics in Zn/VOP2 battery.
Galvanostatic Charge-Discharge
Galvanostatic Charge-Discharge was performed at a current density of 0.1 A/g. According to the GCD curves of VOP1 in Figure 10A, the charge-discharge curves representing each cycle are concentrated within a narrower range, between 44 and 50 mAh/g, compared to that of VOP2. Although VOP2 is capable of reaching a higher specific capacity of 80 mAh/g during charging, its behavior during charge and discharge is unfavorable due to lower stability during 20 cycles. As shown in Figure 10B, the GCD curves in VOP2 are more spread out, with specific capacities ranging from 25 to 66 mAh/g (discharge) and up to 80 mAh/g (charge). Therefore, VOP1 is more stable than VOP2 in terms of charge and discharge ability. Plateaus observed in GCD for both compounds are located in the same position (voltage) as the peaks observed in their respective cyclic voltammograms. In particular, the charge-discharge curve of VOP2 shows 5 distinct plateaus in the first cycle, corresponding to the 5 redox peaks in CV.
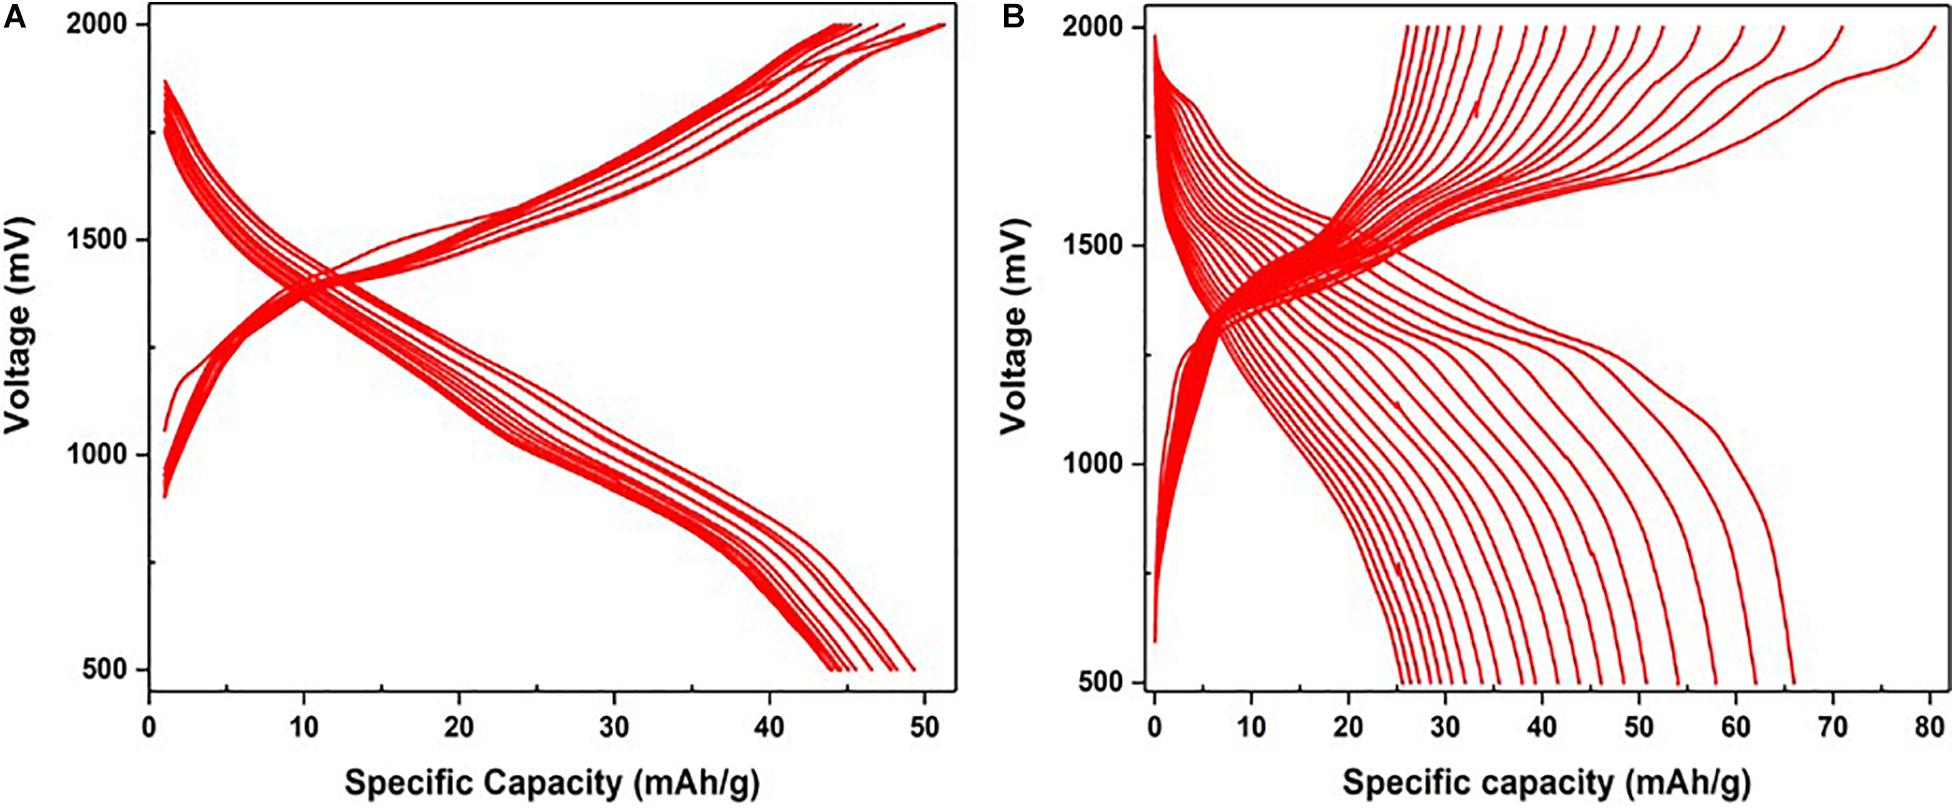
Figure 10. Galvanostatic charge-discharge curves at 160 mA/g of (A) VOP1 and (B) VOP2 in half-cells using Zn as reference and counter electrodes and 3 M ZnSO4.7H20 as electrolyte.
Cycling Performance
The specific capacity during charge and discharge of VOP1 (Figure 11A) indicates that the initial specific capacities of 50 mAh/g (charge) and 65 mAh/g (discharge) were achieved. A noticeable decrease in specific capacity was observed from cycle 1 to 2, followed by a slight decrease from 2 to 5. By cycle 6, the capacity stabilized at approximately 40 mAh/g. The coulombic efficiency remained relatively stable between 96 and 100% throughout the 12 cycles, except for a slight dip in cycle 3. However, the specific capacities of VOP2 during charge and discharge (Figure 11B) was initially about 80 mAh/g (charge) and 85 mAh/g (discharge), then decreased continuously to approximately 25 mAh/g in the last cycle, indicating a lower stability compared to VOP1. The coulombic efficiencies in VOP2 ranged from approximately 87 to 98% in 20 cycles, with slight fluctuations throughout. The apparent stability of VOP1 indicates higher reversibility compared to VOP2. Observations from the specific capacity and coulombic efficiency plots reflect those from the CV and GCD curves, in terms of each compound’s stability and reversibility. Figure 11C shows rate performance of both VOP1 and VOP2 in the range of current density 0.1–1.0 A/g. It confirms the excellent robust structure of VOP1 compared to VOP2 in terms of rate performance.
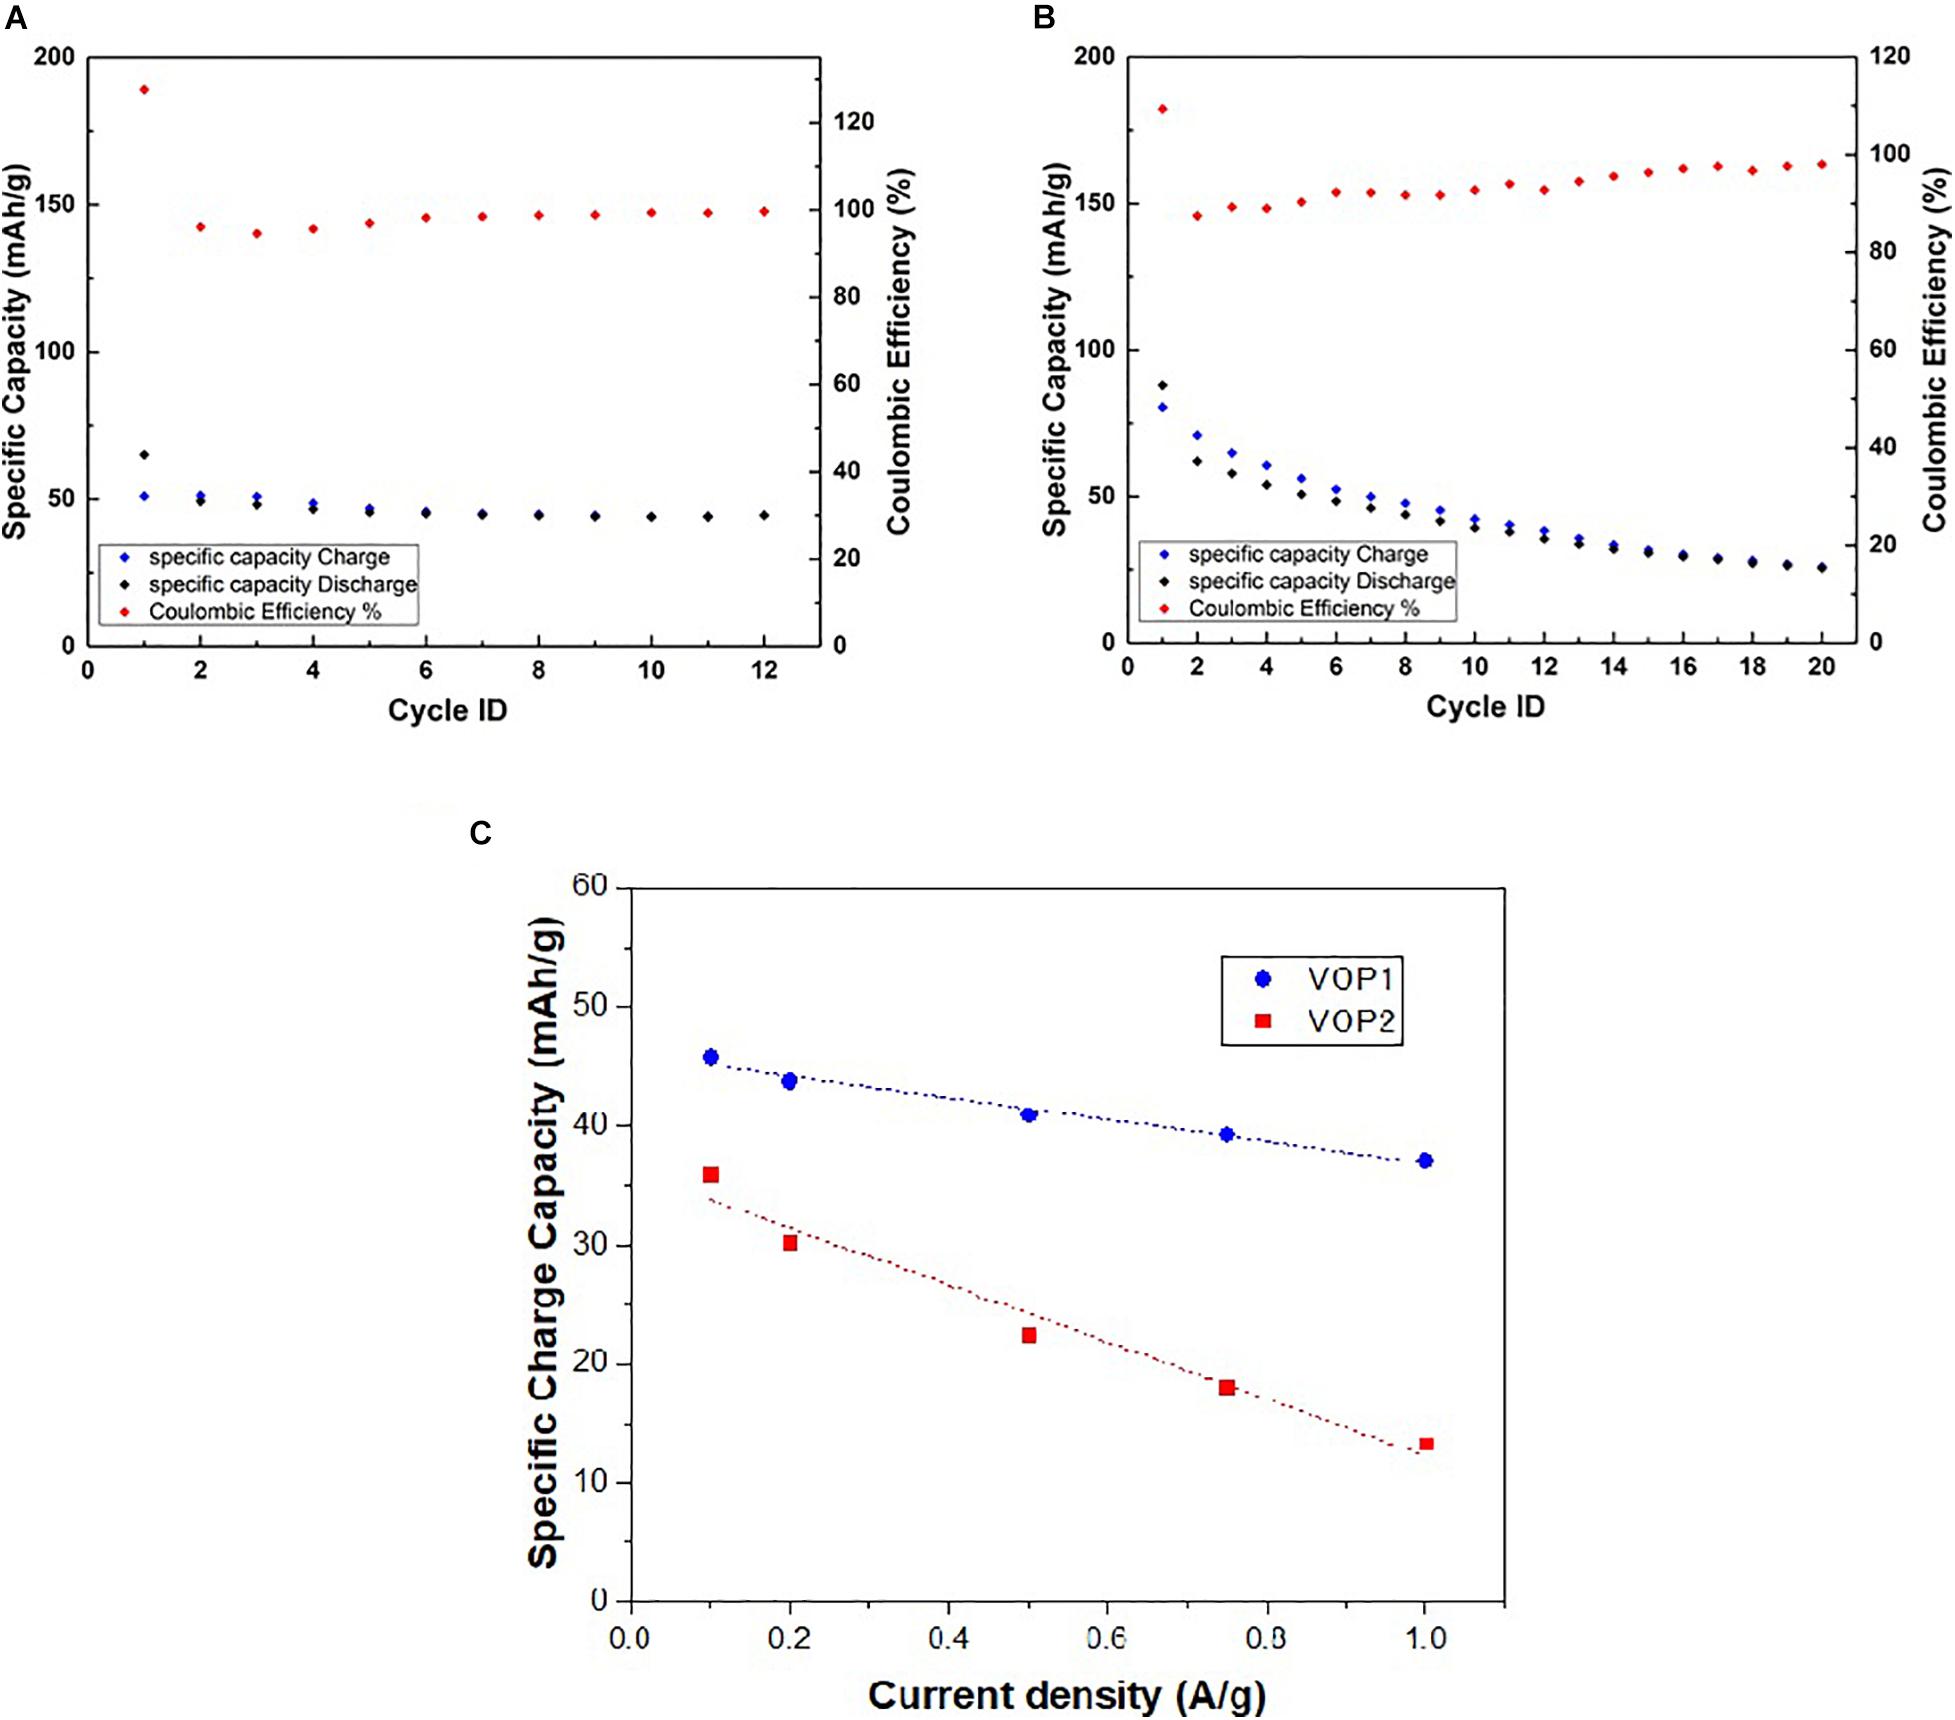
Figure 11. Specific capacity and coulombic efficiency measurements at 160 mA/g of (A) VOP1 and (B) VOP2, (C) rate performance of VOP1 and VOP2 in half-cells using Zn as reference and counter electrodes and 3 M ZnS04.7H2O as electrolyte.
Conclusion
In this work, we have studied the effect of vanadium source on the morphology of the products and we have found that different vanadium sources result in the formation of different VOP compounds. The hydrothermal reaction of H3PO4 with NH4VO3 has led to the synthesis of [H0.6(VO)3(PO4)3(H2O)3].4H2O (VOP1), whilst the reaction with V2O5 formed VOPO4.2H2O (VOP2), as confirmed by various characterization techniques. Characterization techniques such as XRD, Raman spectroscopy, TGA, DSC, SEM, EDS, and TEM were conducted. On one hand, X-ray diffraction analysis revealed that the most prominent peaks matched well with [H0.6(VO)3(PO4)3(H2O)3].4H2O in literature and correspond to one phase, indicating that VOP1 is of high purity. On the other hand, the synthesis of VOPO4.2H2O involved the formation of undesired products, such as VOPO4 and VOHPO4.2H2O, with a significant amount of excess V2O5 still present in the product. Layered structures were confirmed for both synthesized materials through SEM. CV and GCD measurements showed that VOP1 is significantly more stable with higher reproducibility than VOP2. Furthermore, Zn/VOP1 initially achieved 96% coulombic efficiency and steadily increased to 100%, whilst Zn/VOP2 had slight fluctuations throughout the cycles and attained 98% coulombic efficiency. Therefore, Zn/VOP1 has higher reversibility than Zn/VOP2. However, the specific capacity achieved by the combination of VOP2 cathode material and Zn in this study is significantly lower than the theoretical value (≈ 160 mAh/g) for VOPO4.2H2O. The hydrothermal synthesis of [H0.6(VO)3(PO4)3(H2O)3].4H2O from NH4VO3 has not been reported in literature, at least to the extent of our knowledge. Further research is needed to study the morphology of the hydrated complex and investigate its potential use as a cathode material in ZIBs.
Data Availability Statement
The raw data supporting the conclusions of this article will be made available by the authors, without undue reservation.
Author Contributions
YL: investigation, formal analysis, data curation, writing–original draft preparation. NB: conceptualization, methodology, resources, supervision, validation, visualization, writing–reviewing and editing. Both authors contributed to the article and approved the submitted version.
Conflict of Interest
The authors declare that the research was conducted in the absence of any commercial or financial relationships that could be construed as a potential conflict of interest.
Acknowledgments
We wish to acknowledge the analysis provided by the Central Laboratories Unit (CLU) and Center for Advanced Materials (CAM) at Qatar University. Many thanks to the Department of Chemistry and Earth Sciences for this research opportunity and the useful workshops provided to help us in our research project.
References
Alfaruqi, M. H., Mathew, V., Song, J., Kim, S., Islam, S., Pham, D. T., et al. (2017). Electrochemical Zinc intercalation in lithium vanadium oxide: a high-capacity zinc-ion battery cathode. Chem. Mater. 29, 1684–1694. doi: 10.1021/acs.chemmater.6b05092
Bartley, J. K., Ellison, I. J., Delimitis, A., Kiely, C. J., Isfahani, A.-Z., Rhodes, C., et al. (2001). Comparison of vanadium phosphate catalysts derived from VOPO4⋅2H2O prepared from H3PO4 and H4P2O7. Phys. Chem. Chem. Phys. 3, 4606–4613. doi: 10.1039/B105304N
Beneš, L., Černošková, E., Málek, J., Melánová, K., Patrono, P., and Zima, V. (2000). A kinetic study of the dehydration of VOPO4.2H2O by thermal methods. J. Incl. Phenom. Macrocycl. Chem. 36, 163–178. doi: 10.1023/A:1008017822000
Biswal, A., Tripathy, B. C., Subbaiah, T., Meyrick, D., and Minakshi, M. (2014). Dual effect of anionic surfactants in the electrodeposited MnO2 trafficking redox ions for energy storage. J. Electrochem. Soc. 162, A30–A38. doi: 10.1149/2.0191501jes
Deng, Y.-P., Liang, R., Jiang, G., Jiang, Y., Yu, A., and Chen, Z. (2020). The current state of aqueous zn-based rechargeable batteries. ACS Energy Lett. 5, 1665–1675. doi: 10.1021/acsenergylett.0c00502
Griesel, L., Bartley, J. K., Wells, R. P. K., and Hutchings, G. J. (2004). Preparation of vanadium phosphate catalysts from VOPO4⋅2H2O: effect of VOPO4⋅2H2O preparation on catalyst performance. J. Mol. Catal. A Chem. 220, 113–119. doi: 10.1016/j.molcata.2004.02.027
Konarov, A., Voronina, N., Jo, J. H., Bakenov, Z., Sun, Y.-K., and Myung, S.-T. (2018). Present and future perspective on electrode materials for rechargeable zinc-ion batteries. ACS Energy Lett. 3, 2620–2640. doi: 10.1021/acsenergylett.8b01552
Kundu, D., Adams, B. D., Duffort, V., Vajargah, S. H., and Nazar, L. F. (2016). A high-capacity and long-life aqueous rechargeable zinc battery using a metal oxide intercalation cathode. Nat. Energy 1:16119. doi: 10.1038/nenergy.2016.119
Kundu, D., Hosseini Vajargah, S., Wan, L., Adams, B., Prendergast, D., and Nazar, L. F. (2018). Aqueous vs. nonaqueous Zn-ion batteries: consequences of the desolvation penalty at the interface. Energy Environ. Sci. 11, 881–892. doi: 10.1039/C8EE00378E
Lindström, H., Södergren, S., Solbrand, A., Rensmo, H., Hjelm, J., Hagfeldt, A., et al. (1997). Li+ ion insertion in TiO2 (Anatase). 2. voltammetry on nanoporous films. J. Phys. Chem. B 101, 7717–7722. doi: 10.1021/jp970490q
Liu, Q., Su, X., Lei, D., Qin, Y., Wen, J., Guo, F., et al. (2018). Approaching the capacity limit of lithium cobalt oxide in lithium ion batteries via lanthanum and aluminium doping. Nat. Energy 3, 936–943. doi: 10.1038/s41560-018-0180-6
Manickam, M., Singh, P., Issa, T. B., Thurgate, S., and De Marco, R. (2004). Lithium insertion into manganese dioxide electrode in MnO2/Zn aqueous battery: part I. A preliminary study. J. Power Sources 130, 254–259. doi: 10.1016/j.jpowsour.2003.12.018
Minakshi, M., and Singh, P. (2012). Synergistic effect of additives on electrochemical properties of MnO 2 cathode in aqueous rechargeable batteries. J. Solid State Electrochem. 16, 1487–1492.
Minakshi, M., Singh, P., Appadoo, D., and Martin, D. E. (2011). Synthesis and characterization of olivine LiNiPO4 for aqueous rechargeable battery. Electrochim. Acta 56, 4356–4360. doi: 10.1016/j.electacta.2011.01.017
Ming, J., Guo, J., Xia, C., Wang, W., and Alshareef, H. N. (2019). Zinc-ion batteries: materials, mechanisms, and applications. Mater. Sci. Eng. R Rep. 135, 58–84. doi: 10.1016/j.mser.2018.10.002
Novák, P., and Desilvestro, J. (1993). Electrochemical Insertion of Magnesium in Metal Oxides and Sulfides from Aprotic Electrolytes. J. Electrochem. Soc. 140, 140–144. doi: 10.1149/1.2056075
Rownaghi, A. A., Taufiq-Yap, Y. H., and Rezaei, F. (2009). Solvothermal synthesis of vanadium phosphate catalysts for n-butane oxidation. Chem. Eng. J. 155, 514–522. doi: 10.1016/j.cej.2009.07.055
Sato, K., Noguchi, M., Demachi, A., Oki, N., and Endo, M. (1994). A mechanism of lithium storage in disordered carbons. Science 264, 556–558. doi: 10.1126/science.264.5158.556
Shin, J., Lee, J., Park, Y., and Choi, J. W. (2020). Aqueous zinc ion batteries: focus on zinc metal anodes. Chem. Sci. 11, 2028–2044. doi: 10.1039/D0SC00022A
Shpeizer, B. G., Ouyang, X., Heising, J. M., and Clearfield, A. (2001). Synthesis and crystal structure of a new vanadyl phosphate [H0.6(VO)3(PO4)3(H2O)3]⋅4H2O and its conversion to porous products. Chem. Mater. 13, 2288–2296. doi: 10.1021/cm0008821
Song, M., Tan, H., Chao, D., and Fan, H. J. (2018). Recent advances in zn-ion batteries. Adv. Funct. Mater. 28:1802564. doi: 10.1002/adfm.201802564
Sun, Y., Wu, C., and Xie, Y. (2009). Sonochemical synthesis of nanostructured VOPO4 ⋅ 2H2O/carbon nanotube composites with improved lithium ion battery performance. J. Nanopart. Res. 12, 417–427. doi: 10.1007/s11051-009-9626-x
Tarascon, J. M., and Armand, M. (2001). Issues and challenges facing rechargeable lithium batteries. Nature 414, 359–367. doi: 10.1038/35104644
Taufiq-Yap, Y. H., Rownaghi, A. A., Hussein, M. Z., and Irmawati, R. (2007). Preparation of vanadium phosphate catalysts from VOPO4 ⋅ 2H2O: effect of microwave irradiation on morphology and catalytic property. Catal. Lett. 119, 64–71. doi: 10.1007/s10562-007-9190-x
Tietze, H. (1981). The crystal and molecular structure of oxovanadium(V) orthophosphate dihydrate, VOPO4,2H2O. Aust. J. Chem. 34, 2035–2038.
Trchová, M., Čapková, P., Matějka, P., Melánová, K., Beneš, L., and Uhlířová, E. (1999). Intercalation of water into anhydrous vanadyl phosphate studied by the infrared and raman spectroscopies. J. Solid State Chem. 148, 197–204. doi: 10.1006/jssc.1999.8431
Verma, V., Kumar, S., Manalastas, W., Zhao, J., Chua, R., Meng, S., et al. (2019). Layered VOPO4 as a cathode material for rechargeable zinc-ion battery: effect of polypyrrole intercalation in the host and water concentration in the electrolyte. ACS Appl. Energy Mater. 2, 8667–8674. doi: 10.1021/acsaem.9b01632
Wan, F., Zhang, Y., Zhang, L., Liu, D., Wang, C., Song, L., et al. (2019). Reversible Oxygen redox chemistry in aqueous zinc-ion batteries. Angew. Chem. Int. Ed. Engl. 58, 7062–7067. doi: 10.1002/anie.201902679
Wong, Y. C., and Taufiq-Yap, Y. H. (2011). VOPO4⋅2H2O and the vanadium phosphate catalyst produced by sonochemical synthesis. Asian J. Chem. 23, 3853–3858.
Keywords: zinc ion batteries, intercalation cathodes, vanadium phosphate, hydrothermal method, specific capacity
Citation: De Luna Y and Bensalah N (2021) Synthesis, Characterization and Electrochemical Evaluation of Layered Vanadium Phosphates as Cathode Material for Aqueous Rechargeable Zn-ion Batteries. Front. Mater. 8:645915. doi: 10.3389/fmats.2021.645915
Received: 24 December 2020; Accepted: 19 April 2021;
Published: 13 May 2021.
Edited by:
Anandhavelu Sanmugam, Vel Tech High Tech Dr. Rangarajan Dr. Sakunthala Engineering College, IndiaReviewed by:
Abdelfattah Mahmoud, University of Liège, BelgiumManickam Minakshi, Murdoch University, Australia
Copyright © 2021 De Luna and Bensalah. This is an open-access article distributed under the terms of the Creative Commons Attribution License (CC BY). The use, distribution or reproduction in other forums is permitted, provided the original author(s) and the copyright owner(s) are credited and that the original publication in this journal is cited, in accordance with accepted academic practice. No use, distribution or reproduction is permitted which does not comply with these terms.
*Correspondence: Nasr Bensalah, bmFzci5iZW5zYWxhaEBxdS5lZHUucWE=