 Tomas Manik1
 Knut Marthinsen
94% of researchers rate our articles as excellent or good
Learn more about the work of our research integrity team to safeguard the quality of each article we publish.
Find out more
ORIGINAL RESEARCH article
Front. Mater. , 22 March 2021
Sec. Structural Materials
Volume 8 - 2021 | https://doi.org/10.3389/fmats.2021.636379
This article is part of the Research Topic 2021 Retrospective: Structural Materials View all 13 articles
In the present work, the deformation textures during flat profile extrusion from round billets of an AA6063 and an AA6082 aluminium alloy have been numerically modeled by coupling FEM flow simulations and crystal plasticity simulations and compared to experimentally measured textures obtained by electron back-scatter diffraction (EBSD). The AA6063 alloy was extruded at a relatively low temperature (350°C), while the AA6082 alloy, containing dispersoids that prevent recrystallization, was extruded at a higher temperature (500°C). Both alloys were water quenched at the exit of the die, to maintain the deformation texture after extrusion. In the center of the profiles, both alloys exhibit a conventional
Extrusion is an extensively used thermal–mechanical process to produce aluminium profiles for a range of applications. The properties of the profiles, for example, mechanical, fatigue, fracture, corrosion, as well as surface appearance, are strongly dependent on the underlying microstructure and texture, and the desired characteristics of these different properties may vary with applications (Ralston et al., 2010; Dumoulin et al., 2012; Donati et al., 2013). Moreover, in many cases, it is challenging to provide extruded profiles with a consistent and homogenous grain structure and texture both along the length and through the cross section of the profiles. It is, thus, of great importance to understand and be able to predict (model) how different microstructures and textures are generated and how they evolve during and after extrusion, as basis for controlling the final appearance and properties of extruded profiles (Ralston et al., 2010; Dumoulin et al., 2012; Donati et al., 2013).
The deformation texture after extrusion can be numerically predicted by coupling FEM flow simulations and crystal plasticity models. Aukrust et al. (1997) predicted the deformation texture for flat profile extrusions using the FC- and Relaxed-Constraints (RC)-Taylor model, while Perocheau and Driver (2000) made use of the RC-Taylor hypothesis and a viscoplastic constitutive law for their texture simulations. The deformation texture predictions and their through thickness variations were compared to corresponding experiments and showed reasonable qualitative agreement. At the same time, it was shown that the predictions were improved by considering the nonoctahedral slip systems for high-temperature deformations. More recently, the present authors have modeled the overall deformation texture for extruded round profiles, using the FC-Taylor model and Alamel-type models and deformation histories along different particle paths provided by FEM flow simulations, to predict the through thickness texture variations (Zhang et al., 2018b). Compared to experiments, the Alamel model gave the best predictions.
In the present work, the deformation texture evolutions of extruded flat profiles of AA6xxx aluminium alloys have been numerically investigated and discussed in view of corresponding extrusion experiments. The extrusion trials were carried out in a mini-press laboratory extrusion set-up with immediate water quenching of the profiles at the exit of the die, which made it possible to ‘freeze’ the deformation texture prior to possible spontaneous recrystallization of the profiles at the die exit. The experimentally textures were characterized by the electron back-scatter diffraction technique (EBSD) in scanning electron microscopy (SEM).
In order to model the deformation texture evolution during extrusion, FEM simulations are carried to provide the strain, strain rate, and temperature along the center particle path. The simulations serve as input to an appropriate deformation texture (crystal plasticity) model. Since this is hot deformation, a special focus is put on the effect of nonoctahedral slip and strain-rate sensitivity on the deformation texture evolution. A careful analysis of the deformation history obtained from the FEM simulations provides information on how the deformation conditions change during extrusion, from the container, through the die, and into the extruded profile, and serves as basis to interpret the as-extruded deformation textures. The novelty of the present work is partly related to the use of the Alamel grain cluster model, in addition to the FC-Taylor model, to model the deformation texture evolution during flat profile extrusion. Furthermore, the fact that both models were implemented using the regularized single crystal yield surface approach, enables any number and type of slip systems (i.e., including nonoctahedral slip), as well as accounting for strain rate sensitivity. These aspects strongly influence the predicted texture during hot deformation, like extrusion, and have in the present work been fitted to experiments with the implementation of an optimization procedure.
The alloys considered in this work, were direct chill cast, then homogenized, extruded, and finally water quenched. An AA6063 alloy (chemical composition in wt% Si 0.4; Mg 0.5; Fe 0.096; Mn 0.017; Ti 0.01; Ga 0.012; Al remaining) and an AA6082 alloy (chemical composition in wt% Si 1.0; Mg 0.7; Fe 0.17; Mn 0.5; Zn 0.01; Al remaining) were investigated. The latter alloy contains dispersoids to suppress recrystallization.
For the AA6063 alloy, billets of 22 mm length and with a 20 mm diameter were machined from the homogenized material and then extruded into rectangular flat profiles of 1.3 mm thickness and 3 mm width in a laboratory scale direct extrusion set-up. This corresponds to an extrusion ratio of 80, which is within the typical extrusion ratio range in the extrusion industry. Prior to extrusion, the container, billet, die, and ram were heated together to the desired testing temperature, which for the results presented in this study were 350°C. The extrusions were performed at a ram speed of 4.5 mm/s and with a ram stroke of 9 mm. At the exit of the die, the extruded profiles were immediately pushed into cold water, which enabled the extruded material to be below 300°C within 2 s after the end of deformation. The low extrusion temperature of 350°C was chosen to prevent possible fast static recrystallization during quenching and thus to preserve the deformed microstructure and texture after extrusion. The ram speed was chosen to provide a profile exit speed comparable to industrial practice of similar alloys. The initial microstructure showed an equiaxed grain structure with an average grain size of diameter of 90 μm. While the material contained primary particles (constituents) with an average diameter of 1.4 μm and volume fraction of about 0.4%, this alloy did not contain second-phase particles (dispersoids) to suppress recrystallization.
For comparison with another alloy, which does not easily recrystallize after deformation, even at higher extrusion temperatures, experiments were also carried out with an AA6082 alloy. In this case, round billets of 100 mm in diameter were extruded into flat bars of 10 mm thickness and 78.5 mm in width, which corresponds to an extrusion ratio of 10. The as-cast textures of both alloys were random. AA6063 and AA6082 are chosen for the present study as they are commonly used extrusion alloys.
The textures of the as-extruded profiles were obtained by EBSD in a field emission scanning electron microscope (FESEM) equipped with the TSL orientation imaging microscopy (OIM) software points. Orientation distribution functions (ODF) were employed to illustrate the textures. The experimental deformation texture of the AA6063 alloy has been presented in an earlier work, and for further experimental details, it is referred to this work (Zhang et al., 2018a).
During extrusion, each material point in the billet will go through different and complicated deformation histories, in terms of strain rate, temperature, pressure, and strain, which will vary with time and position. In order to predict the extrusion microstructure and texture, an accurate description of the deformation history in terms of these quantities is thus required. The initial step of the modeling exercise is to perform flow simulations by FEM, to provide the deformation history along relevant particle paths as output for the subsequent modeling (Aukrust et al., 1997; Zhang et al., 2015).
In the present work, a commercial FEM code HyperXtrude, assuming steady-state flow, was employed to provide the deformation history along desired path lines. Due to the symmetry of the extrusion profile and the set-up, only a quarter of the geometry was simulated. Hexahedral brick elements were used with a very fine mesh resolution in the bearing channel region, to capture the variations in the deformation field in this region with adequate accuracy. Rigid boundaries were considered for the container and the die towards the aluminium. The temperature of 350°C was specified for the container and the die. A heat transfer coefficient of 10,000 W/(m2K) was used and full sticking assumed between the aluminium and the container and between the aluminium and the die surface. In the bearing channel, on the other hand, where the experimental set-up used parallel bearings, a full-slip condition was assumed in the simulations, since it can be expected that the bearings are relieved due to die deflection during extrusion.
The Sellars–Tegart constitutive equation was used to describe the hot deformation during the extrusion (Sellars and McG. Tegart, 1972), for which the steady state effective flow stress,
where Z =
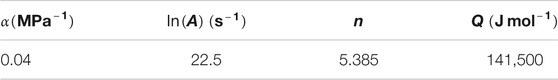
TABLE 1. Material constants of the Sellars–Tegart constitutive equation for AA6063.
The deformation history for the center path (crossing of the horizontal and vertical symmetry planes), which ends at the exit of the 3 mm long bearing channel, was exported for further analysis and texture postsimulations.
Note that, FEM simulations were not carried out for the AA6082 alloy. The AA6082 has a different chemical composition; thus, the parameters of the constituent Eq. 1, including temperature, are different. The geometrical set-up is also different with a considerable smaller extrusion ratio. For the purpose of a qualitative comparison, the deformation path of the AA6063 was applied also for the texture simulations of the AA6082. This does not justify a quantitative comparison of simulated and measured textures. However, as it turns out, the extrusion texture contains a very strong Cube component that cannot be captured even qualitatively by the models. Note that an earlier reported texture of AA6082 (Ryen et al., 2004), measured after extrusion at a similar temperature, but with a higher extrusion ratio of about 50, showed a very similar, slightly sharper texture, with an even stronger Cube component.
The same modeling approach has recently been applied for the extrusion of round profiles of the same alloy (Zhang et al., 2018b). As compared to the previous work, only the center deformation path is considered for the subsequent texture simulations in the present work.
Two different crystal plasticity models, i.e., the FC-Taylor and the advanced Lamel model (Alamel) (Van Houtte et al., 2005) have been considered in this work.
The main assumption of the FC-Taylor model is that each single crystal experiences the same deformation as the polycrystalline aggregate (Van Houtte, 1988b), which implies that the FC-Taylor model ignore grain interactions. In Alamel-type models, on the other hand, local interactions across grain boundaries are considered by relaxing the constraints on the shear strain components, while constraints are imposed on the corresponding stress component. The Alamel model considers a cluster containing a common grain boundary and the two adjunct grains or regions. In the Alamel model, the grain boundary is represented by its normal vector and the shear components related with the normal of the common grain boundary can be relaxed.
Both the FC-Taylor and the Alamel model were implemented using the regularized single crystal yield surface (Holmedal, 2020). This approach enables activation of any number and type of slip systems in a very robust way. Moreover, the exponent
As pointed out by Holmedal (2020),
In the FC-Taylor model, elastic deformation is neglected, i.e., the velocity gradient
by the Newton–Raphson method with line search (Scherzinger, 2017).
where
In the Alamel model, in order to solve the plastic slip in the cluster, the nonlinear system given in Eq. 4 is solved simultaneously for both grains. In addition, these are coupled by two nonlinear equations reading
Here,
where
Besides the octahedral slip systems
The crystal plasticity models use the deformation history provided by the FEM continuum plasticity flow simulations, notably the velocity gradient tensor
The microstructure of the AA6063 profile extruded at T = 350°C, has been presented in a previous work (Zhang et al., 2018a). The as-extruded material for this condition shows a fibrous structure, i.e., a nonrecrystallized deformation structure. The overall texture in the form the ODF, representative for the center region, is shown in Figure 1A. It is noted that the texture is quite strong, with the Cu-component 26 times random, S 30 times random, Brass 20 times random, while Cube is only 3.6 times random.
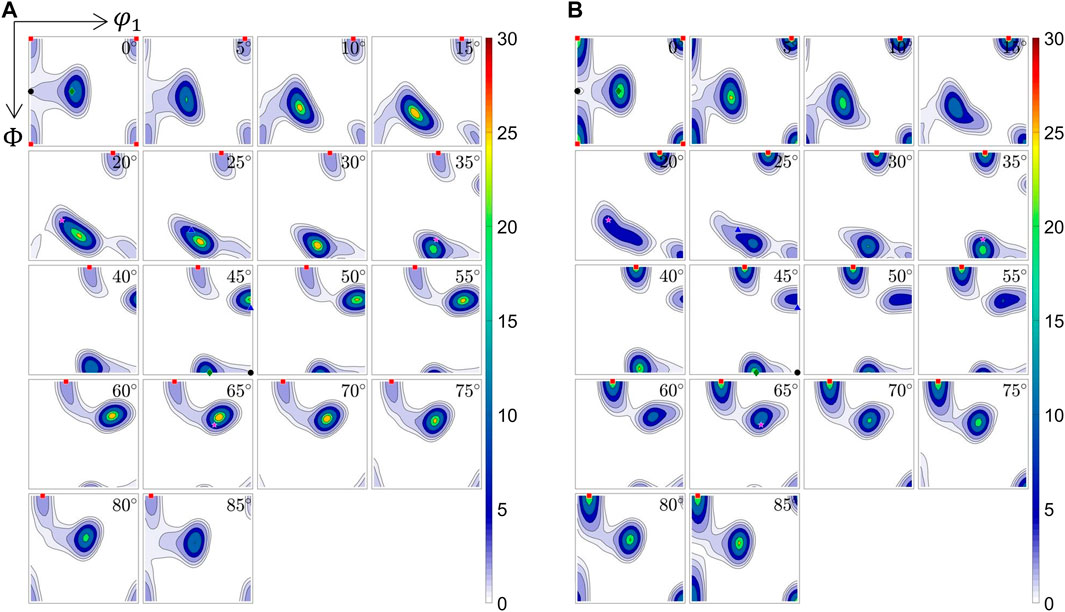
FIGURE 1. The experimental texture of the as-extruded profile in the form of ODF for the center region (A) AA6063 extruded at 350°C and (B) AA6082 extruded at 500°C.
For comparison, the deformation texture of the AA6082 alloy extruded at 500°C has also been recorded (Figure 1B). Also, this alloy, even at this high extrusion temperature, is in a fibrous, nonrecrystallized state after extrusion, and can as such be compared with the AA6063 alloy extruded at 350°C. Although different chemical compositions and extrusion ratios, the most important difference in this context is the extrusion temperature. The intensities of the main texture components are listed in Table 2. It is interesting to note that the texture is quite different, with the most notable difference the much stronger Cube (intensity 25). The relative intensities for the Copper, S, and Brass are also clearly different.
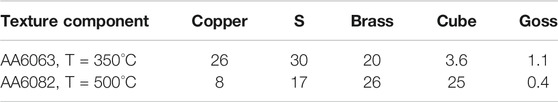
TABLE 2. Intensity of the beta-fiber texture components and Cube texture in the AA6063 and AA6082 alloys extruded at different temperatures.
The deformation microstructure is characterized by its deformation substructure and associated texture. As already mentioned, coupled FEM simulations and crystal plasticity (CP) modeling has recently successfully been performed to provide texture predictions comparable to the experiments (Zhang et al., 2015; Zhang et al., 2018b). In principle, any CP model can be used, nonetheless advanced CP models such as Alamel-type models have shown to perform better than the FC-Taylor model in predicting the deformation texture. The initial texture and the velocity gradient
The deformation characteristics can be analyzed by means of the FEM flow simulations, using the same method developed by (Zhang et al., 2018b). Evolution of the strain rate along the center path is illustrated in Figure 2. It follows from Figure 2 that the accumulated strain increases slowly far from the die inlet. At
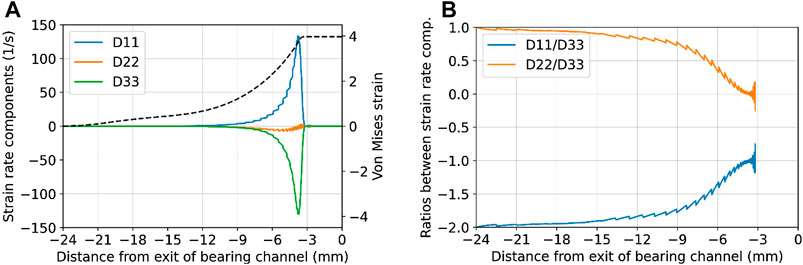
FIGURE 2. Deformation mode analysis for the center deformation path; (A) plot of components of the deformation rate tensor; (B) ratios between these components.
With the definitions 1 = ED (extrusion direction), 2 = TD (transverse direction), and 3 = ND (normal direction, we have for uniaxial tension/compression
while for plane strain compression,
From Figure 2, we clearly see that the flow changes from uniaxial tension in the container, to plane strain compression as one approach the bearings.
It is well known that during uniaxial tension of fcc alloys, a double
The deformation texture was predicted by coupled FEM and CP modeling. Two different CP rate-insensitive models have been considered in this work, i.e., the FC-Taylor and the Alamel model. A description of both these models can be found in Mánik and Holmedal (2013); Mánik and Holmedal (2014) and Zhang et al. (2015). The FC-Taylor model ignores any grain interactions, whereas the Alamel model assumes grain interaction locally at the grain boundary by allowing relaxations of the strain constraints. Both models were formulated and implemented based on the regularized single crystal yield surface (Holmedal, 2020). This approach allows to introduce rate-sensitive behavior as well as activation of arbitrary number and type of slip systems in a robust way. In the first set of trials, only conventional octahedral slips were considered, i.e., the twelve
The texture predictions were conducted for the center path. Applying the velocity gradient and the temperature as a function of time, as predicted by the FEM simulations for the center path of the AA6063 alloy, the texture after extrusion was predicted by the CP models for this given deformation history for both alloys, in lack of detailed FEM simulations for the AA6082, as discussed above. The predicted results were processed in the MTEX toolbox in the Matlab software. When generating the ODF, the same parameters were used as for processing the experimental EBSD data.
As far as it concerns the predicted textures for the rate-insensitive variants of both the FC-Taylor and the Alamel model with only the octahedral slip, it is referred to a previous work (Zhang et al., 2018a).
Figure 3 shows the effect of the strain-rate sensitivity on the intensity of texture components obtained by the FC-Taylor (a, c) and Alamel model (b, d) with octahedral slips only. For the case of T = 350°C (Figures 3A,B), for a realistic strain-rate sensitivity expected to be between 0.1–0.2, the model predicted well Cube and Cu component intensities, while S and Brass were underpredicted, and Goss was significantly overpredicted. The too weak Brass component prediction occurred at both temperatures and is expected from Taylor type models (Mánik and Holmedal, 2014; Van Houtte, 1988a). For the case of 500°C (Figures 3C,D), the Alamel model predicted a significantly too low Cube, while the ED-rotated Cube, i.e., the Goss component, was too strong. The correct prediction of the Cube is important, because it is commonly assumed that the strong Cube, often present after recrystallization of hot deformed Al-alloys, stems from Cube already present in the deformed conditions (Daaland and Nes, 1996; Vatne et al., 1996).
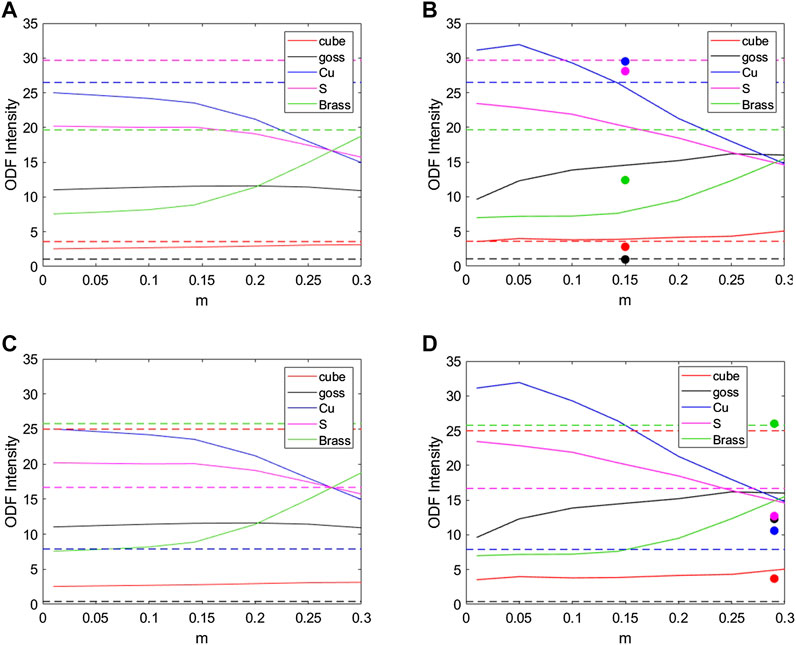
FIGURE 3. Intensities of texture components as functions of the strain-rate sensitivity. Predicted by the Alamel model by solid lines in (B) and (D), and computed by the FC-Taylor model by solid lines in (A) and (C) compared to measured values (dashed horizontal lines) for (A) and (B) T 350°C and (C) and (D) T 500°C. The filled circles in (B) and (D) indicate the results from the Alamel model with the optimal parameters including nonoctahedral slips (Table 3).
Maurice and Driver (1997a), Maurice and Driver (1997b) have shown that nonoctahedral slip may play a role at higher deformations temperatures. The deformation texture calculations are therefore made, including possible additional nonoctahedral slip systems, i.e.,
Both the strain rate sensitivity and the critical stresses of the nonoctahedral slip systems depend on the temperature. Several values have been previously suggested in the literature (Falkinger et al., 2020). Typically, the relative strengths of the nonoctahedral slips with respect to the octahedral slips are within the range of 0.75–1.5, the strain-rate sensitivity varies from 0.1 to 0.3, see e.g., (Perocheau et al., 1998; Falkinger et al., 2020).
In order to test the ability of the CP models to predict the measured textures, quantitatively at 350°C and qualitatively at 500°C, the strength of the nonoctahedral slips as well as the strain-rate sensitivity were varied by a global optimization algorithm within the given range until the best fit between the predicted and the measured texture was found. Strain-rate sensitivity variations were in the range from 0.1 to 0.4, the critical stresses of the nonoctahedral slips between 0.5 and 2, where the factor 2 represents deactivation of the given slip. The strength of the octahedral slips was fixed to unity. The particle swarm optimization algorithm in Matlab software (Mezura-Montes and Coello, 2011) was used for optimization. A brief outline of the algorithm is as follows:
1. The particle swarm algorithm begins by creating the initial particles and assigning them initial velocities.
2. It evaluates the objective function at each particle location and determines the best (lowest) function value and the best location.
3. It chooses new velocities, based on the current velocity, the particles’ individual best locations, and the best locations of their neighbors and iteratively updates the particles locations.
For the case of T = 350°C, the residual
where
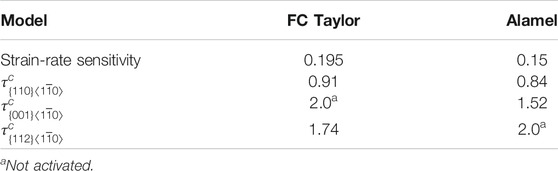
TABLE 3. Case of AA6063, T = 350°C. The best-fit relative critical resolved shear stress (CSSR) for the three nonoctahedral slip systems considered in the texture optimization for FC Taylor and Alamel, respectively.
In both models,
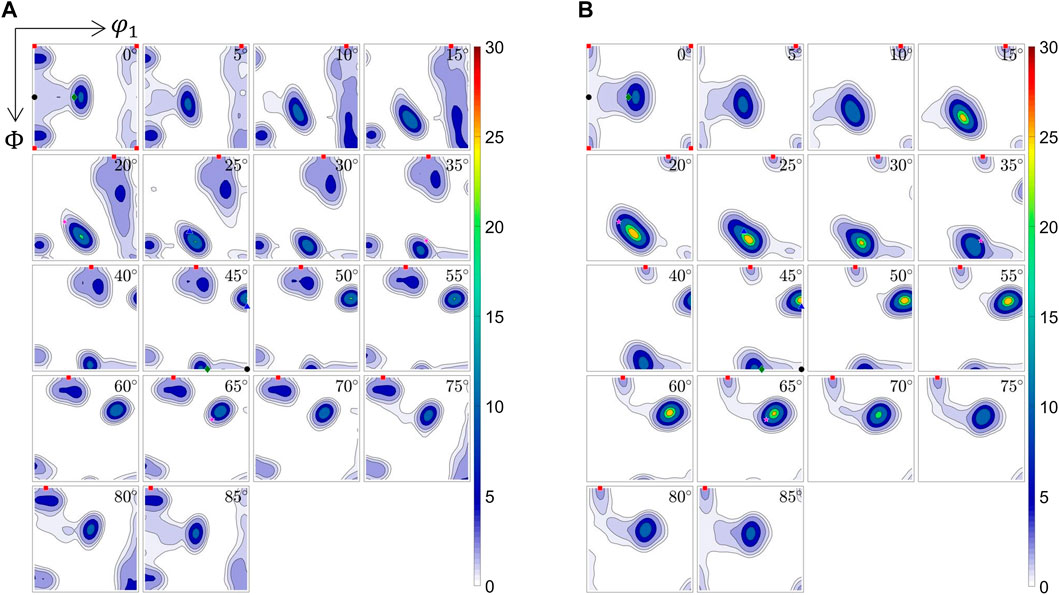
FIGURE 4. Texture predictions computed by (A) FC-Taylor and (B) Alamel models with parameters giving the best match with the experimentally measured texture for AA6063, T 350°C.
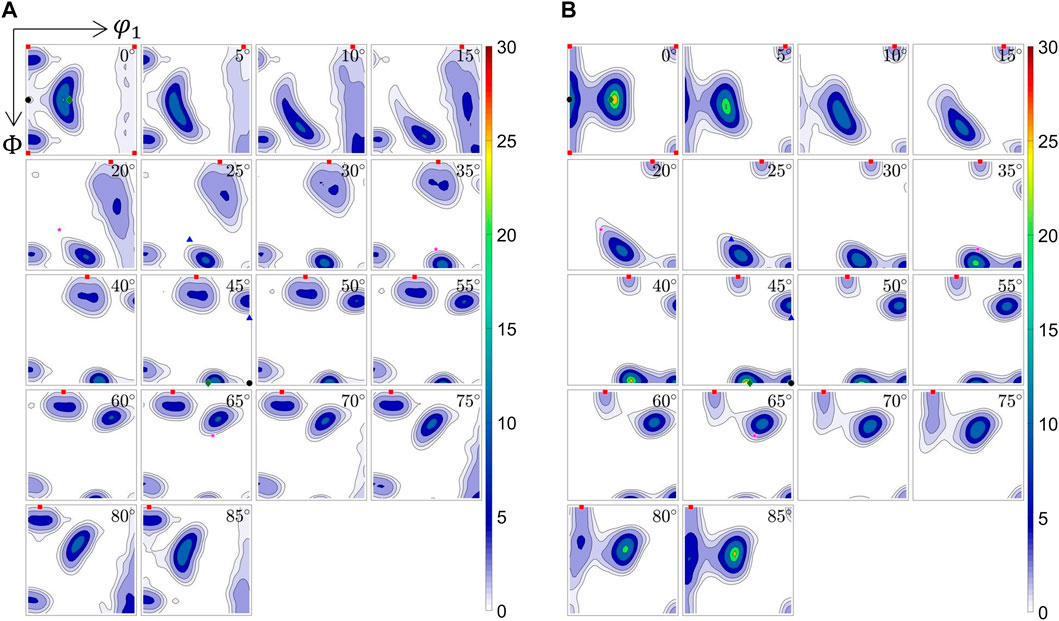
FIGURE 5. Texture predictions computed by (A) FC-Taylor and (B) Alamel models with parameters giving the best match with the experimentally measured texture for AA6082, T 500°C.
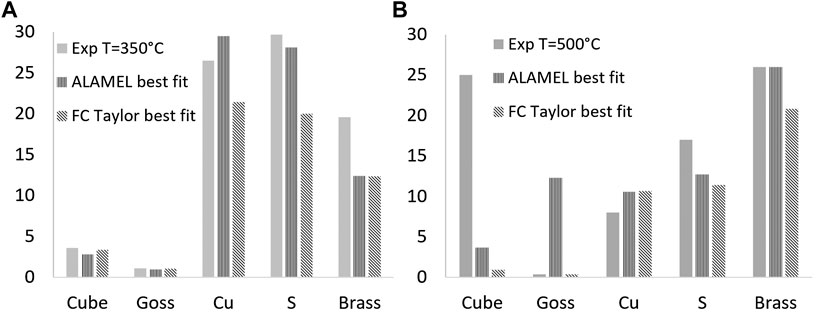
FIGURE 6. Predicted and measured texture component intensities for (A) AA6063 T 350°C, (B) AA6082 T 500°C.
Both the strain-rate sensitivity and the critical resolved shear stresses that give the best fit for both models are within physically reasonable limits. According to Table 3, slip on the
For the case of AA6082, T = 500°C (Figure 5), neither of the texture models used can predict as high content of the Cube component as measured (intensity 25) (Figure 1B and Discussion chapter). Due to this, and because of the inaccuracy by applying the strain path from the AA6063 simulation also for the AA6082 texture simulation, the residual in the global optimization problem was instead chosen as
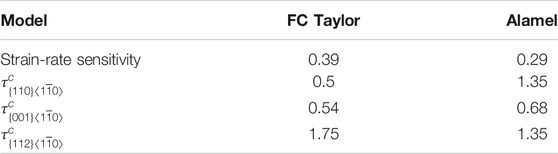
TABLE 4. Case of AA6082, T = 500°C. The best-fit relative critical resolved shear stress (CSSR) for the three nonoctahedral slip systems considered in the texture optimization for FC Taylor and Alamel, respectively.
In both models,
A reasonable fit for S, Brass, and Cu components was obtained by both models. However, none of the models was capable to predict the strong Cube component observed experimentally after extrusion at this temperature. For the Alamel model, the optimal solution for the overall ODF resulted in the strong overprediction of Goss component.
The results presented in Figure 6 show that by allowing slip on both octahedral and nonoctahedral slip systems, both FC Taylor and Alamel models were capable to model all the main components of the experimental texture after extrusion at 350°C. However, the Alamel model distinguished itself when considering the overall texture comparison. The activation of the nonoctahedral slip systems has proven to be crucial for obtaining good texture predictions. Figures 3B,D compare the Alamel model predictions for 350°C and 500°C, respectively, without considering slip on the nonoctahedral planes to the optimal solution obtained by the global optimization. The sole activation of the octahedral slip leads to strong overprediction of Goss, regardless of the strain-rate sensitivity. The effect of the activation of
1. Slip on the
2. Slip on the

FIGURE 7. Effect of the strain rate sensitivity and the activation of the non-octahedral slip systems on the texture component intensity prediction in the Alamelmodel. (A) m = 0.1, octahedral slip +
Activation of the nonoctahedral slip systems affects the other texture components than Goss to somewhat less extent. Based on this observation, the reason for the very low Goss in the measured extrusion at 350°C is probably due to the activation of the
The good overall texture fit provided by the Alamel model for 350°C was not achieved for the case of 500°C. The individual predictions for the Cu, S, and Brass components are reasonably good; however, poor predictions for Goss and Cube are obtained. At 500°C, the strain-rate sensitivity is expected to be moderately high, i.e., in the range of 0.2–0.3. Figure 7D shows that by including the
It is suspected that the large amount of Cube observed in AA6082 extruded at 500°C is not representative for the true deformation texture, but rather a result of fast recovery or early recrystallization of Cube at this high temperature.
One of the main objectives behind the use of the texture model is to study and explain the origin of Cube texture component, as its presence in the deformation texture is believed to have important influence on the recrystallization of hot deformed Al-alloys (Daaland and Nes, 1996; Vatne et al., 1996). The clue to get any Cube at all is the deformation mode characteristics of the extrusion (Figure 2). The initial dominating deformation mode is uniaxial tension producing the
Figure 8 shows texture component developments through the extrusion process, predicted by the Alamel model with parameters that give the best fit of the measured texture at 350°C. During the uniaxial tensile deformation mode, the
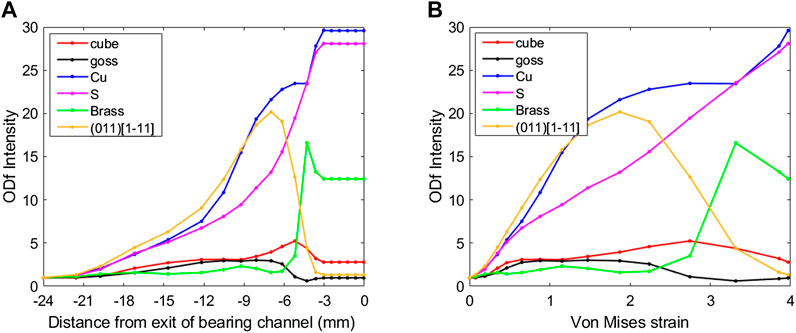
FIGURE 8. Through-extrusion texture components development prediction by the Alamel model with parameters giving the best fit to the measured texture at 350°C, plotted as a function of (A) the Von Mises strain, (B) distance from exit of bearing channel along the extrusion direction.
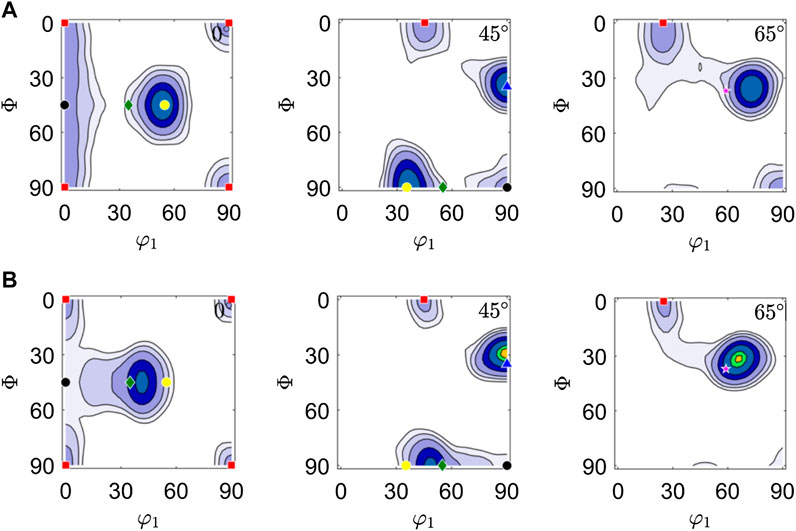
FIGURE 9. Texture predictions (A) after Von Mises strain of ∼1.5, which approximately corresponds to the transition from the uniaxial tensile mode to plane-strain compression mode; (B) at the end of the extrusion process.
In the present work, the evolution of deformation textures during flat profile extrusion of AA6xxx aluminium alloys have been investigated numerically, by coupling FEM flow simulations and crystal plasticity simulations and compared to experiments. The simulations are based on implementations of the FC-Taylor at the Alamel grain cluster model, which allow for variations in strain-rate sensitivity and the inclusion of any type and number of nonoctahedral slip systems. The numerical simulated textures are compared to the measured ones and discussed. To assess the quality of the texture predictions at 350°C and 500°C, the strength of the nonoctahedral slips as well as the strain-rate sensitivity were varied by a global optimization algorithm. At 350°C, fairly good fits were obtained both with the FC Taylor and the Alamel model, and the selected optimal parameters had reasonable values as compared to their expected physical interpretations. Nonetheless, the Alamel model provided a significantly better overall texture prediction, predicting all the major texture components with correct intensities. A reasonable, qualitative fit for S, Brass, and Cu components can also be obtained at 500°C by both models. However, none of the models are capable of predicting the strong Cube component observed experimentally after extrusion at this temperature. Both models, in particular the Alamel model, tend to predict a too strong Goss component at 500°C, while this component can be suppressed by the activation of
The raw data supporting the conclusion of this article will be made available by the authors, without undue reservation.
KZ was involved in experiments and initial texture simulations. TM was involved in texture simulations and texture optimization. AIA was involved in texture simulations. BH and KM was involved in supervision, interpretation, funding acquisition, and suggestions. KM, TM, KZ, and BH wrote the manuscript. All authors discussed the results and reviewed and edited the manuscript.
The authors declare that the research was conducted in the absence of any commercial or financial relationships that could be construed as a potential conflict of interest.
This research work has been supported by the IPN project COSMETEX (228918/O30) in Norway. The financial support by the Research Council of Norway and the industrial partner SAPA AS (Now Hydro Extruded Solutions) is gratefully acknowledged. We are grateful to Antonio Segatori, Hydro Extruded Solutions, Finspång, Sweden, for providing the extruded profiles for the texture analyses, and to Trond Aukrust, SINTEF Industry, Norway, for providing the FEM extrusion results, which are basis for the texture simulations.
Aukrust, T., Tjøtta, S., Vatne, H. E., and Van Houtte, P. (1997). Coupled FEM and texture modelling of plane strain extrusion of an aluminium alloy. Int. J. Plast. 13, 111–125. doi:10.1016/s0749-6419(97)00003-x
Daaland, O., and Nes, E. (1996). Origin of cube texture during hot rolling of commercial Al-Mn-Mg alloys. Acta Mater. 44, 1389–1411. doi:10.1016/1359-6454(95)00290-1
Donati, L., Segatori, A., El Mehtedi, M., and Tomesani, L. (2013). Grain evolution analysis and experimental validation in the extrusion of 6XXX alloys by use of a Lagrangian FE code. Int. J. Plast. 46, 70–81. doi:10.1016/j.ijplas.2012.11.008
Dumoulin, S., Engler, O., Hopperstad, O. S., and Lademo, O. G. (2012). Description of plastic anisotropy in AA6063-T6 using the crystal plasticity finite element method. Model. Simulat. Mater. Sci. Eng. 20, 20. doi:10.1088/0965-0393/20/5/055008
Falkinger, G., Simon, P., and Mitsche, S. (2020). Viscoplastic self-consistent modeling of the through-thickness texture of a hot-rolled Al-Mg-Si plate. Metall. Mater. Trans. 51, 3066–3075. doi:10.1007/s11661-020-05743-y
Hielscher, R., and Schaeben, H. (2008). A novel pole figure inversion method: specification of theMTEXalgorithm. J. Appl. Crystallogr. 41, 1024–1037. doi:10.1107/s0021889808030112
Holmedal, B. (2020). Regularized yield surfaces for crystal plasticity of metals. Crystals 10, 1076. doi:10.3390/cryst10121076
Hutchinson, J. W. (1976). Bounds and self-consistent estimates for creep of polycrystalline materials. Proc. Roy. Soc. Lond. Math. Phys. Sci. 348, 101–127.
Mánik, T., and Holmedal, B. (2013). Additional relaxations in the Alamel texture model. Mater. Sci. Eng. 580, 349–354. doi:10.1016/j.msea.2013.05.071
Mánik, T., and Holmedal, B. (2014). Review of the Taylor ambiguity and the relationship between rate-independent and rate-dependent full-constraints Taylor models. Int. J. Plast. 55, 152–181. doi:10.1016/j.ijplas.2013.10.002
Maurice, C., and Driver, J. H. (1997a). Hot rolling textures of f.c.c. metals-Part I. Experimental results on Al single and polycrystals. Acta Mater. 45, 4627–4638. doi:10.1016/s1359-6454(97)00115-8
Maurice, C., and Driver, J. H. (1997b). Hot rolling textures of f.c.c. metals-Part II. Numerical simulations. Acta Mater. 45, 4639–4649. doi:10.1016/s1359-6454(97)00117-1
Mezura-Montes, E., and Coello Coello, C. A. (2011). Constraint-handling in nature-inspired numerical optimization: past, present and future. Swarm and Evolutionary Computation. 1, 173–194. doi:10.1016/j.swevo.2011.10.001
Perocheau, F., Driver, J. H., and Aukrust, T. (1998). “A viscoplastic simulation of texture evolution during extrusion of an aluminium alloy,” in Texture and anisotropy of polycrystals. Editor R. A. Schwarzer (Aedermannsdor, Switzerland: Trans Tech Publications), 377–382.
Perocheau, F., and Driver, J. H. (2000). Texture gradient simulations for extrusion and reversible rolling of FCC metals. Int. J. Plast. 16, 73–89. doi:10.1016/s0749-6419(99)00048-0
Ralston, K. D., Birbilis, N., and Davies, C. H. J. (2010). Revealing the relationship between grain size and corrosion rate of metals. Scripta Mater. 63, 1201–1204. doi:10.1016/j.scriptamat.2010.08.035
Ryen, Ø., Holmedal, B., Li, S., Houtte, P. v., Roven, H. J., and Nes, E. (2004). “Plastic anisotropy in recrystallized and unrecrystallized extruded aluminium profiles,” in 9th international conference on aluminium alloys, August, 2004. Editors J. F. Nie, A. J. Morton, and B. C. Muddle (Brisbane, Australia: © Institute of Materials Engineering Australasia Ltd), 1004–1009.
Scherzinger, W. M. (2017). A return mapping algorithm for isotropic and anisotropic plasticity models using a line search method. Comput. Methods Appl. Mech. Eng. 317, 526–553. doi:10.1016/j.cma.2016.11.026
Sellars, C. M., and Tegart, W. J. M. (1972). Hot workability. Int. Metall. Rev. 17, 1–24. doi:10.1179/imtlr.1972.17.1.1
Sheppard, T., and Jackson, A. (1997). Constitutive equations for use in prediction of flow stress during extrusion of aluminium alloys. Mater. Sci. Technol. 13, 203–209. doi:10.1179/mst.1997.13.3.203
Van Houtte, P. (1988a). A comprehensive mathematical formulation of an extended Taylor-Bishop-hill model featuring relaxed constraints, the Renouard-Wintenberger theory and a strain rate sensitivity model. Textures Microstruct. 8, 313–350. doi:10.1155/tsm.8-9.313
Van Houtte, P. (1988b). A comprehensive mathematical formulation of an extended taylor-bishop-hill model featuring relaxed constraints, the renouard-wintenberger theory and a strain rate sensitivity model. Textures Microstruct. 8, 313–350. doi:10.1155/tsm.8-9.313
Van Houtte, P., Li, S. Y., Seefeldt, M., and Delannay, L. (2005). Deformation texture prediction: from the Taylor model to the advanced Lamel model. Int. J. Plast. 21, 589–624. doi:10.1016/j.ijplas.2004.04.011
Vatne, H. E., Furu, T., and Nes, E. (1996). Nucleation of recrystallised grains from cube bands in hot deformed commercial purity aluminium. Mater. Sci. Technol. 12, 201–210. doi:10.1179/mst.1996.12.3.201
Zhang, K., Marthinsen, K., Holmedal, B., Aukrust, T., and Segatori, A. (2015). Coupled FEM and Alamel-type polycrystal plasticity modelling applied to extrusion of aluminium alloys. Aluminium Two Thousand World Congress and International Conference on Extrusion and Benchmark ICEB 2015, Florence, Italy, 12.-15 May, 2015. Editors L. Donati and L. Tomesani. Materials Today-Proceedings 2, 4898-4903.
Zhang, K., Marthinsen, K., Holmedal, B., Aukrust, T., and Segatori, A. (2018a). “Evolution in texture and through thickness variations in Al-Mg-Si-extrusions: experiments and modelling,” in International conference on aluminium alloys (ICAA16). Montreal, Canada: Canadian Institute of Mining, Metallurgy & Petroleum, McGill University.
Zhang, K., Marthinsen, K., Holmedal, B., Aukrust, T., and Segatori, A. (2018b). Through thickness variations of deformation texture in round profile extrusions of 6063-type aluminium alloy: experiments, FEM and crystal plasticity modelling. Mater. Sci. Eng. 722, 20–29. doi:10.1016/j.msea.2018.02.081
Keywords: aluminum, extrusion, texture, crystal plasticity, modeling
Citation: Manik T, Marthinsen K, Zhang K, Aria AI and Holmedal B (2021) Deformation Texture Evolution in Flat Profile AlMgSi Extrusions: Experiments, FEM, and Crystal Plasticity Modeling. Front. Mater. 8:636379. doi: 10.3389/fmats.2021.636379
Received: 01 December 2020; Accepted: 08 January 2021;
Published: 22 March 2021.
Edited by:
Zhenggang Wu, Hunan University, ChinaCopyright © 2021 Manik, Marthinsen, Zhang, Aria and Holmedal. This is an open-access article distributed under the terms of the Creative Commons Attribution License (CC BY). The use, distribution or reproduction in other forums is permitted, provided the original author(s) and the copyright owner(s) are credited and that the original publication in this journal is cited, in accordance with accepted academic practice. No use, distribution or reproduction is permitted which does not comply with these terms.
*Correspondence: Knut Marthinsen, a251dC5tYXJ0aGluc2VuQG50bnUubm8=
Disclaimer: All claims expressed in this article are solely those of the authors and do not necessarily represent those of their affiliated organizations, or those of the publisher, the editors and the reviewers. Any product that may be evaluated in this article or claim that may be made by its manufacturer is not guaranteed or endorsed by the publisher.
Research integrity at Frontiers
Learn more about the work of our research integrity team to safeguard the quality of each article we publish.