 Yonghong Wang
 Yongfeng Huang
 Mingyi Zhang*
94% of researchers rate our articles as excellent or good
Learn more about the work of our research integrity team to safeguard the quality of each article we publish.
Find out more
ORIGINAL RESEARCH article
Front. Mater. , 30 April 2021
Sec. Smart Materials
Volume 8 - 2021 | https://doi.org/10.3389/fmats.2021.629370
This article is part of the Research Topic Advanced Sensing, Materials and Intelligent Algorithms for Multi-Domain Structural Health Monitoring View all 23 articles
The piezoresistive silicon pressure transducers based on the piezoresistive effect have demonstrated their potential in the accurate monitoring of pressure. However, their usage in the pore and earth pressure monitoring at the pile surface under hydraulic jacking has not yet been explored. In this study, two self-made model piles (one is a closed-ended pile and the other is an open-ended pile) were instrumented with piezoresistive silicon earth transducers and pore pressure transducers and then driven into the soil using a hydraulic jack. A comprehensive investigation was first carried out for the structure of the model piles, the installation procedure of the transducers, and the composition of the test system. The pore and earth pressure measurements of the transducers were used for the evaluation of the distribution of the pore pressure, excess pore pressure, radial earth pressure, and radial effective earth pressure. The model test results indicate that the piezoresistive silicon pressure transducers are suitable for monitoring the pore and earth pressure at the pile surface during jacking. In addition, the pore pressure, excess pore pressure, radial earth pressure, and effective radial earth pressure along the test piles were affected by the penetration depth and the pile end form.
With the rapid development of the economy, many high-rise and ultra high-rise buildings have been built in the cities, and the shallow foundations can no longer meet the bearing capacity and deformation requirements of these buildings. Therefore, precast piles composed of cement (Ghahari et al., 2018; Hou et al., 2018; Liang et al., 2020), sand-gravel aggregates, and steel bars have been widely used in engineering. The common method for pile installation is dynamic driving method and hydraulic jacking method. The hydraulic jacking method is a construction method that uses static pressure to drive precast piles into the soil (Kou et al., 2018). Compared to the dynamic driving method, the hydraulic jacking method has many advantages such as no noise, no vibration, fast construction speed, and little damage to the pile body (Wang et al., 2017a; Wang et al., 2019) and is very popular in many engineering fields.
However, the piles are not only subjected to complex forces during jacking but also generate excess pore pressure and radial soil pressure, adversely affecting the bearing capacity of the piles and adjacent buildings. As early as 1932, Casagrande. (1932) found that pile jacking caused clay disturbance around the pile and pointed out that the clay within a certain range around the pile was completely or largely remodeled to maximize the bearing capacity of the pile. Seed and Reese. (1957) confirmed Casagrande’s observations with piles penetration test in the field. The field test shows that the pressure generated by the pile installation is mainly transferred to the soil around the pile with increasing pore water pressure. In the subsequent studies, these findings, indicating the limitations of the hydraulic jacking method, were supported by Bjerrum. (1967) and explained by Roy et al. (1981). More recently, Mccabe and Lehane. (2006), Igoe et al. (2011), and Kou et al. (2015) confirmed the importance of monitoring and studying the mechanism of the excess pore pressure and radial earth pressure in the process of pile jacking.
As mankind enters the information age, all social activities of people are centered on information acquisition and information conversion. As an important means of information acquisition and information conversion, sensors are at the forefront of information science and the basis for informationization (Chen et al., 2020; Huang et al., 2020; Su et al., 2020). The common method to measure the pore pressure and earth pressure during the process of pile jacking is to install the pore pressure and earth pressure sensors at different depths within a certain range of the pile diameter. In 1958, Bjerrum et al. (1958) first successfully measured the pore pressure of soil around the pile through a field test. These observations, indicating that the pore pressure reaches the maximum value at the end of pile jacking and the pore pressure is related to the overburden weight, were supported by Orrje and Broms. (1967) and monitored by Airhart et al. (1969) through this measurement method. Randolph et al. (1979) and Steenfelt et al. (1981) installed the earth pressure sensors around the pile and monitored the radial earth pressure during jacking. In the subsequent studies, Pestana et al. (2002) and Li et al. (2018) successfully measured the distribution and variation of the earth pressure around the pile by this method. However, Lo and Stermac. (1965) and Jardine and Bond. (1989) found that the pore and earth pressure decreases rapidly with increasing distance from the pile and is quite different at the pile surface than that around the pile. Therefore, using the pore and earth pressure around the pile as the pore and earth pressure at the pile surface would cause an error, limiting the study of pore and earth pressure characteristics at the pile surface. There are a few reports on the monitoring of the pore and earth pressure at the pile surface (Lehane and Jardine, 1994; Liu et al., 2019), and the sensors used in the experiments are the traditional pressure sensors, which cannot meet the test requirements well. Compared to the traditional pressure sensors, the working principle, material characteristics, and manufacturing process of piezoresistive silicon pressure transducers are different. Compared with piezoresistive silicon sensors, traditional earth pressure cell and hydraulic pressure gauge have low sensitivity, narrow measurement range, low dynamic acquisition frequency, large size, and insufficient linearity stability, which makes it difficult to meet the long-term health monitoring requirements of actual projects (Vaughan and Walbancke, 1973; Lyne and Jack, 2004; Chen et al., 2019). The piezoresistive silicon pressure transducers with high sensitivity, good linearity, good stability, small size, and other advantages have been successfully used in the monitoring of structural health (Li et al., 2010; Moslehy et al., 2010), concrete strength (Dumoulin et al., 2012), microcracks formation (Xu et al., 2013; Jiang et al., 2017), and interfacial debonding (Feng et al., 2016). However, there are no reports on the use of the piezoresistive silicon pressure transducers to monitor the pore and earth pressure at the pile surface during the pile jacking in the model test.
In this study, the piezoresistive silicon pore pressure transducers and earth pressure transducers were installed in the holes of two self-made model piles: 1) open-ended pile and 2) closed-ended pile. The pore water pressure and earth pressure at the pile surface were tested during pile jacking. The distribution and variation of the pore pressures, excess pore pressure, radial earth pressure, and effective radial earth pressure at the pile surface in the process of jacking were analyzed. In addition, the effects of the pile end form on varying pore and earth pressures were considered. This study provides a reference for subsequent research on the measurement method of the pore and earth pressures at the pile surface.
The piezoresistive silicon pressure transducer works on the principle of the piezoresistive effect of monocrystalline silicon. Four equivalent semiconductor resistors are installed in a specific direction of the silicon diaphragm and connected to the Wheatstone bridge. When the diaphragm of the transducer is affected by external pressure and the Wheatstone bridge is out of balance, the output voltage proportional to the measured pressure was obtained by adding the exciting power supply to the Wheatstone bridge.
The output voltage of the bridge
where
The resistance of semiconductor resistors are equal,
where
The strain value of the semiconductor resistance is satisfied,
The piezoresistive silicon earth transducer and pore pressure transducer used in this test are made of polysilicon as the varistor and integrated using a microelectromechanical system. The resistors on the integrated silicon diaphragm of the transducer are connected by the screen-printed circuit, and the transducer is encased in the metal shell. The two transducers are different, as the end of the pore pressure transducer is installed with the permeable stone, and the water enters the transducer through the porous stone and changes the resistance of the polysilicon. Figure 1 shows the structural diagram of the piezoresistive silicon earth pressure transducer and pore pressure transducer.
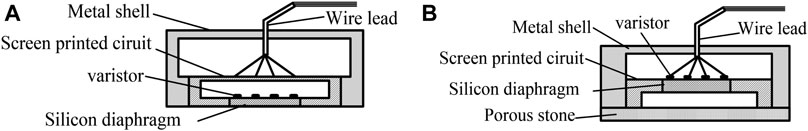
FIGURE 1. The structural diagram of the piezoresistive silicon earth and pore pressure transducer: (A) Earth pressure transducer, (B) Pore pressure transducer.
The model box used in this test has dimensions of 3,000 × 3,000 × 2000 mm3 (length × width × height) and was welded by a steel plate. The sinking process of the model pile was observed through the toughened glass window (500 × 500 mm2) installed on the front of the model box. The loading system of the model box mainly comprises a reaction frame, a crossbeam, a hydraulic jack, an electric control system, and a static load control system to provide static pressure for the model piles.
Tang et al. (2002) studied the influencing factors of pile side friction by installing strain gauges on the aluminum pile body. Duan. (2016) simulated the force characteristics of the pile foundation of the marine wind turbine under the vertical load using the aluminum pile indoor test and compared the results with the numerical simulation results. The research of the above scholars shows the feasibility of the indoor model test of the aluminum pile to analyze the pile foundation. In this article, the parameters of the model pile are determined according to the similarity theory (Chui, 1990; Yang, 2005), and the calculation process is as follows:
1) Geometric similarity ratio
There is a certain relationship between the size and shape of the model and the prototype. The geometric similarity is one of the important indicators to ensure that the model test has a certain practical significance. The geometric similarity is shown in Eq. 1.
where
2) Similar modulus of elasticity
where
3) Load similarity ratio
where
It is very difficult to fully satisfy the similarity theorem when conducting model tests. Approximate similarity methods appear. The approximate similarity method only retains the similarity conditions of the main factors that affect the test results so as to obtain sufficiently accurate similarity (Liu, 2015).
Generally, the pile diameter of a large diameter single pile is 3–6 m, and the pile length is 30–50 m (Yu et al., 2016). Based on the prototype pile length of 40 m, pile diameter of 5.6 m, elastic modulus of 210 GPa, and Poisson’s ratio of 0.3, in order to meet the load similarity ratio, the geometric similarity ratio is determined to be 40 and the elastic modulus similarity ratio is 2.9. The similarity ratio of the loose ratio is 1, and the test piles are made of aluminum material, the elastic modulus is 72 GPa, the Poisson's ratio is 0.3, and the diameter and length are 140 and 1,000 mm for aluminum pipe piles TP1 and TP2, respectively. The thickness of the inner and outer tube of the model pipe piles is 3 mm. In order to facilitate the installation of the transducers, the gap between the inner and outer tubes is 20 mm. The model pile TP1 is a closed-ended pipe pile, and TP2 is an open-ended pipe pile. The model pile parameters are listed in Table 1.

TABLE 1. Model pipe pile parameter.
The piezoresistive silicon earth pressure transducers and pore pressure transducers were installed on the same cross-section in the model pile body. The excess pore water pressure at the pile-soil interface caused by pile sinking increases linearly with the depth of soil penetration. The average growth gradient of the excess pore water pressure near the bottom of the pile is greater than that of the middle and top of the pile. Therefore, the sensor is arranged with a sparse upper part and a dense lower part. The transducer distances from the pile end are 50, 100, 200, 400, 600, and 900 mm, and the installation location numbers of the transducer from the pile end to the pile top are 1# to 6#. Figure 2 shows the model piles structure and transducers mounting location.
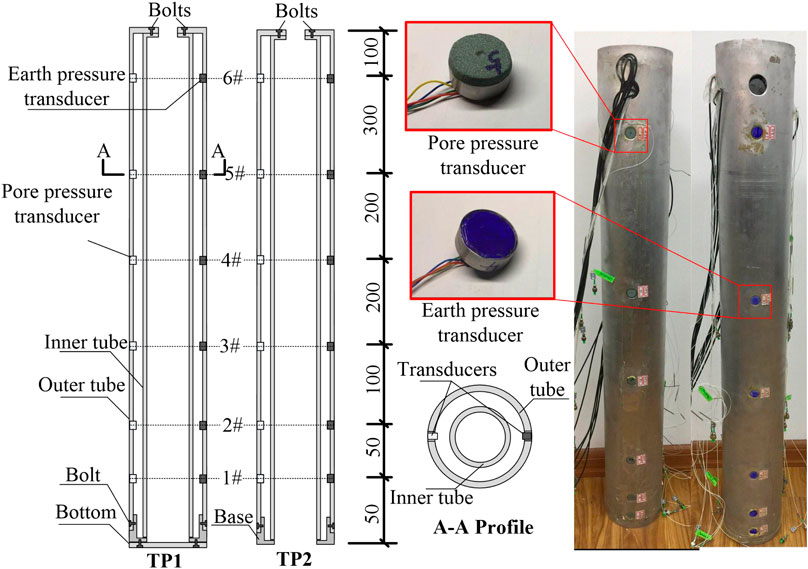
FIGURE 2. The model piles structure and transducers mounting location.
Both transducers were mounted on the model pile in the same way using the following main process:
1) The holes were cut in the pile body at the transducer locations, and the metal sleeves of the same diameter as the transducers were welded to the inner wall of the model pile at the transducer mounting location. The holes of the pile are shown in Figure 3A.
2) The epoxy resin was evenly applied around the transducer, which was then put in the corresponding hole, and the force surface of the transducer shall be flushed with the pile body surface. After the epoxy resin had set, 704 glue was applied to the transducer perimeter to seal it against water, and the data cable was taped to the inside wall of the pile, as shown in Figure 3B.
3) The transmission line of the transducers was threaded through the reserved hole near the top of the model pile to prevent the damage caused by the direct contact between the jack and the transmission line during driving.
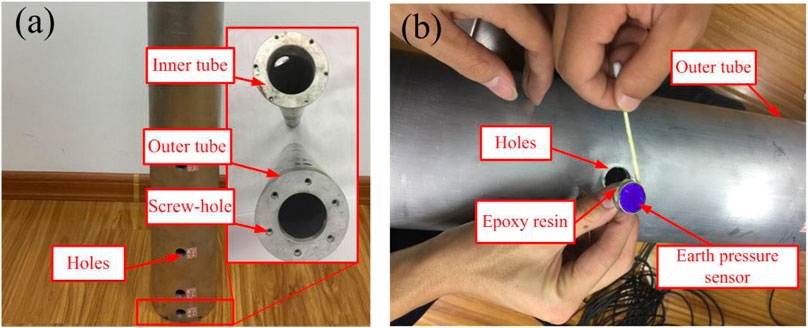
FIGURE 3. The installation method of transducers: (A) The holes of the pile, (B) Epoxy resin application.
The silty clay used in the test was taken from an engineering site. The silty clay was dried, crushed, and sieved according to the literature specifications (Ministry of Housing and Urban-Rural Construction of the People’s Republic of China, 2019), and then it was layered and compacted by compaction machinery in the model box. The soil was then sprayed with water and covered with a film and left standing for 30 days. The process of the test soil preparation is shown in Figure 4. Before the test, the soil was sampled, and its physical and mechanical parameters were obtained through a series of laboratory tests, as listed in Table 2.
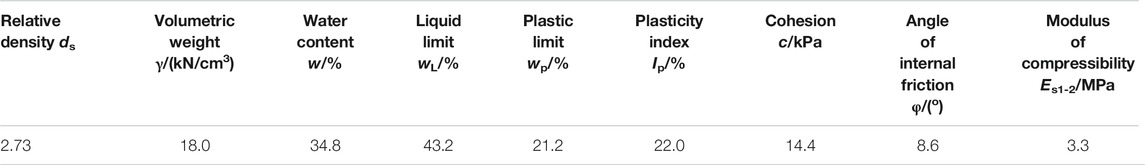
TABLE 2. The physical and mechanical parameters of the soil.
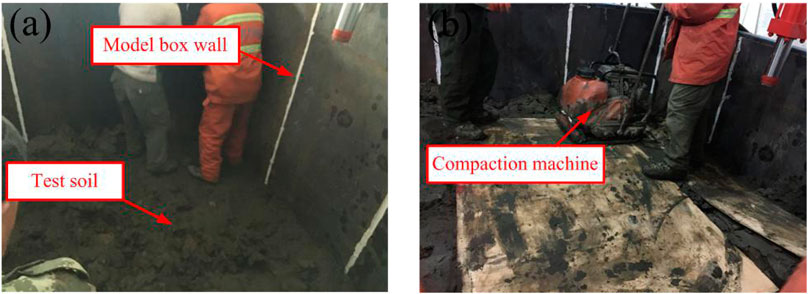
FIGURE 4. The process of soil preparation: (A) Soil filling, (B) Soil compaction.
Model piles TP1 and TP2 were spaced at 1,000 mm apart (d1), and model box walls were closer and spaced at 900 mm apart (d2) (where
The model pile was pressed into the test soil using a hydraulic jack, and the sinking speed and pile sinking depth of the pile were controlled using the electric control system. In this test, the sinking speed and pile sinking depth were 300 mm/min and 900 mm, respectively. The pore pressure and earth pressure at the pile surface during driving were collected using a CF3820 high-speed static signal test analyzer. The composition of the test system is shown in Figure 5.
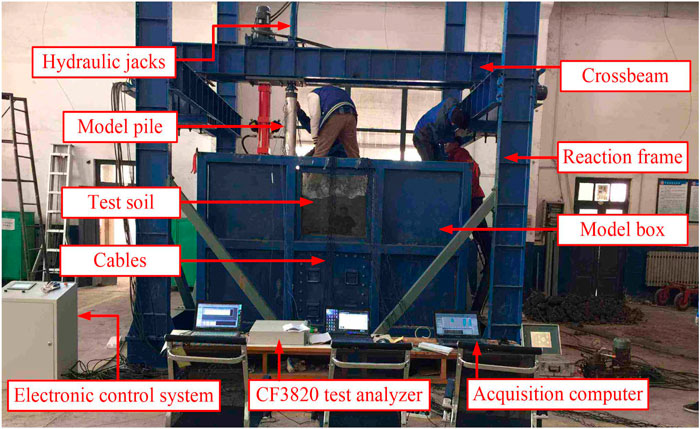
FIGURE 5. The composition of the test system.
The pore pressure at the surface of the piles under hydraulic jacking was monitored using the piezoresistive silicon pore pressure transducers. The test results of model piles TP1 and TP2 are shown in Figure 6A,B, respectively.

FIGURE 6. Pore pressure curves at the pile surface with depth: (A) TP1 and (B) TP2.
As shown in Figure 6, the pore pressure transducers on the model piles survived during the entire test period. The transducer at the top of the test pile did not measure the effective value because of its small penetration depth into the test soil; therefore, the pore pressure curve is not shown in Figure 6. The pore pressure measured by each transducer increases gradually and approximately linearly with increasing depth. This is because of the fact that the soil used in this test is homogeneous and the up and down soil layers are uniform, resulting in the more regular pore pressure distribution, different from the distribution of pore pressure in the field test. The pore pressure is caused by the shear force of the pile to the soil, making the pore around the pile too late to dissipate. When the penetration depth of the pile is small, the overburden weight and the horizontal pressure are small, the pore dissipates quickly, and the pore pressure at the pile surface is small. With increasing penetration depth, the overburden weight and horizontal pressure gradually increase, and the pore pressure at the pile surface increases linearly, and this result is consistent with the results reported by Randolph et al. (1979).
In the process of the pile driving, the variation in the pore pressure at the same depth of the soil is shown in Figure 7. With the penetration of the pile, the pore pressure at the same depth decreases slightly because of the greater penetration depth, and the soil layer at the same depth is subjected to the continuous friction of the model pile, causing the pore pressure to rise. However, the continuous perturbation of the soil around the pile also provides a channel for the dissipation of the pore, slightly decreasing the pore pressure. At the same penetration depth and the same location, the pore pressure is greater for model pile TP1 than that for model pile TP2, indicating that the compaction effect of the closed-ended pile is greater than that of the open-ended pile and is more pronounced at the end of the pile, because the soil at the end of the pile enters the inner tube of the open-ended pile, forming an earth plug.
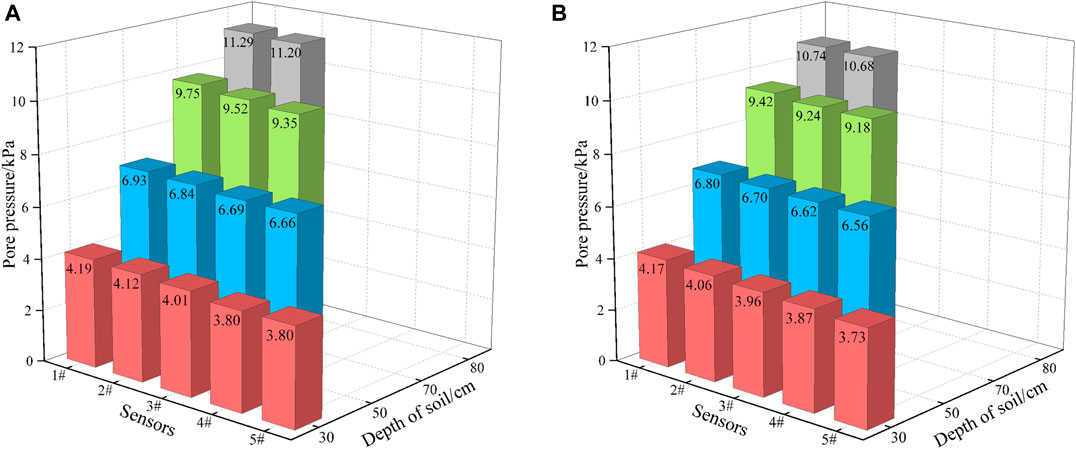
FIGURE 7. The pore pressure at the pile surface in the same soil layer: (A) TP1, (B) TP2.
The curve of the excess pore pressure of model piles TP1 and TP2 with the depth is shown in Figure 8A,B, respectively. At the end of the pile driving, the excess pore pressure with the depth of the model pile TP1 measured by the sensors is 4.21, 3.20, 2.35, 1.66, and 0.79 kPa and that of model pile TP2 measured by the sensors is 3.58, 2.68, 2.24, 1.56, and 0.87 kPa. A comparison of Figure 8A,B shows that the excess pore pressure of the closed-ended pile is still greater than that of the open-ended pile, and the maximum difference between the two piles is 0.63 kPa. The excess pore pressure at the pile surface presents a nonlinear increasing trend with increasing depth and is consistent with the excess pore pressure observed at the pile surface, as reported by Tang et al. (2002) and Dash and Bhattacharya. (2015). This is because the distribution of the excess pore pressure at the pile surface is related to the effective overburden weight. The analysis of excess pore pressure and effective overburden weight is presented in the following section.
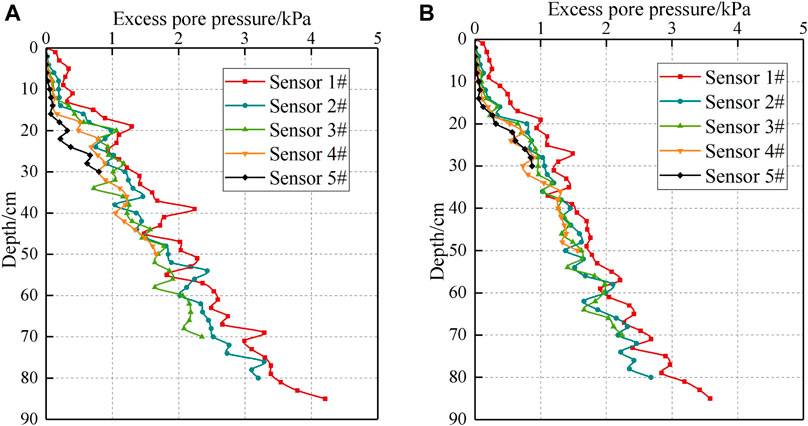
FIGURE 8. Excess pore pressure curves at the pile surface with depth: (A) TP1 and (B) TP2.
At the end of the pile driving, the relationship between the excess pore pressure at different depths of the model piles and the effective overburden weight is shown in Figure 9A,B. As shown in Figure 9, at the end of the pile driving, the excess pore pressure with the depth of the model pile TP1 measured by the sensors is 0.79, 1.66, 2.35, 3.2, and 4.21 kPa, and that of model pile TP2 is 0.87, 1.56, 2.24, 2.68, and 3.58 kPa. The ratio of the excess pore pressure at the pile surface to the effective overburden weight at the depths 20, 40, 60, 80, and 85 cm of model pile TP1 is 32.9, 47.2, 50.6, 55.6, and 61.2%, and that of model pile TP2 is 36.3, 44.3, 48.3, 46.5, and 52.1%. The ratio of the excess pore pressure at the pile surface and the effective overburden weight of the two model piles gradually increases with the depth and is consistent with that reported by Seed and Reese. (1957) and Roy et al. (1982). At a depth of 20 cm, the excess pore pressure dissipates rapidly because of the uplift of the surface soil, and the ratio of model piles TP1 and TP2 is 32.9 and 36.3%, respectively. At a depth of 85 cm, the ratio of model pile TP1 to TP2 reached a maximum value of 61.2 and 52.1%, respectively, and the difference of the ratio is 9.1%, indicating that during the pile driving, the excess water pressure is high, adversely affecting the bearing capacity of the pile foundation. Therefore, measures such as vertical drainage channels in the vicinity of piles are needed to reduce the excess water pressure during pile driving in engineering.
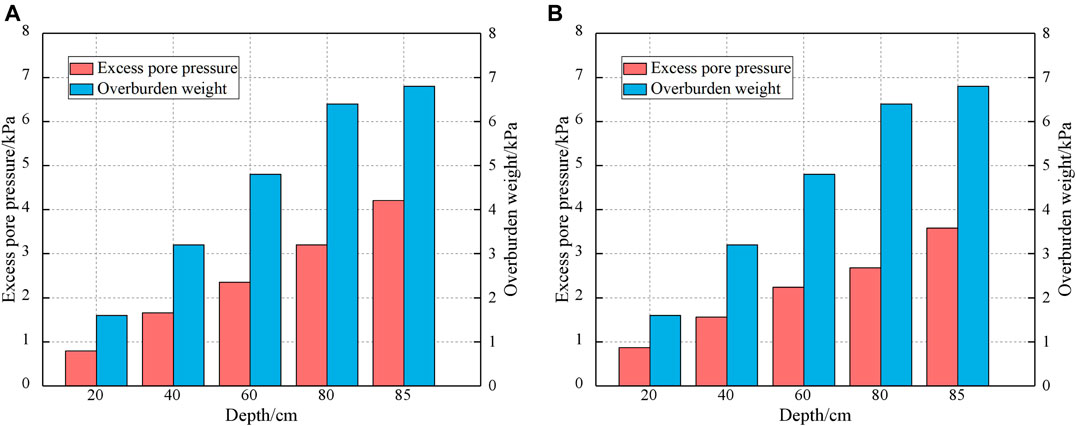
FIGURE 9. The excess pore pressure at the pile surface and overburden weight with depth: (A) TP1, (B) TP2.
The radial earth pressure at the surface of the piles under hydraulic jacking was monitored using the piezoresistive silicon earth pressure transducers. The test results of model piles TP1 and TP2 are shown in Figure 9A,B, respectively.
As shown in Figure 10, the radial earth pressure of model piles TP1 and TP2 basically showed the same pattern in the process of pile driving, both increasing gradually with depth and being consistent with the test results of Lehane and Jardine. (1994) and Bond and Jardine. (1991). At the end of pile driving, the radial earth pressure at the depths 40, 60, 80, 90, and 95 mm of model pile TP1 measured by the sensors is 5.10, 8.42, 13.23, 16.68, and 20.03 kPa and that of model pile TP2 measured by the sensors is 4.54, 9.05, 13.83, 16.67, and 19.59 kPa. The radial earth pressure at the pile surface is less affected by the form of the pile end, and the increase in the radial soil pressure further away from the pile end is smaller because of the overburden weight. At the same soil depth, the radial earth pressure of the model piles decreases with increasing penetration depth. This is because increasing penetration of the model pile gradually decreases the adhesion between the pile and soil and increases the gap between the pile and soil, resulting in decreasing the radial earth pressure at the pile interface, and the decrease in the radial earth pressure increases with increasing penetration depth.
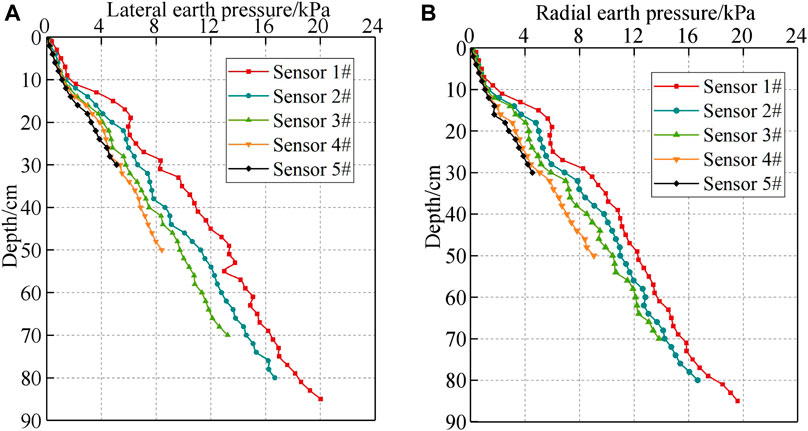
FIGURE 10. Radial earth pressure curves at the pile surface with depth: (A) TP1, (B) TP2.
The curve of the effective radial earth pressure at the pile surface of model piles TP1 and TP2 with the depth is shown in Figure 11A,B, respectively. The effective radial earth pressure and the radial earth pressure at the pile surface vary similarly, both increasing with the penetration depth, and there is also significant degradation at the same soil depth. At the end of pile driving, the effective radial earth pressure with the depth of the model pile TP1 is 4.31, 6.76, 10.88, 13.48, and 15.82, accounting for 84.5, 80.3, 82.2, 80.8, and 78.9% of the radial earth pressure at the pile interface, respectively. In addition, the effective radial earth pressure of model pile TP2 is 16.01, 13.99, 11.59, 7.49, and 3.67 kPa, accounting for 80.8, 82.8, 83.8, 83.9, and 81.7% of the radial earth pressure, respectively. This indicates that the effective radial earth pressure at both the closed- and open-ended pile is a major component of the radial earth pressure.
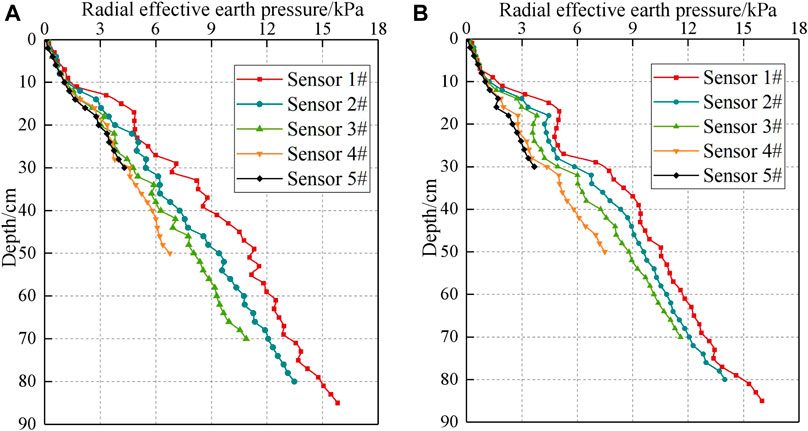
FIGURE 11. Effective radial earth pressure curves at the pile surface with depth: (A) TP1 and (B) TP2.
To further investigate the contact state of the pile and soil during the pile jacking, as shown in Figure 11, the contact coefficient was obtained from Figure 11 in the following equation:
where
In the process of the pile driving, the variation in the contact coefficient at the same depth of the soil is shown in Figure 12. At a certain penetration depth, the contact coefficient of the model piles first increases and then decreases with increasing depth of the soil and is greater than 1 at large depth. This indicates an obvious compaction effect in the process of pile jacking: effective radial earth pressure at the pile surface is higher than the self-weight stress, the gap between the pile and soil is small, and the pile and soil are in close contact. In the later stages of pile jacking, the contact coefficient decreases because of a faster rise in the excess pore water pressure in the deep soil layer and a lower increase in the effective radial earth pressure at the pile surface. At the same depth of the soil, the coefficient gradually decreases with proceeding jacking pile. This indicates that with the pile jacking, the compaction effect at the same depth decreases, and the gap between the pile and soil increases, resulting in a gradual decrease in the shaft resistances of the piles, and this result is consistent with those reported by Kou et al. (2019). The shallow soils have a smaller coefficient, because they are affected by factors such as pile body sway during the pile jacking and the pile-soil contact is not tight, reducing the effective radial earth pressure.
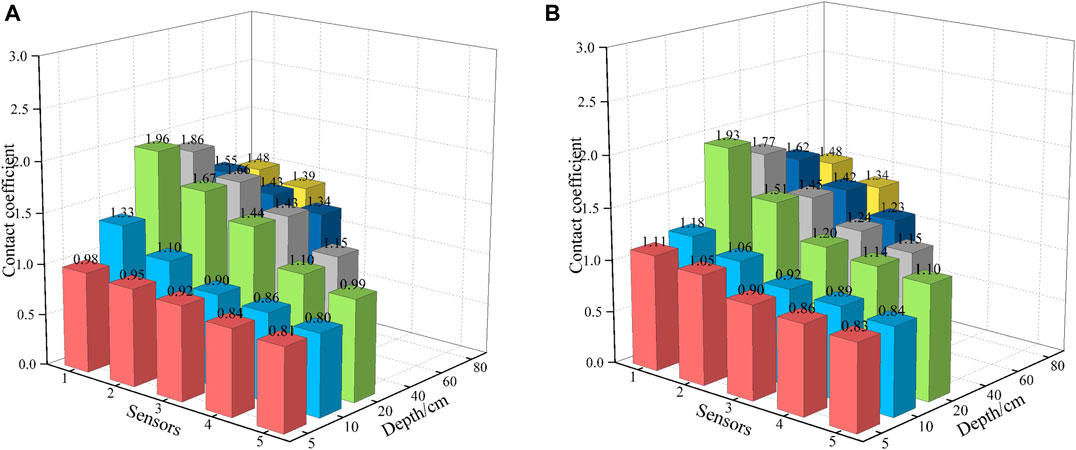
FIGURE 12. The contact coefficient of the piles in the same soil layer: (A) TP1, (B) TP2.
After the indoor test equipment and test piles are reduced by ten times, the particle flow numerical simulation is carried out. After the reduction, the gravity field will be reduced, which makes the simulation results different from the test results. In order to overcome this drawback, the acceleration of gravity was increased to 10 times the original. The model frame is composed of a wall with a size of 300 mm × 200 mm (length × height).
Peng et al. (2017) considered that for materials such as concrete and stronger rocks, the contact relationship between particles adopts a parallel bonding model; for soft soils with lower strength, the contact relationship between particles adopts a contact bonding model. The simulated foundation soil is homogeneous clay soil, so the contact relationship of particles adopts the contact bonding model, the maximum particle radius is 0.51 mm, and the minimum particle radius is 0.3 mm. The initial porosity of the foundation soil is 0.3, and the total particles are 45,000. The microscopic parameters of the soil layer are shown in Table 3. The soil layer is generated and attached with color as shown in Figure 13 to better observe the movement of the soil during the pile driving process. It can be seen from the figure that after ten layers of soil were formed, the test tank is not completely filled.
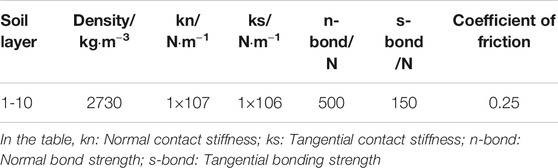
TABLE 3. Mesoscopic parameters of soil layer.
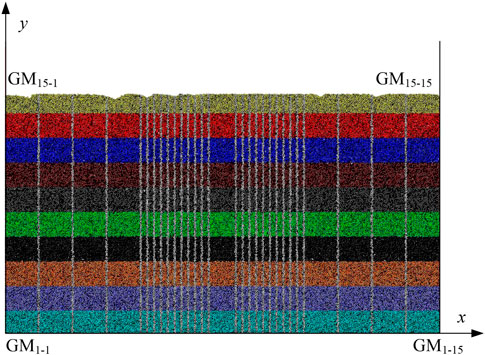
FIGURE 13. The foundation soil is formed.
The model pile is composed of particles with a radius of 0.5 mm, including the top of the pile, the pile wall, and the end of the pile. The particles overlap each other. The distance between two adjacent particles is 0.1 mm. The scale of the model test is 10 times. In this article, a total of two model piles are simulated for pile sinking, which are closed piles with a diameter of 14 mm and open piles with a diameter of 14 mm. The pile lengths are both 100 mm, and the numbers are M1 and M2, respectively.
Figure 14 is the normalized comparison of experimental and simulated radial earth pressure.
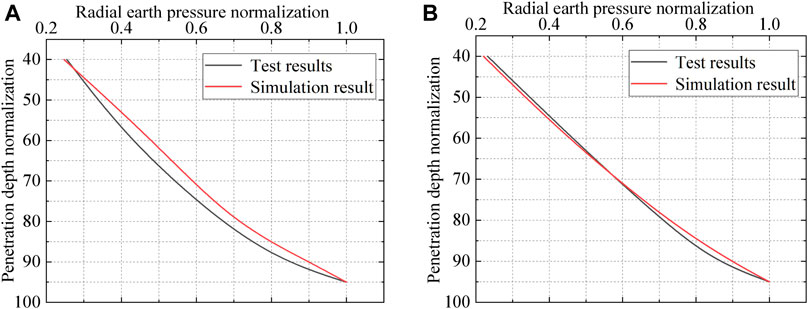
FIGURE 14. Normalized comparison of experimental and simulated radial earth pressure. (A) M1 and TP1. (B) M2 and TP2.
It can be seen from Figure 14 that the normalized curve form of the experimental and simulated radial earth pressures is basically the same, indicating that the experimental and simulated radial earth pressures are basically consistent with the penetration depth, which also explains the use of silicon. The piezoresistive silicon pressure transducers are feasible to monitor the radial earth pressure on the surface of the pile, but the two curves still have certain differences. The reasons are as follows: 1) There are many external interference factors during the test; 2) the simulated foundation soil parameters cannot be completely equivalent to the parameters of the foundation soil in the test, and the foundation soil is composed of particles. During the pile driving process, the interaction between soil particles and the pile and the interaction between particles and particles cannot be completely consistent with the indoor test. 3) During the test, the foundation soil may have unevenness somewhere in the layered vibration time. The above reasons lead to the difference between simulation and indoor experiments.
In conclusion, a new method was developed for monitoring the pore and earth pressure at the pile surface using the piezoresistive silicon earth transducers introducing pore pressure transducers. Two model piles were instrumented with the piezoresistive silicon pressure transducers and installed using the hydraulic jack in the model box. The experimental results of this study lead to the following conclusions:
1) The piezoresistive silicon pressure transducers were proved to be feasible to measure the pore and earth pressure at the pile surface during pile jacking, indicating that the pore and earth pressure on the pile wall can be measured successfully using these transducers.
2) The transducers installation method used in this test is feasible, and 12 earth pressure transducers and 12 pore pressure transducers all survived in the test. The small size of the transducers used in the test makes their installation easy.
3) The self-made model pile used in this experiment is a double-tube structure. The gap between the inner and outer tubes of the pile can not only provide space for the installation of transducers but also provide protection for the cables of the transducers.
4) The pore pressure, excess pore pressure, radial earth pressure, and effective radial earth pressure at the same pile position all increase with increasing penetration depth. At the same penetration depth and the same pile position, the pore pressure and excess pore pressure at the pile surface of the closed-ended pile are greater than those of the open-ended pile.
5) The radial earth pressure and effective radial earth pressure at the same soil depth all decrease with the penetration depth, the decrease in value increases with the penetration depth. In addition, the effective radial earth pressure is the main component of the pile surface earth pressure.
6) The experimental and simulated radial soil pressure changes with the penetration depth are basically the same. The silicon piezoresistive pressure sensor can be used to monitor the radial soil pressure on the pile surface, especially the pile with an open end.
7) In practical applications, after the groove is carved on the pile body, the bottom surface of the groove is leveled with the adhesive, and then the sensor is installed to make the sensor surface parallel to the bottom surface of the groove. In addition, the piezoresistive silicon pressure transducer should be embedded in the groove to avoid exposure outside the groove. The sensor should be prevented from being knocked during the pile pressing process, affecting the survival rate of the sensor.
The original contributions presented in the study are included in the article/Supplementary Material; further inquiries can be directed to the corresponding author.
JM and YH: Data curation; YW: Formal analysis; MZ: Funding acquisition; YH: Methodology; YW: Supervision; YH: Validation; YW: Writing–original draft; YH: Writing–review and editing; All authors have read and agreed to the published version of the manuscript.
This research was financially supported by the National Natural Science Foundation of China (51708316, 51778312, and 51809146).
The authors declare that the research was conducted in the absence of any commercial or financial relationships that could be construed as a potential conflict of interest.
Airhart, T. P., Coyle, H. M., Hirsch, T. J., and Buchanan, S. J. (1969). Pile-soil system response in a cohesive soil. Performance of Deep Foundations, Pennsylvania. 444, 264–294. doi:10.1520/STP47289S
Bjerrum, L., Brinch Hansen, J., and Sevaldson, R. (1958). Geotechnical investigations for a quay structure in Horten. Norwegian Geotechnical Institute, Publ. Norway. 28, 1–18.
Bjerrum, L. (1967). Engineering Geology of Norwegian normally-consolidated marine clays as related to settlements of buildings. Géotechnique 17 (2), 83–118. doi:10.1680/geot.1967.17.2.83
Bond, A. J., and Jardine, R. J. (1991). Effects of installing displacement piles in a high OCR clay. Géotechnique 41 (3), 341–363. doi:10.1680/geot.1991.41.3.341
Casagrande, A. (1932). The structure of clay and its importance in foundation engineering. J. Boston Soc. Civil Eng. 19 (4), 168–209.
Chen, F., Xu, Q., and Zhang, J. (2019). Long term working performance of vibrating wire piezometers in vacuum preloading engineering. Port Waterway Eng. 01, 185–190. doi:10.16233/j.cnki.issn1002-4972.20190107.009
Chen, J. W., Zhu, Y. T., Guo, Z. H., and Nasibulin, A. G. (2020). Recent progress on thermo-electrical properties of conductive polymer composites and their application in temperature sensors. Engineered Sci. 12, 13–22. doi:10.30919/es8d1129
Chui, G. T. (1990). Similarity theory and model test. Xuzhou, China: China University of Mining and Technology Press.
Dash, S. R., and Bhattacharya, S. (2015). Pore water pressure generation and dissipation near to pile and far-field in liquefiable soils. Inter. J. Geom. 9 (2), 1454–1459. doi:10.21660/2015.18.4253
Duan, N. (2016). Mechanical characteristics of monopile foundation in sand for offshore wind turbine. London, United Kingdom: University College London).
Dumoulin, C., Karaiskos, G., Carette, J., Staquet, S., and Deraemaeker, A. (2012). Monitoring of the ultrasonic p-wave velocity in early-age concrete with embedded piezoelectric transducers. Smart Mater. Struct. 21, 047001. doi:10.1088/0964-1726/21/4/047001
Feng, Q., Kong, Q., and Song, G. (2016). Damage detection of concrete piles subject to typical damage types based on stress wave measurement using embedded smart aggregates transducers. Measurement 88, 345–352. doi:10.1016/j.measurement.2016.01.042
Ghahari, S., Ghafari, E., Hou, P. K., and Lu, N. (2018). Hydration properties of cement pastes with Al-zinc oxide and zinc oxide nanoparticles. ES Mater. Manufacturing 2, 51–59. doi:10.30919/esmm5f172
Hou, P. K., Li, R., Li, Q. F., Lu, N., Wang, K. J., Liu, M. L., et al. (2018). Novel superhydrophobic cement-based materials achieved by construction of hierarchical surface structure with FAS/SiO2 hybrid nanocomposites. ES Mater. Manufacturing 1, 57–66. doi:10.30919/esmm5f125
Huang, H. L., Lu, H., Wang, Y. L., Yang, Z. L., Zhu, F., and Xu, M. (2020). The background of the sensors needs be strengthened. The following papers are useful and need be cited: tunable Thermal-Response Shape Memory Bio-Polymer Hydrogels as Body Motion Sensors. Engineered Sci. 9, 60–67.
Igoe, D. J. P., Gavin, K. G., and O’Kelly, B. C. (2011). Shaft capacity of open-ended piles in sand. J. Geotech. Geoenviron. Eng. 137, 903–913. doi:10.1061/(asce)gt.1943-5606.0000511
Jardine, R. J., and Bond, A. J. (1989). Behaviour of displacement piles in a heavily overconsolidated clay. Proc. 12th Int. Conf. Soil Mech. Foundations Eng. Rio de Janeiro, Brazil 2, 1147–1151.
Jiang, T., Kong, Q., Patil, D., Luo, Z., Huo, L., and Song, G. (2017). Detection of debonding between fiber reinforced polymer bar and concrete structure using piezoceramic transducers and wavelet packet analysis. IEEE Sensors J. 17 (7), 1992–1998. doi:10.1109/jsen.2017.2660301
Kou, H.-L., Diao, W.-Z., Liu, T., Yang, D.-L., and Horpibulsuk, S. (2018). Field performance of open-ended prestressed high-strength concrete pipe piles jacked into clay. Sensors 18 (12), 4216. doi:10.3390/s18124216
Kou, H. L., Chu, J., Guo, W., and Zhang, M. Y. (2015). Field study of residual forces developed in pre-stressed high-strength concrete (PHC) pipe piles. Can. Geotech. J. 53, 696–707. doi:10.1139/cgj-2017-0120
Kou, H. L., Yu, F., and Liu, T. (2019). Strain monitoring on PHC pipe piles based on fiber Bragg grating sensors[J]. J. Perform. Constr. Facil. 33 (2), 04019003. doi:10.1061/(asce)cf.1943-5509.0001266
Lehane, B. M., and Jardine, R. J. (1994). Displacement pile behaviour in a soft marine clay. Can. Geotech. J. 31 (1), 181–191. doi:10.1139/t94-024
Li, L., Huang, J., and Han, B. (2018). Centrifugal investigation of excavation adjacent to existing composite foundation. J. Perfor. Constr. Facil. 32 (4), 04018044. doi:10.1061/(asce)cf.1943-5509.0001188
Li, P., Gu, H., Song, G., Zheng, R., and Mo, Y. L. (2010). Concrete structural health monitoring using piezoceramic-based wireless sensor networks. Smart Structures Syst. 6, 731–748. doi:10.12989/sss.2010.6.5_6.731
Liang, C., Zhao, P. Q., Hou, P. K., Wang, S. D., Strokova, V., Lu, L. C., et al. (2020). Investigation of compatibility of fluorine-acrylic emulsion and sulphoaluminate cement in the design of composite coating: effects of sorbitol and its mechanism. ES Mater. Manufacturing 8, 36–45. doi:10.30919/esmm5f707
Liu, J. W., Cui, L., Zhu, N., Han, B., and Liu, J. (2019). Investigation of cyclic pile-sand interface weakening mechanism based on large-scale CNS cyclic direct shear tests. Ocean Eng. 194, 106650. doi:10.1016/j.oceaneng.2019.106650
Liu, X. (2015). The research on tangential stiffness fitting in pile soil system contact surface. Liaoning, China: Liaoning Project Technology University.
Lo, K. Y., and Stermac, A. G. (1965). Induced pore pressures during pile driving operations. Proc. 6th Int. Conf. Soil Mech. Found. Eng. MontrCal, Can. 11, 285–289.
Lyne, D., and Jack, Q. Z. (2004). The influence of temperature on earth pressure cell readings. Can. Geotech. 41, 551–559. doi:10.1139/t04-004
Mccabe, B. A., and Lehane, B. M. (2006). Behavior of axially loaded pile groups driven in clayey silt. J. Geotech. Geoenviron. Eng. 132 (3), 401–410. doi:10.1061/(asce)1090-0241(2006)132:3(401)
Ministry of Housing and Urban-Rural Construction of the People’s Republic of China (2019). Ministry of housing and urban-rural construction of the People’s Republic of China. GB/T 50123-2019. Beijing, China: China Planning Press.
Moslehy, Y., Gu, H., Belarbi, A., Mo, Y. L., and Song, G. (2010). Smart aggregate-based damage detection of circular RC columns under cyclic combined loading. Smart Mater. Struct. 19, 065021. doi:10.1088/0964-1726/19/6/065021
Orrje, O., and Broms, B. (1967). Effects of pile driving on soil properties. J. Soil Mech. Found. Div., Am. Soc. Civ. Eng. 93 (SM5), 59–73. doi:10.1061/jsfeaq.0001044
Peng, Y. Y., Zhou, H. Q., and Zhou, S. L. (2017). Simulation of mesoscopic mechanic properties on red clay by using particle flow code. J. Chongqing Univ. Technology(Natural Science) 31 (1), 41–45. doi:10.3969/j.issn.1674-8425(z).2017.01.007
Pestana, J. M., Hunt, C. E., and Bray, J. D. (2002). Soil deformation and excess pore pressure field around a closed-ended pile. J. Geotech. Geoenviron. Eng. 128 (1), 1–12. doi:10.1061/(asce)1090-0241(2002)128:1(1)
Randolph, M. F., Carter, J. P., and Wroth, C. P. (1979). Driven piles in clay-the effects of installation and subsequent consolidation. Géotechnique 29 (4), 361–393. doi:10.1680/geot.1979.29.4.361
Rao, S. N., Ramakrishna, V. G. S. T., and Raju, G. B. (1996). Behavior of pile-supported dolphins in marine clay under lateral loading. J. Geotechnical Eng. 122 (8), 607–612. doi:10.1061/(asce)0733-9410(1996)122:8(607)
Roy, M., Blanchet, R., Tavenas, F., and La Rochelle, P. (1981). Behaviour of a sensitive clay during pile driving. Can. Geotech. J. 18 (2), 67–85. doi:10.1139/t81-007
Roy, M., Tremblay, M., Tavenas, F., and Rochelle, P. L. (1982). Development of pore pressures in quasi-static penetration tests in sensitive clay. Can. Geotech. J. 19 (2), 124–138. doi:10.1139/t82-015
Seed, H. B., and Reese, L. C. (1957). The action of soft clay along friction piles. T. Am. Soc. Civ. Eng. 122, 731–754. doi:10.1061/taceat.0007501
Steenfelt, J. S., Randolph, M. F., and Wroth, C. P. (1981). Instrumented model piles jacked into clay. Proc. 10th Int. Conf. Soil Mech. Foundations Eng. 2, 857–864.
Su, Y. F., Han, G. S., Kong, Z. H., Nantung, T., and Lu, N. (2020). Embeddable piezoelectric sensors for strength gain monitoring of cementitious materials: the influence of coating materials. Engineered Sci. 11, 66–75. doi:10.30919/es8d1114
Tang, S. D., He, L. S., and Fu, Z. (2002). Excess pore water pressure caused by an installing pile in soft foundation. Rock Soil Mech. 23 (6), 725–732. doi:10.2753/CSH0009-4633350347
Vaughan, P. R., and Walbancke, H. J. (1973). Pore pressure changes and the delayed failure of cutting slopes in overconsolidated clay. Géotechnique 23 (4), 531–539. doi:10.1680/geot.1973.23.4.531
Wang, Y. X., Guo, P. P., Ren, W. X., Yuan, B. X., Yuan, H. P., and Cao, P. (2017a). Laboratory investigation on strength characteristics of expansive soil treated with jute fiber reinforcement. Int. J. Geomech. 17 (11), 0401710. doi:10.1061/(asce)gm.1943-5622.0000998
Wang, Y. H., Zhang, M. Y., Gao, Q., and Wang, P. (2017b). Research and fabrication of micro silicon piezoresistive pressure sensor. Transducer Microsystem Tech. 36, 106–108. doi:10.13873/J.1000-9787(2017)11-0106-03
Wang, Y. X., Guo, P. P., Lin, H., Li, X., Zhao, Y. L., Yuan, B. X., et al. (2019). Numerical analysis of fiber-reinforced soils based on the equivalent additional stress concept. Int. J. Geomech. 19 (11), 04019122. doi:10.1061/(asce)gm.1943-5622.0001504
Xu, B., Zhang, T., Song, G., and Gu, H. (2013). Active interface debonding detection of a concrete-filled steel tube with piezoelectric technologies using wavelet packet analysis. Mech. Syst. Signal Process. 36, 7–17. doi:10.1016/j.ymssp.2011.07.029
Yang, J. J. (2005). Similarity theory and structural model test. Wuhan, China: Wuhan University of Technology Press.
Yegian, M., and Wright, S. G. (1973). Lateral soil resistance displacement relationships for pile foundation in soft clays. Houston, TX, United Staes: Offshore Technology Conference., 893.
Keywords: model test, pore pressure, jacking method, piezoresistive silicon transducers, radial earth pressure
Citation: Wang Y, Huang Y, Zhang M and Ma J (2021) Monitoring and Analysis of Pore and Earth Pressure at the Pile Surface Using Piezoresistive Silicon Pressure Transducers. Front. Mater. 8:629370. doi: 10.3389/fmats.2021.629370
Received: 14 November 2020; Accepted: 25 January 2021;
Published: 30 April 2021.
Edited by:
Liang Ren, Dalian University of Technology, ChinaReviewed by:
Baoxin Qi, Shenyang Jianzhu University, ChinaCopyright © 2021 Wang, Huang, Zhang and Ma. This is an open-access article distributed under the terms of the Creative Commons Attribution License (CC BY). The use, distribution or reproduction in other forums is permitted, provided the original author(s) and the copyright owner(s) are credited and that the original publication in this journal is cited, in accordance with accepted academic practice. No use, distribution or reproduction is permitted which does not comply with these terms.
*Correspondence: Mingyi Zhang, em15NThAMTYzLmNvbQ==
Disclaimer: All claims expressed in this article are solely those of the authors and do not necessarily represent those of their affiliated organizations, or those of the publisher, the editors and the reviewers. Any product that may be evaluated in this article or claim that may be made by its manufacturer is not guaranteed or endorsed by the publisher.
Research integrity at Frontiers
Learn more about the work of our research integrity team to safeguard the quality of each article we publish.