 Hariprasath Ganesan
 Ingo Scheider
 Christian J. Cyron
- 1Institute of Materials Research, Materials Mechanics, Helmholtz-Zentrum Geesthacht, Geesthacht, Germany
- 2Institute of Continuum and Materials Mechanics, Hamburg University of Technology, Hamburg, Germany
γ-titanium aluminide (TiAl) alloys with fully lamellar microstructure possess excellent properties for high-temperature applications. Such fully lamellar microstructure has interfaces at different length scales. The separation behavior of the lamellae at these interfaces is crucial for the mechanical properties of the whole material. Unfortunately, quantifying it by experiments is difficult. Therefore, we use molecular dynamics (MD) simulations to this end. Specifically, we study the high-temperature separation behavior under tensile loading of the four different kinds of lamellar interfaces appearing in TiAl, namely, the
1 Introduction
Rising concern for environmental protection demands the quest for lightweight high-temperature materials to improve fuel efficiency in civil aviation. In recent times, titanium aluminide (TiAl) alloys (Dimiduk, 1999) are evolving as a potential material for rotating components operating at elevated temperatures, especially turbine blades. Compared to other high-temperature materials, alloys based on γ-TiAl (Appel et al., 2000) possess a high specific modulus and melting point, a low density, and excellent corrosion resistance. In particular, the specific strength of γ-TiAl is higher than that of superalloys at elevated temperatures, making it an attractive engineering material (Clemens and Mayer, 2013). γ-TiAl can exhibit a duplex, equiaxed, nearly lamellar (NL), or fully lamellar (FL) microstructure. Among them, the FL microstructure exhibits superior creep resistance and fracture toughness (Bewlay et al., 2016). It is characterized by thin lamellae, each of which belongs to one of the two constituent intermetallic phases, the γ phase (ordered face-centered tetragonal TiAl) and the
Continuum mechanical modeling of the micromechanics of materials has attracted considerable attention over the last decades. Appel et al. (2016) recently reviewed the different modeling approaches to TiAl proposed so far. Crystal plasticity models can help to account for specific deformation mechanisms (slip and twinning) and for describing the anisotropic material behavior in TiAl. Recently, such models (Schnabel and Bargmann, 2017; Ji et al., 2018; Schnabel and Scheider, 2020) were used to predict the colony boundary strengthening coefficient as a function of lamella thickness and to map the deformation in lamellar TiAl. Microstructure-informed multi-scale models bear promise to accelerate the alloy development in γ-TiAl. To increase their accuracy, they should also include the role of interfaces and alloying elements. Obtaining the parameters required for continuum mechanical interface models from experiments is difficult so that molecular dynamics (MD) simulations appear to be the most promising tool to this end.
In MD simulations of TiAl, the different intermetallic phases (
The finite element method is frequently used in mesoscale and macroscale models of TiAl. Such models should include the deformation behavior of bulk constituent phases as well as different interfaces (
In this article, we perform MD simulations of four single lamellar interfaces (one
2 Materials and Methods
2.1 Molecular Dynamics Model
At the micro- or nanoscale, materials can be modeled as many-particle systems. MD is a numerical technique to study the evolution of such systems in time by computing the trajectories of the individual particles. This is accomplished by numerical integration of Newton’s equation of motion. If the particles represent atoms, MD simulations provide an atomic resolution (Cai et al., 2012). Herein, all MD simulations were performed using the open source package LAMMPS large-scale atomic/molecular massively parallel simulator (Plimpton, 1995) distributed by the Sandia National Laboratories. For metallic materials, interatomic interactions in MD are often modeled in a (semi)empirical manner using the so-called embedded-atom method (EAM) of Daw and Baskes (1984). Following this approach, we define the total potential energy
Here,
2.2 Cohesive Zone Model
In a cohesive zone model, interfaces are idealized as two surfaces initially attached to each other without any material volume in between. Tractions on the interface are defined by a vector field
Similar to bulk plasticity models, the interface traction depends only on the elastic part of the separation
Here,
Following the classical setting of damage and plasticity theory (Maugin, 1992), we define the so-called fictitious undamaged stress
Here,
with
The damage-related reduction of yield stress D in Eq. 5 is defined herein heuristically as
with two material parameters p and S. The evolution of the internal variable d can be defined in a thermodynamically consistent manner (see, e.g., Maugin, 1992) via its thermodynamic driving force
which by standard thermodynamic arguments from classical plasticity theory directly leads to the evolution equation
Here, the initial value of d is zero, and
where
While the cohesive zone model has been implemented into the commercial finite element code ABAQUS®, a python implementation of the above equations is sufficient for the calculations presented here. The python class for the cohesive zone model is available at Scheider (2020).
2.3 Molecular Dynamics Simulation—Preprocessing
In γ-TiAl processing, the target microstructure is often achieved through the controlled cooling of the high-temperature α phase, which results in the precipitates of γ-plates through the reactions
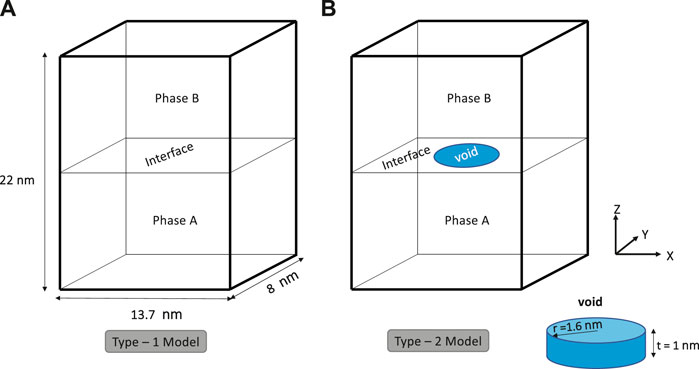
FIGURE 1. Schematic showing the two types of single interface models used herein for atomistic simulations. (A) Type-1 models assume an initially defect-free (ideal) structure, whereas (B) Type-2 models include a preexisting penny-shaped void across the interface. Atoms belonging to the void region are removed.
In our study, emphasis was placed on understanding the separation behavior of the single interlamellar interface subject to tensile loading. Accordingly, we consider a defect-free interface model designated as Type-1 (refer Figure 1) to assess the theoretical strength and deformation behavior. Further, we considered the single interface models with a defect, which we refer to as the Type-2 model (refer Figure 1), to study the influence of the preexisting defect at the interface. Here, a line defect, that is, dislocation, was avoided on purpose as we were interested in neither the dislocation dynamics nor the interaction of existing dislocation with chemical species. Moreover, the simplified model of single dislocation poses several limitations: stability of the dislocation at elevated temperature, the bias introduced by the initial dislocation type, and unrealistic starting dislocation density. To circumvent these limitations, we chose a void type defect instead. Further, the preexisting void can be associated with the crack at the interface, which is often considered in continuum fracture studies to understand the crack propagation under different loading conditions. From the atomistic standpoint, such defect may act as dislocation sources during deformation, overcoming any modeling bias, as we discussed before. Accordingly, the Type-2 model includes a penny-shaped void at the interface with a radius of 1.6 nm and a height of 1 nm (refer Figure 1). The center of this void was chosen to coincide with the center of the simulation domain so that the void covers two atomic layers in each of the two intermetallic phases in the simulation model. The influence of the initial void shape and size on the interface separation behavior falls beyond this study’s scope. In test simulations, we found that a simulation domain of the size 13.7 nm × 8 nm × 22 nm was a good trade-off between computational cost and the requirement to reduce boundary effects. Using such domains, Type-1 models consist of 147,456 atoms in total and Type-2 models of 147,002 (after removing atoms belonging to the void region).
In Figure 2, the first row shows the constructed atomistic models of the four interlamellar interfaces in TiAl after an initial energy minimization. The second row displays in this initial configuration for each atom the so-called centrosymmetry parameter (CSP), which measures the local lattice disorder around the atom, for example, due to defects, surfaces, or interfaces (Stukowski, 2009). For an atom whose direct neighborhood forms a perfect lattice, the CSP is zero. By contrast, the CSP takes on high values if the atom constitutes the core of a dislocation or is located next to an interface or surface. The CSP was computed using OVITO (Stukowski, 2009). Here, blue atoms represent the γ phase, green atoms represent either an interface or the
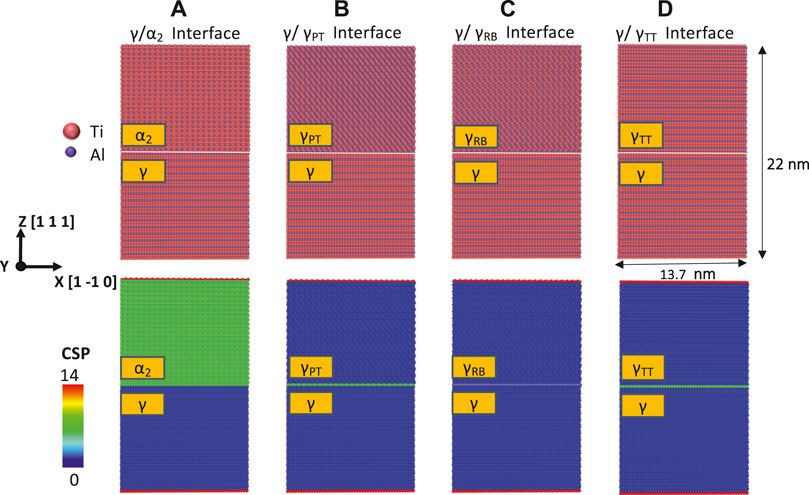
FIGURE 2. First row: simulation system for the defect-free interfaces ((A)
The preprocessing of the simulation samples was performed in several steps. In the first step, Type-1 (defect-free) interface models were energetically minimized using a conjugate gradient algorithm in LAMMPS large-scale atomic/molecular massively parallel simulator (Plimpton, 1995). For Type-2 models, now the atoms in the void regions were removed and energetically minimized. For both Type-1 and Type-2 models, the second step was assigning velocities to all the atoms using a Gaussian distribution to initialize the start temperature. Subsequently, the samples were heated up to the target temperature and equilibrated at constant temperature and pressure for 40 ps in case of Type-1 models and 100 ps in case of Type-2 models. Finally, in the third step, the samples were equilibrated at constant volume and target temperature for 100 ps so that the kinetic energy is well distributed within the model. The Nosé–Hoover thermostat was used for all the thermal equilibrations. A time step size of 1fs and periodic boundary conditions in all directions were applied in the preprocessing simulations.
2.4 Molecular Dynamics Simulation—Deformation
After the preprocessing as described in section 2.3, the deformation according to the applied strain rate was simulated. Three different regions were distinguished for imposing boundary conditions: a loading region, a fixed region, and a mobile region in between. These regions are depicted in Figure 3. Here, we choose a boundary-driven deformation technique to perform the tension test. Accordingly, we selected a few layers of atoms (spanning 2 nm) far away from the interface at the boundary of the simulation box in the Z-direction. The loading region’s thickness is carefully chosen to ensure the smooth transfer of displacement rate into the system without any boundary artifact. In the loading region, we prescribe similar to Zhou et al. (2008), Gupta et al. (2016) a far-field displacement
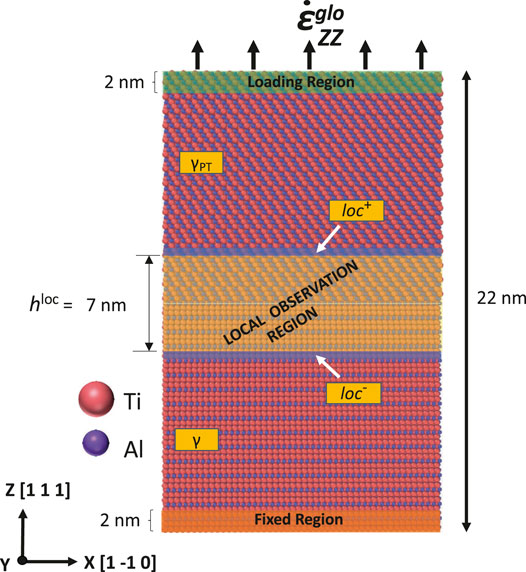
FIGURE 3. In the loading region (top/green), a constant velocity is prescribed in the Z-direction for all atoms. In the fixed region (bottom/orange), atoms are kept fixed at their position. In the mobile region (the whole rest of the simulation domain), no specific position or velocity was prescribed, but a local observation region with a height
Figure 3 highlights a special zone within the mobile region, in the following denoted as the local observation region. It stretches over 3.5 nm in both directions from the interlamellar interface, that is, over in total
The local atomic stress tensor
at each discrete time step in the simulation according to Thompson et al. (2009). Here,
where the index i runs over all atoms in the subdomain within the simulation model considered.
For mapping atomic stresses to the continuum level, we used two types of such averaged stresses, a global stress,
For relating the atomistic to the continuum level, not only stresses but also strains and the interface separation have to be discussed. The global MD-based strain in the Z-direction
Both the MD-based tractions and the interface separation were computed in our simulations every 100 fs.
2.5 Identification of Damage Specific Interface Separation
The separation
Now, to isolate the interface-related part of the deformation in the local observation region, we have to subtract from the overall deformation
With the interface-related separation
Moreover, the total dislocation density in the MD simulations was calculated using the dislocation analysis tool provided in the visualization software OVITO (Stukowski, 2009; Stukowski and Albe, 2010) and used as a measure of plasticity on the continuum level. The starting point of micro-plasticity in a continuum mechanical sense can then be identified by a significant increase in dislocation density.
3 Results and Discussion
In the following, we first present in section 3.1 the results of the MD simulations for different interlamellar interface models, considering the effect of temperature, strain rate, and preexisting defects. In subsequent section 3.2, the calculation of TS parameters for cohesive zone models from the results of the MD simulations is pointed out. Finally, in section 3.3, we discuss the results of this procedure in more detail.
3.1 Molecular Dynamics Simulation Results
In the following, the separation behavior of
Type-1 Interface
Figure 4 shows the global stress normal to the interface
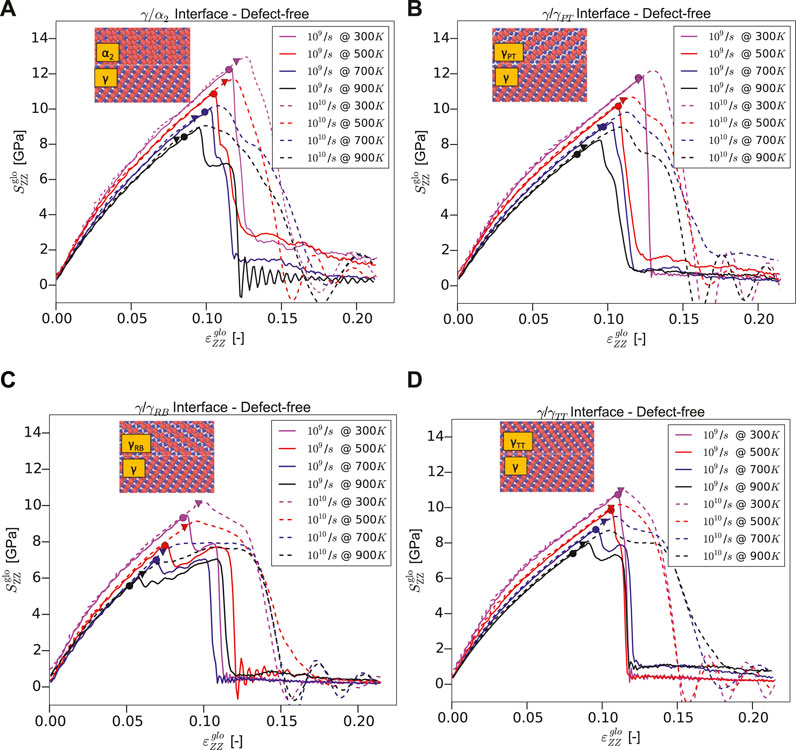
FIGURE 4. Stress–strain curves under normal loading for Type-1 models of (A)
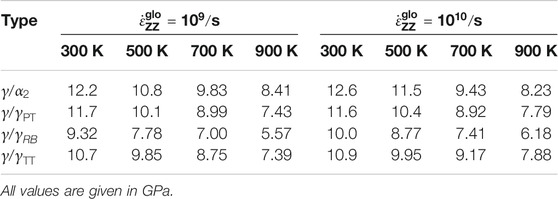
TABLE 1. Yield stress of Type-1 models for different temperatures and interface types at strain rates of
Some interface models (
In general, one can observe that a reduction of strain rate typically reduces the yield stress for the cases studied herein (see Table 1). This observation reaffirms the reported strain rate sensitivity (Spearot et al., 2009), that is, reduction in strain rate reduces the flow/nucleation stresses, typically for materials with reduced defect activation volumes in the nanoscale regime, for example, nano-twinned copper (Zhu et al., 2007). Especially when such small-volume materials are deformed to the elastic limit, the dislocation nucleates result from strain localization. It is worth emphasizing that the reduced activation volumes impact the nucleation stresses, making them susceptible to strain rate and temperature sensitivity (Zhu et al., 2008). Interestingly, MD simulations of a pure γ-phase show such a strain rate sensitivity by the authors Wu et al. (2016), who also rationalized the observation to some of the above sources (Zhu et al., 2007, 2008; Spearot et al., 2009). Similar to our observation in
Type-2 Interface
Figure 5 shows the global stress–strain curves for the Type-2 interface models, that is, with a preexisting void. The presence of the void type defect reduces the interface strength due to high local stress concentrations around the void and hence also the global load under which interatomic bonds break. Consequently, in comparison to the Type-1 models, the yield stress is reduced for all the interfaces and the high-stress regions near the void become the dominant dislocation sources. Such readily available dislocations lead to a more pronounced hardening after the yield stress has been reached compared to the Type-1 models. As in Type-1 models, the yield stress decreases also in Type-2 models with temperature (see Table 2). And again, it is highest for the
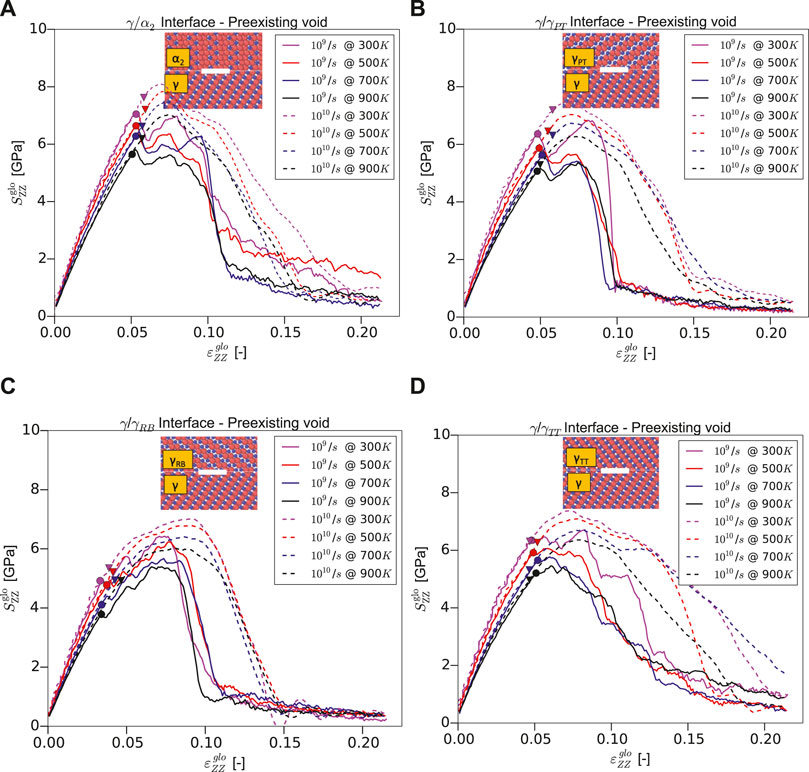
FIGURE 5. Stress–strain curves under normal loading for Type-2 models (with preexisting void) of (A)
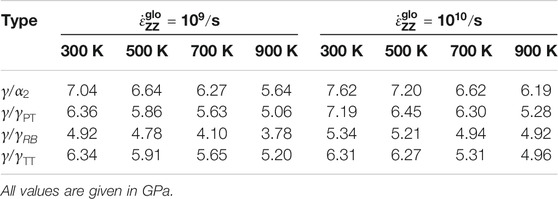
TABLE 2. Yield stress of Type-2 models for different temperatures and interface types at strain rates of
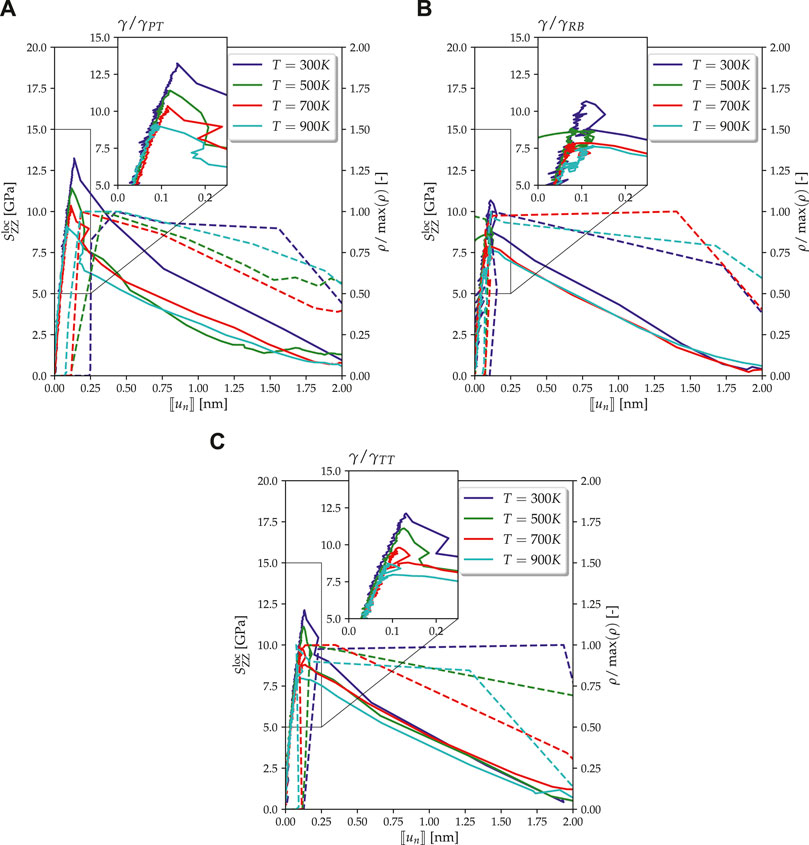
FIGURE 6. Traction–separation curves (solid lines) from MD simulations with strain rate
3.2 Traction–Separation Behavior of the Interfaces
As discussed above, TS curves, which form the core of cohesive zone models, can be extracted from MD simulations by fitting the parameters in the equations of the model to the
Type-1 Interface Models
First of all, it is important to note that not all configurations fail at the interface, namely, for the
The atomistically computed local TS curves are shown in Figure 6 for the different
The shape of the TS law has been fitted to the MD results shown in Figure 6, assuming a nonhardening interface for simplicity due to the brittle fracture observed in Figure 6. Anyway, for the initially undamaged interface, damage starts almost together with plasticity. Eventually, the following parameters had to be identified: the elastic parameter
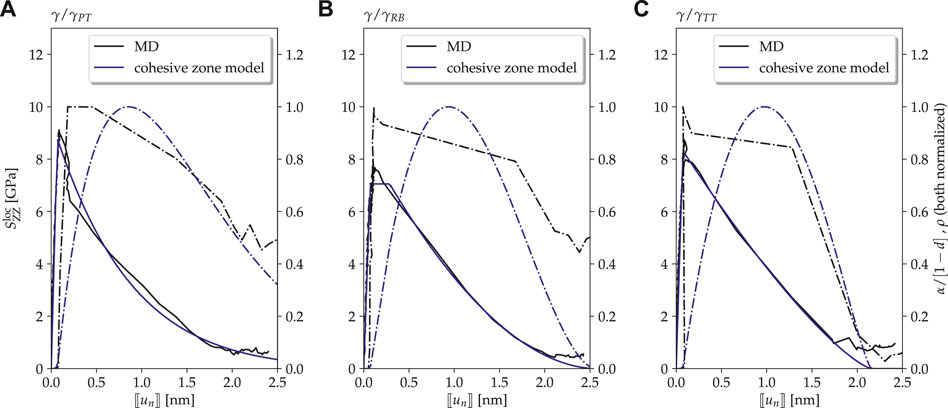
FIGURE 7. Defect-free case (Type-1 interface model): traction–separation curves as observed in MD simulations (solid black lines) compared to the ones of cohesive zone models with parameters fitted to the results of the MD simulations (solid blue lines) at a temperature
The agreement between MD simulations and the fitted cohesive zone models depicted in Figure 8 is in each case very good. Remarkably, this holds not only for the TS curves themselves but also for the normalized dislocation density in the MD simulations and the corresponding damage-corrected plastic separation
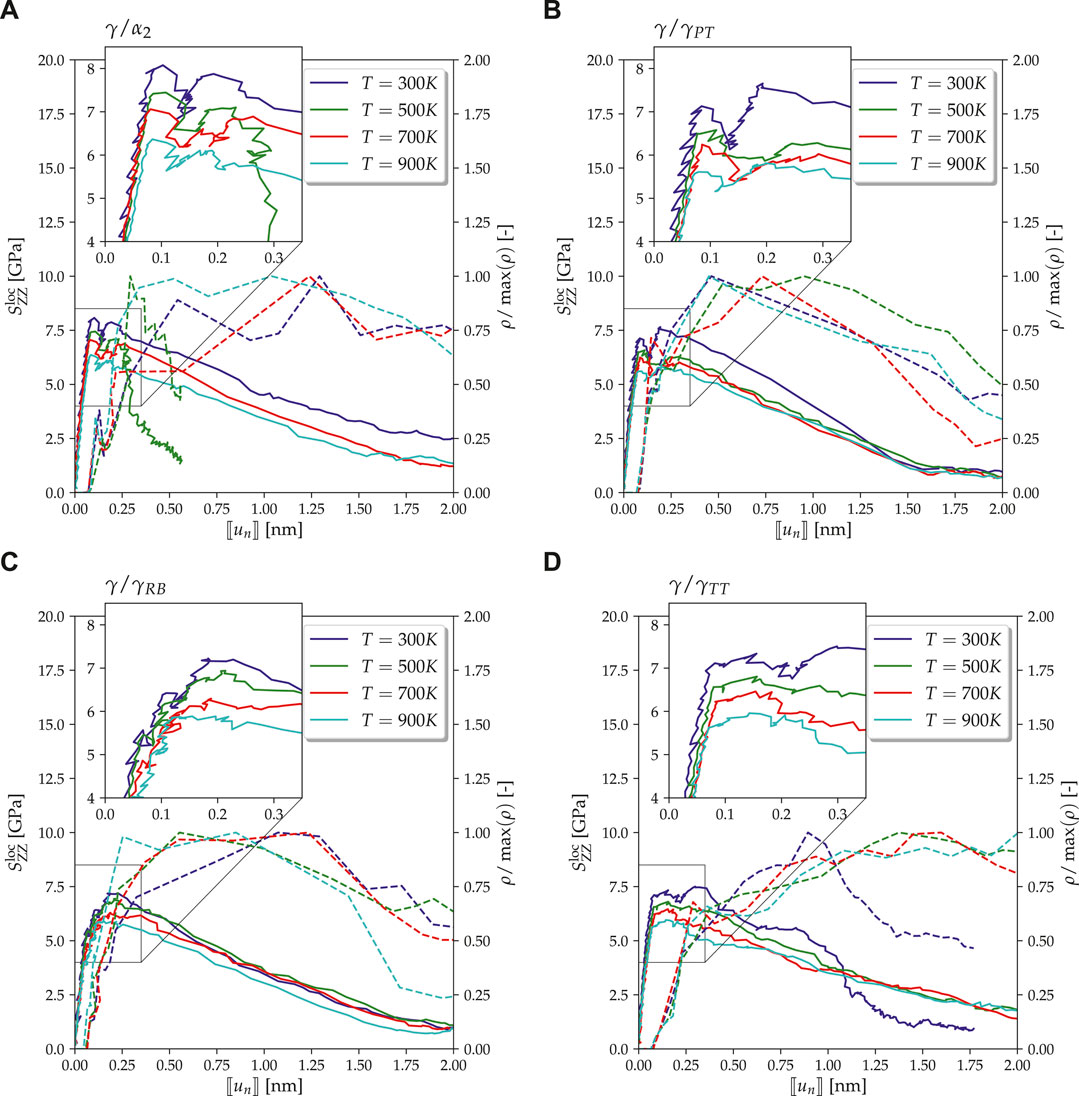
FIGURE 8. Traction‐separation curves (solid lines) from MD simulations with strain rate
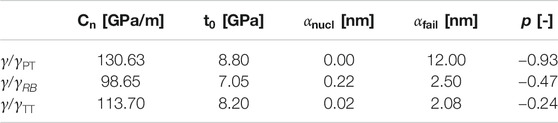
TABLE 3. Parameters of cohesive zone model for Type-1 interface models determined from fitting the results of MD simulations at
Type-2 Interface Models
Figure 7 shows the TS curves for the Type-2 interface models with the preexisting void for different temperatures as observed in MD simulations. These curves generally exhibit three regimes: in the first one, traction increases up to a certain peak value. In the second one, the traction remains on a high level with some fluctuation (which is not unusual for MD simulations), followed by a third regime where it finally decreases. While the elastic behavior and the general temperature dependence are similar to the Type-1 models, also characteristic differences are observed.
First of all, in contrast to Type-1 interface models, failure is always observed at the interface itself, also for the
As for the Type-1 models, the parameters of a cohesive zone model were fitted to the results of MD simulations for the Type-2 models (see Figure 9 for
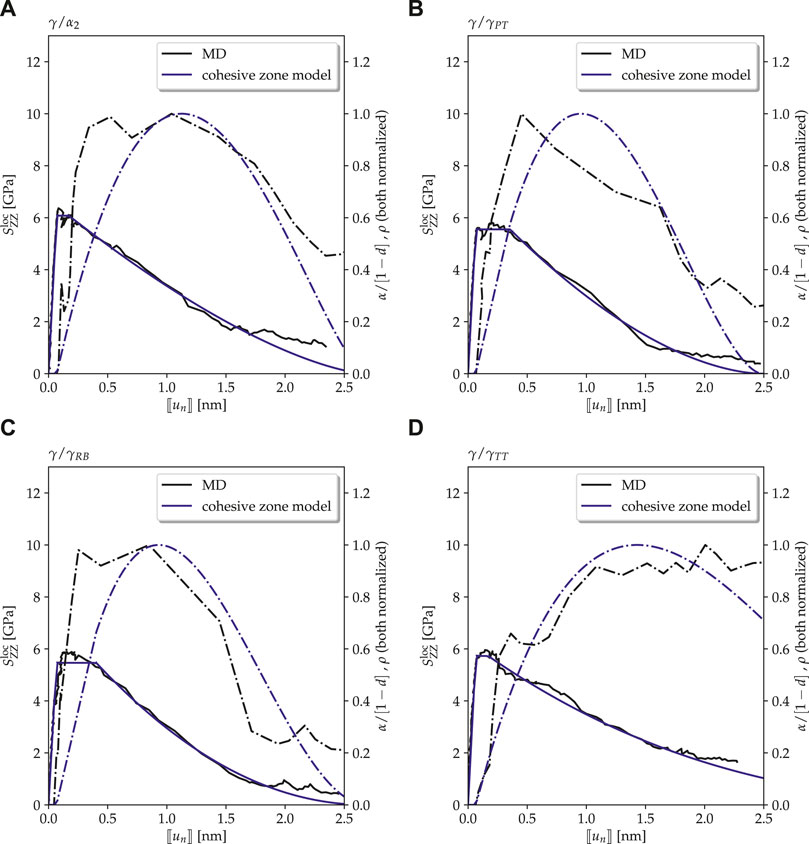
FIGURE 9. Interfaces with defects (Type-2 interface model): traction–separation curves as observed in MD simulations (solid black lines) compared to the ones of cohesive zone models with parameters fitted to the results of the MD simulations (solid blue lines) at a temperature
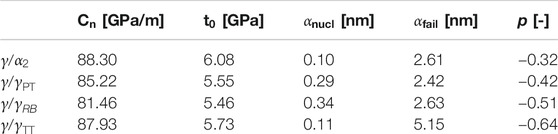
TABLE 4. Parameters of cohesive zone model for Type-2 interface models determined from fitting the results of MD simulations
3.3 Discussion
From the parameters identified for the different temperatures and interface types (Tables 3, 4; Supplementary Tables S1, S2 in Supplementary Material), it is possible to calculate the separation energies
with
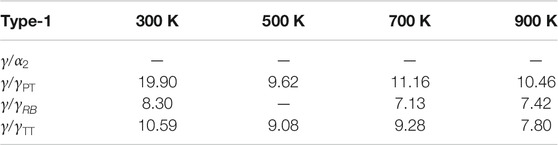
TABLE 5A. Separation energies
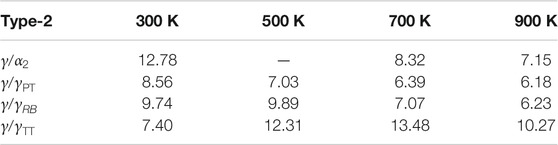
TABLE 5B.
A quantitative comparison of the cohesive zone model parameters with values from the literature is difficult due to the sparse data available. However, there are a few articles dealing with the strength of lamellar interfaces in γ-TiAl. A thorough combined experimental and numerical study was proposed by Werwer et al. (2007), where precracked PST (polysynthetically twinned) crystal specimens made of lamellar γ-TiAl were tested in different orientations at room temperature. Cohesive model parameters (i.e., cohesive strength and separation energy) for a TS law were determined by fitting fracture simulations to the experimental data. A very low cohesive strength of about 100 MPa was found, but the identified separation energies
An explanation why the strength observed in Werwer et al. (2007) is so much (roughly by a factor of 50) lower than the one determined herein (
In another investigation by Krull and Yuan (2011) on a similar but more ductile material, aluminum, the authors did not consider the size effect and also found unrealistically high values for the cohesive strength of more than 10 GPa.
For the computational results presented in this article, this means that the separation energies of the interface are most likely suitable for utilization in a continuum level finite element simulation where the interface may be discretized by interface elements. By contrast, for the cohesive strength, one should probably use much lower values than reported herein if the length of the cohesive finite elements used on the continuum scale is larger than the size of the K-dominated zone.
4 Summary and Conclusion
To summarize, the high-temperature deformation behavior of the Type-1 (defect-free) and Type-2 (preexisting void) single lamellar interface models (one
From this study, we can draw a number of conclusions on the MD simulations alone and some further conclusions on the derivation of TS curves from the atomistic simulations. In our simulations, the
In general, we observed in our simulations a quasi-brittle behavior with a sudden failure for the defect-free interface models, while a pronounced plasticity was observed for the more realistic interface models with a preexisting void. Beside the failure behavior, the evolution of the dislocation density was quantified by our simulations and it turned out that a dislocation burst at a high stress occurs for the defect-free case, while the dislocation density evolves gradually at lower stresses for interfaces with preexisting voids.
The evaluation of the damage behavior of the interface itself (with the effect of the bulk deformation having been eliminated by Eq. 16) revealed a TS behavior of the interface without significant elastic separation. Rather, the main contribution of the overall interface separation until failure came from interface plasticity and interface damage, which could be clearly distinguished in the TS law. Without elimination of the bulk deformation in our evaluation, a very different picture would have resulted where the TS curves would have exhibited a significant elastic regime. It is important to underline this because to the authors’ best knowledge, comparable studies of other groups where traction–separation laws were deduced from MD simulations did not eliminate the effect of bulk deformation from their calculations as we did above. Our study indeed suggests that doing so makes a substantial difference and would therefore be worthwhile to be taken into consideration also by other groups in future work to characterize the physical properties of interfaces more accurately. Matching cohesive zone models with the results of MD simulations, plasticity could be correlated with an increase in dislocation density in the MD simulations, which underlines that the differentiation between elastic and plastic separation in our cohesive zone models is not simply a mathematical trick to cover a wider range of functional relations but that it captures indeed a specific form of physics that can be clearly observed on the atomic scale. Particularly, the damage-corrected plastic separation
We also studied the effect of initial defects at the interface. They were found to decrease the interface strength as expected. However, for the interface separation energy, now such clear trend is observed in our MD simulations.
A comparison with results of other groups reported in the literature suggests that our MD simulations are suitable for identifying the interface separation energy correctly. By contrast, our results for the interface strength as observed in MD simulations should be taken with caution. They seem to overestimate the interface strength compared to experimental observations, possibly due to too small a simulation domain typical for nanoscale regime often covered in MD. This problem has also been encountered by others who tried to identify interface strengths by MD simulations, for example, for aluminum. Apparently, further research is required to overcome this key problem in the multi-scale simulation of materials.
Data Availability Statement
The raw data supporting the conclusions of this article will be made available by the authors, without undue reservation.
Author Contributions
HG is responsible for all MD simulations; IS is responsible for all cohesive zone modeling issues; CC supervised the modeling work and contributed to its interpretation as well as the preparation of the manuscript.
Conflict of Interest
The authors declare that the research was conducted in the absence of any commercial or financial relationships that could be construed as a potential conflict of interest.
Acknowledgments
The financial support by the IDEA framework within the Helmholtz-Zentrum Geesthacht is gratefully acknowledged. The authors thank Rebecca Janisch for providing some of the source construction scripts and for the fruitful discussions.
Supplementary Material
The Supplementary Material for this article can be found online at: https://www.frontiersin.org/articles/10.3389/fmats.2020.602567/full#supplementary-material.
Abbreviations
APB, Antiphase Boundary; CSF, complex stacking fault; CSP, centrosymmetry parameter; EAM, embedded-atom method; FL, fully lamellar; MD, molecular dynamics; PT, pseudo twin; RB, rotational boundary; SISF, super lattice intrinsic stacking fault; TS, traction separation; TT, true twin.
Footnotes
1except for the
References
Appel, F., Brossmann, U., Christoph, U., Eggert, S., Janschek, P., Lorenz, U., et al. (2000). Recent progress in the development of gamma titanium aluminide alloys. Adv. Eng. Mater. 2, 699–720. doi:10.1002/1527-2648(200011)2:11<699::aid-adem699>3.0.co;2-j
Appel, F., Clemens, H., and Fischer, F. D. (2016). Modeling concepts for intermetallic titanium aluminides. Prog. Mater. Sci. 81, 55–124. doi:10.1016/j.pmatsci.2016.01.001
Appel, F., Paul, J. D. H., and Oehring, M. (2011). Gamma titanium aluminide alloys: science and technology. Hoboken, New Jersey: John Wiley & Sons.
Barbi, N., Diologent, F., Goodall, R., and Mortensen, A. (2012). Fracture of convoluted and lamellar α2+ γ TiAl alloys. Intermetallics 22, 176–188. doi:10.1016/j.intermet.2011.11.001
Bewlay, B. P., Nag, S., Suzuki, A., and Weimer, M. J. (2016). TiAl alloys in commercial aircraft engines. Mater. at High. Temp. 33, 549–559. doi:10.1080/09603409.2016.1183068
Cai, W., Li, J., and Yip, S. (2012). “Molecular dynamics,” in Comprehensive nuclear materials. Editors J. M. K. Rudy (Oxford, UK: Elsevier), 249–265
Cao, H., Rui, Z., Chen, W., Feng, R., and Yan, C. (2019). Crack propagation mechanism of γ-TiAl alloy with pre-existing twin boundary. Sci. China Technol. Sci. 62, 1605–1615. doi:10.1007/s11431-017-9307-5
Clemens, H., and Mayer, S. (2013). Design, processing, microstructure, properties, and applications of advances intermetallic TiAl alloys. Adv. Eng. Mater. 15, 191–215. doi:10.1002/adem.201200231
Cornec, A., Scheider, I., and Schwalbe, K.-H. (2003). On the practical application of the cohesive model. Eng. Fract. Mech. 70, 1963–1987. doi:10.1016/s0013-7944(03)00134-6
Dandekar, C. R., and Shin, Y. C. (2011). Molecular dynamics based cohesive zone law for describing al–sic interface mechanics. Compos. Appl. Sci. Manuf. 42, 355–363. doi:10.1016/j.compositesa.2010.12.005
Daw, M. S., and Baskes, M. I. (1984). Embedded-atom method: derivation and application to impurities, surfaces, and other defects in metals. Phys. Rev. B 29, 6443. doi:10.1103/physrevb.29.6443
Dimiduk, D. M. (1999). Gamma titanium aluminide alloys – an assessment within the competition of aerospace structural materials. Mater. Sci. Eng.: A 263, 281–288. doi:10.1016/s0921-5093(98)01158-7
Ding, J., Tian, Y., Wang, L.-s., Huang, X., Zheng, H.-r., Song, K., et al. (2019). Micro-mechanism of the effect of grain size and temperature on the mechanical properties of polycrystalline TiAl. Comput. Mater. Sci. 158, 76–87. doi:10.1016/j.commatsci.2018.10.019
Feng, R., Song, W., Li, H., Qi, Y., Qiao, H., and Li, L. (2018). Effects of annealing on the residual stress in γ-TiAl alloy by molecular dynamics simulation. Materials. 11, 1025. doi:10.3390/ma11061025
Feng, R., Wang, M., Li, H., Qi, Y., Wang, Q., and Rui, Z. (2019). Micromechanism of cold deformation of two-phase polycrystalline Ti-Al alloy with void. Materials 12, 184. doi:10.3390/ma12010184
Gupta, P., Pal, S., and Yedla, N. (2016). Molecular dynamics based cohesive zone modeling of al (metal)–cu50zr50 (metallic glass) interfacial mechanical behavior and investigation of dissipative mechanisms. Mater. Des. 105, 41–50. doi:10.1016/j.matdes.2016.05.054
Hillerborg, A., Modéer, M., and Petersson, P.-E. (1976). Analysis of crack formation and crack growth in concrete by means of fracture mechanics and finite elements. Cement Concr. Res. 6, 773–781. doi:10.1016/0008-8846(76)90007-7
Hui, C., Zhiyuan, R., Wenke, C., Ruicheng, F., and Changfeng, Y. (2018). Deformation mechanisms in nanotwinned γ-TiAl by molecular dynamics simulation. Mol. Simulat. 44, 1489–1500. doi:10.1080/08927022.2018.1496248
Ji, Z.-W., Lu, S., Hu, Q.-m., Kim, D., Yang, R., and Vitos, L. (2018). Mapping deformation mechanisms in lamellar titanium aluminide. Acta Mater. 144, 835–843. doi:10.1016/j.actamat.2017.11.028
Jin, Z., and Gray, G. T. (1997). Experimental determination of domain orientations and domain orientation relationships across lamellar interfaces in polysynthetically twinned TiAl crystals. Mate. Sci. Eng.: A 231, 62–71. doi:10.1016/s0921-5093(97)00036-1
Kanani, M., Hartmaier, A., and Janisch, R. (2016). Stacking fault based analysis of shear mechanisms at interfaces in lamellar TiAl alloys. Acta Mater. 106, 208–218. doi:10.1016/j.actamat.2015.11.047
Kim, Y.-K., Kim, H.-K., Jung, W.-S., and Lee, B.-J. (2016). Atomistic modeling of the Ti-Al binary system. Comput. Mater. Sci. 119, 1–8. doi:10.1016/j.commatsci.2016.03.038
Kim, Y.-W., and Dimiduk, D. M. (1991). Progress in the understanding of gamma titanium aluminides. JOM 43, 40–47. doi:10.1007/bf03221103
Kiselev, S. P., and Zhirov, E. V. (2014). Molecular-dynamics simulation of the synthesis of intermetallic Ti-Al. Intermetallics 49, 106–114. doi:10.1016/j.intermet.2014.01.008
Krull, H., and Yuan, H. (2011). Suggestions to the cohesive traction–separation law from atomistic simulations. Eng. Fract. Mech. 78, 525–533. doi:10.1016/j.engfracmech.2009.12.014
Li, H., and Chandra, N. (2003). Analysis of crack growth and crack-tip plasticity in ductile materials using cohesive zone models. Int. J. Plast. 19, 849–882. doi:10.1016/s0749-6419(02)00008-6
Li, P.-t., Yang, Y.-Q., Xia, Z., Luo, X., Jin, N., Gao, Y., et al. (2017). Molecular dynamic simulation of nanocrystal formation and tensile deformation of TiAl alloy. RSC Adv. 7, 48315–48323. doi:10.1039/c7ra10010h
Li, W., Yin, Y., Xu, Q., Zhou, J., Nan, H., Ji, X., et al. (2019). Tensile behavior of γ/α2 interface system in lamellar TiAl alloy via molecular dynamics. Comput. Mater. Sci. 159, 397–402. doi:10.1016/j.commatsci.2018.12.043
Li, W., Yu, W., Xu, Q., Zhou, J., Nan, H., Yin, Y., et al. (2020). Effects of γ/γ interfaces in TiAl lamellae subjected to uniaxial tensile loading. Comput. Mater. Sci. 172, 109361. doi:10.1016/j.commatsci.2019.109361
Möller, J. J., Bitzek, E., Janisch, R., ul Hassan, H., and Hartmaier, A. (2018). Fracture ab initio: a force-based scaling law for atomistically informed continuum models. J. Mater. Res. 33, 3750–3761. doi:10.1557/jmr.2018.384
Maugin, G. A. (1992). The thermomechanics of plasticity and fracture. Cambridge, UK: Cambridge University Press, Vol. 7.
Paggi, M., and Wriggers, P. (2011). A nonlocal cohesive zone model for finite thickness interfaces – part i: mathematical formulation and validation with molecular dynamics. Comput. Mater. Sci. 50, 1625–1633. doi:10.1016/j.commatsci.2010.12.024
Park, K., and Paulino, G. (2011). Cohesive zone models: a critical review of traction-separation relationships across fracture surface. Appl. Mech. Rev. 64, 060802. doi:10.1115/1.4023110
Plimpton, S. (1995). Fast parallel algorithms for short-range molecular dynamics. J. Comput. Phys. 117, 1–19. doi:10.1006/jcph.1995.1039
Scheider, I. (2018). Numerical simulation of material separation using cohesive zone models. Singapore: Springer, Vol. 1, 1–42
Scheider, I. (2020). [Dataset]. Code for Quantifying the high-temperature separation behavior of lamellar interfaces in γ-TiAl under tensile loading by molecular dynamics. doi:10.5281/zenodo.4066828
Scheider, I. (2009a). Derivation of separation laws for cohesive models in the course of ductile fracture. Eng. Fract. Mech. 76, 1450–1459. doi:10.1016/j.engfracmech.2008.12.006
Scheider, I. (2009b). Micromechanical based derivation of traction-separation laws for cohesive model simulations. Procedia Eng. 1 (1), 17–21. doi:10.1016/j.proeng.2009.06.006
Schnabel, J., and Bargmann, S. (2017). Accessing colony boundary strengthening of fully lamellar TiAl alloys via micromechanical modeling. Materials 10, 896. doi:10.3390/ma10080896
Schnabel, J., and Scheider, I. (Forthcoming 2020). Crystal plasticity modeling of creep in alloys with lamellar microstructures at the example of fully lamellar TiAl. Front. Mater. doi:10.3389/fmats.2020.581187
Scipy (2020). Optimization and root finding (scipy.optimize) — scipy v1.4.1 reference guide. Available at: https://docs.scipy.org/doc/scipy/reference/optimize.html.
Simonovski, I., and Cizelj, L. (2015). Cohesive zone modeling of intergranular cracking in polycrystalline aggregates. Nucl. Eng. Des. 283, 139–147. doi:10.1016/j.nucengdes.2014.09.041
Spearot, D. E., Tschopp, M. A., and McDowell, D. L. (2009). Orientation and rate dependence of dislocation nucleation stress computed using molecular dynamics. Scripta Mater. 60, 675–678. doi:10.1016/j.scriptamat.2008.12.037
Stukowski, A., and Albe, K. (2010). Dislocation detection algorithm for atomistic simulations. Model. Simulat. Mater. Sci. Eng. 18, 025016. doi:10.1088/0965-0393/18/2/025016
Stukowski, A. (2009). Visualization and analysis of atomistic simulation data with ovito–the open visualization tool. Model. Simulat. Mater. Sci. Eng. 18, 015012. doi:10.1088/0965-0393/18/1/015012
Thompson, A. P., Plimpton, S. J., and Mattson, W. (2009). General formulation of pressure and stress tensor for arbitrary many-body interaction potentials under periodic boundary conditions. J. Chem. Phys. 131, 154107. doi:10.1063/1.3245303
Wei, Y., Gao, H., and Bower, A. F. (2009). Numerical simulations of crack deflection at a twist-misoriented grain boundary between two ideally brittle crystals. J. Mech. Phys. Solid 57, 1865–1879. doi:10.1016/j.jmps.2009.07.007
Werwer, M., and Cornec, A. (2000). Numerical simulation of plastic deformation and fracture in polysynthetically twinned (PST) crystals of TiAl. Comput. Mater. Sci. 19, 97–107. doi:10.1016/s0927-0256(00)00144-0
Werwer, M., Kabir, R., Cornec, A., and Schwalbe, K.-H. (2007). Fracture in lamellar TiAl simulated with the cohesive model. Eng. Fract. Mech. 74, 2615–2638. doi:10.1016/j.engfracmech.2006.09.022
Wu, H., Xu, D., Wang, H., and Yang, R. (2016). Molecular dynamics simulation of tensile deformation and fracture of γ-TiAl with and without surface defects. J. Mater. Sci. Technol. 32, 1033–1042. doi:10.1016/j.jmst.2015.12.001
Xie, Z.-C., Gao, T.-H., Guo, X.-T., and Xie, Q. (2015). Molecular dynamics simulation of nanocrystal formation and deformation behavior of Ti3Al alloy. Comput. Mater. Sci. 98, 245–251. doi:10.1016/j.commatsci.2014.10.012
Yamakov, V., Saether, E., Phillips, D. R., and Glaessgen, E. H. (2006). Molecular-dynamics simulation-based cohesive zone representation of intergranular fracture processes in aluminum. J. Mech. Phys. Solid 54, 1899–1928. doi:10.1016/j.jmps.2006.03.004
Zhou, L., Hsiung, L., and Huang, H. (2004). Nucleation and propagation of deformation twin in polysynthetically twinned TiAl. Comput. Model. Eng. Sci. 16, 245–252. doi:10.3970/CMES.2004.006.245
Zhou, X. W., Moody, N. R., Jones, R. E., Zimmerman, J. A., and Reedy, E. D. (2009). Molecular-dynamics-based cohesive zone law for brittle interfacial fracture under mixed loading conditions: effects of elastic constant mismatch. Acta Mater. 57, 4671–4686. doi:10.1016/j.actamat.2009.06.023
Zhou, X. W., Zimmerman, J. A., Reedy, E. D., and Moody, N. R. (2008). Molecular dynamics simulation based cohesive surface representation of mixed mode fracture. Mech. Mater. 40, 832–845. doi:10.1016/j.mechmat.2008.05.001
Zhu, T., Li, J., Samanta, A., Kim, H. G., and Suresh, S. (2007). Interfacial plasticity governs strain rate sensitivity and ductility in nanostructured metals. Proc. Natl. Acad. Sci. U S A 104, 3031–3036. doi:10.1073/pnas.0611097104
Zhu, T., Li, J., Samanta, A., Leach, A., and Gall, K. (2008). Temperature and strain-rate dependence of surface dislocation nucleation. Phys. Rev. Lett. 100, 025502. doi:10.1103/physrevlett.100.025502
Keywords: lamellar interface, γ-titanium aluminide, high-temperature deformation, traction–separation, cohesive zone, molecular dynamics
Citation: Ganesan H, Scheider I and Cyron CJ (2021) Quantifying the High-Temperature Separation Behavior of Lamellar Interfaces in γ-Titanium Aluminide Under Tensile Loading by Molecular Dynamics. Front. Mater. 7:602567. doi: 10.3389/fmats.2020.602567
Received: 03 September 2020; Accepted: 12 October 2020;
Published: 14 January 2021.
Edited by:
Demircan Canadinc, Koç University, TurkeyReviewed by:
Sidika Mine Toker, Eskişehir Osmangazi University, TurkeyMehmet Dorduncu, Erciyes University, Turkey
Copyright © 2021 Ganesan, Scheider and Cyron. This is an open-access article distributed under the terms of the Creative Commons Attribution License (CC BY). The use, distribution or reproduction in other forums is permitted, provided the original author(s) and the copyright owner(s) are credited and that the original publication in this journal is cited, in accordance with accepted academic practice. No use, distribution or reproduction is permitted which does not comply with these terms.
*Correspondence: Hariprasath Ganesan, aGFyaXByYXNhdGguZ2FuZXNhbkBoemcuZGU=