 Yan Shi
 Xiang Li
- Changjiang River Scientific Research Institute, Research Center of Water Engineering Safety and Disaster Prevention of Ministry of Water Resources, Wuhan, China
The effects of the tuff powder which is produced from southwestern China on cement mortars fluidity, compressive strength (
Introduction
Tuff is a natural pozzolanic material (Reported by ACI committee 116, 2005) with pozzolanic activity, bedded structures and diverse colors. The tuff can be classified as crystal tuff, vitric tuff, and lithic tuff in terms of the composition of volcanic debris.
As a supplementary cementing material, tuff powder has been extensively studied and widely applied. B.Liguori, Ahmet Cavdar, etc. (Liguori et al., 2015; Cavdar and Yetgin, 2007; Vigil de la Villa et al., 2009) discovered and proved that the zeolite-type tuff powder from Turkey, Cuba and other places had pozzolanic activities and proposed that it was feasible to manufacture an environmentally friendly composite cement by using this zeolite-type tuff powder. A.G. Turkmenoglu and Tankut (2002) studied the mechanical strength of mortar added with tuff power and found that the clay minerals and zeolites in the mortar were formed by the alteration of volcanic glass, which was the most reactive phase and efficient in reducing mechanical property. The alteration also caused the enrichment of tuff power relative to alkali content. Li et al. (Xiang et al., 2017; Xiang et al., 2018) proposed that the morphological effect and micro-aggregate effect of the tuff power were primarily active at the early stage of hydration in the case of tuff power as a mineral admixture in concrete. Moreover, the pozzolanic activity of tuff powder was inferior to that of high-quality Class F fly ash. With increasing replacement rate of cement by tuff powder, the compressive strength (
Tuff powder has been successfully applied in hydraulic projects in China in recent years. The application of the tuff powder in hydraulic concrete is of huge benefits and advantages, which include improved crack resistance of concrete, simplified temperature control measures, shorter construction period, and lower overall costs. For instance, in the Manwan hydropower project, a gravity dam with a maximum dam height of 132 m located in southwestern China (Yusheng et al., 1992), nearly 110,000 tons of tuff powder was used for dam concrete, which saved at least 1 million dollars in project cost. In a further example, for the Dachaoshan hydropower project, a roller-compacted concrete gravity dam with a maximum dam height of 115 m in the southwest of China, a region where the fly ash resources are quite scare, approximately 100,000 tons of the combination of phosphorous slag powder and tuff powder at a constant ratio of 1:1 by weight was used (Zhongzheng and Cairong, 1999; Yiren and Xiaolin, 2000).
In this paper, the effects of the tuff powder sourced from southwestern China on cement mortar fluidity,
Materials and Experimental Methods
Raw Materials
The raw materials used in this study included moderate-heat Portland cement (P·MH 42.5), tuff powder and ISO standard sand. The chemical compositions of powder materials were presented in Table 1. The tuff was produced in a region in southwest China, and it was ground into powder before use. It can be seen from Table 1 that the total amount of SiO2, Al2O3 and Fe2O3 of tuff powder exceeds 70%, the amount of SO3 is no more than 4.0%, and the loss of ignition is no more than 10.0%. The chemical compositions meet the requirements for a pozzolanic material according to ASTM C618 (Standard specifications for fly ash and raw and calcined natural pozzolan for use as a mineral admixture in portland cement concrete, 2000).
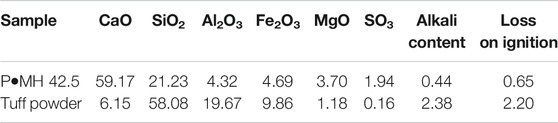
TABLE 1. Chemical compositions of cement and tuff powder (wt.%).
The test results of physical properties of tuff powder are shown in Table 2, and all the results comply with the relevant requirements of DL/T 5273-2012 for natural pozzolanic materials (DL/T 5273-2012, 2012). The water requirement ratio is the ratio of water requirements of a test mortar to a reference mortar under the same fluidity. The activity index is the ratio of
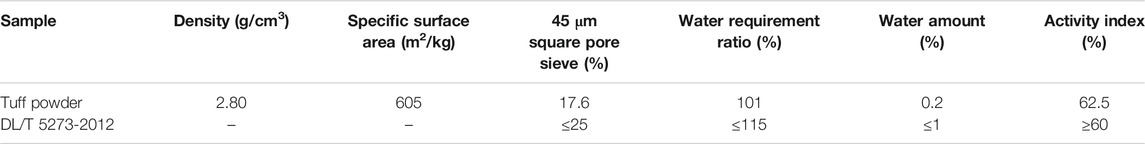
TABLE 2. The physical properties of tuff powder.
Thin slices of the tuff were placed under a polarizing microscope and the mineral phase of the tuff was identified. The polarizing micrographs are displayed in Figure 1. The results show that the tuff rock has a palimpsest texture with a massive structure, and it is identified as a black-green metamorphic basaltic crystal tuff. Crystal debris accounts for about 73% of the tuff rock, disorderly distributed in metamorphic ashes. The main component is plagioclase with a small amount of pyroxene. Basalt debris makes up for about 2%, and the matrix has already been altered. Metamorphic volcanic ash constitutes about 25%, and all of them have been altered. The minerals formed include fibrous uralite, zoisite, irregular black iron sericite, cryptotaxis, etc.
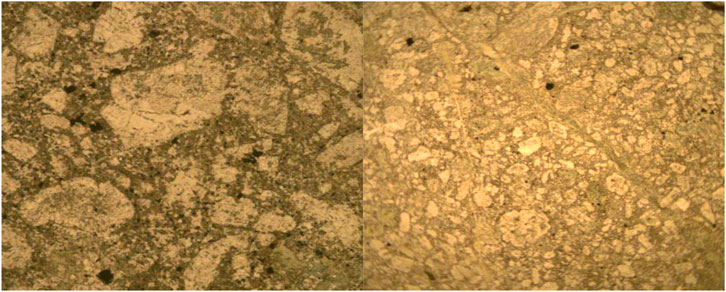
FIGURE 1. Polarizing Micrographs of Tuff.
The SEM images of tuff powder are shown in Figure 2. It can be seen that after mechanical grinding, the tuff powder particles become fragmented and clastic, with particle sizes less than 10 µm.
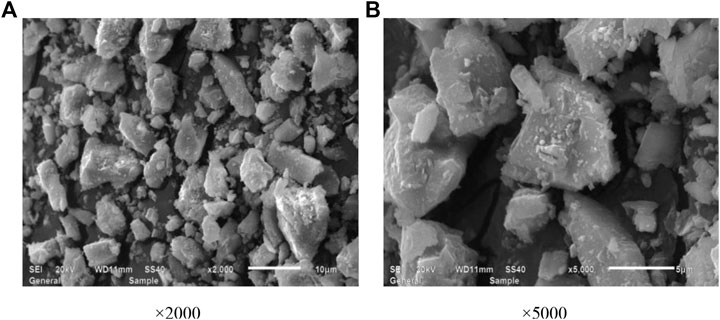
FIGURE 2. SEM Images of Tuff Powder.
Experimental Methods
According to GB/T 2419-2005 “Test Method for Fluidity of Cement Mortar” (GB/T 2419-2005, 2005) and GB/T 17671-1999 “Test Method for Strength of Cement Mortar” (GB/T 17671-1999, 1999), the fluidity and
Where
According to JC/T 603-2004 “Test Method for Dry Shrinkage of Cement Mortar” (JC/T 603-2004, 2004), the dry shrinkage deformations of tuff powder-cement mortar were tested. The binder-sand mass ratio of the mortars was 1:2. The water consumption of the mortar was determined by achieving a mortar fluidity of 130–140 mm. The size of the mortar specimens was 25 mm × 25 mm × 280 mm. After two days of water curing, the initial lengths of the mortar specimens were measured. Then the specimens were moved and stored in a dry room with a relative humidity of 50% ± 4% until tested. The shrinkage rate of cement mortar could be calculated according to Eq. (2):
Where L0 is the initial length of specimen (mm), Lt is the length of specimen at t days (mm), and 250 is the effective length of specimen (mm).
The mixing amount of tuff powder-cement paste used for microstructure tests is depicted in Table 3. The ratio of water to binder was 0.35. The cement paste was placed in a 5 ml centrifuge tube, and then sealed and kept in a standard curing room at a temperature of 20 ± 1°C with a relative humidity greater than 90%. The specimens were crushed by a hammer at 7, 28, 90 and 180 days, and some pieces in the middle part of the specimen were immersed in absolute ethanol to stop hydration. Particles with sizes around 5 mm were selected for MIP and SEM analysis. Powder ground from particle were used for XRD testing.
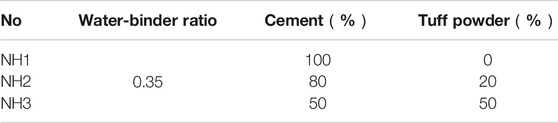
TABLE 3. Mixture proportion of tuff powder-cement paste.
The internal pore structure of tuff powder-cement paste was measured by using MIP, which enabled the measurement of pore sizes ranging from 3 nm to 100 µm. The morphology of hydration products at different curing ages was characterized using SEM with a resolution of 3 nm and a magnification between 18 times and 300,000 times. An X-ray diffractometer was used to test the type and content of crystalline phases in the hydrated products.
The porosity of the hardened paste could be calculated according to Eq.(3) based on the cumulative pore volume and volume density.
Where VTIV is the cumulative pore volume (mm3/g), ρbulk is the bulk density (g/ml) and Φpore is the porosity of the hardened paste (%).
Results and Discussion
Fluidity of Tuff Powder-Cement Mortar
The test results of fluidity of tuff powder-cement mortar are shown in Figure 3. It can be seen that with the increase of the mixing amount of tuff powder, the fluidity of cement mortar first increases and then decreases, and the maximum value occurrs when the mixing amount is 10%. When the amount of tuff powder is less than 10%, the tuff powder has a slight water-reducing effect, resulting in an increased fluidity. When the tuff powder content is in excess of 10%, it can increase the adhesion and the yield shear stress of the cement mortar, thus decreasing the fluidity.
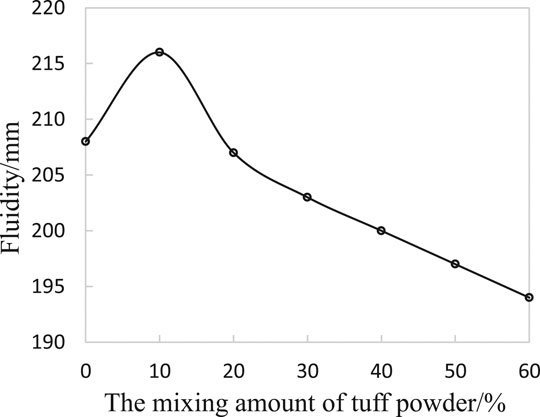
FIGURE 3. The test results of fluidity of tuff powder-cement mortar.
The test results of
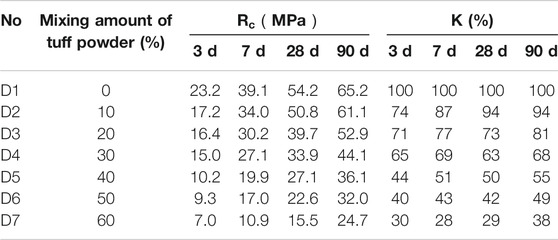
TABLE 4. The
As can be seen from Table 4, the increase in curing age is accompanied by the steady increase of the
Dry Shrinkage Deformation of Tuff Powder-Cement Mortar
The test results of the dry shrinkage rate of tuff powder-cement mortar are demonstrated in Figure 4.
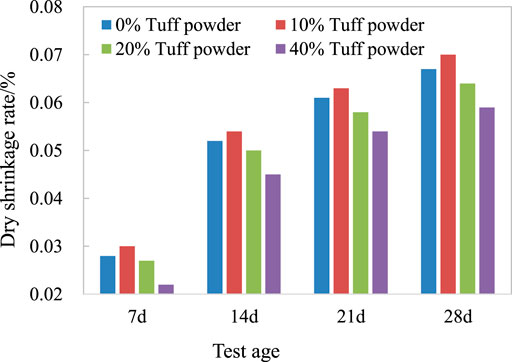
FIGURE 4. The dry shrinkage rates of tuff powder-cement mortar.
It can be seen that with the increase of the mixing amount of tuff powder, the shrinkage rates of mortar specimens fall after the first rise, which is similar to the trend of mortar fluidity, and the inflection point occurs when the amount is 10%. When the content of tuff powder is 20%, the early shrinkage of the test mortar is equivalent to that of the pure cement paste, except that the former is slightly lower in the later period. Therefore, the lower amount of tuff powder could increase the shrinkage of the hardened paste, while a relative higher content of more than 20% could inhibit the shrinkage development of the hardened paste to a certain extent.
The dry shrinkage test was performed under the condition of maintaining a certain degree of mortar fluidity. It can be seen from 3.1 that when the water-binder ratio is fixed and the tuff mixing amount is 10%, the fluidity of tuff powder-cement mortar is the greatest. As a result, under such conditions, the water consumption of the molded dry shrinkage mortar is at the minimum level, and the mixing amount of the cementitious materials is at the maximum, causing the dry shrinkage value of the hardened specimen to be at the largest value. Based on the above mortar test results, it is applicable to control the amount of tuff powder to be within 20%, which causes little effect on the fluidity and dry shrinkage of the mortar, while consistently maintaining the
MIP Results
The differential pore size distribution curves of tuff powder-cement hardened paste at different curing ages are provided in Figure 5. The changes of critical pore size with curing age and the amount of tuff powder are revealed in Figure 6. At a certain pore size, the differential curve after derivation of the cumulative pore volume could reflect the pore size distribution of the hardened paste. The pore size corresponding to the peak on the curve in Figure 5 is the critical pore size according to Refs (Wu et al., 2016; Flores et al., 2017). As the peak shifts to the right, the critical pore size becomes larger. Therefore, it can be indicated that the critical pore size gradually declines with the age, while larger tuff powder content allows for greater critical pore size.
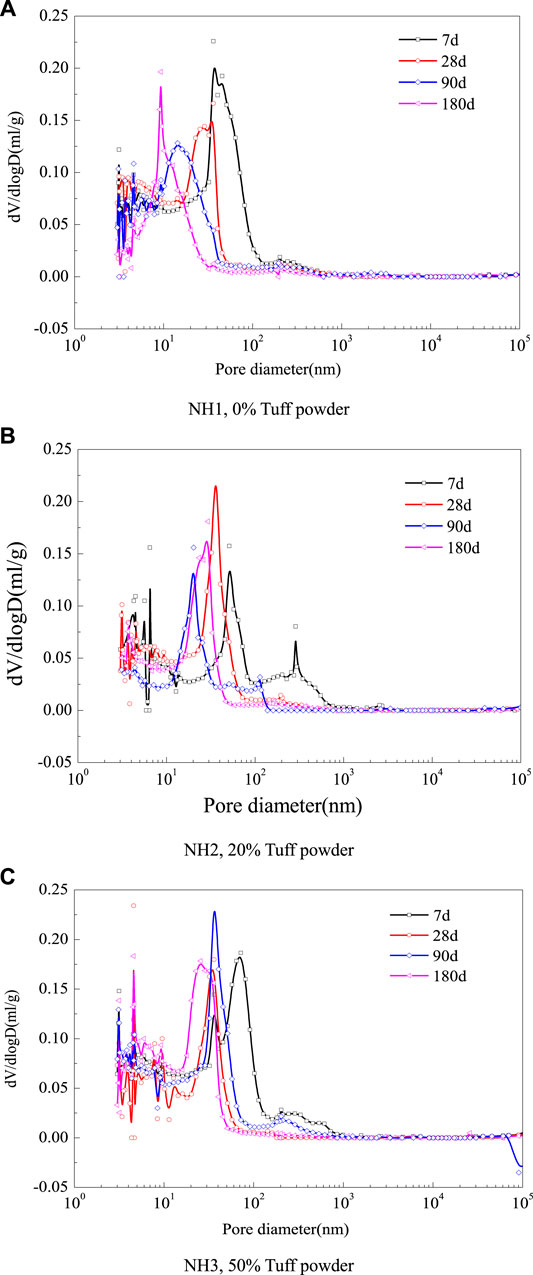
FIGURE 5. The differential pore size distribution curves of tuff powder-cement hardened paste.
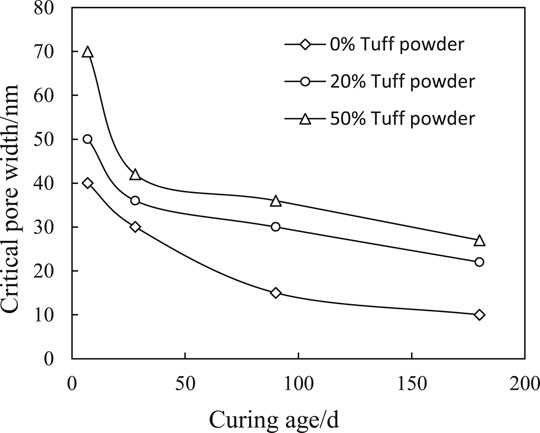
FIGURE 6. The changes of critical pore size with curing age and the amount of tuff powder.
The effects of the addition of tuff powder on the porosity of the paste are shown in Figure 7. The results indicate that as the curing age increases, the hardened paste is continuously filled with hydration products, and the most probable pore size of each sample gradually decreases. At the same time, the paste porosity also gradually decreases, and the harmless pores increases while larger pores gradually decreases. At the hydration age of 180 days, the total porosity of all samples is less than 20%, which has a high density. When the tuff powder mixing amount is 20%, the early porosity of the slurry decreases slightly, but with the increase of the tuff powder amount, the porosity of the hardened slurry gradually increases. When the amount is 50%, the porosity exceeds 30% at 7 days.
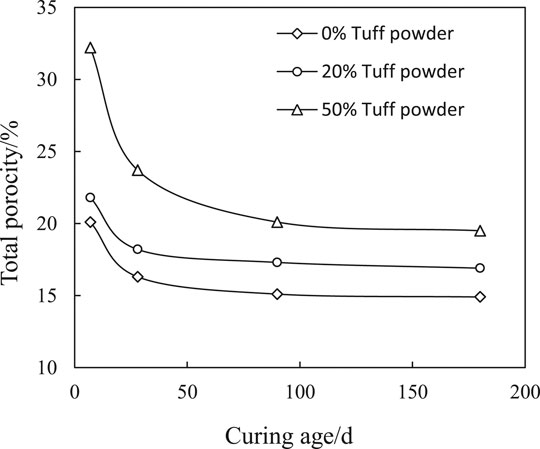
FIGURE 7. The total porosity of tuff powder-cement hardened paste at different curing ages.
Mehta and Monteiro (2006) classified the pores in concrete into four grades according to the pore size: below 4.5 nm, 4.5–50 nm, 50–100 nm, and above 100 nm. Pores above 100 nm were considered as harmful pores, which affected the strength and permeability of concrete, while pores below 100 nm were considered as little harmful or harmless pores. Zhongwei and Huizhen (1999) divided the pores into harmless pores (below 20 nm), little harmful pores (20–100 nm), harmful pores (100–200 nm) and more harmful pores (above 200 nm) according to the damage degree of pore size to concrete properties. It was also proposed that increasing the pores sized below 50 nm and reducing the pores sized above 100 nm could improve the performance of concrete. In this study, the pores are classified combining the above two classification methods as below 5 nm, 5 –20 nm, 20 –50 nm, 50 –100 nm, 100 –200 nm, and above 200 nm. The pore structure and pore size distribution of the tuff powder-cement hardened paste are investigated and shown in Table 5.
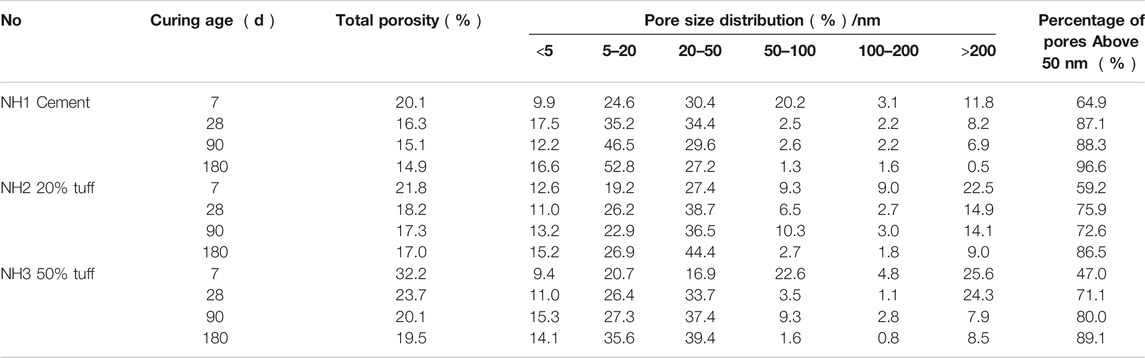
TABLE 5. The pore structure and size distribution of the tuff powder-cement hardened paste.
It can be inferred from Table 5 that at the hydration age of 7 days, the amount of tuff powder increases the fraction of macropores above 100 nm, and reduces the fraction of little harmful (20–100 nm) and harmless pores (below 20 nm) in the hardened paste. The greater the amount of admixture, the more significant this trend is. As the curing age increases, the pore size gradually becomes smaller, especially the samples with larger porosity in the early age. At the hydration age of 180 days, the most probable pore sizes in samples are primarily within the range of 5–50 nm. It could be seen that the mixing of tuff powder deteriorates the pore structure of paste to a certain extent at the early age. However, as the age increases, the refinement of the overall pore structure is observed, which is beneficial to material durability. Therefore, the amount of tuff powder should be controlled within 20% in order to reduce the adverse effects on the pore structure and ensure the mechanical and durability properties of the material.
XRD and SEM Results
At the hydration age of 180 days, the XRD patterns of cement pastes with different amounts of tuff powder are shown in Figure 8. According to the position and intensity of the diffraction peaks, it is known that there are cement hydration product Ca(OH)2 crystals, a small amount of ettringite and unhydrated clinker phases (C3S and C2S) in the three groups of specimens. In addition, there are feldspar and low-temperature quartz in the cement paste mixed with tuff powders (red and blue curves in Figure 8), and the greater the amount of tuff powder, the higher the peak value of the two components. It can be seen that when the tuff powder is added, the type of cement hydration product remains unchanged, and the decrease in the amount of Ca(OH)2 iss also very slight, indicating that the pozzolanic activity of the tuff powder iss lower, and the consumption of Ca(OH)2 through secondary hydration reaction is very limited.
(Where CH is Ca(OH)2,S is low-temperature quartz, F is feldspar,A is C3S,and B is C2S).
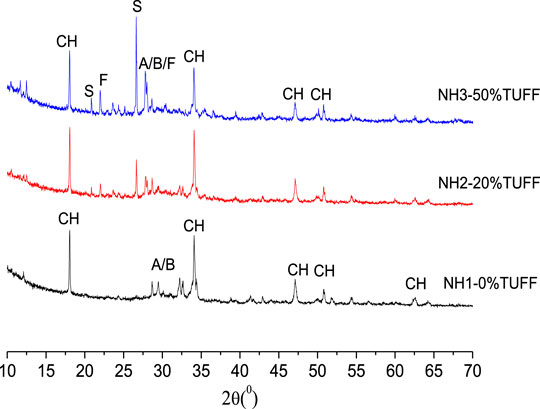
FIGURE 8. The XRD patterns of tuff powder-cement hardened paste at the hydration age of 180 days.
Observation on microscopic morphology of the fresh fracture of the hardened paste could provide a more intuitive understanding of the formation process of the paste microstructure. The SEM images of the tuff powder-cement paste at different curing ages are presented in Figures 9-11.
At the hydration age of 7 days (Figure 9), it could be seen that in addition to unhydrated cement particle, different kinds of hydration products such as the C-S-H gel, Ca(OH)2, Aft (ettringite) or AFm (calcium monosulfate aluminate hydrate) appears, which overlaps each other to quickly form a more stable microstructure in the cement paste. From Figures 9A and 10A, it could be observed that the clastic tuff powder particles are dispersed into the paste. The filling effect of tuff powder particles might improve the microstructure of hardened paste. When the amount of tuff powder is 50%, the paste structure becomes loose and the porosity increases, which is consistent with the law of
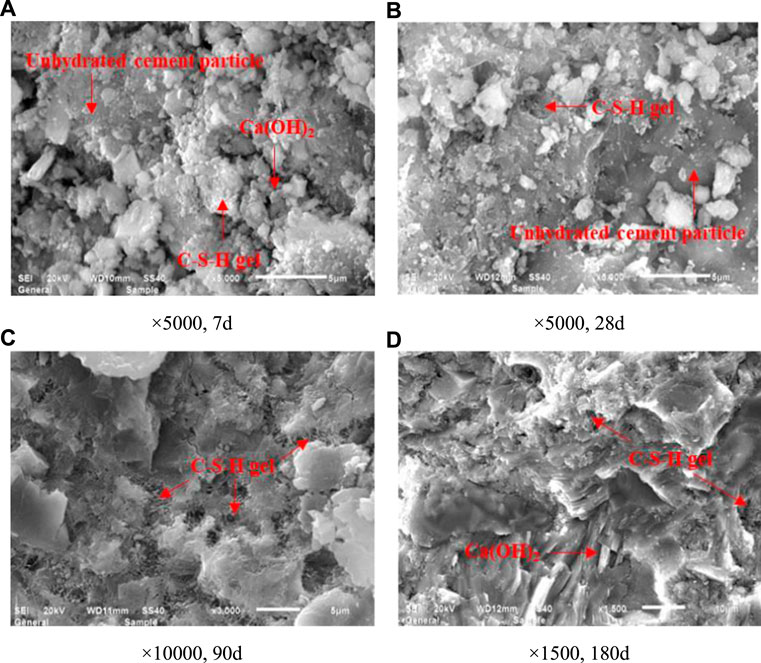
FIGURE 9. SEM images of hardened paste of NH1 (0% Tuff powder).
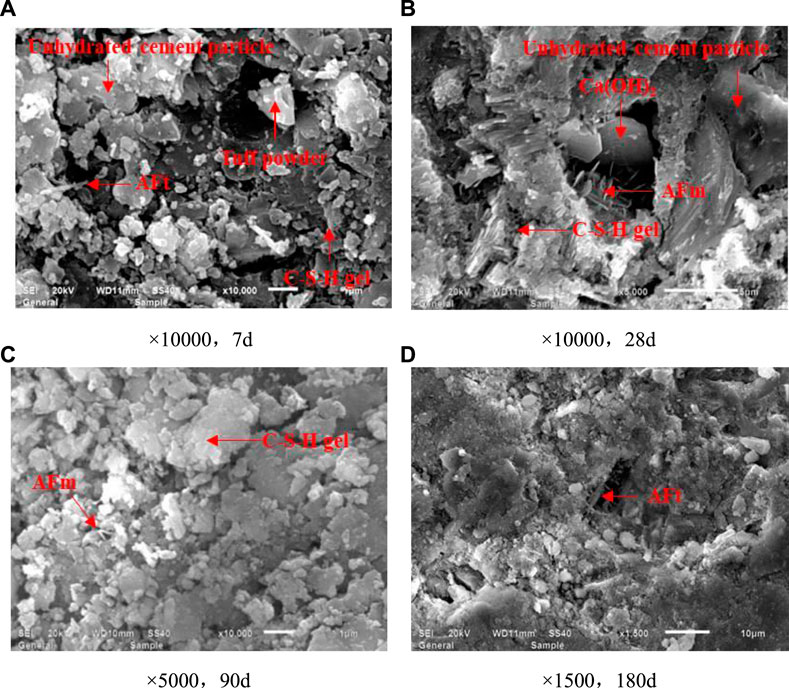
FIGURE 10. SEM images of hardened paste of NH2 (20% Tuff powder).
At the hydration age of 28 days, the microstructure of the hardened paste became denser. From Figures 10B and 11B, it can be seen that the fibrous or gelatinous hydration products attaches to the surface of the tuff particles and intersects each other to form a network structure, which also allows the tuff particles to be connected with the surrounding paste, and has a micro-aggregate effect. At this stage, there is a small number of Ca(OH)2 hexagonal crystals grown in a lamellar shape, which merges well with C-S-H gels, unreacted clinker and tuff particles.
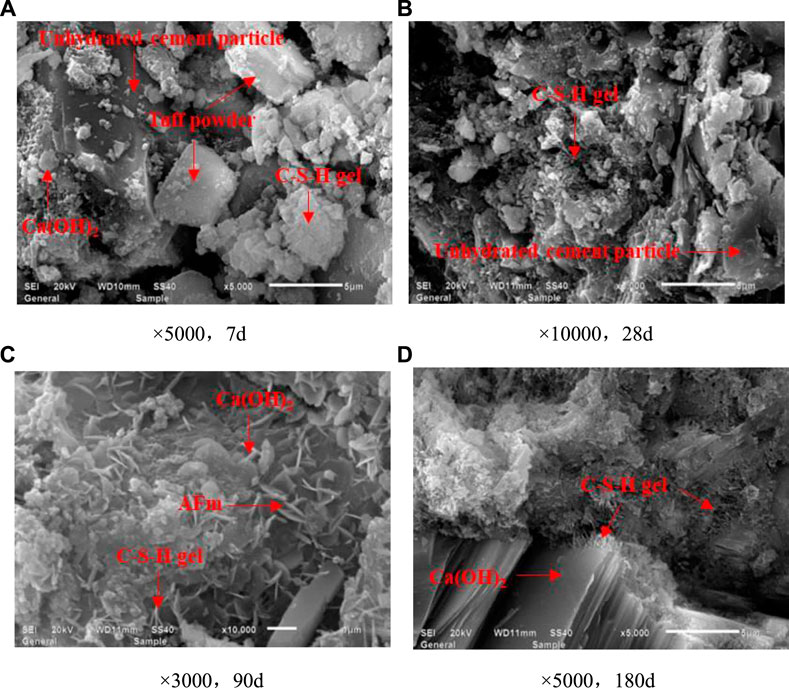
FIGURE 11. SEM images of hardened paste of NH3 (50% Tuff powder).
From Figure 9C, in the later period of 90 days hydration, the gelatinous and fibrous C-S-H gel is integrated with hexagonal Ca(OH)2 for pure cement paste, and the structure is more compact. In tuff powder-cement hardened paste (Figures 10C and Fig.11C), C-S-H gel, Ca(OH)2 crystal, AFm and other hydration products further increases, and are connected with the tuff particles. At the hydration age of 180 days (Figures 10D and 11D), the structure of paste tends to be more compact, making it hard to see tuff powder particles, and the preferred orientation of the stacked Ca(OH)2 crystals in the pure cement samples becomes more pronounced.
Fractal Dimension of Pore Surface Area
The above MIP results could be used to characterize the porosity distribution and evolution of tuff powder-cement paste, but fail to characterize the complexity of the internal pore structure. For this purpose, the relevant literature applies the fractal theory to analyze the pore structure of cement-based materials (Wang et al., 2020a; Wang et al., 2020b). The fractal dimension of the pore surface (Ds) is introduced to quantitatively characterize the surface characteristics of the irregular pore structure of tuff powder-cement paste. Studies have (Wang et al., 2020a; Wang et al., 2020b; Wang et al., 2020c; Rahman, 1997) shown that the surface fractal dimension value is primarily related to the pore distribution characteristics. The Ds is within the range of 2–3. When Ds is equal to 2, it can be indicated that the measured pore structure is a smooth plane. As the value of Ds increases, the pore structure appears more complex, the surface morphology becomes rougher, the volume share of the micropores is larger and the surface fractal dimension increases as well.
The fractal model based on the thermodynamic method proposed by Zhang et al. (1995), Zhang et al. (2006) has been introduced in this study to determine Ds [(Zhang and Li, 1995; Zhang et al., 2006)]. The basic theory of this fractal model is that there exists a logarithmical relationship between the accumulated injection work (Wt) and the volume of accumulated mercury injected into the pores (Vt) during the MIP test, as shown in Eq.(4).
Where rt is the minimum pore size that mercury injected into the pores at t times (m), Ds is the fractal dimension of pore surface area of cement-based material, and C is a constant.
The accumulated injection work can be calculated by Eq.(5)
The results of Ds and R2 of tuff powder-cement paste are provided in Table 6. The relationships between
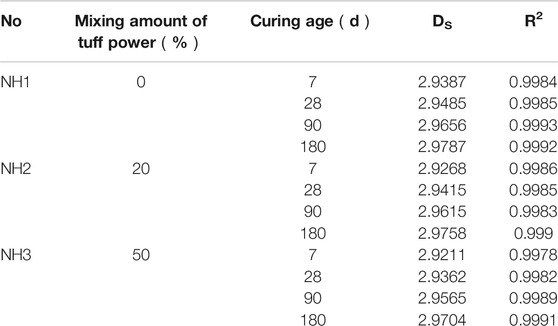
TABLE 6. The Ds and R2 of tuff powder-cement paste.
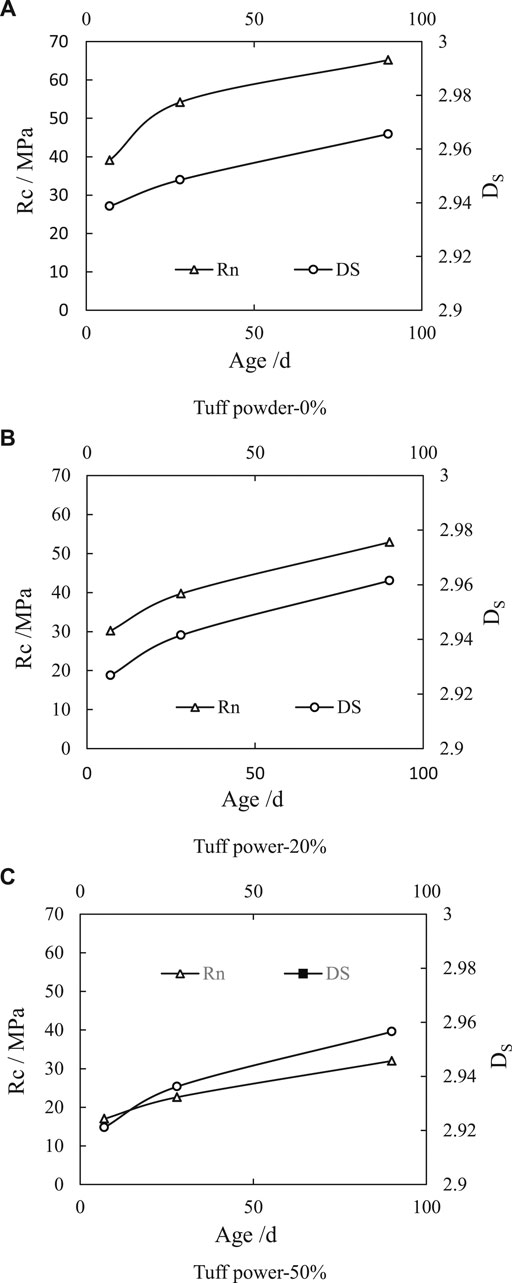
FIGURE 12. The relationship between
The results indicate that the pore surface area of the tuff powder-cement paste exhibits obvious fractal characteristics, and conforms to the fractal model based on the thermodynamic relationship. The Ds of all samples is within the range of 2–3 (above 2.9), and R2 is close to 1. The results demonstrate that the pore surface of the paste is complicate, and the pores are irregular. The Ds of the hardened paste is related to the
The Ds is closely related to the amount of tuff powder and the increase of hydration age. With the increase of the tuff powder amount from 0% to 50%, the fractal dimension of pore surface area of the paste expects a modest decline. It is owing to the incorporation of tuff powder, which increases the total porosity and the average pore size of the cement paste, and in particular, the proportion of the macropores above 100nm, thus reducing the
As the hydration age increases, the Ds of each sample gradually increases, indicating that the pore structure of the paste becomes complicated due to the hydration. During the hydration process, solid hydration products are constantly generated in the paste which could fill the macropores and generate more micropores. The pores at all levels are overlapped. Therefore, the pore structure of the paste becomes dense and the proportion of micropores gradually increases. Then the pore surface of the paste becomes rougher, the pore surface area and Ds increase, and the complexity of the pore structure also increases. When the amount of the tuff powder is 20%, the Ds of the paste significantly increases with the curing age, showing a tendency of shortening the gap with pure cement paste, which is the result of the combination of particle filling and pozzolanic effect of the tuff powder at a reasonable amount (Xiang et al., 2018).
Conclusions
(1) With the increase of the mixing amount of tuff powder, the
(2) The mixing of tuff powder increases the fraction of macropores above 100 nm in the hardened paste. The greater the amount, the more significant this trend is. As the curing age increases, the pore size gradually becomes smaller, especially the samples with larger porosity at early age. At the hydration age of 180 days, the most probable pore sizes in samples are mainly within the range of 5–50 nm, which is beneficial to the durability of concrete.
(3) During the early stage of hydration, the filling effect of tuff powder improves the microstructure of the paste. However, the paste structure becomes loose and the porosity increases when the amount of tuff powder is 50%. In the late hydration period, the hydration products greatly increase and overlap with the tuff particles, thus making the structure dense. The pozzolanic activity of tuff powder was low, and the consumption of Ca(OH)2 through the secondary hydration reaction was very limited.
(4) The pore surface area of the tuff powder-cement paste exhibits obvious fractal characteristics. The pore surface of the paste is complex, and the pores are irregular. With the increase of the hydration age and the decrease of the tuff powder amount, the Ds increases. It is because the hydration process gradually refines the pores and improves the density of the microstructure of the paste. However, the addition of tuff powder increases the proportion of the macropores and reduces the strength of the paste.
Data Availability Statement
The original contributions presented in the study are included in the article/supplementary materials, further inquiries can be directed to the corresponding author/s.
Author Contributions
YS is the corresponding author and the first author, her contributions are including are including the experiments scheme, writing the paper and the paper submission. XL is the second author, his contribution is carrying the experiments project. YL is the third author, his contributions is carrying the experiments project. ZP is the forth author, her contribution is the paper grammar. JL is the fifth author, his contribution is the experiments scheme.
Conflict of Interest
The authors declare that the research was conducted in the absence of any commercial or financial relationships that could be construed as a potential conflict of interest.
Acknowledgements
The supports from the National Key Research and Development Project (no.2019YFC1510803), Central Non-Profit Scientific Research Fund for Institutes (no. CKSF2019374/CL, CKSF2019407/CL and CKSF2019195/CL) are gratefully acknowledged.
References
Çavdar, A., and Yetgin, S. (2007). Availability of tuffs from northeast of Turkey as natural pozzolan on cement, some chemical and mechanical relationships. Constr. Build. Mater. 21, 2066–2071. doi:10.1016/j.conbuildmat.2006.05.034.
DL/T 5273-2012, . Technical specification of natural pozzolan for use in hydraulic concrete. National Energy Administration, (2012). 3-4.
Flores, Y. C., Cordeiro, G. C., Toledo Filho, F. R. D., and Tavares, L. M. (2017). Performance of Portland cement pastes containing nano-silica and different types of silica, Constr. Build. Mater. 146, 524-530. doi:10.1016/j.conbuildmat.2017.04.069.
GB/T 17671-1999, . Method of testing cements-Determination of strength. The State Bureau of Quality and Technical Supervision.(1999).
JC/T 603-2004, . Standard test method for Dry Shrinkage of mortar. National Development and Reform Commission.(2004).
Liguori, B., Iucolano, F., de Gennaro, B., Marroccoli, M., and Caputo, D.. (2015). Zeolitized tuff in environmental friendly production of cementitious material: chemical and mechanical characterization. Constr. Build. Mater. 99, 272–278. doi:10.1016/j.conbuildmat.2015.09.035.
Mehta, P. K., and Monteiro, J. M. Concrete: microstructure, properties and materials, 3rd, McGraw-Hill: New York, NY, USA, (2006). pp. 230-300.
Rahman, M. S. (1997). Physical meaning and interpretation of fractal dimensions of fine particles measured by different methods. J. Food Eng. 32(4), 447-456. doi:10.1016/s0260-8774(97)00013-7.
Shanshan, J., Jinxi, Z., Chunzhen, C., and Weilin, C.. (2011). Study on fractal characteristics of pore structure of cement mortar. J. Build. Mater. 14, 92-97. doi:10.3969/j.issn.1007-9629.2011.01.019
ASTM C 618. Standard specifications for fly ash and raw and calcined natural pozzolan for use as a mineral admixture in portland cement concrete. American Society of Testing and Materials, Philadelphia, PA. (2000). 305-308.
Turkmenoglu, A. G., and Tankut, A.. (2002). Use of tuffs from central Turkey as admixture in pozzolanic cements Assessment of their petrographical properties. Cement Concr. Res. 32, 629–637.
Vigil de la Villa, R., Fernández, R., García, R., Villar-Cociña, E., and Frías, M. (2009). Pozzolanic activity and alkaline reactivity of a mordenite-rich tuff. Microporous and Mesoporous Materials. 126, 125–132. doi:10.1016/j.micromeso.2009.05.029.
Wang, L., Luo, R., Zhang, W., Jin, M., Tang, S. (2020a). Effects of fineness and content of phosphorus slag on cement hydration, permeability, pore structure and fractal dimension of concrete, Fractals, accepted, . doi:10.1142/s0218348x21400041.
Wang, L., Guo, F., Yang, H., Wang, Y., and Tang, S.. (2020b). Comparison of fly ash, PVA fiber, MgO and shrinkage-reducing admixture on the frost resistance of face slab concrete via pore structural and fractal analysis, Fractals, accepted, . doi:10.1142/s0218348x21400028.
Wang, L., Jin, M., Guo, F., Wang, Y., and Tang, S.. (2020c). Pore structural and fractal analysis of the influence of fly ash and silica fume on the mechanical property and abrasion resistance of concrete, Fractals, accepted, doi:10.1142/s0218348x2140003x.
Wu, K., Shi, H. S., Xu, L. L., Ye, G., and De Schutter, G. D.. (2016). Microstructural characterization of ITZ in blended cement concretes and its relation to transport properties. Cem. Conc. Res. 79, 243-256. doi:10.1016/j.cemconres.2015.09.018.
Xiang, L., Yan, S., Jiazheng, L., and Si, Z. (2017). Compressive strength development of complex binder containing tuff powder. J. Build. Mater. 20, 435-438. doi:10.3969/j.issn.1007-9629.2017.03.019
Xiang, L., zhengping, L., xian, H., iazhng, L., and Yan, S. (2018). Microstructural charateristics of composite binders containing fly ash and(or) Tuff powder. J. Yangtze River Sci. Res. Inst. 35, 115-119. doi:10.11988/ckyyb.20161255
Yiren, H., and Xiaolin, H. (2000). Exploration and practice of mixed grinding of tuff and phosphate slag as RCC admixture, Yunan Hydropower. 16, 53-57.
Yusheng, Z., Chongxian, P., and Wentao, X. (1992). Application of tuff admixture in Manwan project. Hydropower. 10, 30-35.
Zhang, B. Q., and Li, S. F.. (1995). Determination of the surface fractal dimension for porous media by mercury porosimetry. Ind. Eng. Chem. Res. 34, 1383-1386. doi:10.1021/ie00043a044.
Zhang, B. Q., Liu, W., and Liu, X. (2006). Scale-dependent nature of the surface fractal dimension for bi- and multi-disperse porous solids by mercury porosimetry. App. Surf. Sci. 253, 1349-1355. doi:10.1016/j.apsusc.2006.02.009.
Keywords: tuff powder, mineral admixture, compressive strength, porosity, fractal dimension
Citation: Shi Y, Li X, Li Y, Peng Z and Li J (2020) Effect of Tuff Powder Mineral Admixture on the Macro-Performance and Micropore Structure of Cement-Based Materials. Front. Mater. 7:595997. doi: 10.3389/fmats.2020.595997
Received: 18 August 2020; Accepted: 21 October 2020;
Published: 18 November 2020.
Edited by:
Huisu Chen, Southeast University, ChinaReviewed by:
Zhuqing Yu, Nanjing Tech University, ChinaCopyright © 2020 Shi, Li, li, peng and li. This is an open-access article distributed under the terms of the Creative Commons Attribution License (CC BY). The use, distribution or reproduction in other forums is permitted, provided the original author(s) and the copyright owner(s) are credited and that the original publication in this journal is cited, in accordance with accepted academic practice. No use, distribution or reproduction is permitted which does not comply with these terms.
*Correspondence: Shi Yan, MTgxNjM1NTk3MzBAMTYzLmNvbQ==