
95% of researchers rate our articles as excellent or good
Learn more about the work of our research integrity team to safeguard the quality of each article we publish.
Find out more
ORIGINAL RESEARCH article
Front. Mater. , 22 April 2021
Sec. Structural Materials
Volume 7 - 2020 | https://doi.org/10.3389/fmats.2020.533843
This article is part of the Research Topic Dual-phase Materials in the Medium and High Entropy Alloy Systems Al-Cr-Fe-Ni and Al-Co-Cr-Fe-Ni View all 13 articles
The present work investigates the corrosion behavior of Al0.1CoCrFeNi high entropy alloy (HEA) in various concentrations of chloride-containing solutions. Electrochemical tests exhibit overall excellent corrosion resistance of this alloy against the attack of Cl−-containing solutions. The main type of corrosion topography presents an intergranular feature. In addition, electrochemical impedance spectroscopy (EIS) investigation of the HEA samples under immersion test suggests chloride anion–containing environment leads to the decline of passivation film quality. Further analysis of XPS results reveals that significant amounts of elements exist with atomic states in the passive films.
Recently high-entropy alloys (HEAs), usually containing five or more alloying elements in approximately equal molar concentrations, have been the focal point of intensive research and investigations due to its tremendous application prospects and scientific significance (Yeh et al., 2004; Green et al., 2013; Gludovatz et al., 2014; Miracle et al., 2014; Senkov et al., 2016). Compared with conventional alloys, HEAs possess excellent microstructural stability and mechanical properties (Chen et al., 2005; Tong et al., 2005; Kao et al., 2009; Hou et al., 2017; Hou et al., 2019; Song et al., 2019).
In addition, HEAs are also considered as promising candidates for practical corrosion-resistant applications because most HEAs consist of corrosion-resistant and passivating elements and are generally free of common corrosion initiate sites such as impurities and inclusions. For instance, there are many studies on the corrosion resistance of AlxCoCrFeNi alloy system, which has been extensively studied due to its multiple excellent properties (Zhou et al., 2007; Kao et al., 2010; Lin and Tsai, 2011; Wang et al., 2012; Kumar et al., 2017; Shi et al., 2017; Shi et al., 2018). Among them, the Al0.1CoCrFeNi of single-phase face centered cubic (FCC) exhibited extremely high pitting potential and strong corrosion resistance characteristics (Kao et al., 2010; Lin and Tsai, 2011; Kumar et al., 2017; Shi et al., 2017; Shi et al., 2018). Note that the constituent elements of this HEAs system, such as Al, Co, and Fe, are not the corrosion-resistant elements in the traditional sense. From the standpoint of its application and longtime service in real conditions, it is fairly necessary for further research on the corrosion behavior and mechanism of this HEAs alloy.
Therefore, in this work, the corrosion behavior of as-cast Al0.1CoCrFeNi (at%) (a single-phase solid solution with FCC structure and almost no component segregation) with a typical dendritic structure in various concentrations of NaCl and Na2SO4+NaCl was studied, and the research mainly focuses on potentiodynamic polarization tests, corrosion morphology, passive films, and pitting process.
The Al0.1CoCrFeNi alloy ingots were prepared by vacuum arc melting in a water-cooled copper crucible under a Ti-gettered argon atmosphere. A mixture of the ultrasonically cleansed Al, Co, Cr, Fe, and Ni elements with purity higher than 99.5 wt% was carefully weighted. Compositional homogeneity of the alloy ingots was ensured by flipping over and remelting at least 5 times. Each as-cast rod sample (diameter of 3 mm) was further cut into smaller cylindrical pieces with a length of 3 mm by wire Electrical Discharge Machining (EDM). The surfaces in subsequent tests are all referring to the cross section faces which have an approximate area of 0.07cm2. Then, each sample was polished into a mirror-like surface using SiC grit papers (up to grit No. 2000) and alumina polishing agent with a granularity of 2.5 μm. Before the electrochemical and surface analytical tests, all polished specimens were ultrasonically cleaned with distilled water and ethanol and dried up in air. Each electrochemical experiment was carried out at least three times to ensure reproducibility.
In this work, NaCl solutions with concentrations spanning three orders of magnitude were chosen as experimental media (1.5, 1.0, 0.8, 0.6, 0.5, 0.1, 0.05, and 0.01 M). Another corrosion media was chloride-containing Na2SO4 solutions with various concentrations. The choice of NaCl solution is certainly for the purpose of investigation of pitting corrosion resistance which usually occurs in chloride-containing solutions. The addition of Na2SO4 in the second solution is just a buffer for the pure scientific purpose. All electrochemical experiments were performed using a CHI600 electrochemical measurement system. A three-electrode setup was employed to conduct all the electrochemical tests, which contains a Pt mesh counter electrode and a saturated calomel electrode (SCE); the values of potentials reported in this article are all referred to as VSCE which is equivalent to +0.244 VSHE.
Potentiodynamic polarization and electrochemical impedance spectroscopy (EIS) have been utilized to demonstrate the corrosion resistance behaviors of HEA samples in a variety of test solutions. After 1800s open circuit potential measurement, the equilibrium potential was chosen to be the initial potential for AC impedance test, and the amplitude potential is set to be 5 mV. EIS spectra were acquired with a frequency scan range from 100,000 to 0.01 Hz. Potentiodynamic polarization tests were performed through a range of −0.8–1.3 V with a scanning rate of 1 mV/s. After polarization tests, scanning electron microscope (SEM) was used to characterize the surface morphology of samples, and electron dispersion spectroscopy (EDS) was employed to obtain the corresponding elemental distribution information. A TESCAN LYRA 3 XMH SEM was utilized in this investigation.
For further composition information of the passive film formed under chloride-containing solution, X-ray photoelectron spectroscopy (XPS) has been conducted by using an ESCALAB 250Xi X-photoelectron spectrometer with monochromatized Al K α excitation (hν = 1,486.6 eV). XPS analysis was performed on two samples (denoted as sample 1 and 2). Sample 1 underwent 1800s potentiostatic passivation at 0.5 V potential in 0.5 M NaCl and sample 2 went through a full potentiodynamic polarization test in 0.5 M NaCl. Before XPS tests, both specimens were pretreated at a polarization voltage of −1 V for 5 min to remove the oxide on their surface.
In order to get further understanding of corrosion process of material under chloride-containing solutions, a prepassivation sample (half-hour potentiostatic passivation) at 0.5 M H2SO4 solution was chosen to conduct immersion test at 3.5wt% NaCl solution. EIS test was conduct on the immersed sample at the time points of 1 h, 5 h, 100 h and 200 h, respectively.
Potentiodynamic polarization tests have been carried out on Al0.1CoCrFeNi HEA samples in a variety of chloride ion–containing solutions. Figures 1A,B present the polarization curves obtained in NaCl and Na2SO4+NaCl solutions, respectively. As shown in Figure 1A, regardless of the variation of NaCl concentrations, the Al0.1CoCrFeNi exhibits a considerable range of passivation. The passivation current densities increase with the increase of the NaCl concentrations, but not in a monotonic manner. When a certain polarization potential is reached, the pitting or transpassivation occurs as shown in each curve. Close inspection of Figure 1A shows that the variation of chloride concentration has an impact on initial passivation stage which takes place around −0.2–0.0 V. To illustrate, for samples in low solution concentrations self-passivation tends to occur without an obvious active-passive peak while for samples in higher solution concentrations one can see a distinct active-passive conversion peak. Figure 1B presents the variation of polarization curves with the addition of Na2SO4. Apparently, presence of another anion in solution has a marked effect on the active-passive process of the Al0.1CoCrFeNi sample; i.e., the active-passivation peak moves toward negative direction with the increase of chloride concentration.
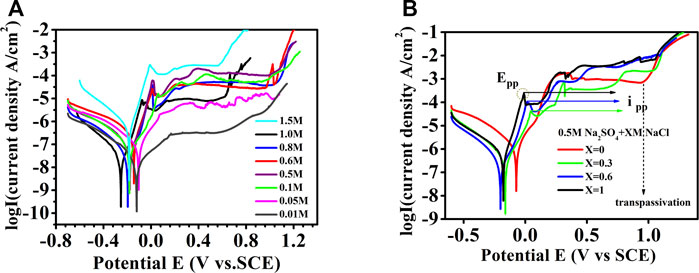
FIGURE 1. Potentiodynamic polarization test results for Al0.1CoCrFeNi in different concentrations of Cl− containing solution, (A) NaCl and (B) Na2SO4+NaCl.
To appraise the corrosion resistance of Al0.1CoCrFeNi HEAs, parameters such as corrosion current density (Icorr) and corrosion potential Ecorr were derived from polarization curves by the Tafel extrapolation method. The data obtained from Figure 1A are plotted out in Figure 2. Evidently shown in Figure 2A, all the Icorr values are in the range of 0–5 (
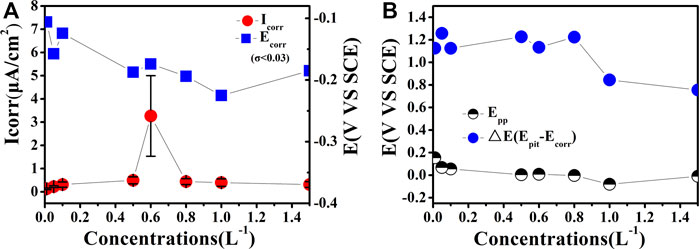
FIGURE 2. Schematic illustrations of the main corrosion parameters derived from electrochemical tests for Al0.1CoCrFeNi in different concentrations of NaCl solution; all the standard deviation σ of the potential indicators are below 0.03 and there is no error bar identification for them.
It is well established that the corrosion of Al0.1CoCrFeNi HEA in salt solution is mainly oxygen-consuming corrosion. The correlation of corrosion rate Icorr vs. salt concentrations should concern two factors: anion concentration and dissolved oxygen content. On one hand, increase of salt concentration generally leads to higher conductivity of the solution, which might provide a beneficial effect on the ongoing corrosion process. On the other hand, the increase of ionic concentration tends to reduce the content of dissolved oxygen and hence leads to the suppression of the cathodic reaction and results in an ultimate weakened corrosion process (Tian et al., 2015). This oxygen supply shortage induced corrosion current densities decrease might offset the increase induced by increased chloride concentration, resulting in a peak current (icorr) at 0.6 M NaCl as shown in Figure 2A.
Several parameters for evaluation of passivation properties derived from Figure 1A are illustrated in Figure 2B. The passivation potential (Epp) generally marks the beginning of passivation. As shown in Figure 2B, the Epp values exhibit no clear variation tendency with the increase of Cl− concentration.
In addition, Figure 2B also presents the variation of another metric for evaluating the corrosion behavior, the pitting resistance (ΔE = Epit−Ecorr) (Ayyagari et al., 2018). One can see in Figure 2B that, for the Al0.1CoCrFeNi HEA, the ΔE values lie within the range of 0.8 V~1.2 V with a span of Cl− concentration up to three orders of magnitude. These values are better than most of the reported HEA alloy systems except that of Ti-containing HEAs (Ayyagari et al., 2018), demonstrating excellent pitting resistance of the Al0.1CoCrFeNi HEA samples.
Point defect model (PDM) proposed that the pitting potential (Epit) has a linear relationship with the logarithm of chloride concentration (Laycock and Newman, 1997). Figure 3 illustrates the variation of Epit values vs. logarithmical Cl− concentration. As shown in Figure 3, the colorful fitting line suggests that the Epit decreases roughly in a linear way with the increase of the logCCl−, except two high concentration points. For the sake of comparison, the published results for 316 L stainless steel is also plotted in the graph. It can be clearly seen that the slope for 316 L is slightly higher than that of the Al0.1CoCrFeNi HEA, suggesting this HEA is less susceptible to the point corrosion induced by the detrimental Cl−. Note that the Epit of Al0.1CoCrFeNi HEA is averagely 0.4 V higher than that of 316 L, indicating a rather superior pitting resistance. The reason why this particular HEA is “better” than others is not clear at this moment. However, the answer is likely associated with the synergism of two passivating elements of Al and Cr. It is also worth noting that the plots of 1.0 and 1.5 M have a severe deviation from the fitted line, which is not clear at this moment.
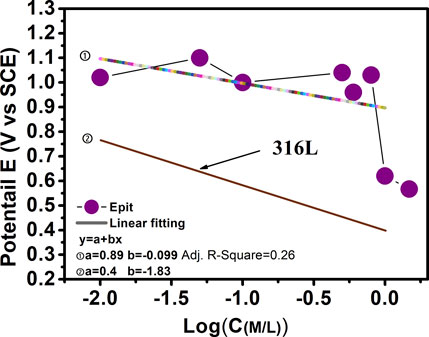
FIGURE 3. Linear relationship between pitting potential and logarithm of chloride ion concentration.
In order to acquire detailed information about the corrosion morphology of Al0.1CoCrFeNi HEA in chloride containing solution, SEM investigation was carried out on the specimens after potentiodynamic polarization tests, and major results are shown in Figure 4. Careful inspection of the SEM images in Figure 4 reveals that there is a distinctive morphology difference with the increase of NaCl concentration. To be brief, there is no recognized feature on the surface morphology for samples in low concentration of NaCl solution (0.1 M), and clear evidence of initiation of corrosion can be probed for samples in the salt solution of higher concentration of (0.5 M). For the samples in 1.0 M NaCl solution, typical interdendrite corrosion patterns are present. It is likely that the corrosion of Al0.1CoCrFeNi HEA was initiated in intergranular region and propagated in interdendrite region with the increase of chloride concentration.
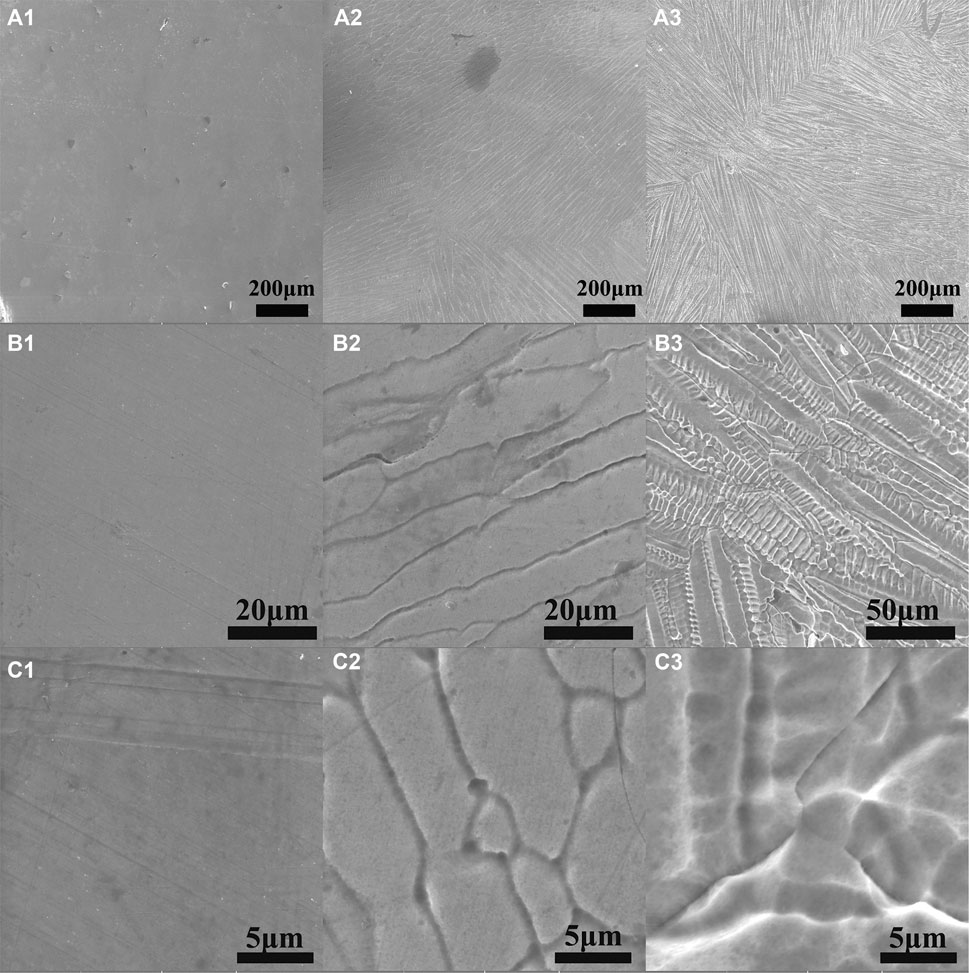
FIGURE 4. SEM images of Al0.1CoCrFeNi samples after polarization tests. a, b, and c are respectively for the samples in NaCl solutions with concentrations of 0.1, 0.5, and 1.0 M.
Three types of pitting topography were probed in the images obtained from Al0.1CoCrFeNi samples after electrochemical tests in chloride solution. Figure 5 shows some images about these three pitting topographies found in various samples. Figures 5E,F presents the tiny pitting pits usually found in low chloride concentration (0.1 M). Figures 5A,B shows the big round pit normally found in higher concentration of 0.4 M NaCl solution. Figure 5D exhibits the pits of irregular shape which are frequently observed in Cl− concentrations greater than 1.0 M. The correlation between the pitting topography and chloride concentration reveals the complexity of the nucleation and development of chloride-induced pitting process, which is not clear yet.
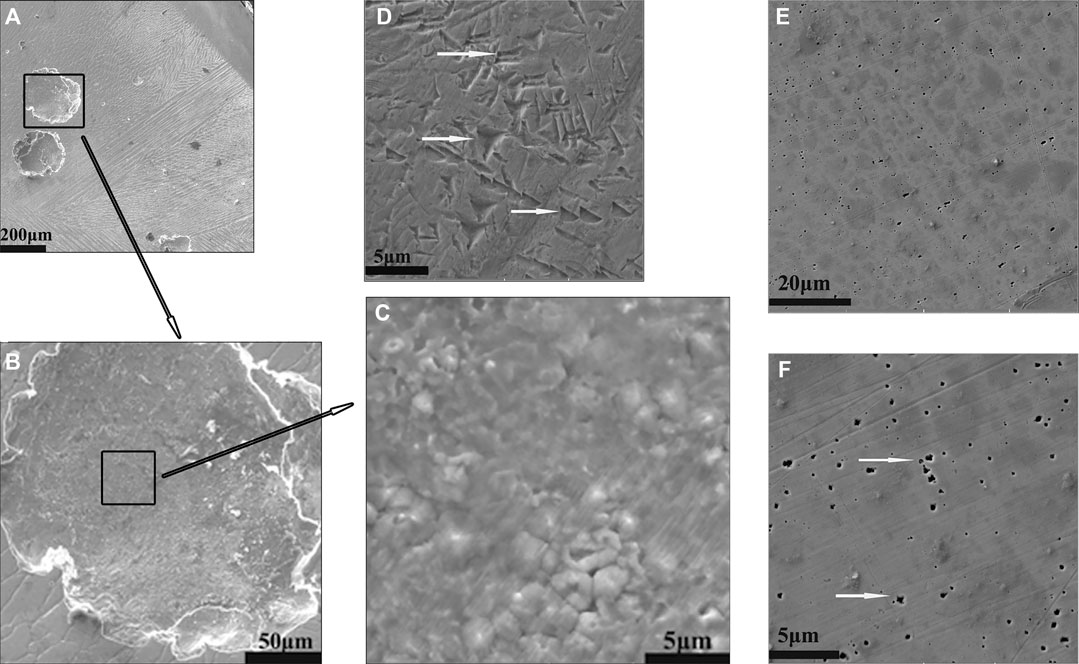
FIGURE 5. Three types of pitting topography for Al0.1CoCrFeNi samples: (A–C) are for 0.4 M NaCl; (D) is for 1 M NaCl; and (E, F) are for 0.1 M NaCl.
For further elemental composition evidence, EDS tests were conducted in selected locations in some SEM images of Al0.1CoCrFeNi samples. The selected spots such as dendrite, pits, and grain boundary are shown in Figure 6 and corresponding elemental distribution results are listed in Table 1.

FIGURE 6. EDS analysis of selected SEM images: (A–C) are respectively for the concentrations of 0.1, 0.4, and 1.0 M in NaCl solutions. The test locations are dendrite, pits, and grain boundary.
As manifestly shown in Table 1, the elemental distribution of each element between dendrite and interdendrite is essentially the same, indicating the absence of obvious elemental segregation. Comparison of elemental distribution between dendrites and the grain boundary suggests that there is slight Cr enrichment and Ni depletion in grain boundary. It can be understandable considering that with the presence of Cl−, element Ni is more susceptible to dissolution among the alloying metallic elements in this HEAs alloy. Conversely, element Cr is the most stable one according to the literature (Keller and Strehblow, 2004).
For Al0.1CoCrFeNi HEA, the presence of multiple passive elements demands further chemical evidence of the sample surface to get better understanding of the passivation mechanism. XPS analyses were undertaken to attain information with respect to surface compositions and elemental chemical status vs. anodic polarization. Two samples were selected (denoted as sample 1 and 2), and 400s cathodic polarization at −1.0 V was conducted for each sample in order to remove the outside oxides. Sample 1 was conducted by 1800s potentiostatic polarization in 0.5 M NaCl in order to make the newly formed oxide film stable and integral; sample 2 was the specimen after potentiodynamic polarization test in 0.5 M NaCl.
Major XPS analysis results are presented in Figure 7. Before analysis, the positions of binding energy were calibrated by comparing the binding energy of the C 1s peak to its standard binding energy, 284.8 eV. Figure 7 presented the adjusted core level XPS spectra of Fe2p, Cr 2p, Ni 2p, Co 2p, and O1s.
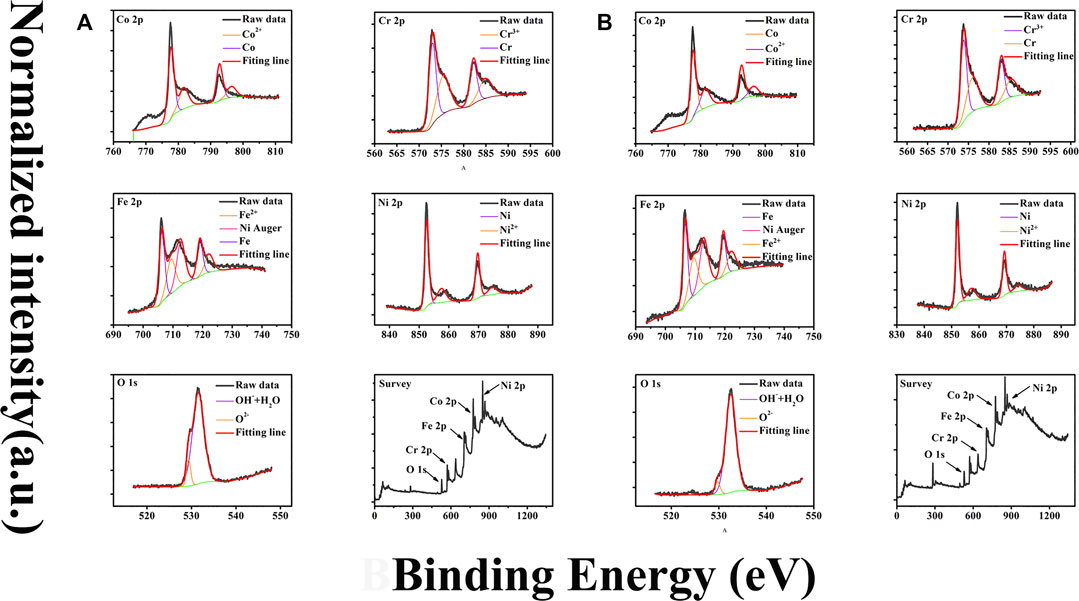
FIGURE 7. (A) and (B) are XPS spectra for sample 1 and 2, respectively. Data for each sample include Fe2p, Ni2p, Cr2p, Co2p, O1s, and the survey spectrum. The black lines are measurements data and the ones with color are their fitting results.
The deconvolution fittings take into account the fact that there are spin-orbit splittings inducing doublet separation for Cr 2p, Ni 2p, Fe 2p, and Co 2p spectra, with 9.2 eV splitting between the Cr 2p1/2 and Cr 2p3/2, 17.3 eV splitting between the Ni 2p1/2 and Ni 2p3/2, 13.2 eV splitting between the Fe 2p3/2 and Fe 2p1/2, and 15.4 eV splitting between the Co 2p3/2 and Co 2p1/2, respectively.
The deconvolution fittings of Cr, Co, Fe, and Ni reveal the appearance of two distinct chemical states of all these metallic elements: elemental and oxidized. Therefore, these spectra are all fitted by two photoelectron doublets. For example, two peaks located around 574.3 and 583.5 eV (representing Cr 2p3/2 and Cr 2p1/2, respectively) are designated by the photoelectron doublet of Cr and the two peaks located at 576.6 and 585.5 eV are designated by the photoelectron doublet of Cr2+. The peaks of Ni 2p3/2 at 852.6 and 854.3 eV are designated to Ni and Ni2+, respectively, and the ones of Co 2p3/2 at 778.3 and 780.9 eV are designated to Co and Co2+, respectively.
The absence of photoelectron peaks of Al in both survey spectra shown in Figure 7 indicates that the amount of elemental Al in the surface film is virtually beyond the detection limit of the instrument, suggesting Al element in passive films is not stable with the presence of Cl−. The elemental distributions of two samples are illustrated in Figure 8. Examination of Figure 8 suggests that the difference of element content between sample 1 and 2 is nearly neglectable. Among all elements in films, Fe element is with the largest amount and its content reaches 35 and 33% for sample 1 and 2; Cr and Co have similar contents around 15%; Ni element has a minimum content of 5 and 8% for sample 1 and 2, respectively. Surprisingly, the O element is 25 and 31% for the two samples which is far below the values attained in films formed in H2SO4 according to our unpublished work and other research. The relatively less oxygen content suggests a significant number of elements exist with atomic state in the passive film. Detailed chemical state distributions of various elements derived from XPS data fitting are listed in Table 2. Careful inspection of Table 2 reveals that the percentage of atomic state is indeed higher than that of oxidation state of each element and even reaches around 70% for Ni and Co. The observed oxygen deficiency in the passive film of Al0.1CoCrFeNi HEA might be due to the competitive adsorption of oxygen and chloride.
It is noteworthy that the history of the passive film formation in sample 1 and 2 is quite different. In particular, the high potential exerted on sample 2 at the end of potentiodynamic polarization test might lead to the following situations independently or simultaneously: transpassivation of passive films, and micropitting formation. Therefore, it is of a little surprise to observe the striking similarity of the elemental and valence distribution between the two samples.
To further explore the mechanism of pitting process for Al0.1CoCrFeNi HEA, the immersion test was conducted. The chosen sample was passivated in 0.5 M H2SO4 at 0.4 V (referring to Mercury sulfate reference electrode) for 1800s, then immersion media is 3.5wt% NaCl solution. During immersion, interval acquisition data of EIS continued till the end of immersion test. Before every data collection for EIS, open circuit potential measurement was conducted to set an initial potential for AC impedance test. Figure 9 presents the EIS data attained at various immersion duration such as 1 h, 5 h, 100 h, and 200 h. A common model for electrode with passive film was chosen as the equivalent circuit for EIS fitting, which was shown in Figure 9D. As shown in Figure 9D, the equivalent circuit consists of a constant phase element (CPE), capacitance of passive film (CPEf), film resistance (Rf), a Warburg diffusional impedance parameter (Wf), CPE capacitance of film electrolyte interface (CPEf|e), film electrolyte interface resistance (Rf|e), and solution resistance (Rs). The value of ZCPE and ZW can be given by the following equation (Jeyaprabha et al., 2006; Bentiss et al., 2009):
where Y0 is the proportionality factor (Y0>0), j is the imaginary unit, ω is the angular frequency, and n is a dimensionless index. For example, it represents a pure capacitor, when n = 1; a pure resistance for n = 0; a Warburg impedance for n = 0.5; and an inductance for n = −1. And the EIS data have been fitted by software Z-sim.
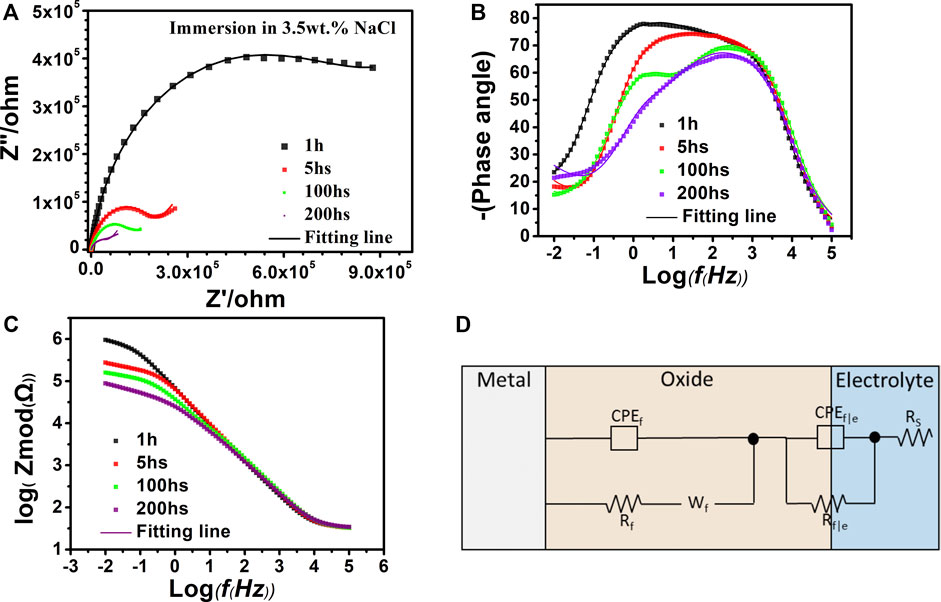
FIGURE 9. Electrochemical impedance spectra of passivated Al0.1CoCrFeNi after different immersion times. (A) Nyquist. (B) and (C) Bode and phase-angle plots. (D) Equivalent circuit (Li et al., 2019).
As shown in Figure 9A, the Nyquist graphs underwent significant change with the variation of immersion duration. Namely, with immersion time varying from 1 to 5 h, the big semicircle arc dramatically changes to a much smaller arc with a straight-line tail. With further increase of immersion time, the shape alteration is becoming smaller and only the size of arc keeps shrinking with a much slower rate. Generally speaking, there is a positive correlation between the size of the arc and the corrosion resistance, the bigger the size, the higher the corrosion resistance. The sharp drop of the arc size in the first 5 h of immersion strongly suggests occurrence of the considerable decline of the passivation film quality. Furthermore, it can be clearly seen from Figure 9C that the overall resistance clearly decreases with the increase of immersion time. In addition, with the immersion time increasing, a Warburg impedance appears in Nyquist, which is often an oblique line immediately following the capacitance arc. The presence of Warburg impedance tail usually indicates that the diffusion of species begins to take a more prominent role in electrode process.
In early immersion of Figure 9B, phase-angle plots of samples with 1 h and 5 h immersion exhibit a rather broad frequency span at near 90°, indicating the whole film acts like a pure capacitor. Then, as the immersion time increases, phase angles at low frequency decline and two peaks appear suggesting the existence of more than one time constant. The time constants corresponding to low frequency eventually disappear with the further increase of the immersion time.
The fitting results with the equivalent circuits are listed in Table 3. Close examination of Table 3 suggests that with immersion time reaching 200 h, film resistance (Rf) and film electrolyte interface resistance (Rf|e) exhibit considerable drop, indicating the prolonged immersion finally induces the possible tiny corrosion pits on electrode surface and resulting in the decline of passivation film quality. It is worth noting that the index of n for CPEF has decreased as immersion time increases, suggesting the increase of surface roughness of the film which is likely due to the impact of surrounding chloride ions (Zhang et al., 2018).
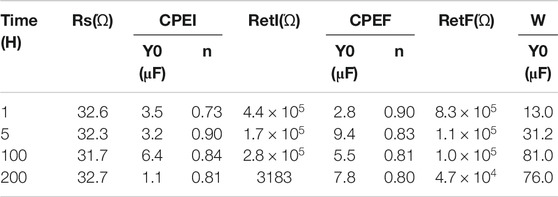
TABLE 3. Impedance parameters of equivalent circuit (Figure 9D).
In this work, a comprehensive investigation on corrosion behavior of the Al0.1CoCrFeNi HEA in various concentrations of chloride-containing solutions is carried out, and major conclusions are as follows.
(1) Electrochemical tests demonstrate the excellent overall corrosion resistance of Al0.1CoCrFeNi HEAs against the attack of chloride-containing solutions.
(2) XPS measurements reveal that the passive film of Al0.1CoCrFeNi HEA is of multielemental nature, which is beneficial for its superior corrosion resistance to the pitting. Further analysis of XPS results also reveals evident oxygen deficiencies in the passive films.
(3) Investigation on corrosion topography by SEM suggests that the corrosion of Al0.1CoCrFeNi HEA is likely initiated in intergranular region and propagated in interdendrite region with the increase of chloride concentration. Three types of pitting topography were probed on Al0.1CoCrFeNi samples.
(4) EIS investigation of immersion tests of the HEA samples suggests that the decline of passivation film quality might be attributable to the chloride anion–containing environment.
All datasets generated for this study are included in the article/Supplementary Material.
KW carried out experiments and wrote this article. AL and JQ discussed and modified the article.
The authors would like to acknowledge the financial support of the Natural Science Foundation of Shanxi Province, China (Nos. 201901D111105 and 201901D111114) and Transformation of Scientific and Technological Achievements Programs of Higher Education Institutions in Shanxi (2019).
The authors declare that the research was conducted in the absence of any commercial or financial relationships that could be construed as a potential conflict of interest.
Ayyagari, A., Hasannaeimi, V., Grewal, H. S., Arora, H., and Mukherjee, S. (2018). Corrosion, erosion and wear behavior of complex concentrated alloys: a review. J. Metals, 8, 16–20. doi:10.3390/met8080603
Bentiss, F., Jama, C., Mernari, B., Attari, H. E., Kadi, L. E., Lebrini, M., et al. (2009). Corrosion control of mild steel using 3,5-bis(4-methoxyphenyl)-4-amino-1,2,4-triazole in normal hydrochloric acid medium. Corros. Sci. 51, 1628–1635. doi:10.1016/j.corsci.2009.04.009
Chen, Y. Y., Duval, T., Hung, U. D., Yeh, J. W., and Shih, H. C. (2005). Microstructure and electrochemical properties of high entropy alloys-a comparison with type-304 stainless steel. Corros. Sci. 47, 2257–2279. doi:10.1016/j.corsci.2004.11.008
Gludovatz, B., Hohenwarter, A., Catoor, D., Chang, E. H., George, E. P., Ritchie, R. O., et al. (2014). A fracture-resistant high-entropy alloy for cryogenic applications. Science 345, 1153. doi:10.1126/science.1254581
Green, M. L., Takeuchi, I., and Hattrick-Simpers, J. R. (2013). Applications of high throughput (combinatorial) methodologies to electronic, magnetic, optical, and energy-related materials. J. Appl. Phys. 231, 101–113. doi:10.1063/1.4803530
Hou, J., Shi, X., Qiao, J., Zhang, Y., Liaw, P. K., Wu, Y., et al. (2019). Ultrafine-grained dual phase Al0.45CoCrFeNi high-entropy alloys. Mater. Des. 180, 897–910. doi:10.1016/j.matdes.2019.107910
Hou, J., Zhang, M., Ma, S., Liaw, P. K., Zhang, Y., Qiao, J., et al. (2017). Strengthening in Al0.25CoCrFeNi high-entropy alloys by cold rolling. Mater. Sci. Eng. A 707, 593–601. doi:10.1016/j.msea.2017.09.089
Jeyaprabha, C., Sathiyanarayanan, S., and Venkatachari, G. (2006). Effect of cerium ions on corrosion inhibition of PANI for iron in 0.5 M H 2 SO 4. Appl. Surf. Sci. 253, 432–438. doi:10.1016/j.apsusc.2005.12.081
Kao, Y.-F., Chen, T.-J., Chen, S.-K., and Yeh, J.-W. (2009). Microstructure and mechanical property of as-cast, -homogenized, and -deformed AlxCoCrFeNi (0≤x≤2) high-entropy alloys. J. Alloys Compd. 488, 57–64. doi:10.1016/j.jallcom.2009.08.090
Kao, Y.-F., Lee, T.-D., Chen, S.-K., and Chang, Y.-S. (2010). Electrochemical passive properties of AlxCoCrFeNi (x=0, 0.25, 0.50, 1.00) alloys in sulfuric acids. Corros. Sci. 52, 1026–1034. doi:10.1016/j.corsci.2009.11.028
Keller, P., and Strehblow, H.-H. (2004). XPS investigations of electrochemically formed passive layers on Fe/Cr-alloys in 0.5 M H2SO4. Corros. Sci. 46, 1939–1952. doi:10.1016/j.corsci.2004.01.007
Kumar, N., Fusco, M., Komarasamy, M., Mishra, R. S., Bourham, M., Murty, K. L., et al. (2017). Understanding effect of 3.5 wt.% NaCl on the corrosion of Al0.1CoCrFeNi high-entropy alloy. J. Nucl. Mater. 495, 154–163. doi:10.1016/j.jnucmat.2017.08.015
Laycock, N. J., and Newman, R. C. (1997). Localised dissolution kinetics, salt films and pitting potentials. Corros. Sci. 39, 1771–1790. doi:10.1016/s0010-938x(97)00049-8
Li, T., Swanson, O. J., Frankel, G. S., Gerard, A. Y., Lu, P., Saal, J. E., et al. (2019). Localized corrosion behavior of a single-phase non-equimolar high entropy alloy. Electrochimica Acta 306, 71–84. doi:10.1016/j.electacta.2019.03.104
Lin, C.-M., and Tsai, H.-L. (2011). Evolution of microstructure, hardness, and corrosion properties of high-entropy Al0.5CoCrFeNi alloy. Intermetallics 19, 288–294. doi:10.1016/j.intermet.2010.10.008
Miracle, B. D., Miller, D. J., Senkov, N. O., Woodward, C., Uchic, D. M., Tiley, J., et al. (2014). Exploration and development of high entropy alloys for structural applications. Entropy 16. doi:10.3390/e16010494
Senkov, N. O., Isheim, D., Seidman, N. D., and Pilchak, L. A. (2016). Development of a refractory high entropy superalloy. Entropy 18, 102. doi:10.3390/e18030102
Shi, Y., Collins, L., Balke, N., Liaw, P. K., and Yang, B. (2018). In-situ electrochemical-AFM study of localized corrosion of Al CoCrFeNi high-entropy alloys in chloride solution. Appl. Surf. Sci. 439, 533–544. doi:10.1016/j.apsusc.2018.01.047
Shi, Y., Yang, B., Xie, X., Brechtl, J., Dahmen, K. A., Liaw, P. K., et al. (2017). Corrosion of Al CoCrFeNi high-entropy alloys: Al-content and potential scan-rate dependent pitting behavior. Corros. Sci. 119, 33–45. doi:10.1016/j.corsci.2017.02.019
Song, X. T., Shi, X. H., Xia, Z. H., Yang, H. J., Wu, Y. C., Liaw, P. K., et al. (2019). Effects of Ni P coating on mechanical properties of Al0.3CoCrFeNi high-entropy alloys. Mater. Sci. Eng. A 752, 152–159. doi:10.1016/j.msea.2019.03.010
Tian, H., Lan, A., Wang, Y., Pan, H. S., and Qiao, J. (2015). Corrosion behavior of in situ dendrite-reinforced Zr-based metallic glass matrix composites in NaCl solutions of varied concentrations. Mater. Chem. Phys. 162, 326–331. doi:10.1016/j.matchemphys.2015.05.074
Tong, C.-J., Chen, Y.-L., Yeh, J.-W., Lin, S.-J., Chen, S.-K., Shun, T.-T., et al. (2005). Microstructure characterization of Al x CoCrCuFeNi high-entropy alloy system with multiprincipal elements. Metall. Mat Trans. A. 36, 881–893. doi:10.1007/s11661-005-0283-0
Wang, W.-R., Wang, W.-L., Wang, S.-C., Tsai, Y.-C., Lai, C.-H., Yeh, J.-W., et al. (2012). Effects of Al addition on the microstructure and mechanical property of AlxCoCrFeNi high-entropy alloys. Intermetallics 26, 44–51. doi:10.1016/j.intermet.2012.03.005
Yeh, J.-W., Chen, S.-K., Lin, S.-J., Gan, J.-Y., Chin, T.-S., Shun, T.-T., et al. (2004). Nanostructured high-entropy alloys with multiple principal elements: novel alloy design concepts and outcomes. Adv. Eng. Mater. 6, 299–303. doi:10.1002/adem.200300567
Zhang, B., Wang, J., Wu, B., Guo, X. W., Wang, Y. J., Chen, D., et al. (2018). Unmasking chloride attack on the passive film of metals. Nat. Commun. 9, 2559. doi:10.1038/s41467-018-04942-x
Keywords: SEM, XPS, passive film analysis, pitting, EIS, corrosion
Citation: Wang K, Lan AD and Qiao JW (2021) Corrosion Behavior of Al0.1CoCrFeNi High Entropy Alloy in Various Chloride-Containing Solutions. Front. Mater. 7:533843. doi: 10.3389/fmats.2020.533843
Received: 10 February 2020; Accepted: 29 December 2020;
Published: 22 April 2021.
Edited by:
Mark L. Weaver, University of Alabama, United StatesReviewed by:
Liang-Yu Chen, Jiangsu University of Science and Technology, ChinaCopyright © 2021 Wang, Lan and Qiao. This is an open-access article distributed under the terms of the Creative Commons Attribution License (CC BY). The use, distribution or reproduction in other forums is permitted, provided the original author(s) and the copyright owner(s) are credited and that the original publication in this journal is cited, in accordance with accepted academic practice. No use, distribution or reproduction is permitted which does not comply with these terms.
*Correspondence: A. D. Lan, bGFuYWlkb25nQHR5dXQuZWR1LmNu; J. W. Qiao, cWlhb2p1bndlaUBnbWFpbC5jb20=
Disclaimer: All claims expressed in this article are solely those of the authors and do not necessarily represent those of their affiliated organizations, or those of the publisher, the editors and the reviewers. Any product that may be evaluated in this article or claim that may be made by its manufacturer is not guaranteed or endorsed by the publisher.
Research integrity at Frontiers

Learn more about the work of our research integrity team to safeguard the quality of each article we publish.