 Magdalena Lenz
 Matthias Franzreb
- Institute of Functional Interfaces, Karlsruhe Institute of Technology, Eggenstein-Leopoldshafen, Germany
Capacitive deionization (CDI) has become an important research topic in terms of water purification as it is a cost- and energy efficient approach for the desalination of brackish water. Carbon- based materials are often used as electrodes in this process due to a variety of morphologies and their suitable performance in this field. In recent studies it has been already shown that a conscientiously chosen set of electrode properties has an enormous effect on the performance behavior of CDI cells. However, most of the studies focus on the optimization of the electrosorption capacity, while the question on how material properties influence the kinetic behavior of a CDI setup has been less intensively studied so far. Here we show that the kinetic effects of electrode materials can be studied in great detail by using electrochemical impedance spectroscopy (EIS). EIS studies of CDI electrodes have been reported before, however, in contrast to these we introduce a method of presenting and analyzing EIS results. This is especially suitable for extracting the frequency ranges in which different rate limiting mechanisms dominate. The new Nyquist Incline Frequency plot (NIF) shows the local slope of the Nyquist plot in dependency of the applied frequency. By this, electron transfer and mass transfer mechanisms which show a characteristic slope in the classical Nyquist plot can be directly visualized together with the information in which time domain they occur. The data derived from the new EIS plot show a clear correlation to pore size distributions from BET measurements, as well as effective capacities and electrosorption kinetics, extracted from CDI experiments. Therefore, we think that by using the NIF plot electrode materials for CDI processes can be conveniently characterized and compared within a single diagram, helping to standardize CDI material development.
Introduction
The process of capacitive deionization (CDI) is a highly efficient and cost effective process which is based on the potential controlled removal of salt or charged contaminants form aqueous solutions (Anderson et al., 2010; Porada et al., 2012; Biesheuvel et al., 2015; Suss et al., 2015; He et al., 2018; Gupta et al., 2019). Thereby, an ion containing, aqueous solution is pumped through a narrow gap located between a pair of highly porous electrodes. Typically carbon-based materials are used as electrodes such as activated carbon, carbon aerogel or carbon nanotubes (Biesheuvel et al., 2013; Liu et al., 2015; Baroud and Giannelis, 2018; Ratajczak et al., 2019). Whereas activated carbon materials are mostly based on a microporous structure (pore size < 2 nm) other researchers focus on materials with a highly ordered mesoporous structure. Examples are nitrogen-doped mesostructured carbons (Xu et al., 2019a), three dimensional graphene frameworks (Xu et al., 2016a), highly ordered mesoporous carbon nanopolyhedra (Xu et al., 2019c) or carbon spheres with hierarchical micro/mesopores (Xu et al., 2016b). Another approach for CDI electrode materials are carbon-based materials doped by heteroatoms like nitrogen or iron (Xu et al., 2020a). However, also faradaic electrodes based on intercalation materials are part of ongoing research (Su and Hatton, 2017; Suss and Presser, 2018; Pan et al., 2019; Singh et al., 2019). Apart from carbon- based materials other materials are part of ongoing research trying to increase the efficiency of the CDI process. Thereby metal- organic frameworks (MOF) in different morphologies play a significant role (Xu et al., 2016b, 2019b, 2020b; Wang et al., 2019) or aerogel- like Ti3C2Tx MXene structures (Bao et al., 2018). When an electrical potential of around 1V is applied, ions are captured on the large inner surface of the electrodes within the electric double layer (Biesheuvel et al., 2012; Dykstra et al., 2018). As a consequence the fluid passing through the gap between the electrodes is depleted of ions, resulting in a desalted or purified solution (Biesheuvel et al., 2011; Porada et al., 2013; Suss et al., 2015; Kim et al., 2017). In earlier studies it was already shown that material properties of the used electrodes affect the performance of the whole CDI cell and efficiency (Oren, 2008; Porada et al., 2013; Zornitta et al., 2016; Luciano et al., 2020). In this study we present a material characterization by electrochemical impedance spectroscopy (EIS) that enables an insight into the performance of the electrodes in terms of kinetic effects and limitations. In contrast to other characterization techniques the method of EIS allows the user the analysis of several important properties (specific capacity, diffusion effects, contact resistance etc.) by using only one method. EIS is based on applying a sinusoidal electrical potential of different frequencies to the electrode material while recording the current response (Bisquert and Compte, 2001; Lasia, 2014; Orazem and Tribollet, 2017). The analysis of the phase shift and the change in the current amplitude enables the detection of physical and chemical processes taking place at the electrodes surface (Nara et al., 2020). For evaluating EIS results a Nyquist plot is typically used where the imaginary impedance is plotted against the real impedance (Liu et al., 2007; Itagaki et al., 2010; Cericola and Spahr, 2016; Rommerskirchen et al., 2019). To allow a better analysis of the morphology aspects of the materials a new presentation technique of EIS results is introduced in this study. We present the Nyquist Incline Frequency (NIF) plot showing the local slope of the Nyquist plot in dependency of the frequency. To the best of our knowledge this is the first study using this method in addition to the Nyquist plot to analyze properties of CDI materials. Like the Nyquist plot the NIF plot shows characteristic curve shapes for different rate limiting mechanism, such as exhausted capacity, diffusion, or electrolyte resistance. However, in contrast to the Nyquist plot, the NIF plot directly shows the frequency range in which these mechanisms dominate.
Materials and Methods
Electrode Materials
For the investigations we used four commercially available electrode materials as presented in Table 1. Three activated carbon materials were used and one carbon aerogel material. The used activated carbon materials differ in their activation process (last two digits) and their fabrication (last letter). The surface morphology of the carbon materials was analyzed by environmental scanning electron microscopy (XL 30 ESEM, Philips, United States). The physical properties were investigated by BET measurements using a Quantachrome Instruments setup (Quantachrome Instruments, United States) with Argon as an analysis gas at a temperature of 87.4 K. For the evaluation of the surface area, pore volume and the pore size distribution a QSDFT (Quenched Solid State Functional Theory) method for slit pores was used (Porada et al., 2013).
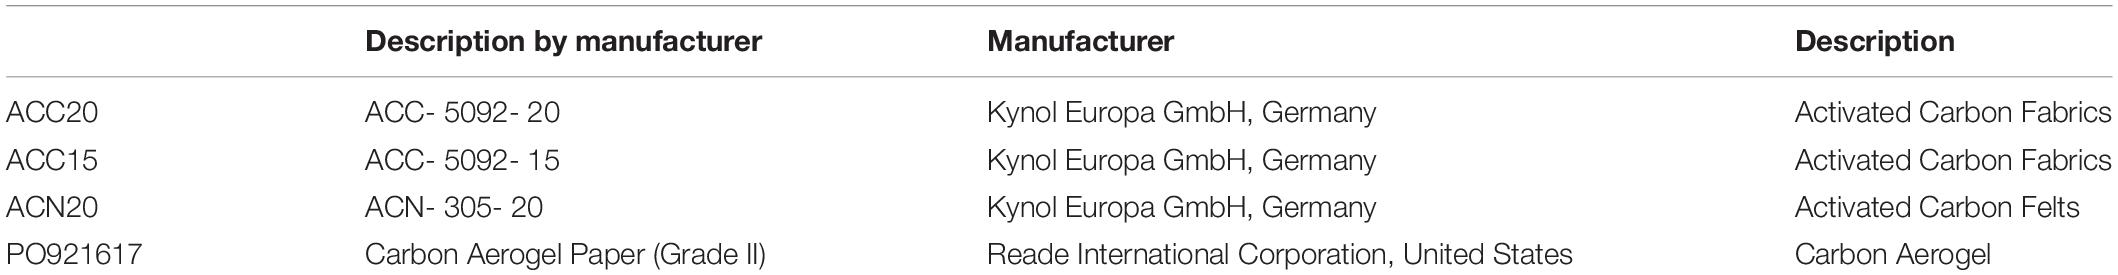
Table 1. Description and manufacturer of the electrode materials.
Electrochemical Impedance Spectroscopy
For EIS measurements a three-electrode setup was used with a platinized titanium mesh electrode (Electronic Thingks, Germany) as counter electrode and an Ag/AgCl reference electrode (Gamry Instruments, United States). A principle sketch of the used setup can be seen in Supplementary Figure S2 of the Supplementary Material. As working electrodes round specimens with a diameter of 15 mm were stamped of the specific carbon materials. The stamped electrodes were contacted with a gold wire (Alfa Aesar GmbH & Co KG, Germany). As electrolyte a sodium chloride solution (Merck KGaA, Germany) with different concentrations (25, 50, 150, and 1000 mM) were used. A 10 mV voltage amplitude was applied in a frequency range of 0.009 up to 10000 Hz by using a Gamry Instruments potentiostat (Interface 5000E, Gamry Instruments, United States). For evaluating EIS results the software Echem Analyst (Gamry Instruments, United States) was used. Besides the generation and export of Nyquist plots, the real capacitance C was estimated directly from the imaginary part of the impedance Zimag following Equation 1. This can easily be done by plotting Zimag⋅ω over the frequency, a plot which is predefined in the Echem software. By calculating the reciprocal value of Zimag⋅ω at low frequencies a good approximation of the capacity is obtained. However, it is important to keep in mind that this method is only valid for low frequencies where the impedance of the system is almost completely determined by the capacitive behavior.
Definition of the Nyquist Incline Frequency Plot
Figure 1 shows a typical Nyquist plot for porous carbon electrode materials. Depending on the frequency three characteristic parts can be distinguished. In case of high frequencies, the impedance of the measurement setup is dominated by the solution resistance as well as the contact resistance and surface capacitance at the interphase between the porous electrode and the current collector. In the Nyquist plot the section corresponding to high frequencies is presented by a depressed semi-circle. In case of medium frequencies, the impedance is dominated by effects resulting from the ion diffusion into the pores and the corresponding formation of the diffusion layer at the surface of the carbon material. In the Nyquist plot this leads to a straight line, while the slope of this line is depending on the shape of the pores. For perfectly cylindrical pores an angle of 45° would be reached (Dsoke et al., 2013). In case of very low frequencies, the Nyquist plot approaches a vertical line corresponding to the capacity of the electrode material. The slope of this line gives information about the pore size distribution of the electrode. For a narrow pore size distribution and a perfect insulation of the setup the slope of the line is equal to 1, representing a perfect capacitor. The slope decreases for broader pore size distributions (Dsoke et al., 2013). For a direct visualization of the frequency ranges in which the described mechanisms take place, we introduce a new plot showing the local slope of the Nyquist plot versus the corresponding frequency. Because of this definition we named the new plot Nyquist Incline Frequency (NIF) plot. In Figure 1 a characteristic shape of a NIF plot of a porous electrode material is presented. The local slope of the Nyquist plot is expressed by the corresponding angle φ which is calculated according to Equation 2, where Zimag and Zreal are the imaginary and the real part of the impedance.
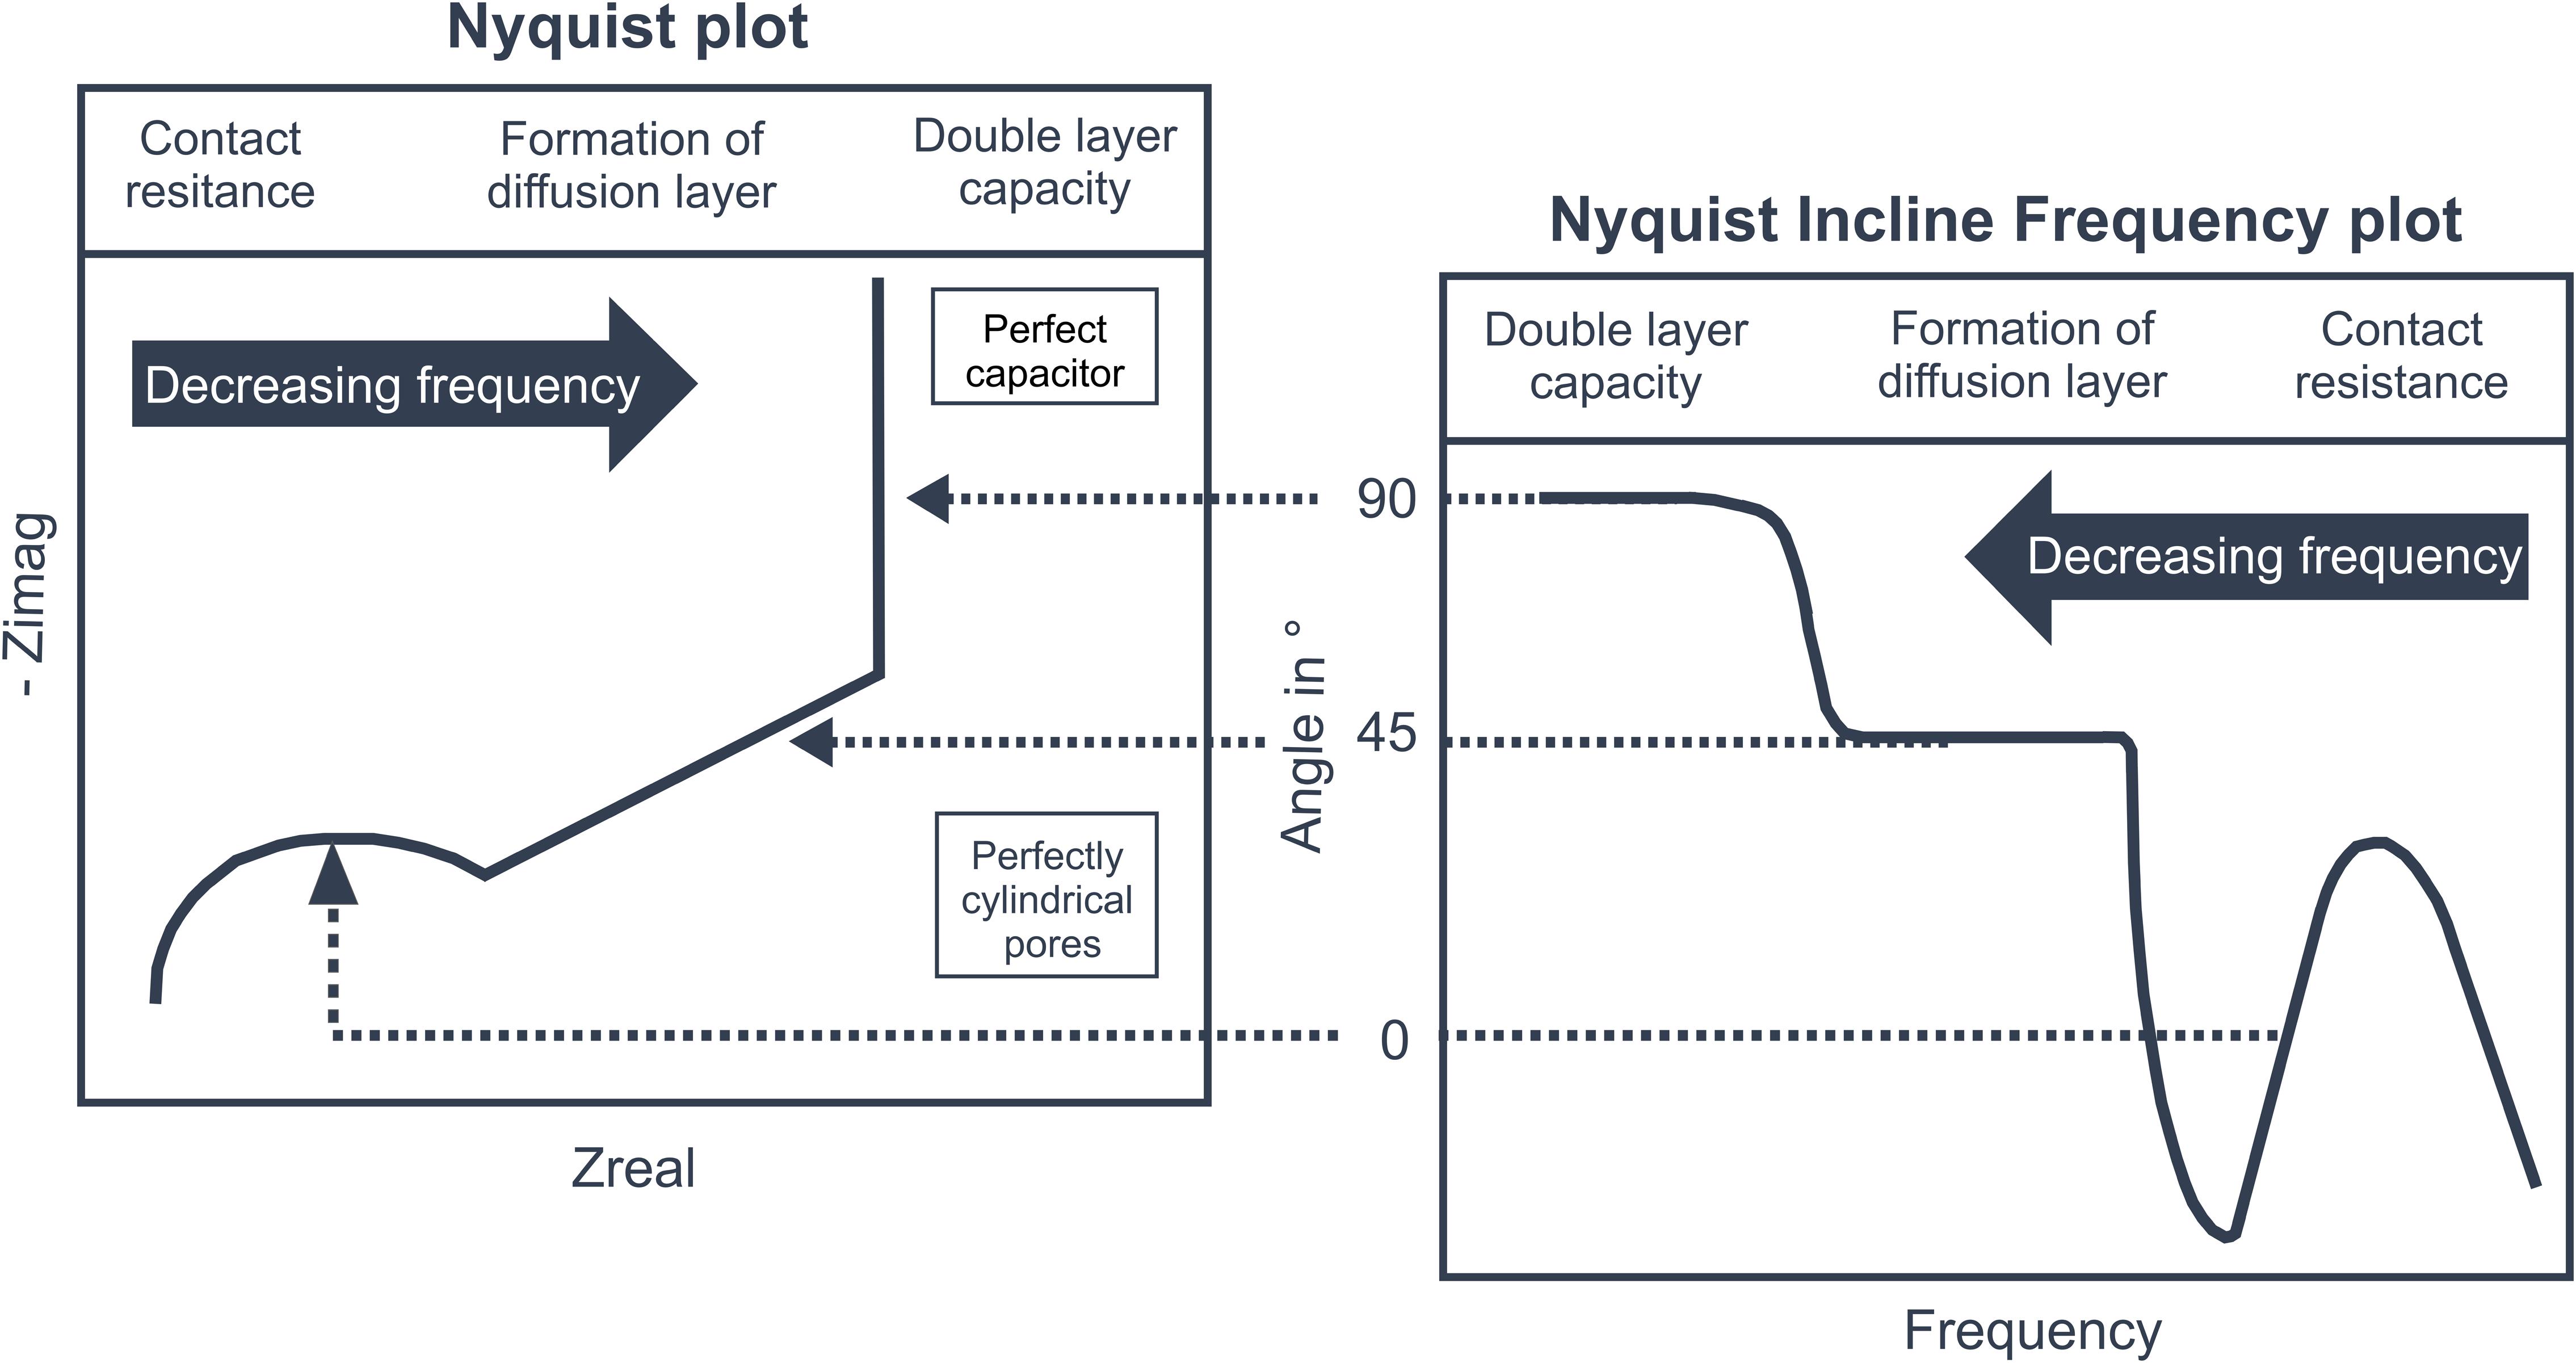
Figure 1. On the left side a Nyquist plot can be seen, resulting from EIS of a typical porous electrode material used for CDI processes. On the right side the Nyquist Incline Frequency plot is presented. In both plots, three characteristic parts can be seen which are related to the contact resistance, coupled diffusion and diffusion layer formation in the pores, and finally the limiting double layer capacity. In contrast to the Nyquist plot, the NIF plot also contains direct information about the frequency ranges in which the mentioned physical effects dominate. Additionally, the slopes of the lines shown in the Nyquist plot and the corresponding angles in the NIF plot give detailed information about the materials morphology.
If the local slope of an experimentally determined Nyquist plot is calculated by a simple difference quotient, the resulting curve can be rather noisy. Therefore, the curves were smoothed by using a 5-point moving averaging routine. In the NIF plot, the three mechanism of frequency dependent electrode behavior can be directly related to the respective frequency ranges. For electrode materials with a very narrow pore size distribution and perfectly cylindrical pores plateaus at 90° and 45° are reached for purely capacitive behavior and dominating diffusion effects, respectively (compare Figure 1). Thereby the frequency range where diffusion is predominantly taking place was defined in between an angle of 60° to 20°. The upper limit corresponds with the truncated mean between the angles representing capacitive and diffusive dominance. For the lower limit the same angular range was subtracted from the idealized value of 45°, representing diffusive dominance. By directly correlating the characteristic slopes of the Nyquist plot with their corresponding frequency ranges, the NIF plot eases the discussion about the deviations of different electrode materials from idealized assumptions.
Electrosorption Experiments
To evaluate the performance characteristics of ion removal by CDI, sorption experiments were executed by using a flow-by CDI setup with a symmetric electrode setup. For this, a custom-built cell was 3D-printed (Objet Eden, Stratasys, United States) which enables fast and easy change of the electrode materials. A titanium plate was used as current collector (Electronic Thingks, Germany) and a non-conductive porous spacer (Bückmann GmbH & Co KG, Germany) served as separator (thickness 0.2 mm) between the electrodes. The area of the electrodes was 5 cm2 with an electrode mass of 0.1- 0.2 g, depending on the electrode material. The feed solution for all experiments was a 25 mM sodium chloride solution (Merck KGaA, Germany). A cell voltage of 1.2 V was applied for adsorption (Interface 5000E, Gamry Instruments, United States) which was reduced to 0 V for desorption and regeneration. The duration of the adsorption and desorption steps was set to 2400 and 1200 s, respectively. The CDI cell was connected to an Äkta purification system (GE Healthcare, United States) to ensure a pulsation free, continuous flow rate of 0.2 ml/min and to measure the conductivity and pH shifts during the experiments. For the comparison of the performance of the different electrode materials the SAC value was calculated by using Equation 3:
Where ci and c0are the initial and effluent concentrations calculated by means of the respective conductivities, Φ is the volumetric flow rate and me the added mass of both electrodes (Zhao, 2013).
Results and Discussion
Materials Characterization
The morphology of the different electrode materials is presented in Figure 2. In the first row the activated carbon fabrics ACC20, ACC15, and ACN20 are shown. These consist of polymer-derived carbon fibers with typical diameters of 10 to 15 μm. In Figure 2A the fibers are woven and aligned into fabrics (ACC20 and ACC15) giving them an ordered structure with a high fiber packaging in the strands. The two fabrics ACC20 and ACC15 differ in their specific surface area due to a different activation process. Fibers in Figure 2B (ACN20) are disordered which leads to a felt-like structure with high macroscopic inter-fiber spaces. In Figure 2C and Figure 2D the non-structured surface of the carbon aerogel is shown in two different resolutions. Smaller cracks appear on the surface of this material. The results achieved by BET measurements are presented in Figure 3 and Table 2. High specific surface areas (763–3184 m2/g) and high pore volumes (0.56–1.37 cm3/g) were detected with average pore sizes in a range of 0.52 to 0.93 nm. ACC20 shows the highest cumulative pore volume, surface area and average pore size whereas the carbon aerogel PO921617 shows the lowest values. Differences can also be seen in the pore size distribution (compare Supplementary Figure S1 in the SI). ACC20, ACC15 and ACN20 show the main increase in pore volume and surface area in a pore size range of 0.5 to 1.5 nm leading to the assumption that these nanopores predominate, resulting in a narrow pore size distribution. Especially for the material ACN20 the lack of larger pores is significant as no increase in cumulative pore volume or surface can be noticed for pore sizes larger than 4.2 nm. In contrast, the carbon aerogel PO921617 shows several smaller increases of the cumulative pore volume, indicating a broad pore size distribution and the existence of mesopores (>2 nm).
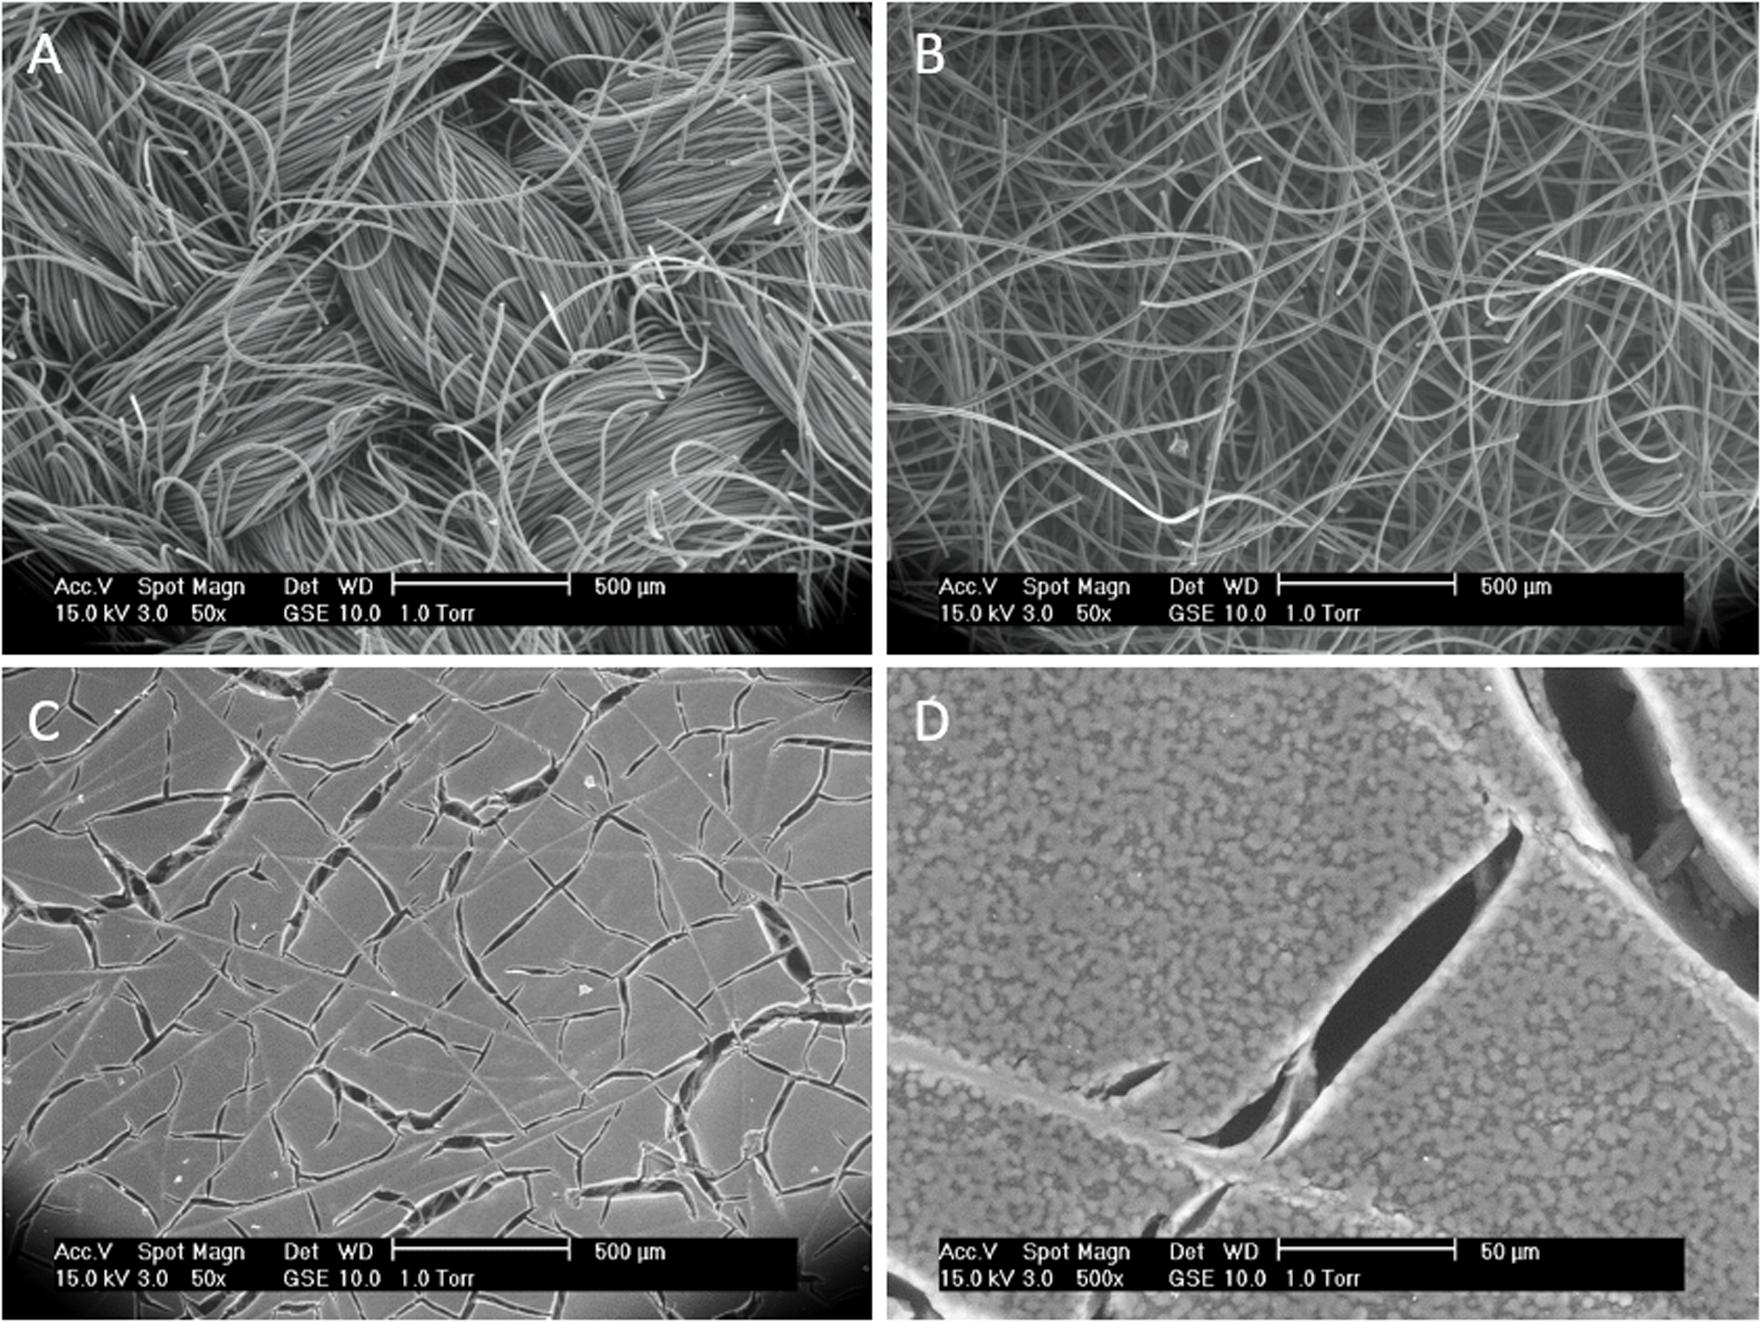
Figure 2. Scanning electron microscope (SEM) images showing the macroscopic morphology differences of the used electrode materials. (A) Activated Carbon Fabrics (ACC20, ACC15). (B) Activated Carbon Felt (ACN20). (C,D) Carbon Aerogel (PO921617) in two different magnifications.
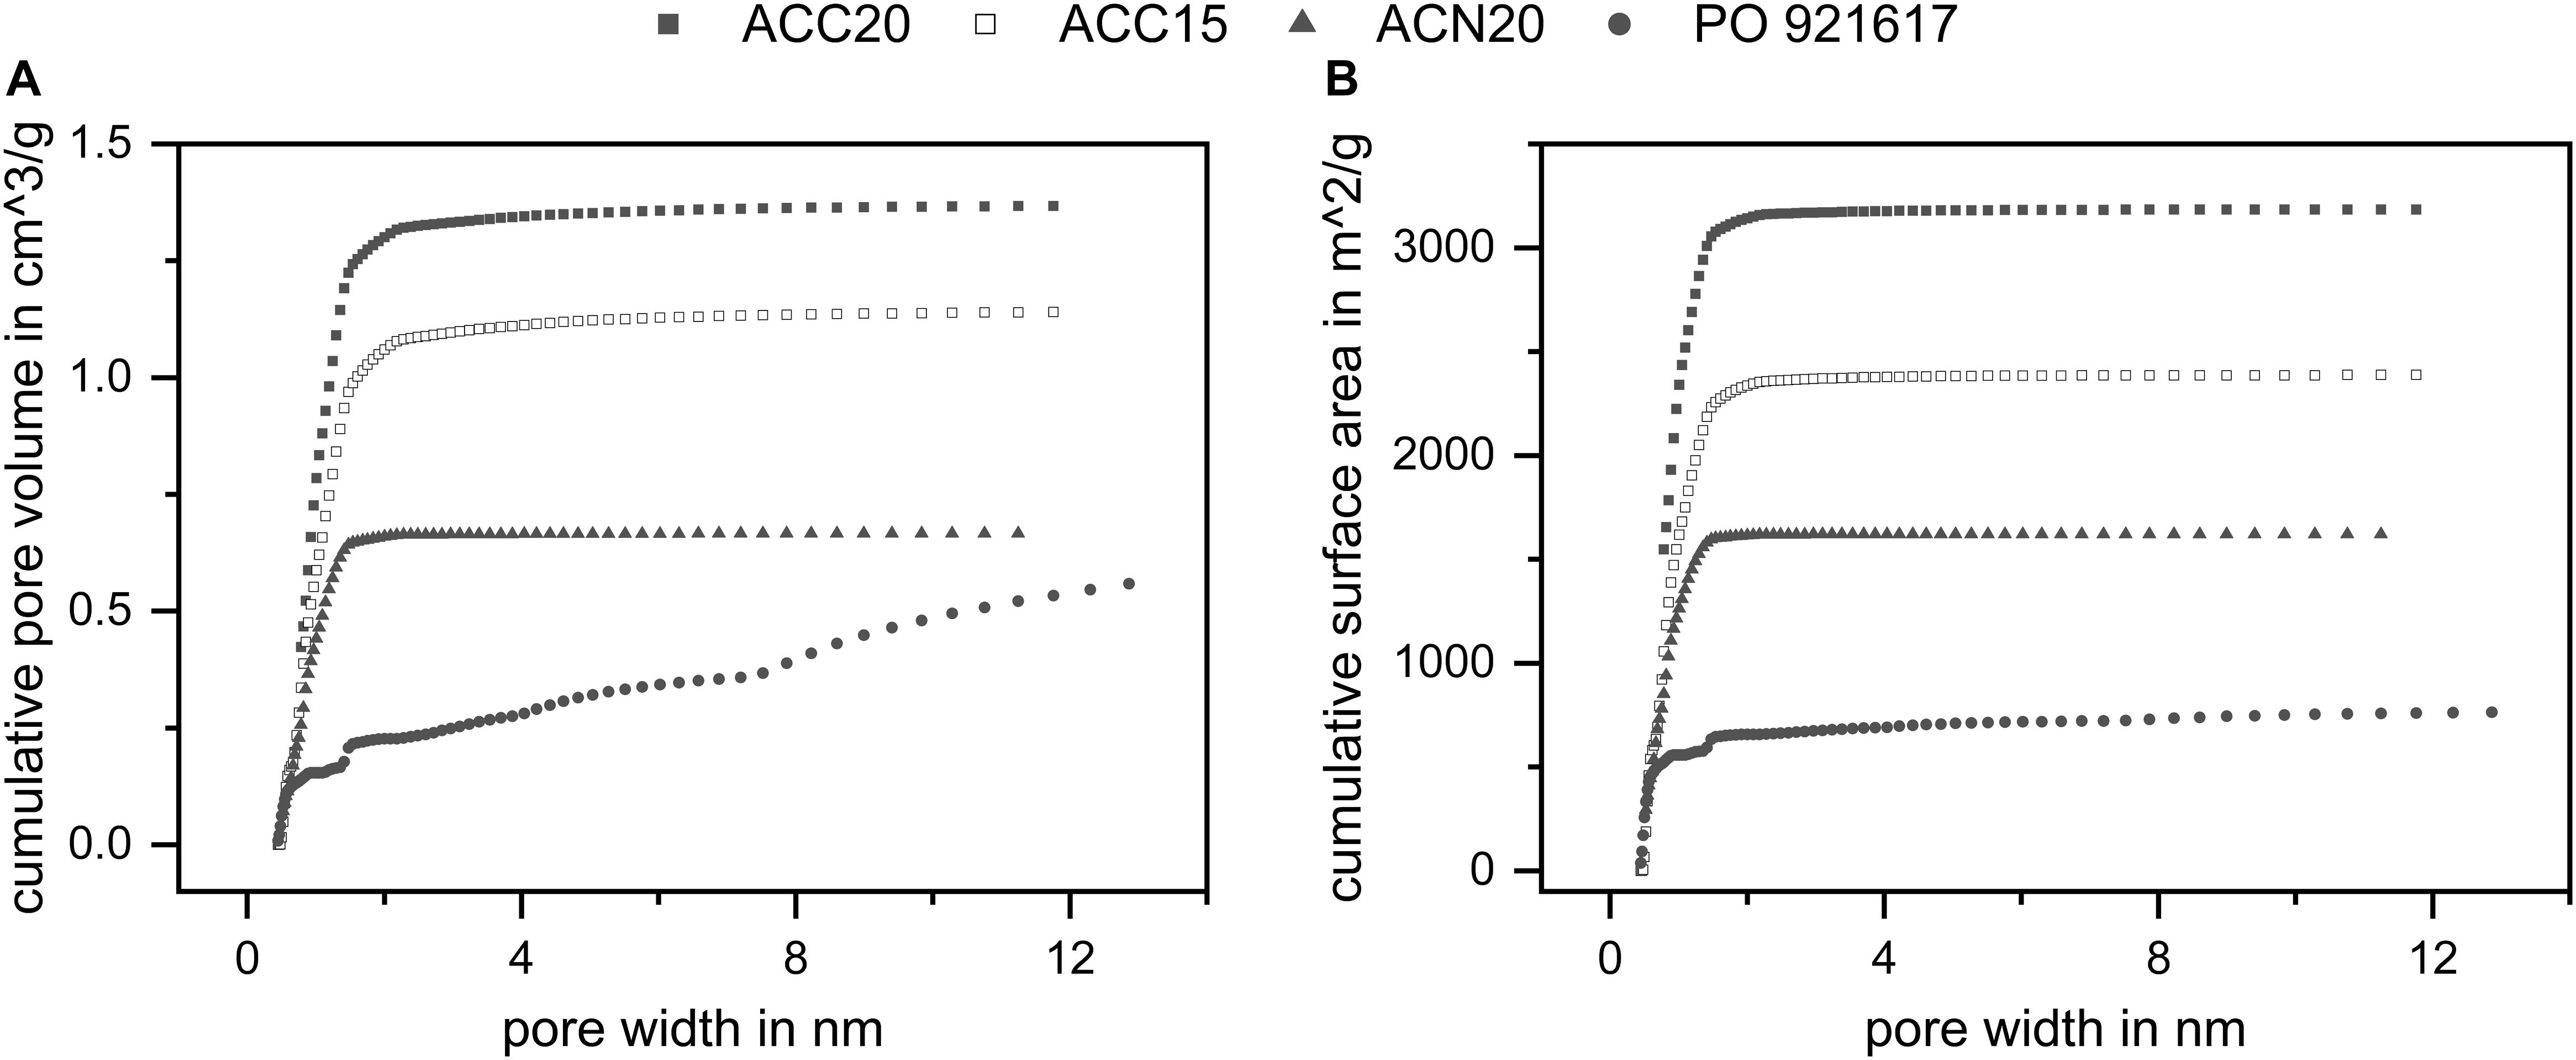
Figure 3. Results of the BET measurements. (A) Cumulative pore volume and (B) cumulative surface area in dependency of the pore size. All materials show high surface areas and high pore volumes. The results indicate narrow pore size distributions for ACC20, ACC15, and ACN20 as well as a broader distribution for PO921617.
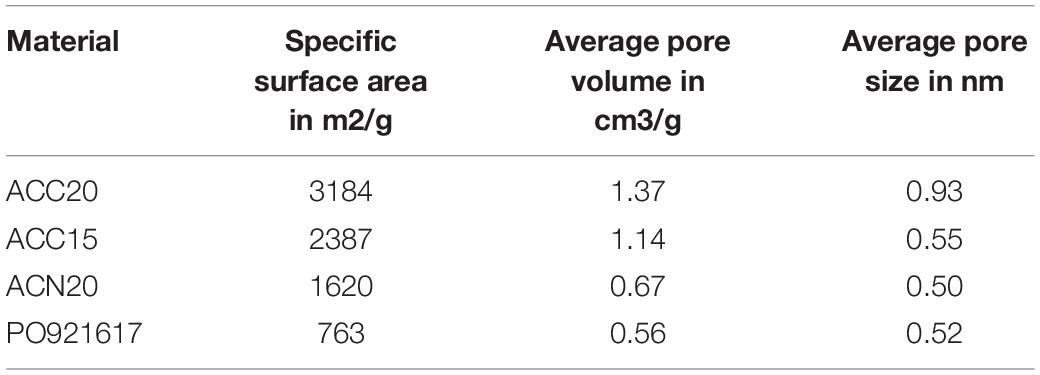
Table 2. BET results.
Electrochemical Impedance Spectroscopy
In Figure 4 the experimental results of the EIS measurements are presented in Nyquist plots (left column) and in the new NIF plots (right column) for each material. Vertical lines were added to the NIF plot for a better indication of the different frequency ranges (compare dotted lines). It can be seen, that for all materials a typical Nyquist plot for a porous electrode material results, showing more or less pronounced the three characteristic parts which were described in section “Definition of the Nyquist Incline Frequency Plot.” The resistance of the electrolyte solution is comparable for all four materials, differences appear due to the slightly varying positions of the reference and counter electrode in the setup. The materials show slightly different contact resistances which we refer to the different morphologies and the resulting contact points between the carbon material and the current collector. The specific capacities of the different materials were estimated according to Equation 2 and can be seen in Figure 5. As can be expected, the determined specific capacities show an increase with increasing electrolyte concentrations. However, due to the strong enrichment of counterions in the electric double layer even at low corresponding bulk concentrations, this effect is not very pronounced. In addition, it has to be considered, that the EIS measurements were conducted with an amplitude of the electrical potential of only 10 mV. Typically used measurements to derive the specific capacities of electrode materials are done by Cyclovoltammetry (CV) where a larger voltage window is scanned leading to higher capacity values. This method is therefore usually chosen as the voltage window is more representative and comparable to CDI measurements. However, by comparing the specific capacities determined by EIS with CV measurements (compare Supplementary Figure S3) it can be seen that for high concentrations EIS is a valuable tool which enables fast and suitable approximations for the specific capacities.
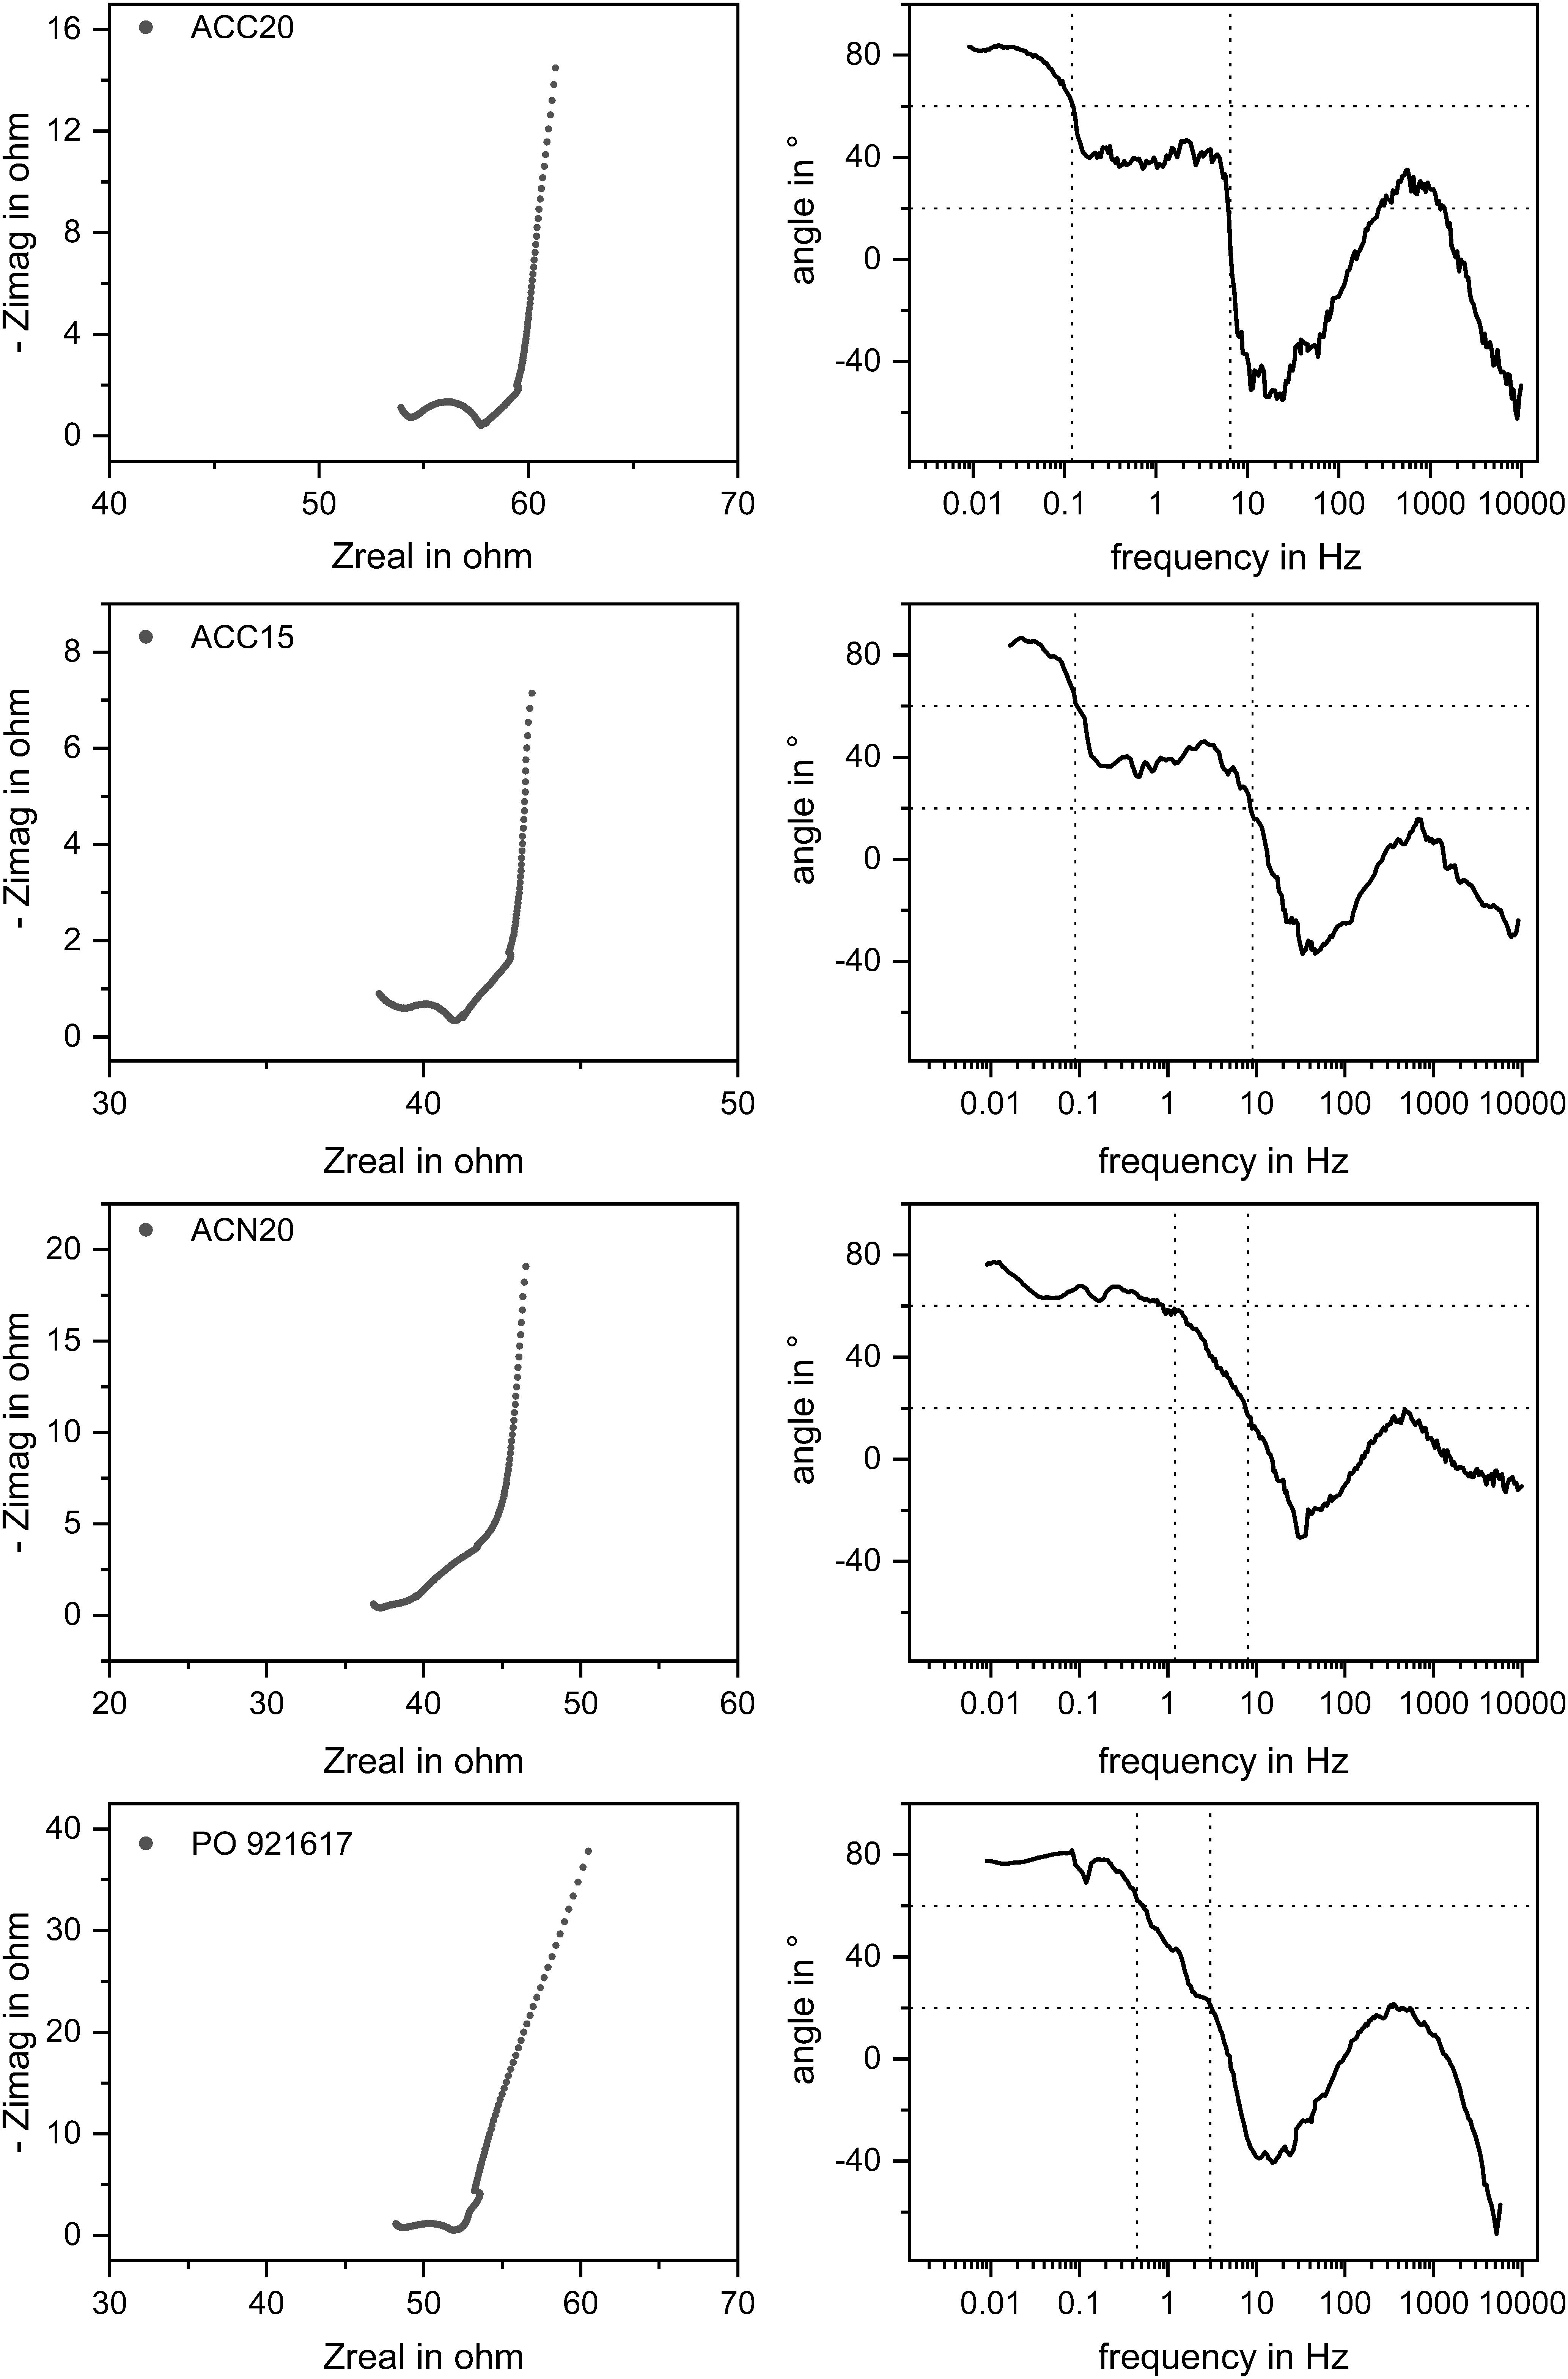
Figure 4. Results of EIS measurements of the different electrode materials in a 50 mM NaCl solution. The Nyquist and the NIF plots are shown for all materials which are indicating the three characteristic parts in the Nyquist and NIF plots. Similar contact resistances can be seen whereas differences appear by looking at the slopes in the medium and low frequency parts leading to different material characteristics like specific capacitances and diffusion behaviors.
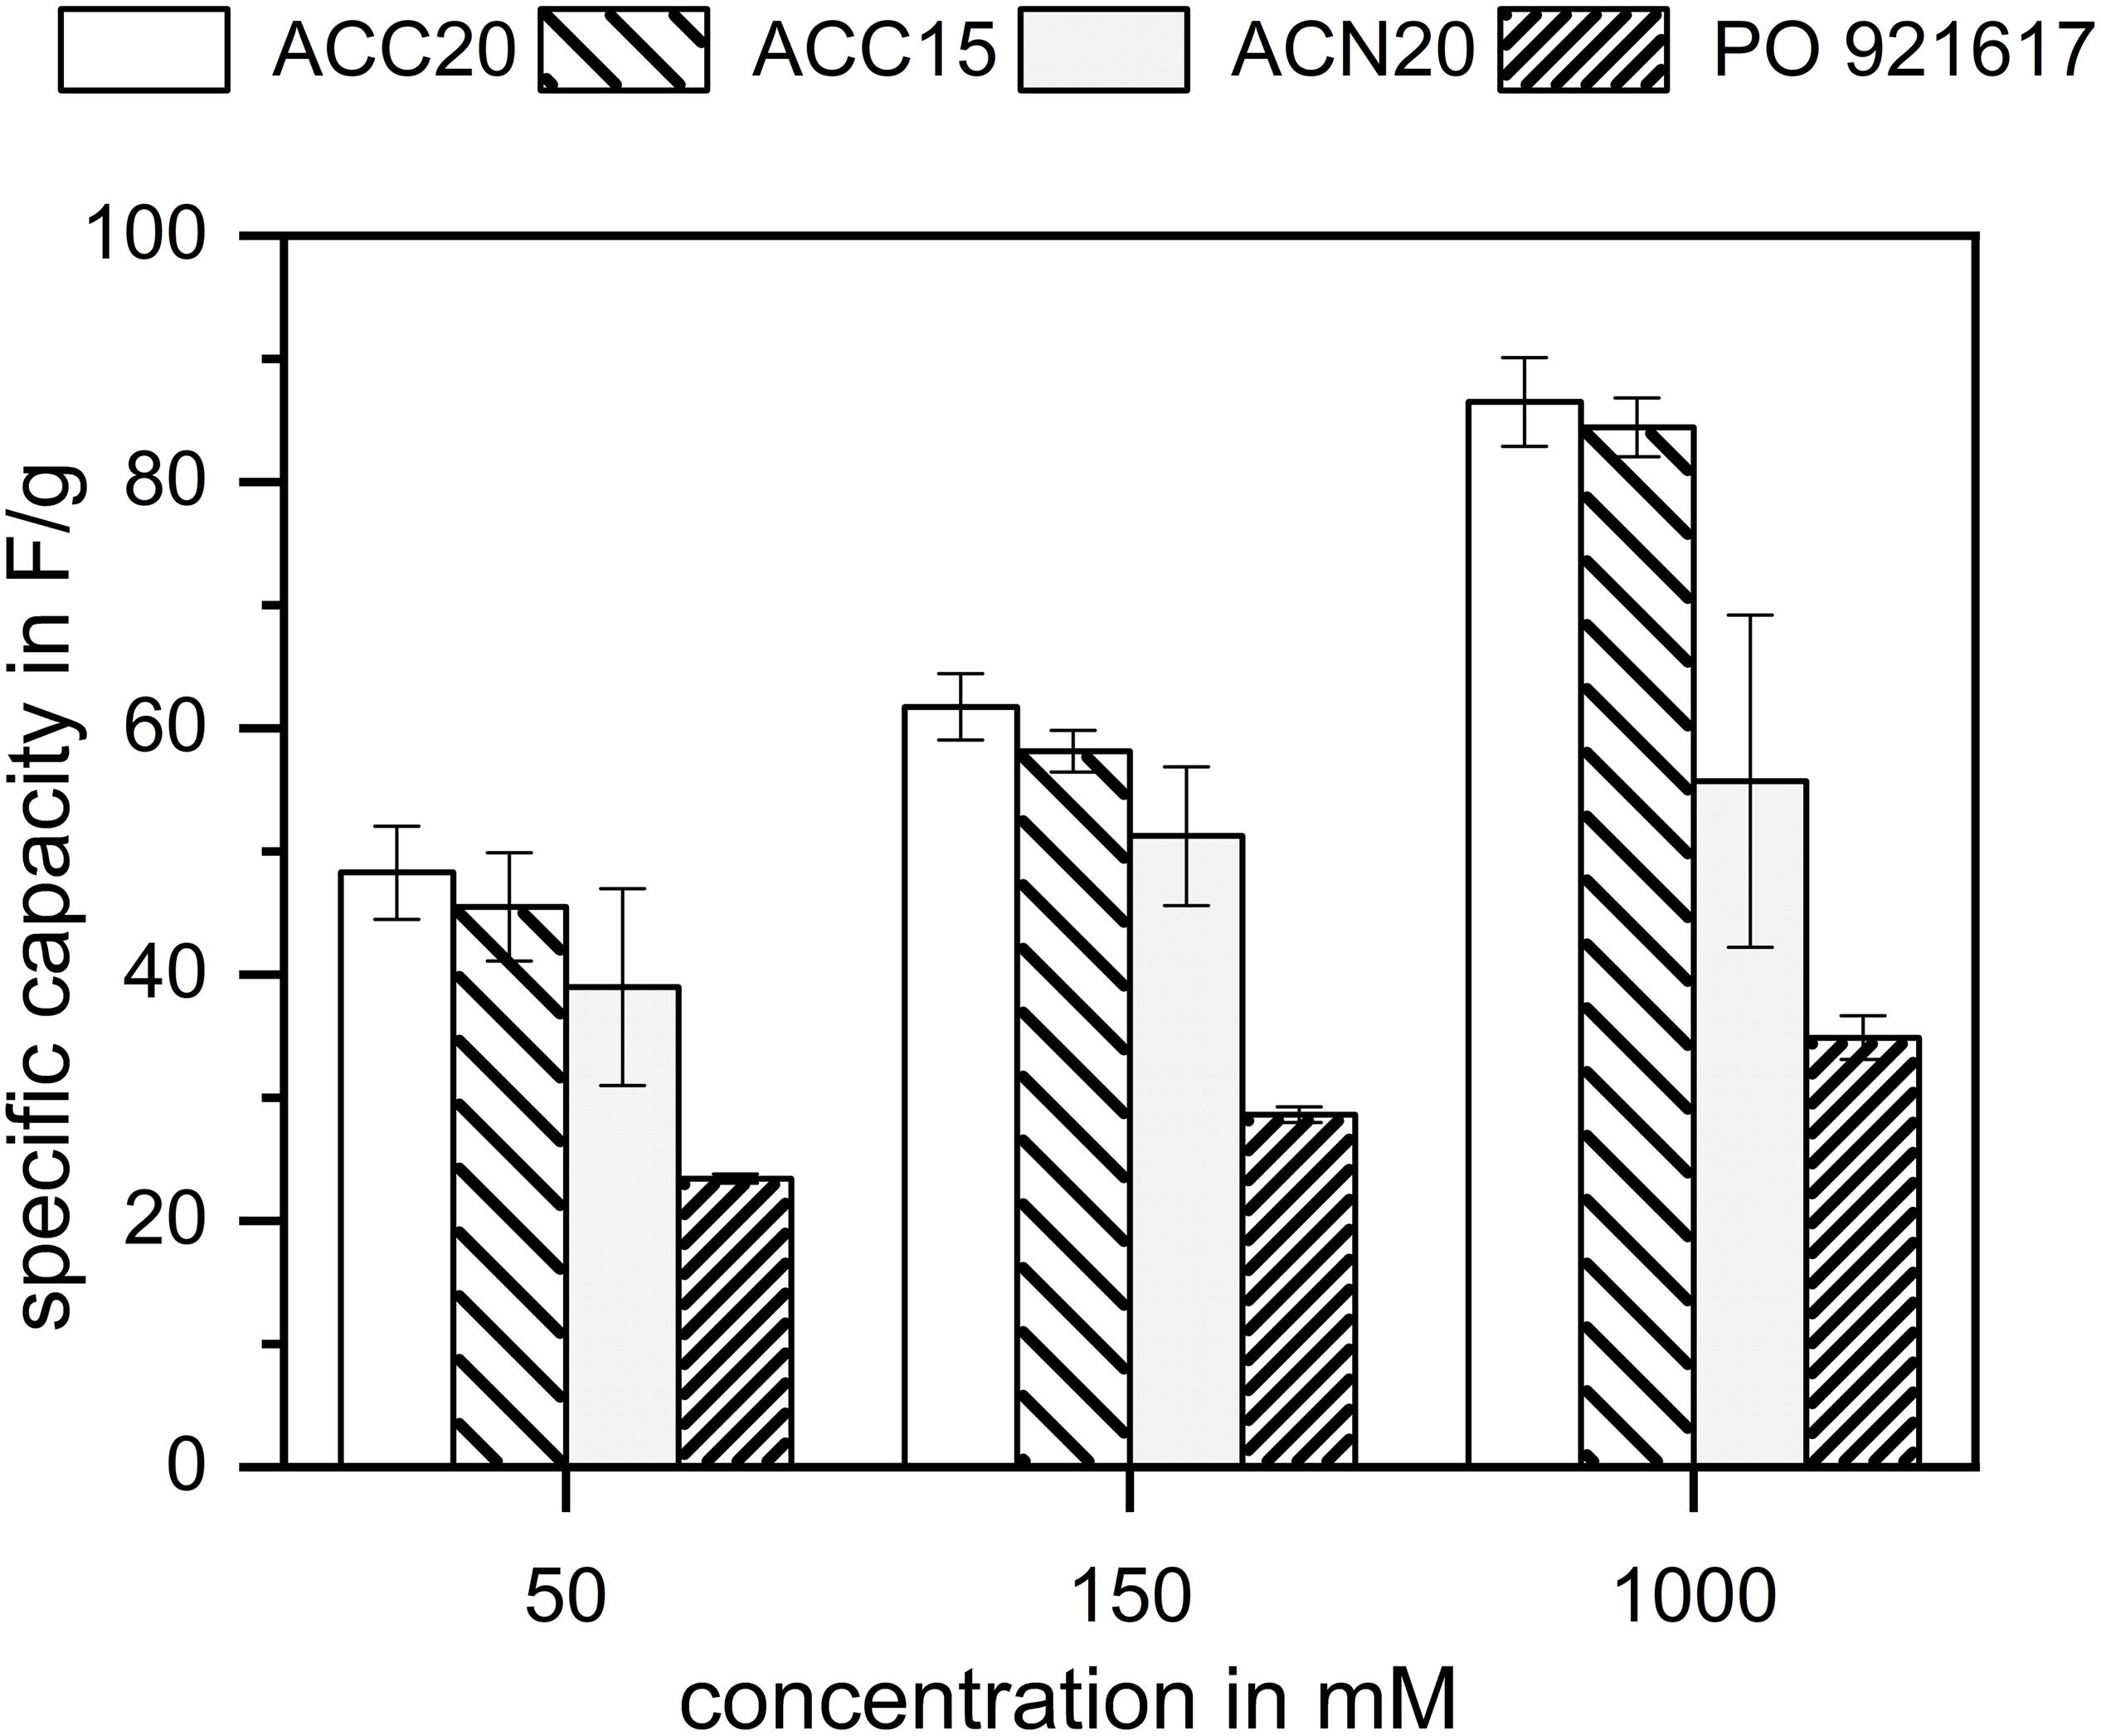
Figure 5. Specific capacitance values of the investigated carbon materials estimated by the EIS measurements at low frequencies. For each electrolyte concentration investigated, the specific capacitances follow the trend of the specific surface areas determined by BET. In case of the materials with the highest specific surfaces, the relationship is not proportional, indicating that the largest pores of the material ACC20 do not fully contribute to the specific capacitance.
Comparing the materials to each other, it can be found that ACC20 shows the highest and PO921617 the lowest specific capacity for all concentrations. Taking the BET results into account this behavior is in accordance to literature were it is assumed that high specific surface areas lead to high specific capacity values (Porada et al., 2013).
The Nyquist Incline Frequency (NIF) plot was used to analyze the kinetics of the electrosorption process within the different carbon materials. As explained in section “Definition of the Nyquist Incline Frequency Plot” the angles of the NIF plot at low to medium frequencies are determined by coupled diffusion and electrosorption effects. In Figure 4 it can be seen that the plots of the materials ACC20 and ACC15 indicate the typical plateau around 45° in a frequency range of 0.1 to 10 Hz. However, this clear plateau is not visible for ACN20 and PO921617. Here the angle of the NIF plot is constantly decreasing within the mentioned frequency range. Of particular interest is the difference in the NIF plots of the carbon materials ACC20 and ACN20. Both materials are derived from activated, carbonized fibers resulting from a phenolic precursor. The fibers have the same diameter of 10 to 15 μm and underwent the same degree of activation. The clear difference in the electrosorption behavior in the low to medium frequency range, therefore has to be related to the way, the fibers are woven to a macroscopic carbon material. As shown above, in case of ACC20 the fibers are densely aligned into macroscopic strands, while in case of ACN20, the fibers form a more loosely packed felt with an irregular structure. This shows that in case of the material ACC20 the distinctive sections in the Nyquist and NIF plot which indicate coupled diffusion and electrosorption can be related to transport processes at this macroscopic scale of a few hundred micrometers. While mass transport through the narrow gaps between the densely packed carbon fibers dominates the low frequency kinetics in the material ACC20, the more open structure of ACN20 does not show this limitation. In section “CDI Behavior of the Carbon Materials” we will investigate if these findings determined by EIS can be transferred to the prediction of CDI kinetics.
For an easy comparison of all materials investigated, Figure 6 summarizes the frequency ranges of the parts of the NIF plots which are dominated by diffusion effects. The figure shows that for the materials ACN20 and PO921617 the ‘diffusion dominated’ part is less pronounced and shifted to higher frequency ranges whereas diffusion plays an important part even at low frequencies for ACC20 and ACC15. Although we are well aware that there exists no sharp boundary between frequencies which show diffusion dominated behavior of EIS and somewhat smaller frequencies resulting in an almost ideal capacitive behavior (phase angle approaching 90°), we believe that the left boundary (lowest frequency with substantial diffusion limitation) of the determined frequency range is a suitable measure to compare electrosorption kinetics of different materials, as long as the applied electrolyte concentration is kept constant. A high frequency value of this left boundary can be interpreted in a way that the investigated carbon material is able to approach the quasi equilibrium state of pure capacitive behavior even at rather fast changes of the applied electrical potential. Therefore, such a material shows faster electrosorption kinetics than e.g., a second material having its left boundary of the frequency range at a lower frequency. The observed trend of this left boundary frequency of our materials is in good accordance to the discussion about the material morphologies given in the preceding paragraph. ACC20 and ACC15 show an ordered structure and a dense fiber packing in the aligned strands whereas especially ACN20 has a loose structure which enables an easy accessibility of the bulk solution to the fibers. PO921617 shows several cracks between the carbon aerogel sheets and the sheets themselves have a high amount of larger mesopores, facilitating the transport of ions toward and within the carbon aerogel. A slight difference in between the carbon cloth materials ACC20 and ACC15 can also be seen. This difference can be explained by a higher cumulative pore volume and a higher average pore size for ACC20. Therefore, in case of ACC15 the mass transport limitation is even more pronounced than in case of ACC20. Furthermore, it can be said that the overall reproducibility of the EIS measurements and the evaluation with the Nyquist and NIF plot is high and only small error bars can be seen in Figures 5, 6. This is further explained and visualized in Supplementary Figure S4.
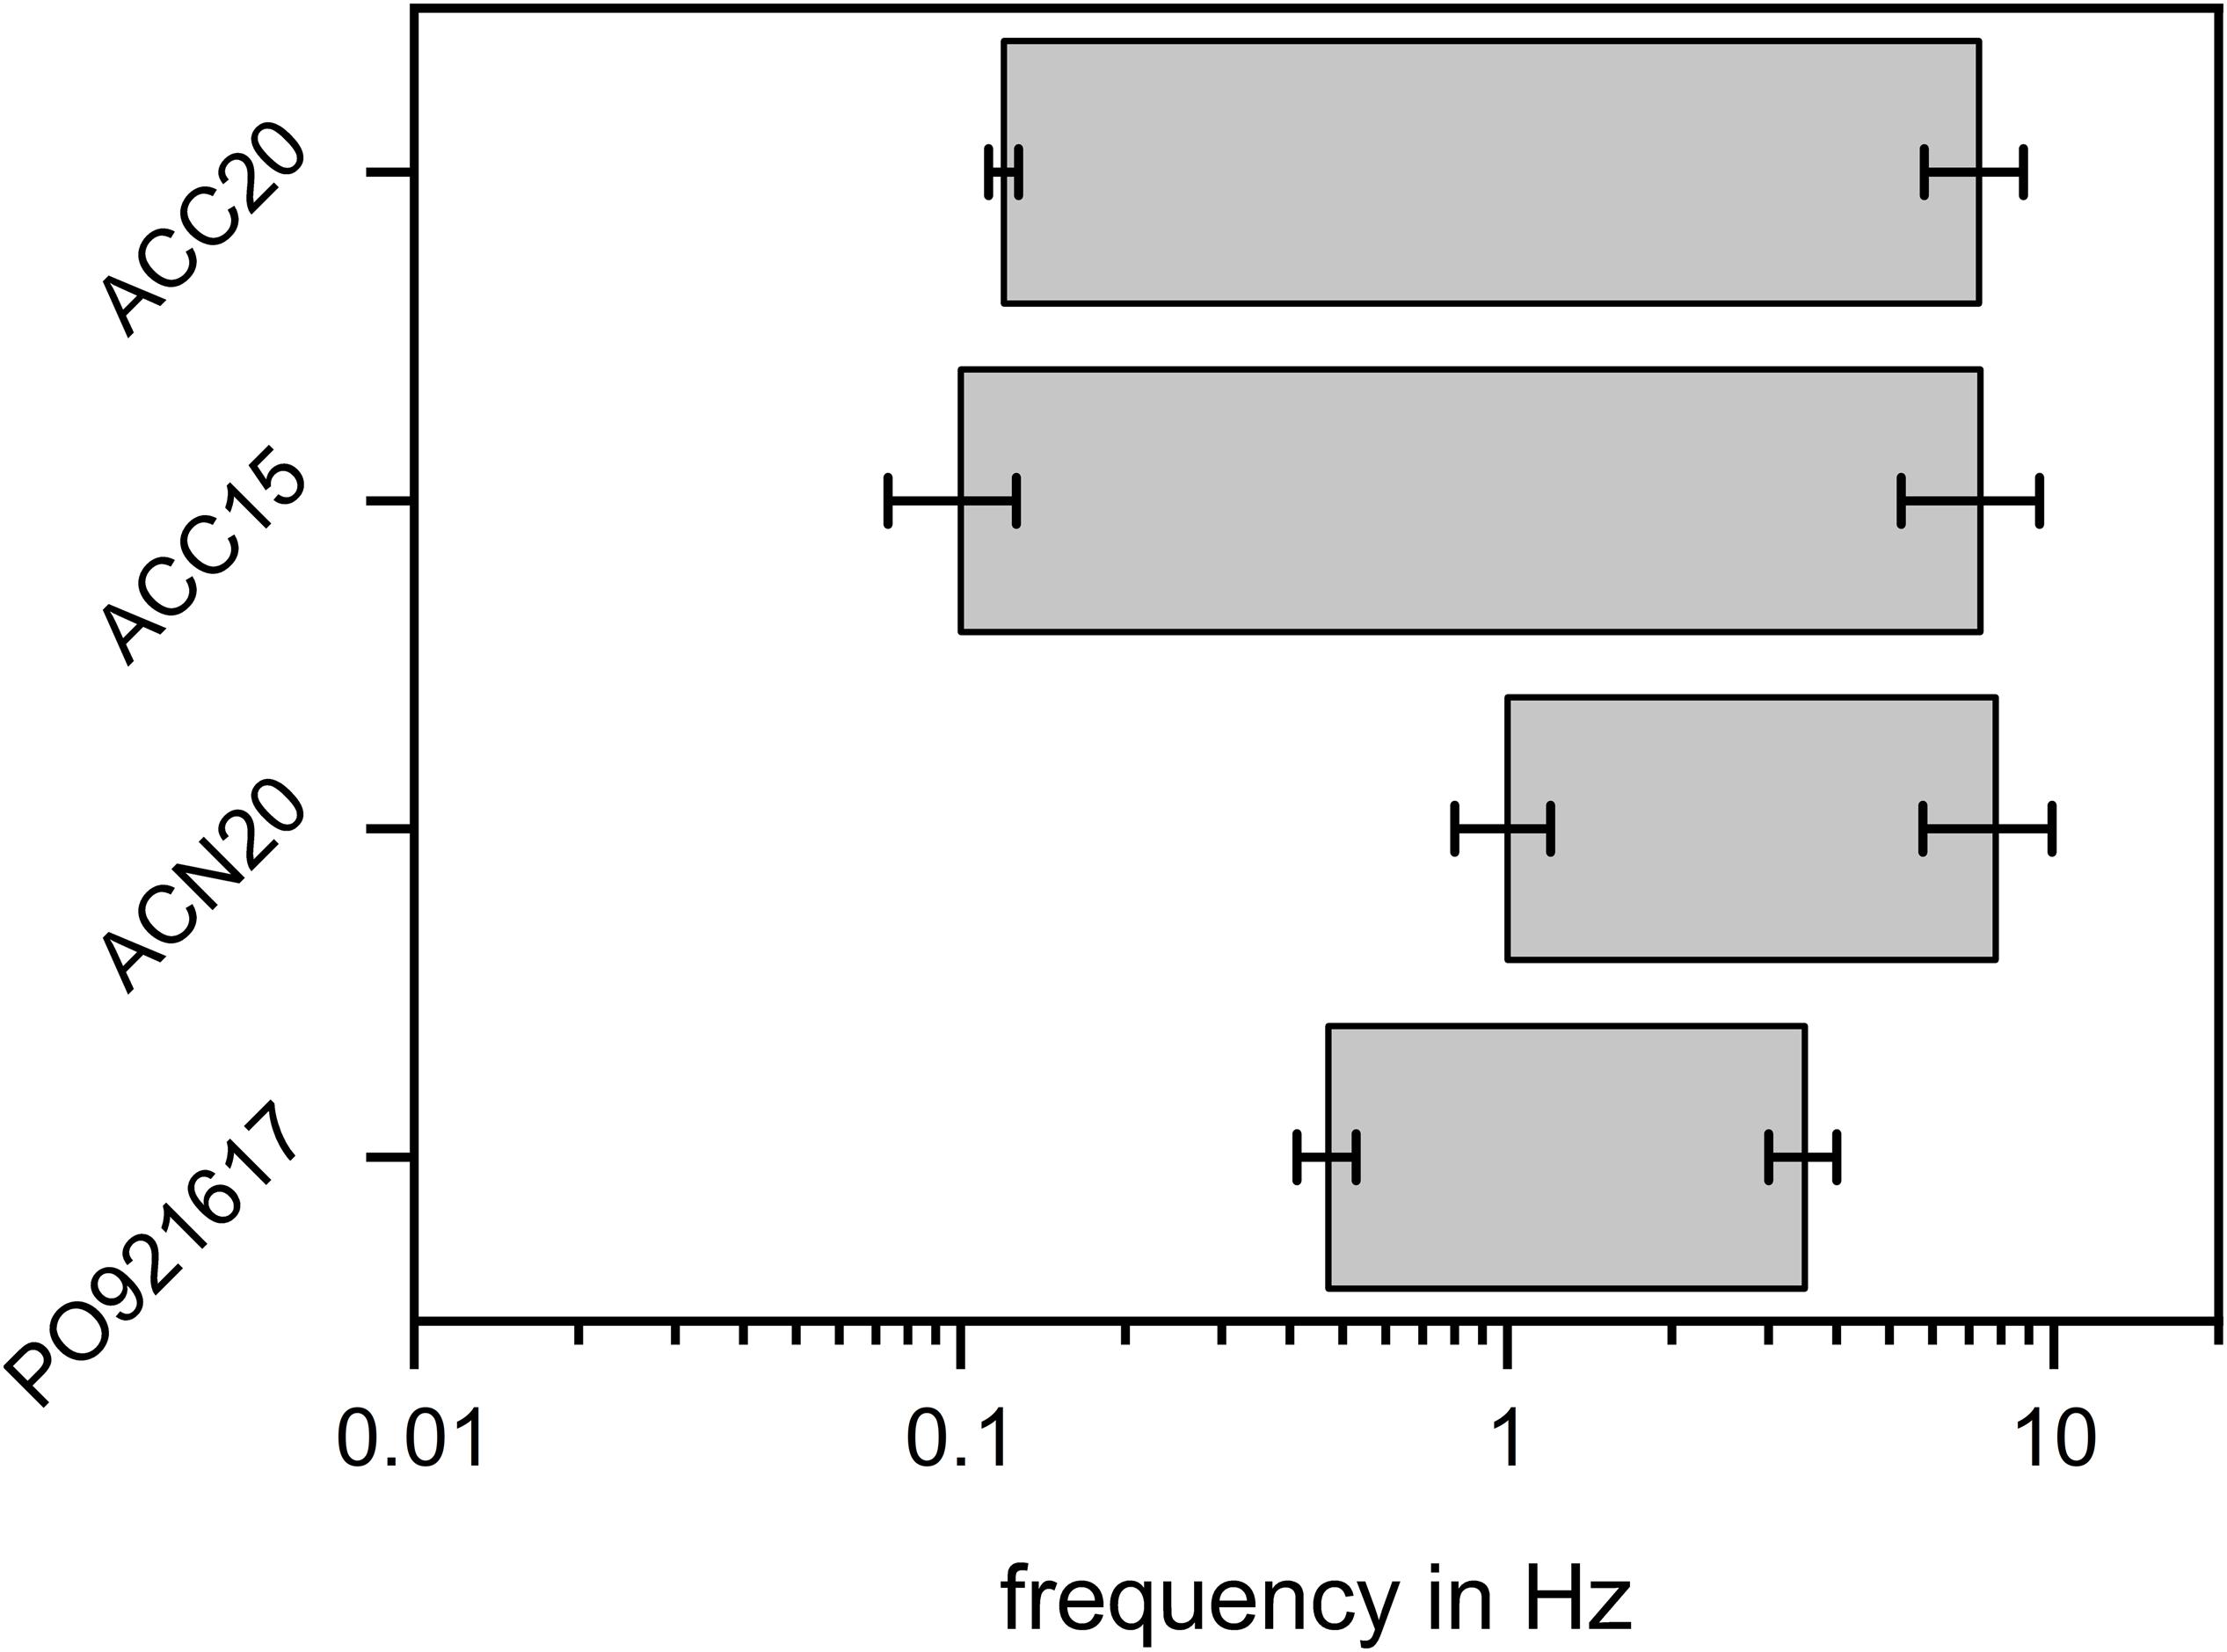
Figure 6. Frequency ranges in which the EIS behavior is dominated by diffusion processes. The frequency ranges are derived from the NIF plots for angles between 60° and 20°. While the materials ACC20 and ACC15 show a pronounced frequency range in which mass transfer effects play an important role, this range is much smaller and shifted toward higher frequencies for the materials ACN20 and PO921617.
In addition, the NIF plot offers the chance to see how further aspects, like the pore size distribution and pore shape, influence the results of the EIS measurements. For this, the angles which are characteristic for certain mechanisms in EIS and their corresponding frequencies are further discussed. Looking at the NIF plots shown in Figure 4 it can be seen that in the low frequency range a phase angle of around 80 degrees was achieved during the experiments. Following Dsoke et al. (2013) this leads to the assumption that all materials behave like imperfect capacitors due to a broader pore size distribution. ACN20 shows the lowest deviation from a perfect capacitor which corresponds to the narrowest pore size distribution determined by BET measurements (compare section “Materials Characterization”). By looking at the NIF plot of PO921617 it can be seen that the angle at the lowest frequencies deviates even more from 90° for this material. This fits in with the results achieved by gas adsorption measurements indicating a broader pore size distribution for PO921617 in comparison to the other materials. Looking to the medium frequency range of the materials ACC20 and ACC15 it can be seen that the plateau appears somewhat below 45° degrees. Following Dsoke et al. (2013) it can be assumed that the pore shapes are not ideally cylindrical and may even appear as bottleneck shaped pores. EIS experiments with different electrolyte concentrations were conducted in order to see the influence of this parameter onto the frequency range which is dominated by diffusions effects. The measurements were derived with different electrolyte concentrations ranging from 25 mM up to 1000 mM. The results are plotted in Figure 7 where you can see the NIF plots of the materials ACC20 (A) and PO921617 (B), the Nyquist plot of ACC20 (C) as well as the frequency ranges (d) of diffusion limitation extracted from the plots (A) and (B). Looking at the Nyquist plot, the different electrolyte concentrations mainly show an effect on the electrolyte and contact resistance in the high frequency area. The electrolyte resistance results in an increasing shift on the x-axis with decreasing electrolyte concentration. At the same time, the increasing electrolyte resistance also increases the contact resistance, represented by the depressed semi-circle in the Nyquist plot. The NIF plots of all electrolyte concentrations investigated cover the whole frequency range and show more pronounced differences in the low to medium frequency range, which is of special interest for CDI kinetics. The NIF plots for ACC20 and especially the ones for PO921617 show that the frequency range in which diffusion is dominating is strongly dependent on the electrolyte concentration. As can be expected, in all cases the plots are shifted toward lower frequencies for low electrolyte concentrations. In the NIF plot of ACC20 the typical diffusion dominated plateaus are clearly visible for low concentrations (25 and 50 mM) but disappear for higher concentrations (150 and 1000 mM). As already discussed in Figure 5 the irregular structure of PO921617, having a broad pore size distribution, does not show such a distinctive plateau. However, the frequency range in which the NIF plots undergo the transition from high angles (> 60°) toward small ones (< 20°) also shows a clear shift toward lower frequencies with decreasing electrolyte concentration. Furthermore, by looking at the frequency ranges where diffusion dominates (Figure 7D), it can be seen that ACC20 is always shifted to even lower frequencies than PO921617. Again, this shows that ACC20 is affected more by mass transfer limitations.
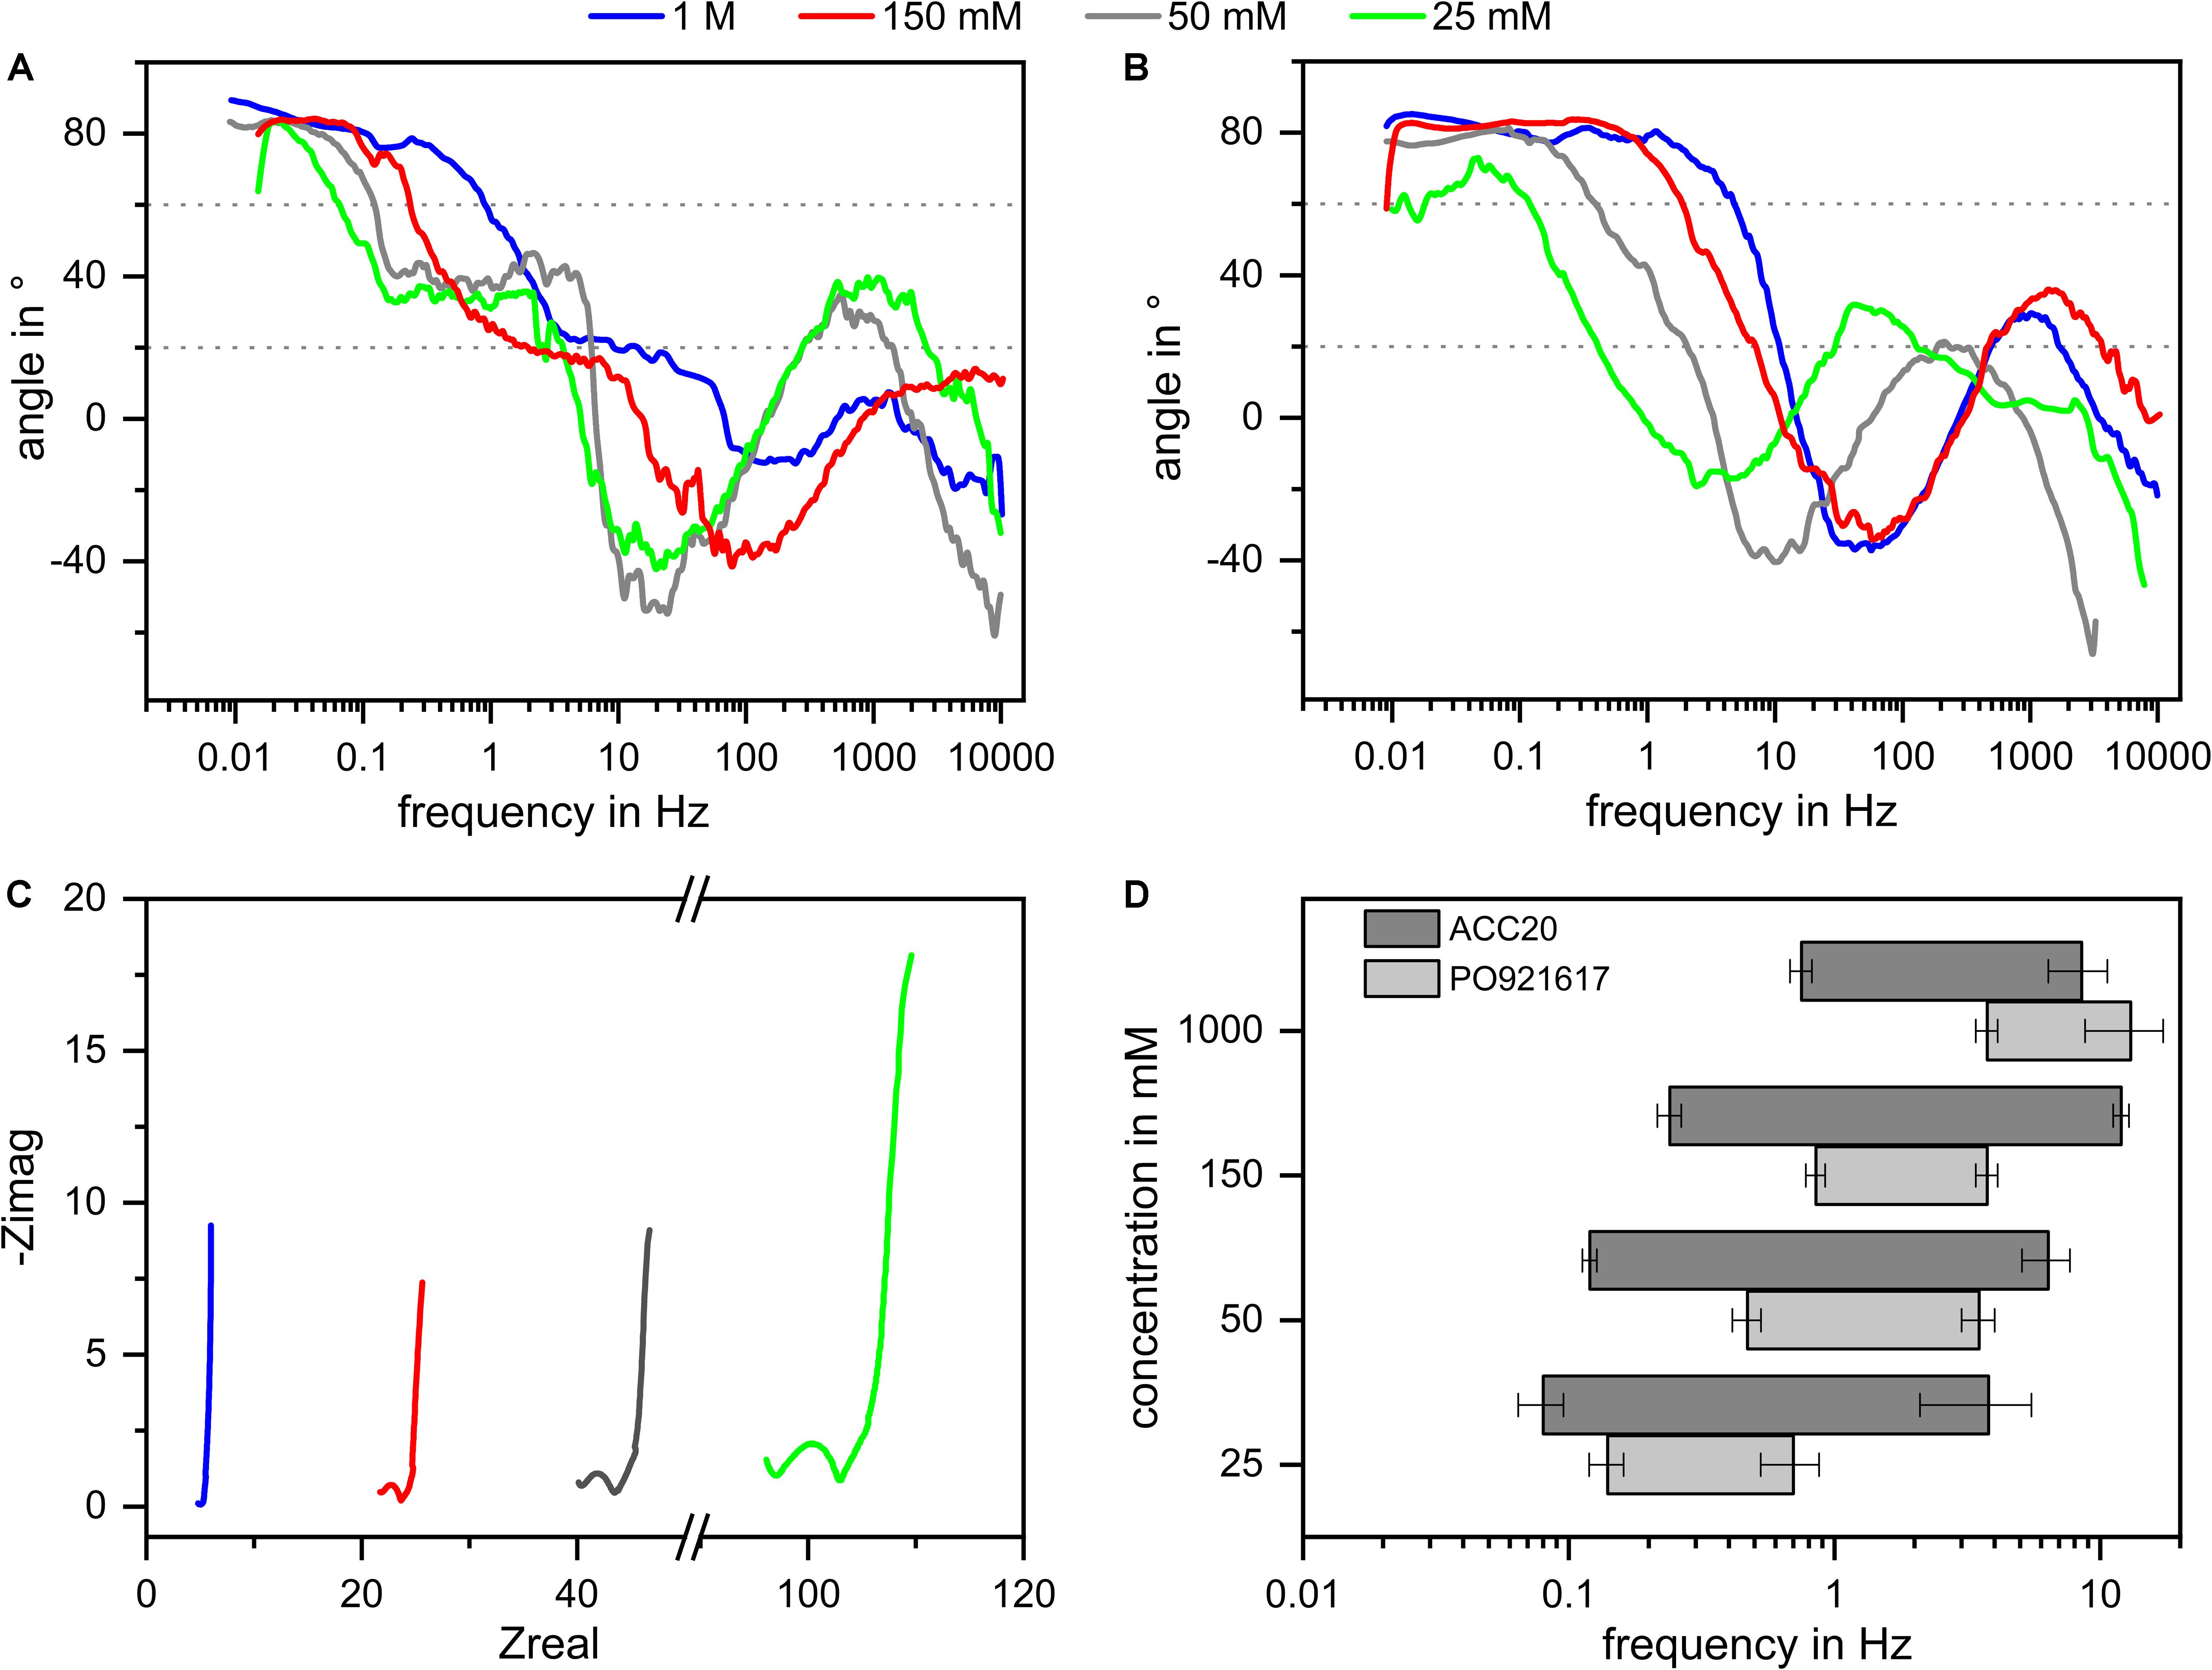
Figure 7. Influence of the electrolyte concentration onto the diffusion dominated frequency range in EIS experiments. The NIF plots of the materials ACC20 (A) und PO921617 (B) are plotted for the concentrations 25, 50, 150, and 1000 mM as well as the Nyquist plot for ACC20 (C) and the frequency ranges (D) in which diffusion effect dominate the EIS results. Plot (A,B,D) clearly show that lower electrolyte concentrations shift the diffusion dominated frequency range toward lower frequencies.
CDI Behavior of the Carbon Materials
To answer the question whether the diffusion effects detected by EIS are suitable to predict the CDI kinetics of the materials, electrosorption experiments were derived by using a tailor-made flow-by CDI cell. Results are presented in Figure 8. For the comparison of the deionization capacity of the materials, the SAC values were calculated by using Equation 3. The highest SAC value of 0.11 mM/g was achieved for ACC20, followed by 0.087 mM/g of ACN20, 0.084 mM/g for ACC15 and 0.042 mM/g for PO921617. Comparing these values to the results of the EIS measurements, it can be seen that the materials which showed high capacities in the EIS also showed high SAC values in the CDI experiments. However, our study was focused onto mass transfer limitations of different carbon materials and their influence onto CDI kinetics. In order to separate the kinetic effects from the capacity effects onto the time course of the effluent concentration of the CDI cell, the amplitude of the concentration profiles was normalized. This was done by defining the concentration range between the minimum during the adsorption step and the maximum during the desorption step as 100% (see Figure 8A). For normalization the concentration profiles in stationary state (third cycle) were used, which is why initial adsorption minima in the first cycle can reach values below zero. A comparison of the normalized plots in Figure 8 clearly indicates that ACN20 shows the fastest CDI kinetics, as the adsorption and desorption steps fully complete in less than half the applied durations of the respective steps. Of the remaining three materials, the carbon aerogel PO921617 shows acceptable kinetics, while both carbon cloth materials ACC15 and ACC20 are unable to complete desorption within the applied duration of 1200 s. Comparing the kinetics of the CDI experiments with the lower limit of the diffusion dominated frequency range in the NIF plots (Figure 6), a clear relationship can be recognized. The NIF plot predicted less diffusion limitations, corresponding with a higher ‘lower frequency limit,’ for ACN20 (1 Hz) and to a reduced extend also for PO921617 (0.5 Hz). Looking at the CDI experiments, this prediction about the kinetics can be confirmed. For the materials ACC20 (0.12 Hz) and ACC15 (0.1 Hz) a more severe effect of diffusion limitation was predicted, which can also be seen by strongly reduced CDI kinetics in Figure 8A. Comparing the NIF plots of the two carbon cloth materials, a slightly higher diffusion limitation was predicted for ACC15, which can be found as well in the concentration plots of the respective CDI experiments. To further validate EIS data as a prediction tool for CDI kinetics we present a semiquantitative analysis in Figure 8B. Here we show the characteristic time constants achieved by EIS and CDI (compare Equation 4 and 5). In case of the CDI experiments, the characteristic time constant τCDI was defined as the time from the beginning of the adsorption cycle tstart until the adsorption minimum tmin (compare red arrows in Figure 8A). For EIS, the reciprocal value of the ‘lower frequency limit’ fdiff,start of the diffusion dominated frequency range multiplied by a factor of 60 was used to estimate the characteristic time constant τEIS.
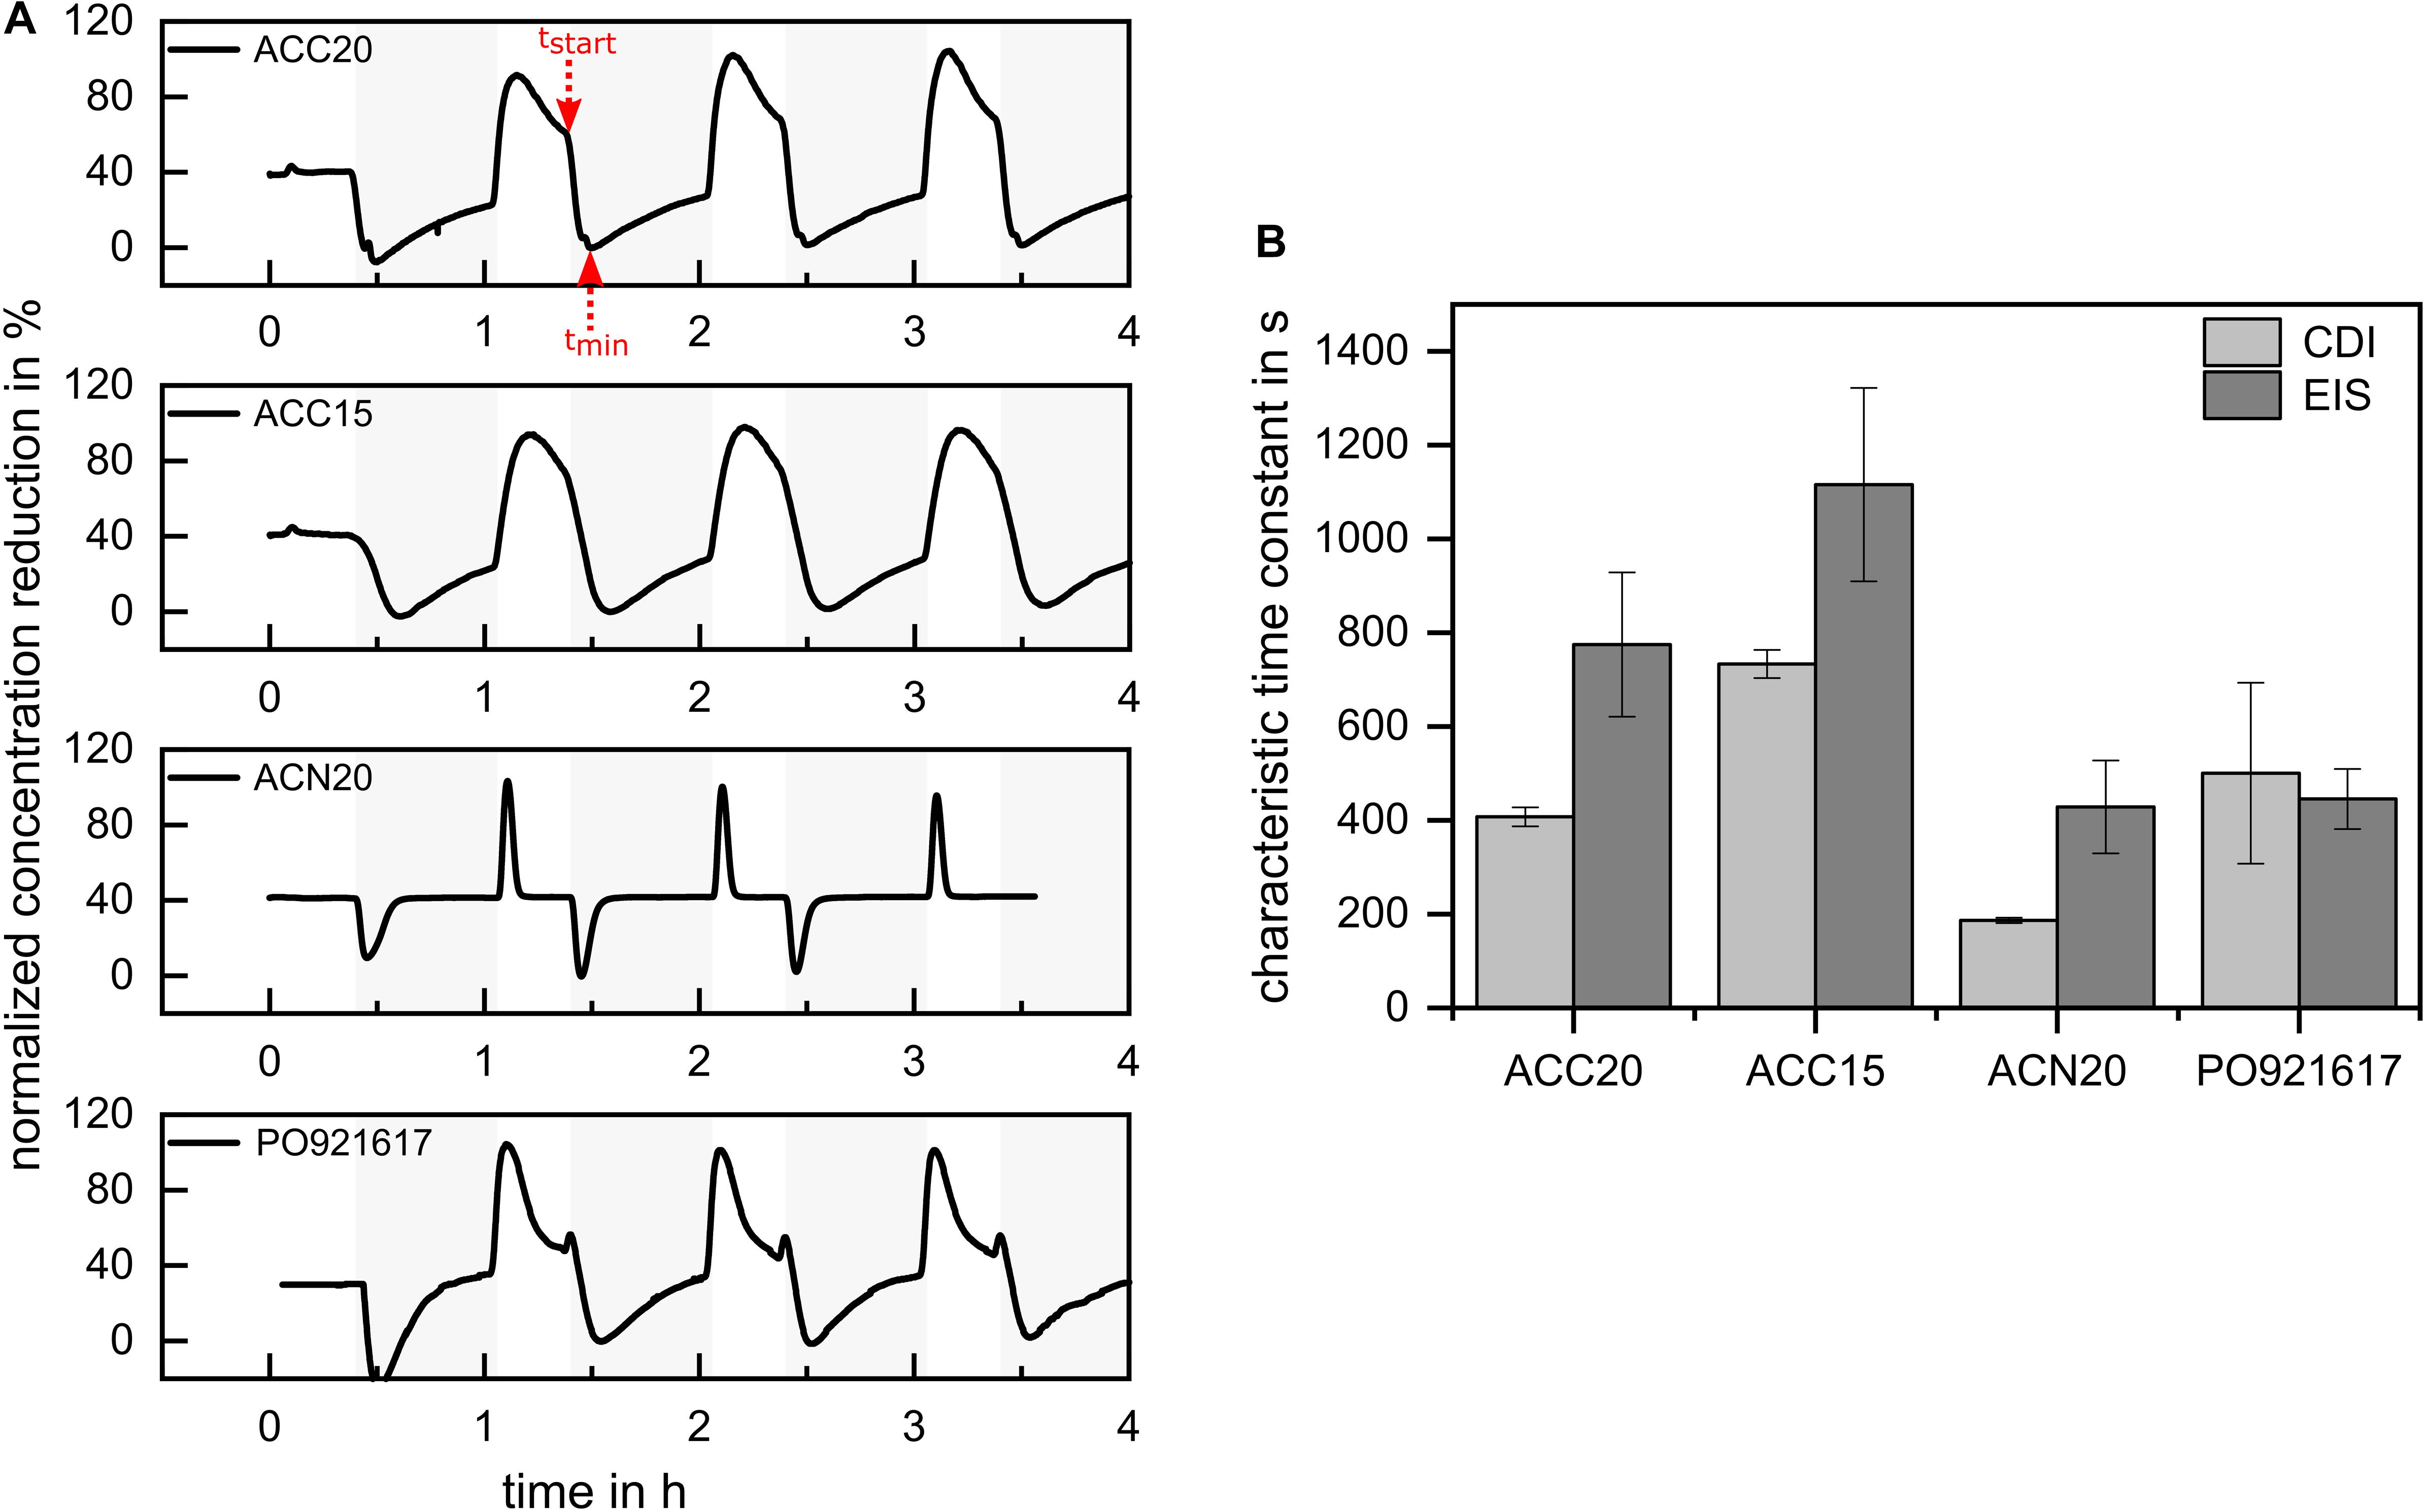
Figure 8. (A) Effluent concentration profiles derived by CDI experiments. Adsorption phases are marked in light gray. The concentration profiles are normalized by setting the concentration range between the minimum during the adsorption step and the maximum during the desorption step as 100%. The observed CDI kinetics show a clear relationship toward the lower limit of the diffusion dominated frequency range in the NIF plot. (B) Comparison of characteristic time constants estimated by EIS and CDI.
The factor 60 results from the assumption that in zero order approximation the equation of an ideal capacitor (Q=C×U) can be used to estimate the charge accumulated in the carbon material in dependence of the applied voltage (10 mV for EIS and 600 mV per electrode during the CDI process). Therefore, on the one hand, the specific number of ions stored in the EDLs in order to compensate the electric charge is roughly 60 times higher in case of the CDI than in case of the EIS experiments. On the other hand, the maximum driving force for diffusion within the liquid is proportional to the concentration, which is kept constant in both experiments. In consequence, the same driving force must transport 60 times the number of ions in case of the CDI, which is why the process takes about 60 times longer. We are well aware, that this simple rule of thumb will not be able to accurately predict the characteristic times of CDI kinetics, however, it should be able to deliver the order of magnitude and relative order between the different materials. Looking at Figure 8B it can be seen that this expectation is well fulfilled. It can be seen, that the prediction has the tendency to overestimate the characteristic time up to a factor of two, but the relative order between the kinetics of the electrode materials when applied for CDI is correctly described. Therefore, EIS analysis in the form of a NIF plot is a helpful tool for an easy and fast prediction of the kinetics of electrode materials.
Conclusion
In this paper we investigated how material properties influence the kinetics of CDI by using a new method to interpret EIS measurements. The EIS results of four different carbon-based materials were discussed in regard to SEM images, BET measurements and electrosorption experiments. In particular the analysis of the newly introduced NIF plot allows a better understanding of how the macroscopic and microscopic structure of the carbon materials affects their kinetic properties. We showed, that in case of nanoporous carbon fibers, the kinetic properties are determined by the way how these fibers are macroscopically arranged. In terms of densely packed fiber strands the NIF plot shows a pronounced plateau at an angle of around 45° that result from a coupled diffusion/electrosorption process within these strands. For materials with an irregular, less densely packed structure a gradual transition from a capacitance to a mass transfer dominated EIS behavior could be detected. In the NIF plot this behavior was visualized in a gradually decreasing angle with increasing frequency without the formation of a plateau. By comparing the kinetic behavior observed in EIS and in CDI experiments it could be shown that despite the different setups and applied voltages, the relationship between the materials follows the same trend. Therefore, the new approach for analyzing EIS results is a valuable and convenient tool for the investigation and optimization of carbon-based materials for capacitive deionization. Furthermore, an analysis of EIS results by means of the new NIF plot can also be suitable for the interpretation of electrochemical kinetics of carbon-based materials for other applications, like super capacitors or batteries.
Data Availability Statement
The raw data supporting the conclusions of this article will be made available by the authors, without undue reservation.
Author Contributions
ML and MF wrote the manuscript and developed the concept of the manuscript. ML and JZ conducted the preliminary studies and the experimental work.
Conflict of Interest
The authors declare that the research was conducted in the absence of any commercial or financial relationships that could be construed as a potential conflict of interest.
Acknowledgments
The authors would like to thank the German Federal Ministry of Education and Research for the funding (FKZ: 13XP5038B) as well as the KIT-Publication Fund of the Karlsruhe Institute of Technology for their support.
Supplementary Material
The Supplementary Material for this article can be found online at: https://www.frontiersin.org/articles/10.3389/fmats.2020.00229/full#supplementary-material
References
Anderson, M. A., Cudero, A. L., and Palma, J. (2010). Capacitive deionization as an electrochemical means of saving energy and delivering clean water. comparison to present desalination practices: will it compete? Electrochim. Acta 55, 3845–3856. doi: 10.1016/j.electacta.2010.02.012
Bao, W., Tang, X., Guo, X., Choi, S., Wang, C., Gogotsi, Y., et al. (2018). Porous Cryo-Dried MXene for efficient capacitive deionization. Joule 2, 778–787. doi: 10.1016/j.joule.2018.02.018
Baroud, T. N., and Giannelis, E. P. (2018). High salt capacity and high removal rate capacitive deionization enabled by hierarchical porous carbons. Carbon 139, 614–625. doi: 10.1016/j.carbon.2018.05.053
Biesheuvel, P. M., Fu, Y., and Bazant, M. Z. (2012). Electrochemistry and capacitive charging of porous electrodes in asymmetric multicomponent electrolytes. Russ. J. Electrochem. 48, 580–592. doi: 10.1134/s1023193512060031
Biesheuvel, P. M., Porada, S., and Presser, V. (2013). Comment on “Carbon nanotube/graphene composite for enhanced capacitive deionization performance” by Y. Wimalasiri and L. Zou. Carbon 63, 574–575. doi: 10.1016/j.carbon.2013.06.088
Biesheuvel, P. M., Suss, M. E., and Hamelers, H. V. M. (2015). Theory of water desalination by porous electrodes with fixed chemical charge. Colloids Interface Sci. Commun. 9, 1–10.
Biesheuvel, P. M., Zhao, R., Porada, S., and van der Wal, A. (2011). Theory of membrane capacitive deionization including the effect of the electrode pore space. J. Colloid Interface Sci. 360, 239–248. doi: 10.1016/j.jcis.2011.04.049
Bisquert, J., and Compte, A. (2001). Theory of the electrochemical impedance of anomalous diffusion. J. Electroanal. Chem. 499, 112–120. doi: 10.1016/s0022-0728(00)00497-6
Cericola, D., and Spahr, M. E. (2016). Impedance spectroscopic studies of the porous structure of electrodes containing graphite materials with different particle size and shape. Electrochim. Acta 191, 558–566. doi: 10.1016/j.electacta.2016.01.121
Dsoke, S., Tian, X., Täubert, C., Schlüter, S., and Wohlfahrt-Mehrens, M. (2013). Strategies to reduce the resistance sources on electrochemical double layer capacitor electrodes. J. Power Sources 238, 422–429. doi: 10.1016/j.jpowsour.2013.04.031
Dykstra, J. E., Porada, S., van der Wal, A., and Biesheuvel, P. M. (2018). Energy consumption in capacitive deionization - Constant current versus constant voltage operation. Water Res. 143, 367–375. doi: 10.1016/j.watres.2018.06.034
Gupta, S. S., Islam, M. R., and Pradeep, T. (2019). “Capacitive deionization (CDI): an alternative cost-efficient desalination technique,” in Advances in Water Purification Techniques, ed. S. Ahuja (Amsterdam: Elsevier), 165–202. doi: 10.1016/b978-0-12-814790-0.00007-7
He, F., Biesheuvel, P. M., Bazant, M. Z., and Hatton, T. A. (2018). Theory of water treatment by capacitive deionization with redox active porous electrodes. Water Res. 132, 282–291. doi: 10.1016/j.watres.2017.12.073
Itagaki, M., Hatada, Y., Shitanda, I., and Watanabe, K. (2010). Complex impedance spectra of porous electrode with fractal structure. Electrochim. Acta 55, 6255–6262. doi: 10.1016/j.electacta.2009.10.016
Kim, C., Srimuk, P., Lee, J., Fleischmann, S., Aslan, M., and Presser, V. (2017). Influence of pore structure and cell voltage of activated carbon cloth as a versatile electrode material for capacitive deionization. Carbon 122, 329–335. doi: 10.1016/j.carbon.2017.06.077
Lasia, A. (2014). Electrochemical Impedance Spectroscopy and its Applications. New York, NY: Springer.
Liu, X.-M., Zhang, R., Long, D.-H., Qiao, W.-M., Yang, J.-H., and Ling, L.-C. (2007). Impedance of carbon aerogel/activated carbon composites as electrodes of electrochemical capacitors in aprotic electrolyte. New Carbon Mater. 22, 153–158. doi: 10.1016/s1872-5805(07)60015-8
Liu, Y., Nie, C., Liu, X., Xu, X., Sun, Z., and Pan, L. (2015). Review on carbon-based composite materials for capacitive deionization. RSC Adv. 5, 15205–15225. doi: 10.1039/c4ra14447c
Luciano, M. A., Ribeiro, H., Bruch, G. E., and Silva, G. G. (2020). Efficiency of capacitive deionization using carbon materials based electrodes for water desalination. J. Electroanal. Chem. 859:113840. doi: 10.1016/j.jelechem.2020.113840
Nara, H., Yokoshima, T., and Osaka, T. (2020). Technology of electrochemical impedance spectroscopy for an energy-sustainable society. Curr. Opin. Electrochem. 20, 66–77. doi: 10.1016/j.coelec.2020.02.026
Orazem, M. E., and Tribollet, B. (2017). Electrochemical Impedance Spectroscopy. Hoboken, NJ: John Wiley & Sons Inc.
Oren, Y. (2008). Capacitive deionization (CDI) for desalination and water treatment — past, present and future (a review). Desalination 228, 10–29. doi: 10.1016/j.desal.2007.08.005
Pan, X., Cheng, S., Su, T., Zuo, G., Zhang, C., Wu, L., et al. (2019). Poly (2-hydroxypropylene imines) functionalized magnetic polydopamine nanoparticles for high-efficiency DNA isolation. Appl. Surf. Sci. 498:143888. doi: 10.1016/j.apsusc.2019.143888
Porada, S., Weinstein, L., Dash, R., van der Wal, A., Bryjak, M., Gogotsi, Y., et al. (2012). Water desalination using capacitive deionization with microporous carbon electrodes. ACS Appl. Mater. Interfaces 4, 1194–1199.
Porada, S., Zhao, R., van der Wal, A., Presser, V., and Biesheuvel, P. M. (2013). Review on the science and technology of water desalination by capacitive deionization. Prog. Mater. Sci. 58, 1388–1442.
Ratajczak, P., Suss, M. E., Kaasik, F., and Béguin, F. (2019). Carbon Electrodes for Capacitive Technologies. Amsterdam: Elsevier. doi: 10.1016/j.ensm.2018.04.031
Rommerskirchen, A., Kalde, A., Linnartz, C. J., Bongers, L., Linz, G., and Wessling, M. (2019). Unraveling charge transport in carbon flow-electrodes: Performance prediction for desalination applications. Carbon 145, 507–520. doi: 10.1016/j.carbon.2019.01.053
Singh, K., Porada, S., Gier, H. D., de, Biesheuvel, P. M., Smet, L. C. P. M., et al. (2019). Timeline on the application of intercalation materials in capacitive deionization. Desalination 455, 115–134. doi: 10.1016/j.desal.2018.12.015
Su, X., and Hatton, T. A. (2017). Redox-electrodes for selective electrochemical separations. Adv. Colloid. Interface Sci 244, 6–20. doi: 10.1016/j.cis.2016.09.001
Suss, M. E., Porada, S., Sun, X., Biesheuvel, P. M., Yoon, J., and Presser, V. (2015). Water desalination via capacitive deionization: what is it and what can we expect from it? Energy Environ. Sci. 8, 2296–2319. doi: 10.1039/c5ee00519a
Suss, M. E., and Presser, V. (2018). Water desalination with energy storage electrode materials. Joule 2, 10–15. doi: 10.1016/j.joule.2017.12.010
Wang, Z., Xu, X., Kim, J., Malgras, V., Mo, R., Li, C., et al. (2019). Nanoarchitectured metal-organic framework/polypyrrole hybrids for brackish water desalination using capacitive deionization. Mater. Horiz. 6, 1433–1437. doi: 10.1039/c9mh00306a
Xu, X., Allah, A. E., Wang, C., Tan, H., Farghali, A. A., Khedr, M. H., et al. (2019a). Capacitive deionization using nitrogen-doped mesostructured carbons for highly efficient brackish water desalination. Chem. Eng. J. 362, 887–896. doi: 10.1016/j.cej.2019.01.098
Xu, X., Li, C., Wang, C., Ji, L., Kaneti, Y. V., Huang, H., et al. (2019b). Three-Dimensional nanoarchitecture of carbon nanotube-interwoven metal–organic frameworks for capacitive deionization of saline water. ACS Sustainable Chem. Eng. 7, 13949–13954. doi: 10.1021/acssuschemeng.9b02367
Xu, X., Tan, H., Wang, Z., Wang, C., Pan, L., Kaneti, Y. V., et al. (2019c). Extraordinary capacitive deionization performance of highly-ordered mesoporous carbon nano-polyhedra for brackish water desalination. Environ. Sci. 6, 981–989. doi: 10.1039/c9en00017h
Xu, X., Liu, Y., Wang, M., Zhu, C., Lu, T., Zhao, R., et al. (2016a). Hierarchical hybrids with microporous carbon spheres decorated three-dimensional graphene frameworks for capacitive applications in supercapacitor and deionization. Electrochim. Acta 193, 88–95. doi: 10.1016/j.electacta.2016.02.049
Xu, X., Tang, H., Wang, M., Liu, Y., Li, Y., Lu, T., et al. (2016b). Carbon spheres with hierarchical micro/mesopores for water desalination by capacitive deionization. J. Mater. Chem. A 4, 16094–16100. doi: 10.1039/c6ta07616e
Xu, X., Tang, J., Kaneti, Y., Tan, H., Chen, T., Pan, L., et al. (2020a). Unprecedented capacitive deionization performance of interconnected iron-nitrogen-doped carbon tubes in oxygenated saline water / unprecedented capacitive deionization performance of interconnected iron–nitrogen-doped carbon tubes in oxygenated saline water. Mater. Horiz. 7, 1404–1412. doi: 10.1039/c9mh01829h
Xu, X., Yang, T., Zhang, Q., Xia, W., Ding, Z., Eid, K., et al. (2020b). Ultrahigh capacitive deionization performance by 3D interconnected MOF-derived nitrogen-doped carbon tubes. Chem. Eng. J. 390:124493. doi: 10.1016/j.cej.2020.124493
Zhao, R. (2013). Theory and Operation of Capacitive Deionization Systems. Wageningen: Wageningen University.
Keywords: capacitive deionization, kinetic effects, electrochemical impedance spectroscopy, material characterization, carbon-based materials, ion diffusion
Citation: Lenz M, Zabel J and Franzreb M (2020) New Approach for Investigating Diffusion Kinetics Within Capacitive Deionization Electrodes Using Electrochemical Impedance Spectroscopy. Front. Mater. 7:229. doi: 10.3389/fmats.2020.00229
Received: 18 May 2020; Accepted: 23 June 2020;
Published: 14 July 2020.
Edited by:
Emilia Morallon, University of Alicante, SpainReviewed by:
Xingtao Xu, Hohai University, ChinaJinxing Ma, University of New South Wales, Australia
Copyright © 2020 Lenz, Zabel and Franzreb. This is an open-access article distributed under the terms of the Creative Commons Attribution License (CC BY). The use, distribution or reproduction in other forums is permitted, provided the original author(s) and the copyright owner(s) are credited and that the original publication in this journal is cited, in accordance with accepted academic practice. No use, distribution or reproduction is permitted which does not comply with these terms.
*Correspondence: Matthias Franzreb, bWF0dGhpYXMuZnJhbnpyZWJAa2l0LmVkdQ==