 María C. Quintana
 Patricia M. Frontini
 Aitor Arriaga2
 Bernhard Plank
 Zoltan Major
95% of researchers rate our articles as excellent or good
Learn more about the work of our research integrity team to safeguard the quality of each article we publish.
Find out more
ORIGINAL RESEARCH article
Front. Mater., 16 July 2020
Sec. Polymeric and Composite Materials
Volume 7 - 2020 | https://doi.org/10.3389/fmats.2020.00169
This article is part of the Research TopicWomen in Science: MaterialsView all 34 articles
This work evaluates and compares the accuracy of different fiber orientation prediction models for a short fiber reinforced injection molded Venturi-shaped part which displays variable thickness. The experimental characterization of the specimen fiber orientation distribution (FOD) was carried out by the micro computed tomography technique (micro-CT). The computational study of fiber orientation predictions was performed using Moldex3D. All the possible combinations of the Folgar-Tucker (FT) and improved Anisotropic Rotary Diffusion (iARD) rotary diffusion models and the Hybrid (Hyb), Orthotropic (ORE), and Invariant Based Optimal Fitting (IBOF) closure approximations were considered. The relevance of the Retardant Principal Rate (RPR) model on predictions results was also evaluated. The values of the fiber-fiber (Ci), matrix-fiber (Cm) interaction coefficients and the alpha-RPR parameter were varied in a significant range in order to find the set of parameters that better fits the experimental fiber orientation data. The parameters' sensitivity effect over the second order orientation tensor components was quantified via the Analysis of Variance (ANOVA) statistical method. The experimental micro-CT results show an increase in the fiber orientation degree at the specimen constriction region due to the narrowed cavity and the Venturi effect. The comparison of the experimental and predicted orientation profiles demonstrates that the predictions of the iARD model, in combination with the IBOF closure approximation, are the most accurate for the case studied. However, simulations fail to estimate the change in orientation caused by variable thickness and section. ANOVA results prove that the orientation tensor component in the flow direction (a11) is more sensitive to changes in alpha-RPR and Ci coefficient, while the perpendicular components (a22, a33) are also significantly affected by Cm. From the predictive error analysis it is seen that the optimal parameters set to capture the orientation state of the specimen is: (i) for the FT model, Ci = 0.005, alpha-RPR = 0.7 and (ii) for the iARD model, Ci = 0.005, Cm = 0.2, and alpha-RPR = 0.7.
Fiber orientation distribution (FOD) prediction consists of determining the degree of fiber alignment as a function of the location through the part. The state of fiber orientation depends upon a molten polymer fluid dynamic coupled with the movement of the fibers in polymer suspension. Thus, both fiber-fiber and polymer-fiber interactions must be taken into account in a pertinent analysis. The models that predict fiber orientation state in concentrated suspensions incorporate the effect of the interaction between fibers as a rotary diffusion term. The Folgar-Tucker model (FT) (Folgar and Tucker, 1984) considers an isotropic rotary diffusion term. The Anisotropic Rotary Diffusion (ARD) models and their improvements (iARD) (Wang et al., 2008; Phelps and Tucker, 2009; Tseng et al., 2016) define an anisotropic rotary diffusion term. On the other hand, the Retardant principal Rate model (RPR) (Tseng et al., 2016) and the Reduced Strain Closure (RSC) (Wang et al., 2008) account for the quick evolution of the FT model and correct it.
Another aspect concerning prediction approaches arises from the use of tensors to describe fiber orientation states (Advani and Tucker, 1987). The evolution equation of the fiber orientation models involves a fourth-order orientation tensor which must be approximated in a mathematically closed expression in order to compute fiber orientation data. A complete summary of existing closure approximations can be found in Zheng et al. (2011). The most commonly used closure approximations are the Hybrid (Hyb) (Advani and Tucker, 1990), the Orthotropic family or Eigenvalue Based Optimal Fitting (EBOF) (Cintra and Tucker, 1995)–among them the denominated ORE–and the Invariant Based Optimal Fitting (IBOF) (Chung and Kwon, 2002).
Most fiber orientation experimental validation works available in the literature mainly focus on the use of two analytical geometries: the center-gated disk and the end-gated plate, which are uniform and display well-known flow patterns (Bay and Tucker, 1992; Gupta and Wang, 1993; Greene and Wilkes, 1997; Papathanasiou, 1997; Larsen, 2000). Two exceptions are found in Kleindel et al. (2015) and Tseng et al. (2018), which use a complex thick-walled piece and a traction bar with a welding line, respectively. Besides, in the past few years, some valuable efforts have been made to develop new closure approximations for the fourth order orientation tensor (Montgomery-Smith et al., 2011; Kuzmin, 2018) as well as to compare the accuracy of the existing mathematically closed expressions (Chung and Kwon, 2000; Wang and Jin, 2010). In these articles, the mentioned typical analytical geometries are also chosen for validation purposes.
Regarding the experimental characterization of the fiber orientation, the typical method used to determine their distribution is a two-dimensional technique based on optical microscopy, which is called the method of ellipses (MoE). The MoE implies the sectioning and polishing of the samples, i.e., it is a destructive technique, followed by optical microscopy or scanning electron microscopy (SEM) in order to determine the in-plane and out-of-plane angles of the projected fibers from the surface characterization. This method has certain limitations, such as the ambiguity in determining the 3D fiber orientation and the difficulty in achieving a proper FOD characterization over a representative area/volume of the material (McGee and McCullough, 1984; Vélez-Garcia, 2012; Sharma et al., 2018; Hanhan et al., 2019). Alternatively, in recent years the application of three-dimensional techniques, such as micro-CT scanning, have become really appealing for non-destructively characterizing composites' microstructural features (Salaberger et al., 2011; Emerson et al., 2017; Hanhan et al., 2019). However, there are few studies using these techniques to validate predictions given by simulation (Kleindel et al., 2015; Tseng et al., 2018).
Taking into account the scope of the previous contributions, the objective of this work is to validate the most relevant fiber orientation models and closure approximations in a specimen different from those already studied–but with characteristics that can be extrapolated to many injected parts—using the novel experimental micro-CT technique to test the accuracy of the predictions. Specifically, the injected part studied here consists of a Venturi-shaped tube that displays variable thickness. The specimen is made of polyamide and it is reinforced with short glass fiber (40 wt%).
This work presents: (i) a brief overview of the fiber orientation prediction models and closure approximations deemed to be evaluated (these being the FT, iARD, and RPR models, and the Hyb, ORE and IBOF closures); (ii) a description of the experimentally measured fiber orientation distribution; (iii) a computational study performed using the injection molding simulation software Moldex3D R.13 to explore the effect of the models and closures on fiber orientation predictions; (iv) a statistical study via the Analysis of Variance (ANOVA) technique to investigate the effect of the models parameters (fiber-fiber Ci and matrix-fiber Cm interaction coefficients and alpha-RPR parameter) on the predicted components of the second order orientation tensor; and (v) a quantitative determination of the FT and iARD prediction errors.
The hydrodynamic effect of the fluid flow over the motion of an infinite aspect ratio particle was first described by Jeffery (2012). This theory applies to dilute suspensions but it has been shown to provide practical qualitative agreement with simple shear flow experiments under certain conditions. Folgar and Tucker (1984) have considered the evolution of the fiber orientation state of non-dilute fiber suspensions as a diffusive process, adding to the theoretical model of Jeffery's Hydrodynamic an isotropic rotary diffusion term to model the randomizing effect of the interaction between fibers. The isotropic rotary diffusion is proportional to the scalar rate of deformation, being the constant of proportionality to a scalar parameter named the interaction coefficient (Ci), adjusted to fit with experimental data. Due to its acceptable accuracy for the prediction of the fiber orientation state in semi-concentrated suspensions, the Folgar-Tucker model (FT) has been the most frequently used for the estimation of the local fiber orientation distribution in the simulation of SFRC so far.
However, the FT model does not match all of the aspects of experimental discontinuous fiber orientation data. For instance, in concentrated suspensions fibers tend to align more slowly with respect to the strain rate than the models based on the Jeffery's equation predict, especially for composites with long discontinuous fibers (Wang et al., 2008; Phelps and Tucker, 2009; Tseng et al., 2016). Wang et al. (2008) introduced the reduced-strain closure (RSC) model, which slows the orientation kinetics in order to achieve better agreement between the experiments and predictions. Phelps and Tucker (2009) developed a fiber orientation model that incorporates an anisotropic rotary diffusion term, namely the Anisotropic Rotary diffusion model (ARD). In the ARD model, the diffusivity is assumed to depend on a second-order space tensor which in turn is a function of the orientation state and the deformation rate. Nowadays, the FT and ARD-RSC models are available in most commercial injection molding simulation software. Some years ago, Tseng et al. (2016) proposed and implemented on Moldex3D an approach named the improved Anisotropic Rotary diffusion (iARD), which also considers anisotropic fiber diffusion and incorporates the effect of the fiber-matrix interaction (like the ARD model) and the slowing down of the orientation through the Retardant Principal Rate model (RPR). The iARD-RPR model has been proved to be suitable for both short and long fiber reinforced composites (Tseng et al., 2016).
When using the tensor description of the fiber orientation state proposed by Advani and Tucker (1987) instead of the probability distribution function (DFC), all the information regarding fiber orientation is represented by the components of a second-order momentum tensor, named the orientation tensor. The mathematical expression for the advection of the second-order orientation tensor involves a fourth-order orientation tensor that has to be defined in a closed form in order to compute fiber data. Then, a closure approximation is defined as an expression of the fourth-order orientation tensor as a function of the second-order orientation tensor. Advani and Tucker (1990) proposed the so-called Hybrid closure approximation (Hyb), which has been proven to be exact when the fibers are in both random and perfect aligned states, but that accelerates the orientation in transient shearing flows (Zheng et al., 2011). A family of closure approximations called orthotropic or Eigenvalue Based Optimal Fitting closures (EBOF) was developed by Cintra and Tucker (1995). Among them, the version called Orthotropic Fitted Closure Approximation (ORE) improved the non-physical oscillations for low interaction coefficients. Although the EBOF closures adequately predict fiber orientation in most simple flows, its implementation demands much computational time. Later, Chung and Kwon (2000) developed the Invariant Based Optimal Fitting closure approximation (IBOF) whose accuracy is as good as EBOF but requires less computational time to obtain a solution. The Hyb, ORE, and IBOF closure approximations are already implemented in Moldex3D.
The orientation of a single fiber is determinate by a unit vector named p, which is defined by the in-plane (ϕ) and out-of-plane (θ) fiber angles. The most general way to describe the orientation state of a group of fibers is given by the probability density distribution function (ψ). The function ψ represents the probability of finding a fiber over the space between (ϕ, θ) and (ϕ+dϕ, θ+dθ).
Given that the time variation of ψ requires much computational time for its calculation, the tensor description of fiber orientation proposed in Advani and Tucker (1987) is generally implemented in simulations. The second-order orientation tensor (A) is defined so that the probability of a fiber being oriented within an angular range dp of the direction p is equal to ψ(p)dp, Equation 1.
The second order orientation tensor can be expressed with a matrix that meets the following conditions: it is symmetric, and the sum of its diagonal components are 1.
The evolution equation of the 2nd order orientation tensor can be expressed as the contribution of a hydrodynamic (h) and a diffusive term (d), Equation 2. In the so-called standard Folgar-Tucker model, the first term is represented by the Jeffery's Hydrodynamic (H) model, Equation 3 and the second by the Folgar-Tucker isotropic rotary diffusion (IRD) model, Equation 4.
Where, is the material derivative of the second order orientation tensor; λ is a constant that depends on the geometry of the fiber. In this work, λ is the value corresponding to slender particles and is equal to 1; I is the unit tensor, and Ci is the fiber-fiber interaction coefficient.
W is the vorticity tensor and D is the rate of deformation tensor. They are defined from the velocity gradient tensor L:
A4 is the fourth-order orientation tensor, also symmetric, defined as:
The iARD model is formed by the contribution of the Jeffery Hydrodynamics model (H), Equation 3, the improved anisotropic rotary diffusion term (iARD), Equation 10 and the Retardant Principal Rate (RPR) model, Equation 13.]
Where Ci and Cm are the fiber-fiber and matrix-fiber interaction coefficients and alpha is the RPR model parameter that indicates the slow-down fiber rotation behavior.
The iARD term is:
Where
The RPR term is:
Where R = [e1, e2, e3] is the rotation matrix; RTis its transpose; λi(λ1 ≥ λ2 ≥ λ3)are the eigenvalues of Λ and is the material derivative of a particular diagonal tensor (IOK is for intrinsic orientation kinetics).
Hyb approximation (Advani and Tucker, 1990), Equation 15, is the hybrid from the Linear, Equation 16, and Quadratic, Equation 17, closures. In index notation, Aij and Aijkl represent the second- and fourth-order orientation tensors, respectively, and Iij is the unit matrix.
Since the Linear approximation has been proved to be exact for random orientations and the Quadratic closure is exact when the fibers are perfectly aligned, it is deduced that the hybrid closure will be exact when the fibers are in both random and perfect alignment states (Chung and Kwon, 2000; Wang and Jin, 2010). This model, however, tends to accelerate the orientation transients in transient shearing flows (Advani and Tucker, 1990). It has been demonstrated that Hyb closure approximation predictions are in a good agreement with experimental fiber orientation data when the value of the interaction coefficient is taken as 0.01 (Advani and Tucker, 1990; Wang and Jin, 2010).
EBOF approximations assume that only three components of the fourth-order tensor are independent, based on the fact that in the second-order tensor only two of the diagonal components are independent variables (the sum of diagonal components is 1). The directional information of Aijkl is obtained from Aij, both tensors having the same principal axis (Zheng et al., 2011). Then, the three principal components of the fourth-order tensor are expressed as functions of the independent principal components of the second-order tensor, Equation 18. Here aij and aijkl represent the components of the second- and fourth-order tensors, respectively. The superscript p indicates that the components are principal.
In Equation 18, the functions f1, f2, and f3 are determinate by matching predicted values of the second-order components with experimental ones in well-defined flow conditions. These coefficient functions will be different for the different orthotropic approximations.
Among the orthotropic approaches, the so-called ORF provides good results for a range of interaction coefficient values from 0.01 to 0.1. The ORL closure is used in a range of Ci from 0.001 to 0.01, while the Orthotropic fitted closure approximation named ORE corrects the non-physical oscillations for low interaction coefficients (Cintra and Tucker, 1995).
IBOF closure approximates the Aijkl tensor as a function of the second-order orientation tensor and its invariants (Chung and Kwon, 2002). The IBOF approach is the same as the natural approximation (Zheng et al., 2011) and is expressed in Equation 19.
Where S is the symmetric operator that applied to a general fourth-order tensor T will give, Equation 20:
The coefficients βj (with j = 1 to 6) are polynomial expansions of the second and third invariants of Aij. The difference between Natural and IBOF closures is that in the latter only three of the six β coefficients are considered linear independent. The computational cost of this approximation is much lower compared to the orthotropic one and gives results without non-physical oscillations for a wide range of interaction coefficients. It has been proven that this approximation provides good results with Ci = 0.0001 at the steady flow zones and with Ci = 0.001 at the transient flow zones (at the entrance, for instance). But, in a general way, IBOF results are close to experimental fiber orientation data when a Ci = 0.001 applies.
The specimen is made of short glass fiber filled (40 wt%) polyamide 6 (PA6), grade name Akulon K224-G8, produced by DSM Engineering Plastics. Average extracted fiber length measured through the CT experiment is around 150 μm (from around 1 million extracted fibers); real fiber length is expected to be higher due to the virtual fiber breakage influence of the high fiber content (>30 wt%). Maximum extracted fiber length is ~1,000 μm. Average fiber aspect ratio, from the material datasheet provided by the PA6 manufacturer, is ranged from 20 to 25. Specimen's molding parameters are melt temperature, 280°C; mold temperature, 90°C; injection time, 1.13 s; holding time, 8 s; cooling time, 32 s; injection pressure, 11 MPa, and holding pressure, 10 MPa.
Flow behavior of the PA6 matrix was described by the Modified Cross Viscosity Model to account for the viscosity dependence on the shear rate and temperature, Equation 21 and 22.
Where
The parameters of the viscosity model for the PA6 grade used in the study are available in the Moldex3D database. These are n = 0.223; τ = 407 MPa; D1 = 5.0222 Kg/(m.s); D2 = 323.606 K; D3 = 0 K.MPa−1; A1 = 39.958; and A2 = 51.6 K.
The Venturi-shaped specimen, the three regions of interest to the study and the experimental micro-CT samples, are shown in Figure 1. The regions are defined as: (R1) the entrance region, where the molten polymer enters the cavity; (R2) the central region, i.e., the constricted section or choke of the Venturi part, and (R3) the filling completion region which is, as the name implies, the last to fill. Dimensions of the specimen are total length L = 195 mm; thickness and diameter at R2, H = 1 mm and ϕ = 30 mm, and thickness and diameter at R1 and R3, H = 2.4 mm and ϕ = 45 mm.
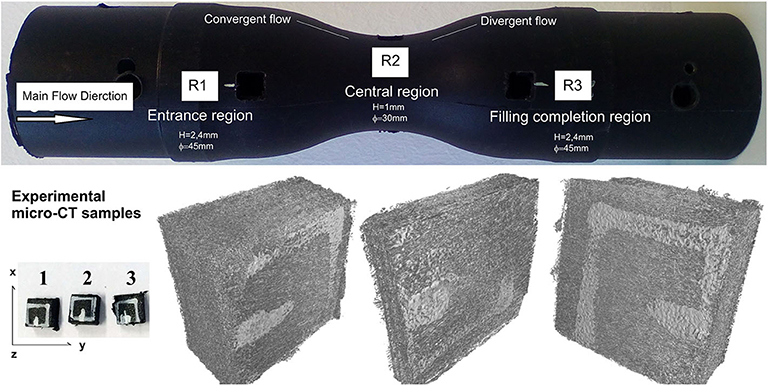
Figure 1. Specimen, regions of interest and micro-CT samples.
The specimen was manufactured using a single screw injection molding machine. The injection of the molten polymer into the mold cavity occurs through an annular runner located at one end of the part, see the computational model at Figure 2; the characteristics of the inlet are similar to those of the film-gated strip. In Figure 2, X corresponds to the Main Flow Direction (MFD) or filling coordinate; Y corresponds to the Cross Flow Direction (CFD), and Z corresponds to the Through-Thickness Direction (TTD). Z and Y are both gap-wise coordinates (since Moldex3D results are displayed in a Cartesian reference system), with the difference that Y forms a plane with X (X and Y are the in-plane components) and Z is the out-of-plane component. When the index notation is used, 1, 2 and 3 are equivalent to X, Y, and Z, respectively.
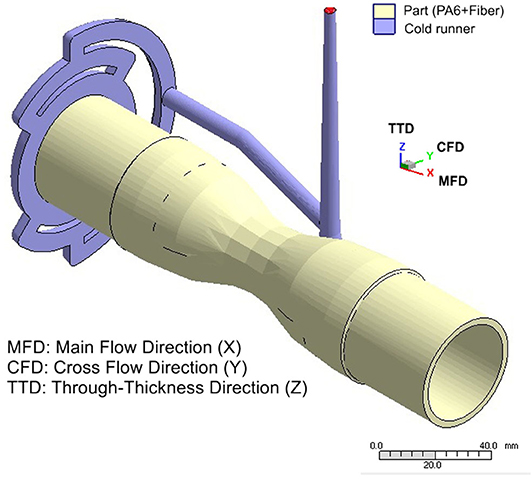
Figure 2. Computational model.
The part has two distinctive features: (i) the wall thickness of the central region is less than half that of the entry and filling completion regions, 1 and 2.4 mm, respectively, i.e., it has variable thickness; and (ii) its geometric shape gives rise to the Venturi effect, which implies that the fluid velocity increases as it passes through the constriction in accord with the principle of mass continuity, while its static pressure decrease0073 in accord with the principle of conservation of mechanical energy.
The experimental fiber orientation characterization was done via the micro-CT technique. Three 5 × 5 mm2 area samples, one from each region of interest, were extracted and subjected to the CT-scan, see Figure 1. A GE phönix X-ray Nanotom 180 NF was used for the measurements. This equipment reaches a minimal voxel size of 0.5 μm. Parameters of the scans were: maximum sample size, ~4 × 4 × 2.5 mm3; voltage, 80 kV; current, 74 μA; number of projections, 1,900; exposure time 0.9 s; voxel size 2.75 μm. The single fiber characterization method was used to obtain the components of the orientation tensor from the measured CT-data. A complete description of the micro-CT technique and the calculation scheme is presented in Salaberger et al. (2011), Emerson et al. (2017), and Salaberger (2019).
The mold filling and fiber orientation simulations were performed using Moldex3D R.13, see Figure 2. For this case, a 3D analysis was preferable over a 2.5D to capture the potential influence of variable thickness and the Venturi effect over the FOD. Auto tetrahedral 3-dimensional meshing of the model was performed using the Moldex3D Designer. This method is widely used by commercial simulation codes users due to tetrahedral meshes' ability to fit almost any complex geometry. Despite this, tetrahedral meshes possess some drawbacks, such as the large number of elements and the difficulty in controlling the element layer count of the whole part (it is not constant). To overcome this limitation, the highest meshing reliability level of the Moldex3D Designer with a small enough size of element was chosen to ensure a minimum of 5 elements in the thickness direction.
The computational study was divided into two parts. The first part is the comparison of the experimental profiles with those obtained from all the possible combinations of the rotary diffusion models (FT and iARD) and the closure approximations (Hyb, ORE, and IBOF). The FOD was examined throughout the specimen (regions of interest) and through its thickness. The default values of the model parameters were set for these simulations (Ci = 0.01, Cm = 0.99, and α-RPR = 0). The summary is in Table 1. For the comparison, the optimal closure approximation was selected in terms of adjustment to the experimental results and the shorter time consumed. In the second part, the models parameters were varied to establish, via ANOVA, their influence over the fiber orientation tensor components and to calculate predictive errors. The summary is in Table 2.
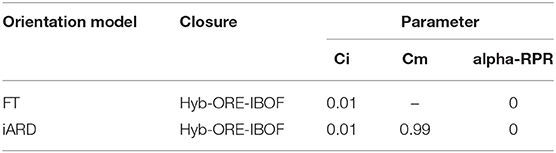
Table 1. Simulation trials for the evaluation of orientation models and closure approximations.
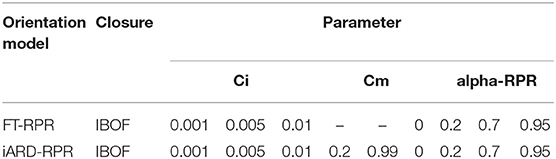
Table 2. Simulation trials for ANOVA analysis.
The sensitivity of the principal components of the 2nd-order orientation tensor (responses) as a function of the fiber model parameters listed in Table 2 (factors) was evaluated via the Analysis of Variance (ANOVA) method. The operation of the ANOVA technique broadly follows this scheme: in order to compare the means of the factors associated with their different levels, a measure of the response variation due to their different levels (Mean Square factor, MS-factor) is compared with a measurement of the response variation due to the error (Mean Square error, MS-error). If the MS-factor is significantly larger than the MS-error, it is concluded that the means associated with different levels of the factor are different. That factor then has an important influence over the response. In the ANOVA analysis, the P (%) represents the percentage of contribution of each term (factors and error) to the variation of the dependent variables.
The predictive errors of the FT and iARD models as functions of the parameters levels listed in Table 2 were calculated according to Equation 23.
This is the Root Mean Squared Error (RMSE) computed from the difference in the predicted and experimental values of the principal components of the orientation tensor. From these results, the combination of parameters per model that lead to the lower prediction error was determined.
Figure 3 shows the experimentally determined through-thickness fiber orientation distributions for the regions of interest along the specimen. The degree of fiber alignment in the MFD is indicated by the value of a11, whereas a22 and a33 corresponds to the cross-flow and through-thickness fiber orientations, respectively.
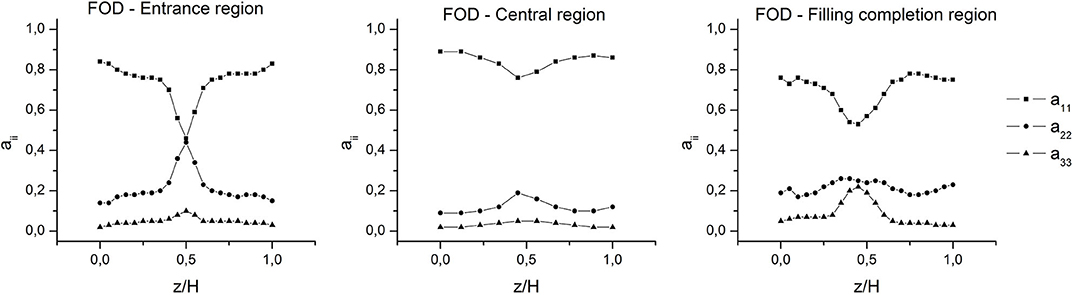
Figure 3. Experimental a11, a22, and a33 orientation profiles at the regions of interest.
It is observed that the part exhibits a gap-wise three-layered laminated structure which corresponds to the so-called shell-core-shell structure. The fibers in the shell layers are mainly aligned in the MFD, this implies high a11 values and low a22 values. The core layer, located approximately at the specimen mid-plane (z/H = 0.5) and between the shell layers, is characterized by a high cross-flow fiber orientation with high a22 values and low a11 values. Also, a fraction of the fibers aligned in the thickness direction can be observed in the core layer (a33 value different from zero).
The experimental results in Figure 3 reveal that, at the entrance and central regions, the distributions are essentially flat (the fibers remain parallel to the XY plane). Whereas, at the filling completion region, the portion of fibers aligned in the thickness direction is larger.
Furthermore, it can be seen from Figure 3 that the fiber alignment degree in the MFD changes after the fluid experiences the convergent and divergent transitions between R1 and R2 and between R2 and R3, respectively (Figure 1). In the convergent transition an increase in the a11 component occurs, both in the shell and core layers (through-thickness averaged values from 0.74 to 0.85), while the remaining components decrease. Since the orientation in the MFD is governed by the shear flow, the increase in a11 is associated with the increase of the fluid velocity caused by the Venturi effect and the increase in the shear rate due to the narrower cavity. On the contrary, in the divergent transition, a11 decreases (through-thickness averaged values from 0.85 to 0.7) and the remaining components increase, specially a33 (through-thickness averaged values from 0.03 to 0.1). This last can be attributed to the rotation of the fibers being located completely outside the XY plane at the cavity enlargement.
Figures 4–6 show the comparison between the experimental and predicted orientation components along the flow and through-thickness directions, i.e., a11 and a33, for each region of interest, respectively. Results are reported in terms of these components since they contain most of the qualitative information about the layered microstructure and, as it was demonstrated by the experimental results, they are more sensitive to flow and geometrical changes. Predicted profiles correspond to the combinations of rotary diffusion models, closure approximations and models parameters listed in Table 1. The following observations arise from the analysis of the results.
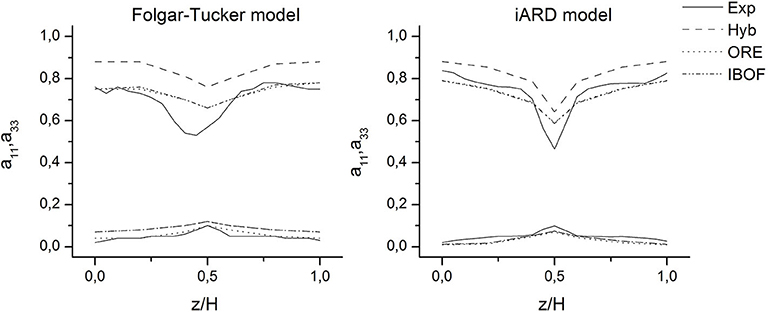
Figure 4. Experimental and predicted a11 and a33 profiles at the entrance region (R1).
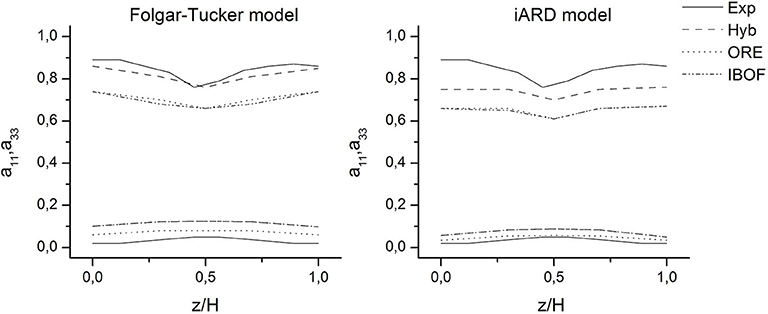
Figure 5. Experimental and predicted a11 and a33 profiles at the central region (R2).
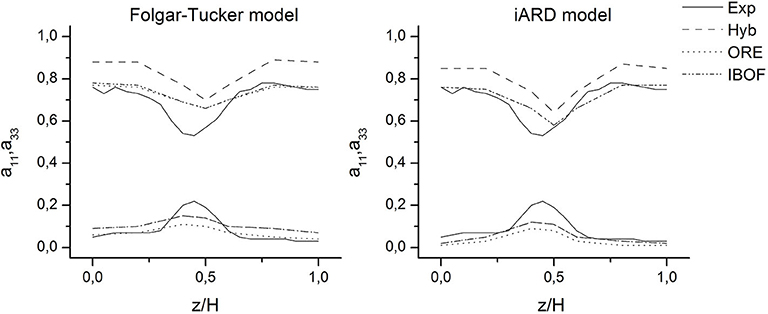
Figure 6. Experimental and predicted a11 and a33 profiles at the filling completion region (R2).
The Hyb approximation leads to an over-estimation of the orientation in the flow direction. When using the Hyb closure, the a11 predicted value is higher than the experimental one with respect to the prediction using ORE and IBOF closures for all the through-thickness profiles. The ORE and IBOF approximations estimate the orientation of the shell layers fairly closely to the experimental one; however, they over-predict the orientation of the core layer. The results provided by these closures are essentially the same, but the computational time consumed by the IBOF closure calculation is approximately half of the ORE closure. Due to its higher accuracy and computational efficiency, the IBOF has been selected as the optimum closure.
At the entrance and filling completion regions (Figures 4, 6), it is observed that, using the IBOF closure with the iARD model, there is a reasonably good correlation between the predicted and experimental values of all the principal orientation components. While using the IBOF closure in combination with the FT model, the results of a11 correlate well, but a22 is under-predicted and a33 is over-predicted.
On the other hand, at the central region (Figure 5), although the simulations predict an increase of fluid velocity and an increase of the shear rate caused by the convergent transition, none of the orientation models predict the expected increase of the fiber alignment (a11) that was observed experimentally. This discrepancy is more likely attributable to the estimation error of the remaining components, see Figure 7. As explained in the experimental section, when the wall thickness is narrowed, the fibers tend to align in the MFD; hence, the central region is characterized by a high value of a11 and a very low a22. However, simulation results for this region evidence that a22 and a33 are highly overestimated for both orientation models. So then, considering that the sum of the principal components is equal to 1 (a11+a22+a33 = 1), a11 is consequently underestimated.
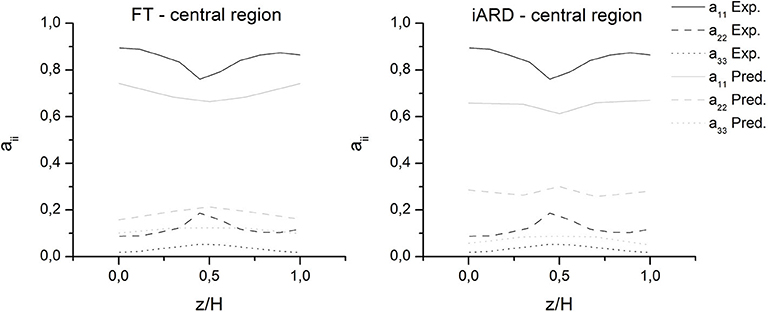
Figure 7. Experimental and predicted a11, a22, and a33 orientation profiles at the central region.
Taking into account the degree of adjustment to the experimental results, it follows that the iARD model in combination with the IBOF closure approximation are the most accurate for the case studied.
The results of the ANOVA analysis are described in terms of the P(%), i.e., the percentage of contribution of each parameter (varied according to Table 2) and of the error to the variation of the principal components of the orientation tensor. These are: (i) FT model: P(%) over a11, Ci = 10.35%, alpha-RPR = 88.01% and error = 1.64%; P(%) over a22, Ci = 8.27%, alpha-RPR = 91.03% and error = 0.7%, and P(%) over a33, Ci = 12.39%, alpha-RPR = 84.84% and error = 2.77%. (ii) iARD model: P(%) over a11, Ci = 11.8%, Cm = 1.89%, alpha-RPR = 82.88%, and error = 3.42%; P(%) over a22, Ci = 1.3%, Cm = 3.76%, alpha-RPR = 93.11%, and error = 1.84% and P(%) over a33, Ci = 23.02%, Cm = 16.15%, alpha-RPR = 47.88%, and error = 12.95%.
Additionally, Figures 8, 9 show the principal effects and interactions of the same parameters over the component in the MFD. From the P(%) results, it is observed that for both models, the alpha-RPR parameter has the higher impact on the value of a11, a22, and a33. However, in light of the results shown in the figures, it can be noted that this behavior is not valid for all the factors' levels; an abrupt change in the trend occurs from alpha-RPR = 0.7 due to a stronger interaction of the factors. Below this point, the effect of Ci and Cm can be considered practically independent of each other and of alpha-RPR. While above it, the interaction between the factors become significant and the orientation prediction is dominated by alpha-RPR.
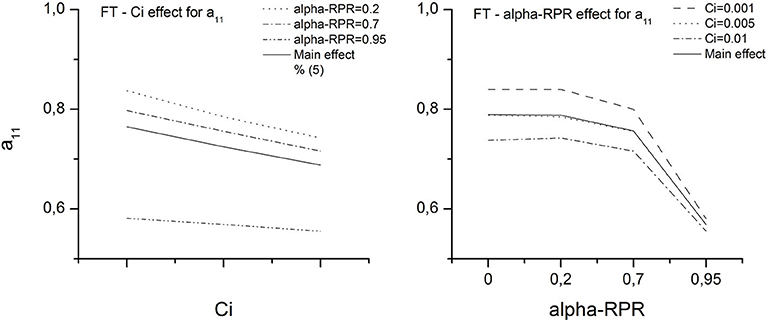
Figure 8. Main effects and interaction of the FT-RPR model parameters.
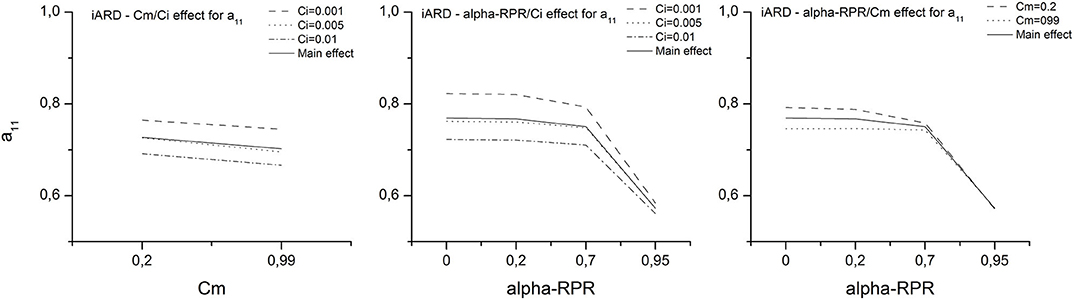
Figure 9. Main effects and interaction of the iARD-RPR model parameters.
With this in mind, a new ANOVA analysis was performed taking the alpha-RPR parameter up to 0.7, i.e., in the levels range in which the population means are not considerably different. The results are: (i) FT model: P(%) over a11, Ci = 85.44%, alpha-RPR = 13.59%, and error = 0.97%; P(%) over a22, Ci = 79.49%, alpha-RPR = 20.01%, and error = 0.5%, and P(%) over a33, Ci = 88.92%, alpha-RPR = 9.47%, and error = 1.61%. (ii) iARD model: P(%) over a11, Ci = 77.38%, Cm = 15.35%, alpha-RPR = 3.64%, and error = 3.62%; P(%) over a22, Ci = 13.29%, Cm = 44.46%, alpha-RPR = 29.07%, and error = 13.17%; and P(%) over a33, Ci = 52.88%, Cm = 39.85%, alpha-RPR = 0.03%, and error = 7.24%.
It is observed now that: (i) for the FT model, the fiber-fiber interaction coefficient Ci is the one that has the higher effect on all the principal orientation components; (ii) for the iARD model, as Ci is the one with the higher impact on a11, the matrix-fiber interaction coefficient Cm significantly impacts the perpendicular components (a22 and a33) and (iii) the error on the estimation of a22 and a33 is confirmed to be considerable.
Finally, the effect of the factors is summarized as follows: (i) increasing alpha-RPR produces a decrease in a11 and an increase in a22 and a33. Above alpha-RPR = 0.7 these variations become very pronounced; (ii) increasing Ci produces a decrease in a11 and an increase in a22 and a33; (iii) increasing Cm produces a decrease in a11 and a22 and an increase in a33. The amount (%) of these variations will depend upon the level of alpha-RPR considered, being below alpha-RPR = 0.7 those corresponding to the first ANOVA, and above alpha-RPR = 0.7 those corresponding to the second ANOVA.
Figures 10, 11 show the prediction error of the FT and iARD models, respectively (computed from Equation 23) as functions of the different model parameters. Based on the fact that there are certain deficiencies of the models in predicting the orientation changes that occur due to the specimen geometrical variations, and that the model parameters affected the principal orientation tensor components in a different way, the criterion used to find the optimal parameters set was that of trying to capture the best the global orientation state of the specimen. For this reason, a11, a22, and a33 were analyzed by averaging their values across the thickness and the three regions of interest of the specimen. It should be noted that this analysis will not tell much about the precision of each model (best determined by comparison with the experimental profiles), since information from the predictions is lost locally.
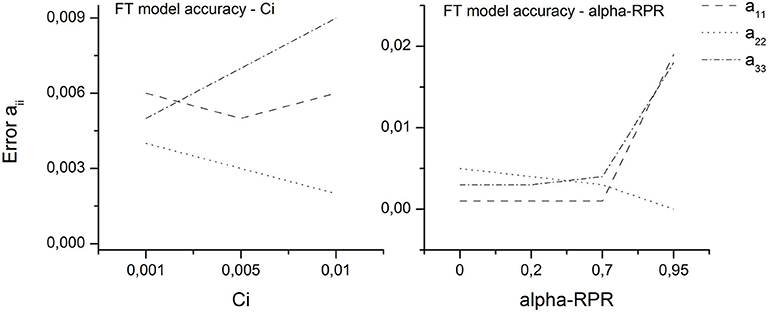
Figure 10. Prediction error of the FT-RPR model.
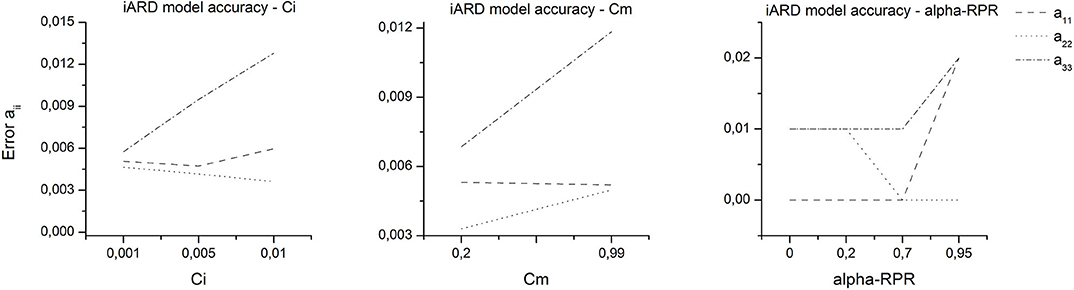
Figure 11. Prediction error of the iARD-RPR model.
Parameter values were chosen to minimize the error of each component without maximizing the error of the others. The optimal sets are as follows: (i) FT model, Ci = 0.005, alpha-RPR = 0.7, and (ii) iARD model, Ci = 0.005, Cm = 0.2, and alpha-RPR = 0.7.
These results show that the alpha-RPR parameter must be chosen carefully, since after a certain value (coincident with that obtained from the ANOVA above which its effect is predominant) it induces a significant error in the predictions. The same is valid for the interaction coefficients (Ci and Cm) regarding the prediction of the components perpendicular to the flow (a22 and a33), due to these parameters' variation strongly influencing their respective prediction errors.
This paper evaluates the predictions of the fiber orientation distribution (FOD) of an injected Venturi-shaped specimen. The choice of the specimen was made in order to study a different case from the specimens traditionally used for validation purposes (usually the center gated-disk and the film-gated strip), which in turn presents characteristics common to many injected parts, such as variable thickness, section changes, convergent, and divergent transitions among others. The experimental characterization was performed using the novel micro computed tomography technique.
The experimental results describe the physical phenomenon to be modeled by the simulation. The orientation pattern measured through the CT technique is in accordance with the expectations arisen from previous knowledge and from the patterns measured by the standard method of optical microscopy (the ellipse method). These are broadly: the presence of a shell-core-shell layered structure across the part thickness, with the fibers aligned in the main flow direction in the shell layers and the fibers aligned in the cross flow direction in the layer core. It is also demonstrated that the convergent and divergent transitions that the flow experiences through this specimen and the variations of its thickness induce changes in the fibers' alignment degree. In this way, in the convergent transition that occurs at the specimen constriction, characterized by an increase in the flow rate caused by the Venturi effect and an increase in the shear rate due to the narrower cavity, there is an increase in orientation in the main flow direction in both the shell and core layers. Whereas, at the divergent transition that occurs after the constriction there is a decrease in orientation in the main flow direction and an increase in orientation perpendicular to flow.
The computational study evaluates the ability of present theories to predict fiber orientation, revealing certain deficiencies in both the orientation models and the second-order orientation tensor closure approximations. Specifically, it is observed that the hybrid (Hyb) closure overestimates the orientation with respect to the experimental orientation and that obtained when using the ORE and IBOF closures. For their part, it is observed that the results obtained from ORE and IBOF closures are closer to the experimental ones, being essentially the same. However, the computational time consumed by the IBOF closure is approximately half that of the ORE. Due to its higher accuracy and computational efficiency, the IBOF approximation is selected as the optimum. Moreover, at the entrance and filling completion regions of specimen, using the IBOF closure, it is observed that the iARD model fairly estimates the orientation components, while the FT model underestimates the a22 component and overestimates the a33 component. Then, from the comparison of experimental and predicted profiles it follows that the predictions of the iARD model in combination with the IBOF closure approximation are the most accurate for the case studied.
On the other hand, from the analysis of the predictions corresponding to the central region (thinner gap), a very important result of this work emerges: it is the demonstration that both orientation models fail to predict the increase in orientation that occurs in the specimen constriction. The a11 component depends on the flow in the main direction, and simulations effectively predict the increase in the flow velocity and shear rate that should cause the increase of a11. Then, this discrepancy may be attributed to the error in estimating the components in the directions perpendicular to the flow rather than to the estimation of a11.
The ANOVA technique is used in order to objectively explore and quantify the effect of model parameters on predicting second-order tensor components. In strictly statistical terms, it is possible to demonstrate that after a certain level of the alpha-RPR parameter, the interaction between the different factors become significant, and alpha-RPR dominates the orientation prediction regardless the value taken by the rest of the parameters. However, for values below this alpha-RPR level, it is shown that for both the FT and iARD models, the fiber-fiber interaction coefficient (Ci) is the one that most influences the component in the main flow direction (a11); whereas for the iARD model, the fiber-matrix interaction coefficient (Cm) has a significant impact on the prediction of the components perpendicular to the main flow direction (a22 and a33). The effect of the factors is as follows: (i) increasing alpha-RPR produces a decrease in a11 and an increase in a22 and a33; (ii) increasing Ci produces a decrease in a11 and an increase in a22 and a33; and (iii) increasing Cm produces a decrease in a11 and a22 and an increase in a33. These results suggest that since Ci, Cm and alpha-RPR are fitting parameters, which affect the orientation components differently, the adjustment to the experimental results will never be entirely accurate.
Finally, and taking into account the described limitations of the models and the adjustment of their parameters, predictive error analysis is used to find the optimal parameter that better captures the global orientation state of the component. The optimal set for this case, recommended for application in similar cases, is as follows: (i) for the FT model, Ci = 0.005, alpha-RPR = 0.7, and (ii) for the iARD model, Ci = 0.005, Cm = 0.2, and alpha-RPR = 0.7. It can be concluded that it is of fundamental importance to carefully define the models' parameters values (especially alpha-RPR) because their variation is closely related to the prediction error.
The raw data supporting the conclusions of this article will be made available by the authors, without undue reservation.
AA provided the injected part which was injected in the installations of the Leartiker group. BP performed the characterization of the samples via micro-CT and provided the experimental curves. MQ performed the simulations and the statistical calculations, performed the analysis of the results, and wrote the manuscript. PF and ZM has given significant intellectual inputs and supervised the work. ZM coordinated the working groups. All authors contributed to the article and approved the submitted version.
The authors declare that the research was conducted in the absence of any commercial or financial relationships that could be construed as a potential conflict of interest.
The authors want to thank all the institutions involved in the elaboration of this work. Particularly to the Institute of Polymer Product Engineering directed by Dr. ZM—Johannes Kepler University at Linz (Austria)—for kindly inviting MQ to carry out a research stay at its facilities, from which this work emerged, to the National Research Council of Argentina (CONICET) and the MINCyT (Argentina). Micro-CT results were gained within the projects DigiCT-Sim (project number: 862015) and pore3D (project number: 868735). Both micro-CT projects were funded by the State Government of Upper Austria and Austrian Research Promotion Agency (FFG).
Advani, S. G., and Tucker, C. L. (1987). The use of tensors to describe and predict fiber orientation in short fiber composites. J. Rheol. 31, 751–784. doi: 10.1122/1.549945
Advani, S. G., and Tucker, C. L. (1990). Closure approximations for three-dimensional structure tensors. J. Rheol. 34, 367–386. doi: 10.1122/1.550133
Bay, R. S., and Tucker, C. L. (1992). Fiber orientation in simple injection moldings. Part I: theory and numerical methods. Polym. Compos. 13, 317–331. doi: 10.1002/pc.750130409
Chung, D.-H., and Kwon, T.-H. (2000). Applications of recently proposed closure approximations to injection molding filling simulation of short-fiber reinforced plastics. Korea-Aust. Rheol. J. 12, 125–133.
Chung, D. H., and Kwon, T. H. (2002). Invariant-based optimal fitting closure approximation for the numerical prediction of flow-induced fiber orientation. J. Rheol. 46, 169–194. doi: 10.1122/1.1423312
Cintra, J. S., and Tucker, C. L. (1995). Orthotropic closure approximations for flow-induced fiber orientation. J. Rheol. 39, 1095–1122. doi: 10.1122/1.550630
Emerson, M. J., Jespersen, K. M., Dahl, A. B., Conradsen, K., and Mikkelsen, L. P. (2017). Individual fibre segmentation from 3D X-ray computed tomography for characterising the fibre orientation in unidirectional composite materials. Compos. Part A Appl. Sci. Manuf. 97, 83–92. doi: 10.1016/j.compositesa.2016.12.028
Folgar, F., and Tucker, C. L. (1984). Orientation behavior of fibers in concentrated suspensions. J. Reinf. Plast. Compos. 3, 98–119. doi: 10.1177/073168448400300201
Greene, J. P., and Wilkes, J. O. (1997). Numerical analysis of injection molding of glass fiber reinforced thermoplastics. Part 2: fiber orientation. Polym. Eng. Sci. 37, 1019–1035. doi: 10.1002/pen.11747
Gupta, M., and Wang, K. K. (1993). Fiber orientation and mechanical properties of short-fiber-reinforced injection-molded composites: simulated and experimental results. Polym. Compos. 14, 367–382. doi: 10.1002/pc.750140503
Hanhan, I., Agyei, R., Xiao, X., and Sangid, M. D. (2019). Comparing non-destructive 3D X-ray computed tomography with destructive optical microscopy for microstructural characterization of fiber reinforced composites. Compos. Sci. Technol. 184:107843. doi: 10.1016/j.compscitech.2019.107843
Jeffery, A. G. B. (2012). The motion of ellipsoidal particles imnmersed in a viscous fluid. Proc. R. Soc. Lond. Ser A. 102, 161–179. doi: 10.1098/rspa.1922.0078
Kleindel, S., Salaberger, D., Eder, R., Schretter, H., and Hochenauer, C. (2015). Prediction and validation of short fiber orientation in a complex injection molded part with chunky geometry. Int. Polym. Process. 30, 366–380. doi: 10.3139/217.3047
Kuzmin, D. (2018). Planar and orthotropic closures for orientation tensors in fiber suspension flow models. SIAM J. Appl. Math. 78, 3040–3059. doi: 10.1137/18M1175665
Larsen, Å. (2000). Injection molding of short fiber reinforced thermoplastics in a center-gated mold. Polym. Compos. 21, 51–64. doi: 10.1002/pc.10164
McGee, S. H., and McCullough, R. L. (1984). Characterization of fiber orientation in short-fiber composites. J. Appl. Phys. 55, 1394–1403. doi: 10.1063/1.333230
Montgomery-Smith, S., Jack, D., and Smith, D. E. (2011). The fast exact closure for Jeffery's equation with diffusion. J. Nonnewton. Fluid Mech. 166, 343–353. doi: 10.1016/j.jnnfm.2010.12.010
Papathanasiou, T. D. (1997). Flow-Induced Alignment in Injection Molding of Fiber-Reinforced Polymer Composites. Sawston: Woodhead Publishing Ltd.
Phelps, J. H., and Tucker, C. L. (2009). An anisotropic rotary diffusion model for fiber orientation in short- and long-fiber thermoplastics. J. Nonnewton. Fluid Mech. 156, 165–176. doi: 10.1016/j.jnnfm.2008.08.002
Salaberger, D. (2019). Micro structure of discontinuous fibre polymer matrix composites determined by X ray Computed Tomography [Ph.D. Thesis]. Technical University Vienna, Vienna, Austria.
Salaberger, D., Kannappan, K. A., Kastner, J., Reussner, J., and Auinger, T. (2011). Evaluation of computed tomography data from fibre reinforced polymers to determine fibre length distribution. Int. Polym. Process 26, 283–291. doi: 10.3139/217.2441
Sharma, B. N., Naragani, D., Nguyen, B. N., Tucker, C. L., and Sangid, M. D. (2018). Uncertainty quantification of fiber orientation distribution measurements for long-fiber-reinforced thermoplastic composites. J. Compos. Mater. 52, 1781–1797. doi: 10.1177/0021998317733533
Tseng, H.-C., Chang, R.-Y., and Hsu, C.-H. (2016). An objective tensor to predict anisotropic fiber orientation in concentrated suspensions. J. Rheol. 60, 215–224. doi: 10.1122/1.4939098
Tseng, H. C., Chang, R. Y., and Hsu, C. H. (2018). Numerical predictions of fiber orientation for injection molded rectangle plate and tensile bar with experimental validations. Int. Polym. Process. 33, 96–105. doi: 10.3139/217.3404
Vélez-Garcia, G. M. (2012). Experimental Evaluation and Simulations of Fiber Orientation in Injection Molding of Polymers Containing Short Glass Fibers. Virginia Tech.
Wang, J., and Jin, X. (2010). “Comparison of recent fiber orientation models in autodesk moldflow insight simulations with measured fiber orientation data,” in Proceedings of the Polymer Processing Society 26th Annual Meeting PPS-26 (Banff, AB).
Wang, J., O'Gara, J. F., and Tucker, C. L. (2008). An objective model for slow orientation kinetics in concentrated fiber suspensions: theory and rheological evidence. J. Rheol. 52, 1179–1200. doi: 10.1122/1.2946437
Keywords: short-fiber composites, micro-CT characterization, injection molding simulation, rotary diffusion models, closure approximations, experimental validation
Citation: Quintana MC, Frontini PM, Arriaga A, Plank B and Major Z (2020) Fiber Orientation Distribution Predictions for an Injection Molded Venturi-Shaped Part Validated Against Experimental Micro-Computed Tomography Characterization. Front. Mater. 7:169. doi: 10.3389/fmats.2020.00169
Received: 23 March 2020; Accepted: 07 May 2020;
Published: 16 July 2020.
Edited by:
Emilia Morallon, University of Alicante, SpainReviewed by:
Jyrki Vuorinen, Tampere University of Technology, FinlandCopyright © 2020 Quintana, Frontini, Arriaga, Plank and Major. This is an open-access article distributed under the terms of the Creative Commons Attribution License (CC BY). The use, distribution or reproduction in other forums is permitted, provided the original author(s) and the copyright owner(s) are credited and that the original publication in this journal is cited, in accordance with accepted academic practice. No use, distribution or reproduction is permitted which does not comply with these terms.
*Correspondence: María C. Quintana, Y3F1aW50YW5hQGZpLm1kcC5lZHUuYXI=
Disclaimer: All claims expressed in this article are solely those of the authors and do not necessarily represent those of their affiliated organizations, or those of the publisher, the editors and the reviewers. Any product that may be evaluated in this article or claim that may be made by its manufacturer is not guaranteed or endorsed by the publisher.
Research integrity at Frontiers
Learn more about the work of our research integrity team to safeguard the quality of each article we publish.