 Michel W. Barsoum
- Department of Materials Science and Engineering Drexel University, Philadelphia, PA, United States
It has long been recognized that when the basal planes of crystalline layered solids were loaded edge-on in compression they failed by the formation of kink bands. And while no good model was ever put forth for how that occurred, it was always implicitly, or explicitly, assumed that basal dislocations, BDs, were the culprit. In 2015, the term ripplocation—best described as an atomic layer ripple—was coined and since then we have been making the case that atomic layers, like in other layered systems—be they playing cards, steel sheets, or geological formations—also fail by constrained buckling. In graphite, beyond a critical buckling stress, ripplocation boundaries, RBs, whose width is equal to the width of the perturbing load are formed. RBs—precursors of kink boundaries, KBs, and fully recoverable—are defined as the locus of points with the highest curvature in each layer. Once nucleated the RBs very rapidly propagate, wave-like, away from under the perturbation. Once they reach a boundary, standing waves, whose crests are RB, are formed. It is the to-and-fro motion of such waves and the concomitant friction between the layers that is responsible for the energy dissipated per cycle per unit volume outlined by stress-strain loops characteristic of layered solids that are cyclically loaded. The driving force for the reversibility of these loops is the elastic energy stored in the RBs and matrix surrounding them. Constraining motion normal to the basal planes results in an increase in buckling stresses and a decrease in the wavelengths of the resulting waves. The results of a folding mechanics model, based on confined buckling—that takes into account frictional, bending and foundation energies—on thin steel sheets not only agree surprisingly well with our experimental results, especially at low confining pressures, but also with previous work (Edmunds et al., 2006). At the atomic level transmission electron microscope, TEM, images on the MAX phases, graphite, and a layered silicate all confirm the existence of ripplocations and RBs. The existence of bulk ripplocations will require a revisiting and reassessment of our understanding of how layered crystalline solids deform.
Introduction
Buckling, Kink Band Formation, and Layered Solids
Layered solids, structures and formations—in which the deformation, at least initially, is confined to two dimensions, 2D—are ubiquitous in nature and span more than 13 orders of magnitude in scale: from sub-nanometer graphene layers, to wood, laminated composites, and paperboard at the centimeter scale, to geological formations at the 100 km, or greater scale. Historically these quite different systems were studied by their respective communities with little crosstalk. More recently their commonalities have been appreciated [see (Hunt et al., 2012) and papers therein]. In these systems, buckling, kink bands, KBs, delaminations and non-linearities are common themes.
Kinking Non-linear Elasticity
It has also long been appreciated that KBs are not restricted to layered structures and formations, but also occur in layered crystalline solids, such as graphite (Kelly, 1981; Barsoum et al., 2004), mica (Bell and Wilson, 1981; Bell et al., 1986) and the Mn+1AXn or MAX phases (Barsoum and El-Raghy, 1999; Barsoum et al., 1999). The latter are ternary layered carbides and/or nitrides, where M is an early transition metal, A is an A-group elements (mostly groups 13 and 14) and X is C and/or N. n ranges from 1 to 4. The bonding is a combination of metallic and covalent bonding. One description of these solids is thermodynamically stable nanolaminates wherein blocks of Mn+1Xn are separated from each other by layers of pure A.
The KBs in these solids, like for other layered formations, are most prevalent when the layers are loaded edge-on (see Figure 4). The MAX phases factor prominently in the history of ripplocations and it is thus worthwhile to review how they came to play such an important role. To that effect it is useful to think of them as “metals,” in which non-basal deformation is impossible. Said otherwise, only basal slip is possible.
Early on in our work on the MAX phases, it was evident that KBs were common after compressive deformation at multiple scales (Figures 1A,B) (El-Raghy et al., 1997; Barsoum and El-Raghy, 1999; Barsoum et al., 1999). Figure 1C is a scanning electron microscope, SEM, micrograph of a crack wake in a compact tension specimen. The similarity with wood, another layered solid that is prone to buckling and KB formation is obvious. These crack bridging ligaments are responsible for R-curve behavior is these solids and the relatively high fracture toughness values—(up to 15 MPa m1/2) measured at room temperatures, RT, in some of them (Gilbert et al., 2000; Hu et al., 2011). From some of the micrographs (see Figure 1D) it was also clear that we are dealing with KB formation as a result of buckling.
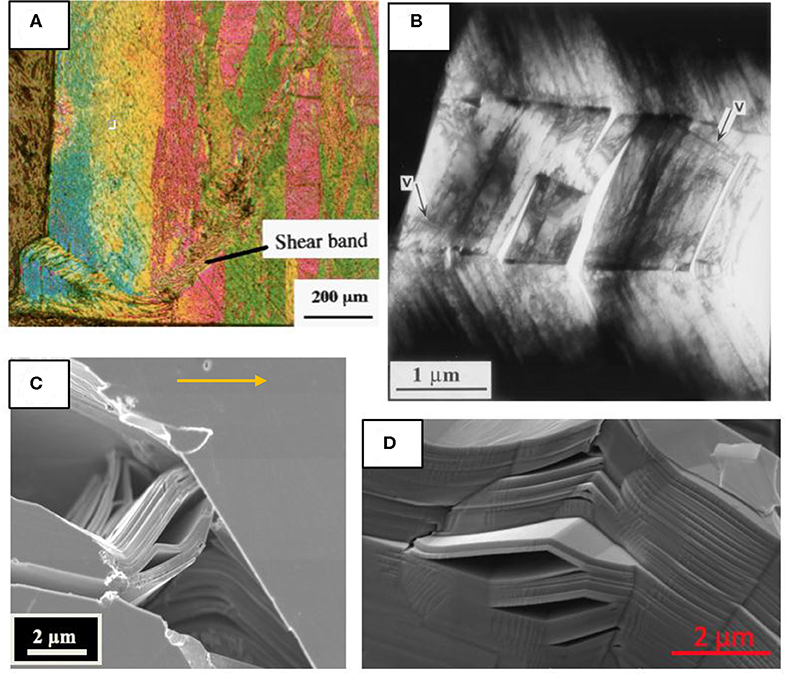
Figure 1. Kink band, KB, formation in the MAX phase Ti3SiC2 at various scales. (A) Kink band formed at edge a 2 mm cube wherein the basal planes were highly oriented vertically (Barsoum and El-Raghy, 1999). (B) KB in TEM, (Barsoum et al., 1999). (C) Field-emission scanning electron microscope, SEM, image of a bridged crack in a coarse-grained Ti3SiC2 microstructure (Gilbert et al., 2000). Heavily deformed lamella bridge the crack and significant amounts of delamination and bending/kinking are observed. Such processes are highly unusual in ceramic systems and account for the high plateau fracture toughness values measured. Arrow indicates direction of crack propagation. (D) KBs and concomitant delaminations of a solid bridge between pores (Sun et al., 2005) (A,B) reproduced with permission from Metallurgical and Materials Transactions A, Springer Nature. (C,D) Reproduced with permission from Scripta and Acta Materialia, Elsevier.
In 2003, we showed that when polycrystalline MAX samples were loaded in simple compression, they outlined spontaneously and fully reversible/recoverable stress-strain loops (Barsoum et al., 2003) (Figure 2). We labeled such solids kinking nonlinear elastic, KNE; non-linear because the strains were non-linear and elastic because the loops were spontaneously reversible (Figures 2A–C). Lastly, we labeled them kinking because it was assumed/hypothesized that incipient kink bands, were responsible for KNE. Incipient kink bands—oppositely signed basal dislocation, BD, walls—were postulated in early work by Frank and Stroh (1952) on kinking in hexagonal metals.
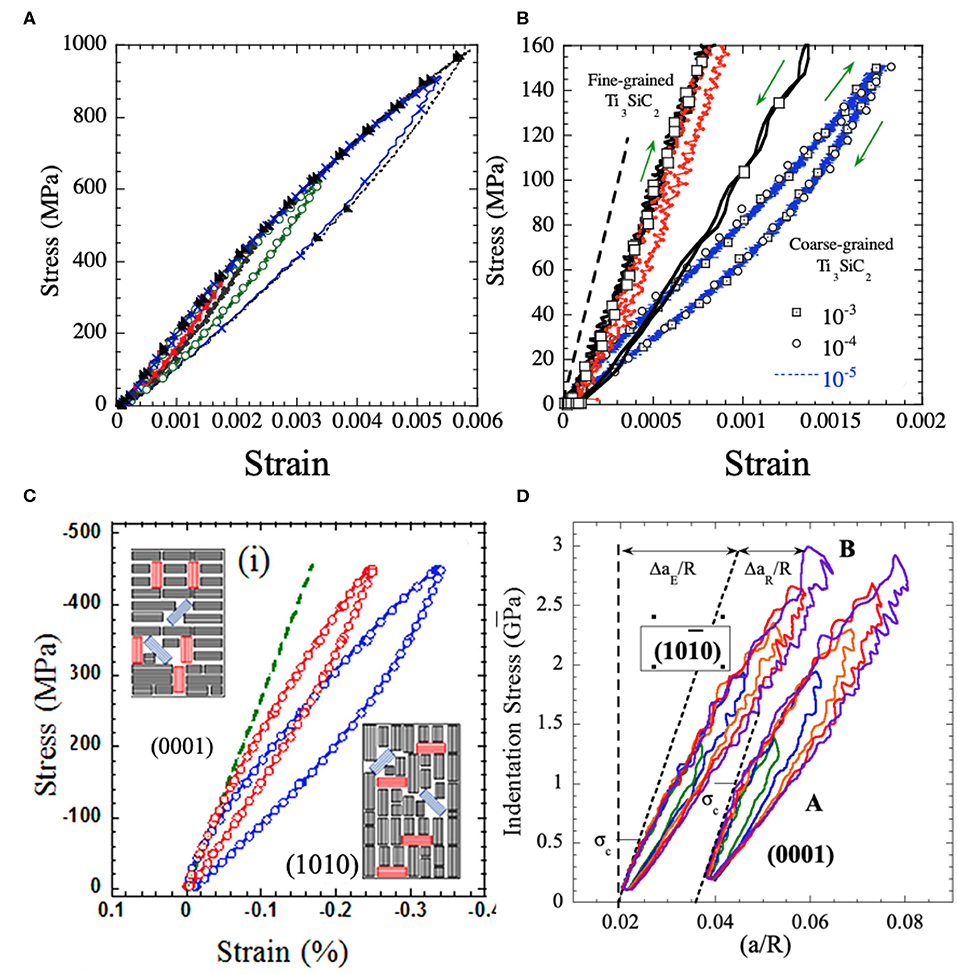
Figure 2. Typical bulk cyclic compressive spontaneously reversible stress/strain loops in (A), Fine-grained, FG, Ti3SiC2, (B) Same as (A) but showing dramatic difference in response between coarse-grained, CG (small blue loops), and FG samples (black and red loops). Note the blue loops comprise three different loops, obtained at three strain rates indicated. Red loop—obtained on FG sample at 250 MPa—is significantly stiffer and smaller in area than the CG loops at the same stress; Within the resolution of the measurement, the three loops at the various strain rates are identical. (C) Highly oriented polycrystalline Ti2AlC samples where, (i) basal planes are mostly normal to the applied load (red loop) or, (ii) parallel to the applied load (blue loop) (Shamma et al., 2015). In insets, thin lines represent basal planes. Black and red rectangles represent majority and minority hard grains, respectively. Blue rectangles represent soft grains. (D) NI stress vs. a/R, where a is the contact radius and R is the indenter diameter, for basal planes loaded edge on, viz. (010) and those loaded normal to the basal planes, viz. (0001) (Griggs et al., 2017). (C,D) Reproduced with permission from Acta Materialia, Elsevier.
In the intervening years, we used spherical nanoindentation, NI, experiments to show that a number of layered ceramics, such as mica (Basu and Barsoum, 2009) and graphite (Barsoum et al., 2004) were also KNE solids.
The Case Against Basal Dislocations
The central attribute of the incipient kink band idea was that it organically accounted for by the full and spontaneous reversibility of the stress-strain loops (Figure 2) by having two oppositely signed walls attract each other. However, it had several strikes against it. First and foremost, was the clear evidence for strain perpendicular to the plane of the layers, so-called c-axis strain. The delaminations that formed upon KBs nucleation were clear and unambiguous signs of c-axis strain (Figure 1). The same was true of nanoindentation marks when the basal planes of some of these layered solids were loaded edge on with spherical indenters (e.g. Figure 6A). Basal dislocations, BDs, by definition, cannot result in c-axis strain. In retrospect, that simple observation should have been enough to rule out BDs. If this paper has a leitmotiv it is that any evidence for c-axis strain has to be due to buckling/ripplocations since it cannot be due to BDs.
We note in passing that in our zeal to explain all spontaneous stress-strain loop reversibility using incipient kink bands—the only plausible model at the time—we probably overreached. For example, in retrospect, the NI stress-strain loops observed in sapphire (Basu et al., 2006a), LiNbO3 and LiTaO3 (Basu et al., 2008; Anasori et al., 2011) are most probably due to reversible twin boundary motion. Conversely, those in hexagonal metals are most likely due to dislocation bowing and not incipient kink bands (Zhou et al., 2008; Griggs, 2016). Note that in hexagonal metals, KBs do form but the deformation occurs without delaminations, because of the activation of < c+a> dislocations (Hess and Barrett, 1949; Jillson, 1950; Gilman, 1954).
The strong anisotropy in failure stresses between tension and compression was also a clue that BDs cannot be the operative mechanism. If the driving force for deformation is shear—to nucleate and move the BDs—then, at least initially, the yield points during compression and tension should have been comparable. In layered solids they are vastly different (Budiansky et al., 1998; Narayanan and Schadler, 1999). Along the same lines, the strong influence of confining pressure on the compressive strengths of poly-, and especially single, crystals was another clue that BDs were not the operative mechanism (Kronenberg et al., 1990; Christoffersen and Kronenberg, 1993; Mares and Kronenberg, 1993). In metals, the critical resolved shear stress of dislocations, in general, and BDs in particular, is a weak function of confining pressures.
Another serious disconnect has been the one between researchers studying crystalline layered geological solids, such as micas (Bell and Wilson, 1981; Bell et al., 1986; Meike, 1989; Kronenberg et al., 1990; Christoffersen and Kronenberg, 1993; Mares and Kronenberg, 1993). where it was assumed that BDs are the operative micromechanism for deformation, and those working on geological formations that totally ignored the microscopic aspects. If BDs are important at the microstructural level, should they not also feature in the “big picture”?
To summarize this section, the fact that many crystalline layered solids fail in compression, but not tension, by forming KBs, with delaminations, that are quite similar to those seen in other layered systems, should have been the first clue that perhaps invoking BDs may not have been the most fruitful avenue.
Ripplocations
A ripplocation is best described as an atomic scale ripple. The term was coined in 2015 by Kushima et al. (2015) to describe near surface defects in van der Waals solids such as MoS2. What this paper very elegantly did was to show by density functional theory, DFT, and molecular dynamics, MD, calculations that same polarity surface ripplocations attracted as opposed to two same polarity dislocations that repel and are thus fundamentally different defects. That work led to the profound epiphany that ripplocations—not BDs—are the operative micromechanism in the deformation of all layered solids as defined herein and led to our current understanding (Gruber et al., 2016). It is important at this juncture to note that we were are not the first to make the case for buckling in layered solids and formations; we are the first, however, to extend the idea to crystalline solids.
Our current understanding of ripplocations, and their properties in layered solids/systems, has accumulated, over the years, from five parallel paths: (A) Confined buckling experiments and their modeling (Edmunds et al., 2006; Barsoum et al., 2019; Badr et al., 2020); (B) Cyclic compression of polycrystalline samples (Barsoum et al., 2003; Zhou et al., 2006), (C) Nanoindentation experiments (Barsoum et al., 2004; Basu and Barsoum, 2009), (D) Transmission electron microscope, TEM, micrographs of deformed layered solids (Gruber et al., 2016; Griggs et al., 2017; Alaferdov et al., 2018; Aslin et al., 2019) and, (E) MD calculations on perfect graphite single crystals at 10 degrees Kelvin, K (Gruber et al., 2016, 2020; Frieberg et al., 2018). In the remainder of this paper these five strands will be woven together to create a ripplocation tapestry that i hope is sufficiently convincing.
Confined Buckling Experiments and Their Modeling
A-1 Experimental Details
The setup we used to nucleate and model ripplocations is shown schematically in Figure 3A (Barsoum et al., 2019; Badr et al., 2020). This setup is similar to that used by Edmunds et al. (2006) except that in our case the foundation was not foam, but other layers and rigid fixtures on each side. We loaded the layers from the top using a cylindrical indenter, whose axis was parallel to the layers (Figure 3A) and captured the deformation on film. We simultaneously measured the indentation, PN, and confining, PN, 0 loads as a function of indentation depth. To measure the latter, we embedded a load cell in one of the fixed blocks (Figure 3A). From these experiments the following was confirmed:
i) The load increased more of less linearly with indentation depth up to a critical load (Figure 3B) at which a buckling instability occurred and standing waves below the indenter were quite rapidly formed (Figure 3D) (Barsoum et al., 2019; Badr et al., 2020). For reasons that are discussed below, we define a ripplocation boundary, RB, as the locus joining points the highest curvature in each layer of the standing waves (Figure 3E) (Frieberg et al., 2018). RBs form normal to the basal planes (Figure 3E) and are precursors of KBs. In contrast to KBs that are not reversible, RBs are (Frieberg et al., 2018).
ii) Increasing the load, increased the amplitude of the standing waves, but not their wavelengths, λRB. PN, 0 also increased linearly with indentation depth (Barsoum et al., 2019; Badr et al., 2020). The same was observed by Wadee et al. (2004) and Wadee and Edmunds (2005).
iii) Increasing the confining, or overburden, pressure, sheet thickness, t, and/or reducing the number of layers per deck, increases the load at which ripplocations nucleate (e.g., Figure 3B) (Badr et al., 2020).
iv) With increasing PN, 0 and t, λRB decreased (Badr et al., 2020).
v) Upon unloading, fully recoverable, highly reproducible stress-strain loops are generated (Figure 3B). The driving force for the recoverability of the process is the elastic energy stored in the crests of the waves and the surrounding matrix.
vi) Coulombic friction between the layers accounts for the energy dissipated per cycle per unit volume, Wd (Badr et al., 2020).
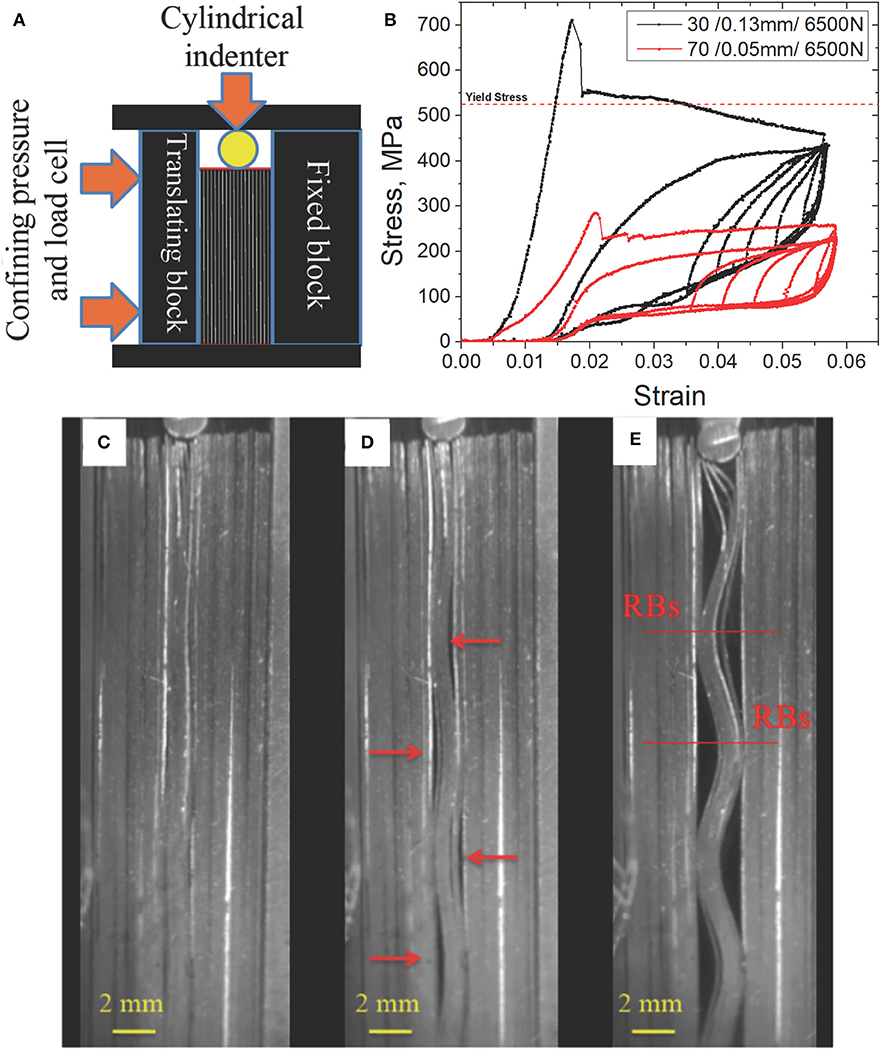
Figure 3. (A) Setup used to study ripplocations in layered systems (Gruber et al., 2016). (B) Typical stress-strain curves of thin steel sheets. Difference between the two curves is in the thickness of the deck and the thickness of the layers in each deck. Confining pressure was the highest used here 6500 N (Badr et al., 2020). Drop in maximum stress coincided with buckling and nucleation of RBs. Still frames of movie of loading steel sheets, (C) initial configuration with cylindrical indenter oriented into the page at top. (D) Nucleation of RBs at maximum stress in b. Note delaminations. (E) Same as (D) but at maximum penetration depth. RBs, precursors of kink boundaries, are defined as locus of regions with maximum curvature, i.e., crests of standing waves. Upon removal of the load, the configuration returns to one quite similar to that shown in (A). Said otherwise the process is reversible.
A-2 Mechanics Models
Because of its importance in layered systems in general, and geology in particular, the question of how layers of a material or geological formation deform when loaded edge-on in compression is one that has been tackled by many over the years (Biot, 1964, 1965; Budiansky et al., 1998; Edmunds et al., 2006; Hunt et al., 2012). For a good overview see (Hunt et al., 2012) and references therein. The model that fits our results the best is the one by Edmunds et al. (2006).
The problem we tackle here is shown schematically in Figure 4 and is almost identical to that of Edmunds et al. (2006) We consider n incompressible layers each of thickness, t, width, b, and height, h (Figure 4A) (Badr et al., 2020). If the layers have a Young's modulus, E then the bending rigidity of each layer is given by:
All buckled layers are assumed to bend about the same central line of the curvature, slip is constant between layers, and no voids are nucleated.
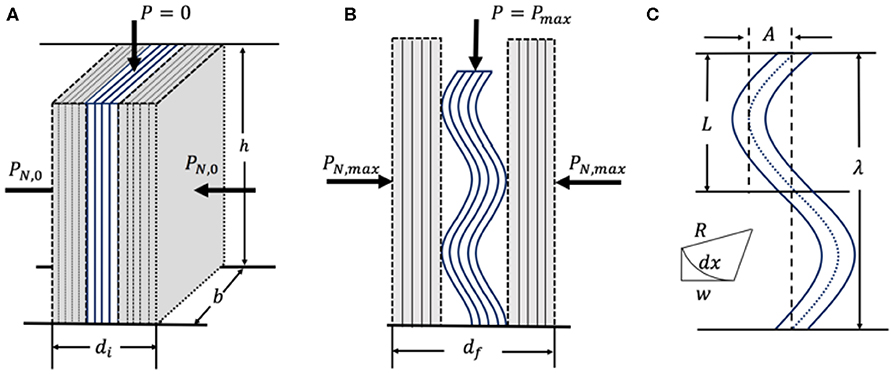
Figure 4. (A) Initial configuration where layers are confined by force PN, 0. (B) Configuration at maximum indentation, h2.5, showing vertically loaded four-layer ripple that buckled into 4 modes. (C) Definitions of w, wavelength, λ= 2L and amplitude, ARB.
The applied force, PN, is applied along h, of the layers initially confined by a force PN, 0 (Figure 4A). The remaining unbuckled layers, together with the rigid fixture on each side, act as the foundation and are modeled by two springs in series, each with a spring constant, k, per unit length. Experimentally, plots of the confinement force vs. displacement (not shown) were nominally straight indicating linear stiffnesses (Badr et al., 2020). Therefore, for all but one run the transverse stiffness of the foundation, c, is determined assuming
where PN, max is the load at maximum indentation. The horizontal deflection of the spring, Δd, is the difference between the initial, di, and final (viz. at maximum load), df, distance between the confining plates (see Figures 4A,B). Both are measured experimentally using image processing software and used in the model. The measured stiffness results from two springs in series and as such, k is twice c, divided by the height of layers, h. This last manipulation is performed in order to obtain a stiffness, k, per unit length.
Assuming small deformations, with a coordinate of arclength x and relatively small deflection w (Figure 4C), the non-linearity of the geometry is not considered dominant and is neglected. The total potential energy function, V, for this case includes the bending energy, UB, the work done by the vertical load, UP, the foundation energy, UF, and the work done by friction Uμ. Working under the assumption of T2 ≪ 4n2R2/(n − 1)2 (i.e., that the radius of curvature R during buckling is >T = nt), V over a periodic half-wavelength, L, can be written as:
shown by Edmunds et al. to be:
where μ is the friction coefficient and χ is a friction indicator. When χ = +1, the direction of the friction force is opposite to the external load. Conversely, when χ = −1, V is negative, and the direction of the friction force is the same as the loading direction.
Using a Galerkin approximation, and assuming a deflection shape of w(x) = A cos (πx/L), (Figure 4C), where A is the wave amplitude, the linear eigenvalue analysis of V provides the critical load (Edmunds et al., 2006):
Minimizing the critical load with respect to the half-wavelength yields:
Interestingly enough neither Pcrit nor L depend on μ. Combining Equations 1 and 5, on finds,
It follows that a plot of L/t vs. term in brackets should yield a straight line with a slope of π.
The theoretical Pcrit and L values determined from Equations (4) to (5), respectively, are then compared with the experimentally measured ones. Moreover, λ = 2L, and R are measured at the point of maximum indentation from the still frames. The experimental load at which buckling occurs, PBK, is determined from movies taken of the sheets as they were loaded. As noted above, buckling occurs when there is a strong change in slope in the stress-strain curves.
Note that the assumption,
where T = nt, works well at low confinement levels with a rigid foundation, but less at higher levels because the curvatures decrease to the order of, or less than, the overall thickness of the buckled layers. As a result, we introduce the term:
which is essentially a non-dimensionalized ratio of the curvature and overall thickness of the buckled layers as an indicator of how well the aforementioned inequality holds. The higher the value of η, the better the model predictions and experiments align. In other words, agreement between theory, and experiment should be best at large values of η and become increasingly less so at high levels of confinement, i.e., for η < 20. Similar arguments were made in Budd et al. (2003) and Edmunds et al. (2010).
A-3 Energy Dissipated per Cycle
Intriguingly, as noted above, neither Pcrit nor L depend on μ. That cannot be true of the energy dissipated per cycle per unit volume, Wd. All the nested loops shown in Figure 2B, are fully recoverable. Under these conditions, and further assuming, σRB ≈ 2τRB, the following relationship is approximately valid:
where γRB, εRB and ν are the applied shear and normal strains and Poisson's ratio, respectively. τRB and σRB are the shear and normal stresses needed to move the RBs. If we further assume Coulombic friction, viz. PS = μPN, where PN and PS are the average loads acting normal and parallel to the layers during a cycle, it follows that (Badr et al., 2020):
If this equation is valid, and μ is not a function of PN, then plots of Wd vs. (PN×εRB)/Aind should yield straight lines with slopes equal to μ(1+ν). Here, Aind is indented area.
A-4 Critical Analysis of Model
Figure 5A compares, on the same plot, the predicted and experimentally determined λRB values for thin steel plates (Badr et al., 2020) and paper (Edmunds et al., 2006). Going one step further, Equation 6 predicts that a plot of L/t vs. the term in brackets should yield a straight line with a slope of π. Figure 5B combines our results on steel and those of Edmunds et al. (2006) on paper. A least square fits of both sets of results yields a slope of 3.21 and an R2 value of 0.957. This overall agreement has to be considered excellent given the very large differences in experimental setups—solid foundation with large overpressures vs. foam—and the materials tested; steel vs. paper.
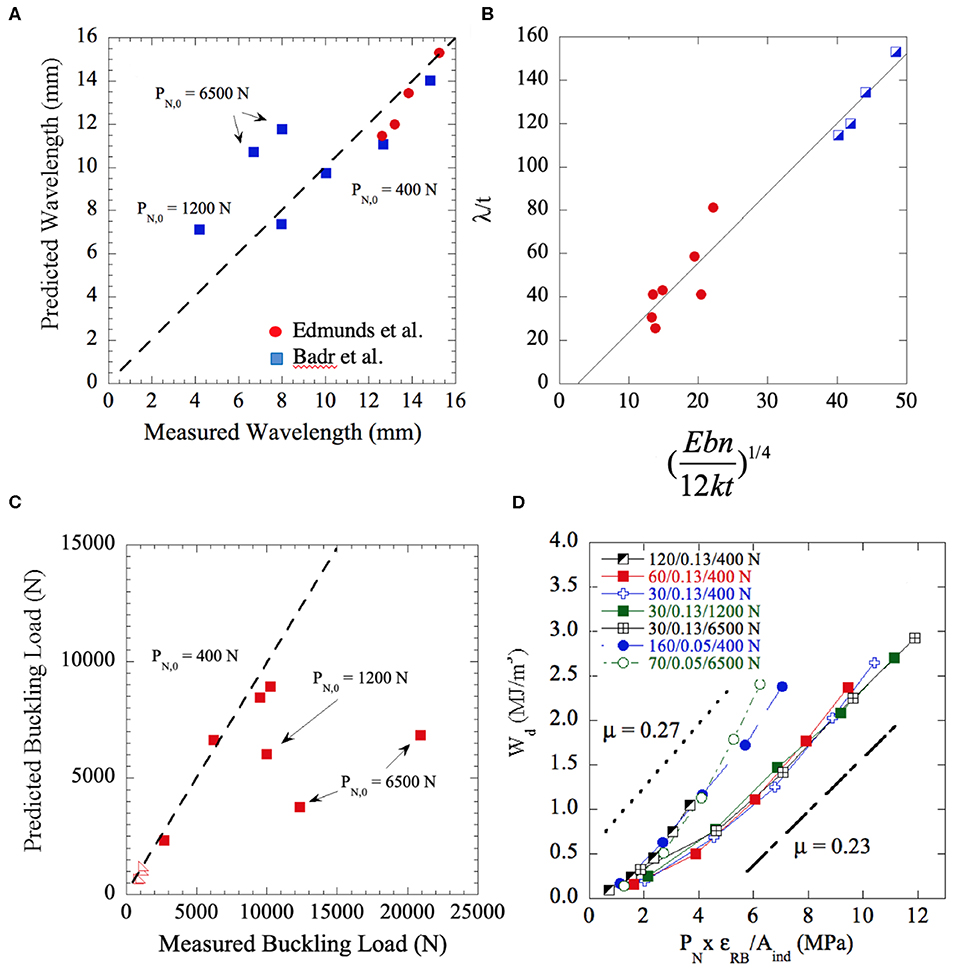
Figure 5. (A) Comparison of measured and predicted wavelengths, λ, (B) λ/t vs. (Ebn/12kt)1/4, (C) Comparison of measured and predicted buckling loads. (D) Plot of Wd vs. (PNεRB/Aind). Slope of these lines is proportional to the friction coefficient, μ (Badr et al., 2020).
Figure 5C compares the theoretical and experimental buckling stresses for our and Edmunds et al. (2006) results. Based on these results it is reasonable to conclude that the Edmunds et al. model is quite accurate for predicting the wavelengths of RBs and their buckling stresses. Note that the agreement in the steel case is less good for large confinement stresses (1,200 and 6,500 N). In that regime is no longer valid.
According to Equation 8, if μ is not a function of PN, then plots of Wd vs. (PN×εRB)/Aind should yield straight lines with slopes equal to μ(1+ν). Figure 5D shows that to indeed be the case. The second row of Table 1 lists the values of μ assuming ν = 0.3 and the slopes of the lines plotted in Figure 5D. Given the simplicity of the model used to derive Equation 7, the results shown in Figure 5D are quite gratifying for several reasons:
i) Coincidentally or not, the μ values listed in the last row in Table 1, averaging 0.23 ± 0.03, are in excellent agreement with the experimentally measured μ values of 0.23 and 0.27 for the thick and thin sheets, respectively. This agreement lends credence to our experiments, analysis and simple model (Badr et al., 2020).
ii) This in turn implies that Coulombic friction, viz. PS = μPN, is applicable and that μ is not a strong function of PN. The curvature seen in the curves, however, suggest, not too surprisingly, that μ may not be totally independent of PN,0.
iii) Lastly the results plotted in Figure 5D, show that a straightforward method to increase Wd is to start with thinner sheets (top curves in Figure 5D).
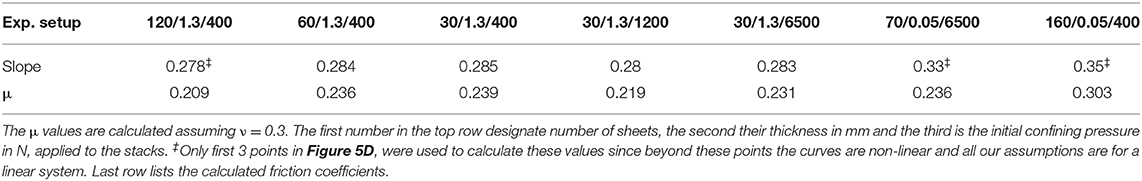
Table 1. Least squares of slopes of lines shown in Figure 5D.
Cyclic Compression of Polycrystalline Samples
As noted in the introduction, we have shown, over the years, that when polycrystalline MAX phase samples were cyclically loaded in simple compression, fully recoverable, stress-strain loops were obtained (Figure 2). We labeled such solids KNE. The latter share the following characteristics:
i) The initial slopes of the stress-strain curves are linear and equal to the elastic moduli of the materials being tested. The dashed oriented lines in Figures 2B,C and d are what would be expected if no kinking occurred. With increasing stress, the response becomes non-linear. The stress at which the nonlinearity is observed—the kinking or buckling stress—is a strong function of grain size, with smaller grains being much more resistant to buckling (Figure 2B).
ii) When cycled, fully recoverable stress-strain loops are obtained. The shape and size of the loops are not a function of strain rate, at least in the 10−5 to 10−3 s−1 range in Ti3SiC2 deformed at RT (Figure 2B) (Barsoum et al., 2003).
iii) Wd is larger, on an absolute scale, for 10 % porous Ti2AlC MAX samples, than for their fully dense counterparts (Zhou et al., 2006). This result is fully consistent with buckling.
iv) When highly oriented polycrystalline Ti2AlC samples were compressed, Wd for samples where the basal planes were loaded edge-on were higher than those in which the load was along the c-axis (Figure 2C) (Shamma et al., 2015). The latter microstructure/loading will be referred as (0001), while the former will be referred to as (001).
v) The kinking nucleation stresses were higher for (0001) than for (001) samples.
vi) Wd is a strong function of grain size (Figure 2B). Wd in tension is at least an order of magnitude smaller than in compression (Radovic et al., 2000). The same is true of the failure stresses.
vii) At higher temperatures, the response becomes time dependent. The loops are larger and are a function of strain rate. Cyclic hardening is observed at temperatures as high as 1,200°C in air Zhen et al. (2005a) and Barsoum et al. (2003).
viii) Cyclic hardening, at room temperature, RT, is observed after small deformations at higher temperatures (Zhen et al., 2005b). This results from a grain size refinement of the microstructure. This refinement is due to the formation of multiple kink boundaries/bands.
ix) TEM micrographs of post-crept samples show low defect concentrations suggesting that the grain boundaries are potent sinks of RBs at higher temperatures (Barcelo et al., 2010).
As noted in the introduction, the full spontaneous reversibility was previously ascribed to the attraction of two oppositely signed dislocation walls comprising the IKBs (Barsoum et al., 2005). Based on the results shown in this and following sections, it is now obvious that the origin of the reversibility is much more mundane and due to the elastic energy stored in the system—both in the crests of the RBs standing waves and the surrounding matrix—during loading.
Nanoindentation Experiments
After the MAX phases were classified as KNE solids, the question that arose was how to prove it in materials, like layered ceramics, that were more brittle. Here we turned to nanoindentation, NI, experiments on mostly ceramic single crystals (Basu and Barsoum, 2009). To obtain stress/strain curves we used spherical indenters of varying radii, R, and developed a methodology to convert the NI load-displacement curves to NI stress, σNI. We then plotted σNI vs. a/R plots (Basu et al., 2006b; Moseson et al., 2008). Typical plots for two orientations of Ti3SiC2 grains [(000l) and (001)] are shown in Figure 2D. In most cases, the indenter was thrust into the same location, sometimes as many times as 50 times, before nested loops such as those shown in Figure 2D, were generated, and analyzed (Griggs et al., 2017). Note similarity between Figures 2A,D.
Based on the totality of our results the following has been established:
i) For the most part, during the first cycle, the response is linear elastic, with a slope proportional to the elastic modulus of the surface being indented (Basu and Barsoum, 2009; Griggs et al., 2017). In some cases, this linearity was followed by large pop-ins. The latter were more frequent in the (0001) orientation and when the pop-in stresses were high (Barsoum et al., 2004; Basu and Barsoum, 2009; Griggs et al., 2017). In one case, a 60 μm pop-in was observed in a (000l) single crystal of graphite (Barsoum et al., 2004). In the (001) orientation, the extent of the pop-ins and the stresses at which they occurred were significantly smaller (Griggs et al., 2017).
ii) During most first cycles, a permanent deformation is observed. In the absence of this deformation, the response is, for the most part, linear elastic.
iii) When they could be compared, the buckling stresses were significantly lower in (001) grains than their (0001) counterparts (Griggs et al., 2017). This is not too surprising since intuitively it is easier to buckle grains when their basal planes are loaded edge-on (001), than normal to them, i.e., along the c-axis.
iv) In contrast to when polycrystalline samples were loaded, Wd was smaller in the (001) grains than the (0001) ones (Figure 2D) (Griggs et al., 2017).
v) Consistent with the need of the basal planes to expand upon the introduction of BRs, the initial friction stress needed to nucleate and move them was found to be almost three times lower when the basal planes are loaded edge-on (Griggs et al., 2017).
Here again, the most compelling and straightforward evidence for ripplocation nucleation and movement under various indenters is the c-axis strain observed. The latter is manifested in two ways depending on the orientation of the basal planes relative to the indentation direction. When (001) planes are loaded, delamination cracks (Figure 6a) are formed. Such cracks are strong evidence for buckling since they cannot be explained by the nucleation and movement of BDs alone. In the (0001) case, large buildup/pileup of material at the indentation edges is the evidence needed to conclude that BDs alone, cannot be the culprit (Figures 6b–d). This large buildup is a result of the buckling of near-surface layers due to the thrust of the indenter into the material. In this orientation, what is occurring is shown schematically in inset of Figure 6e (Kooi et al., 2003). As the nanoindenter is pushed into the surface, the basal planes buckle out of the surface plane and end up as large pileups near the indentation marks as shown nicely in Figures 6e,f.
These observations are important for another reason; they are clear evidence that RB are responsible. In crystalline solids, in which < c+a> dislocations can be nucleated under the indenter, the indentation mark is “metallurgical” in character, in that neither a large pileup of material nor delamination cracks (Figure 6e)—even in a brittle material such as ZnO (Figure 6f) (Basu and Barsoum, 2007)—are observed. Said otherwise, large pileups and delamination cracks are characteristics of ripplocations. It follows that a simple method to determine whether a material deforms by ripplocations is to carry out spherical NI experiments normal to and/or parallel to the basal planes.
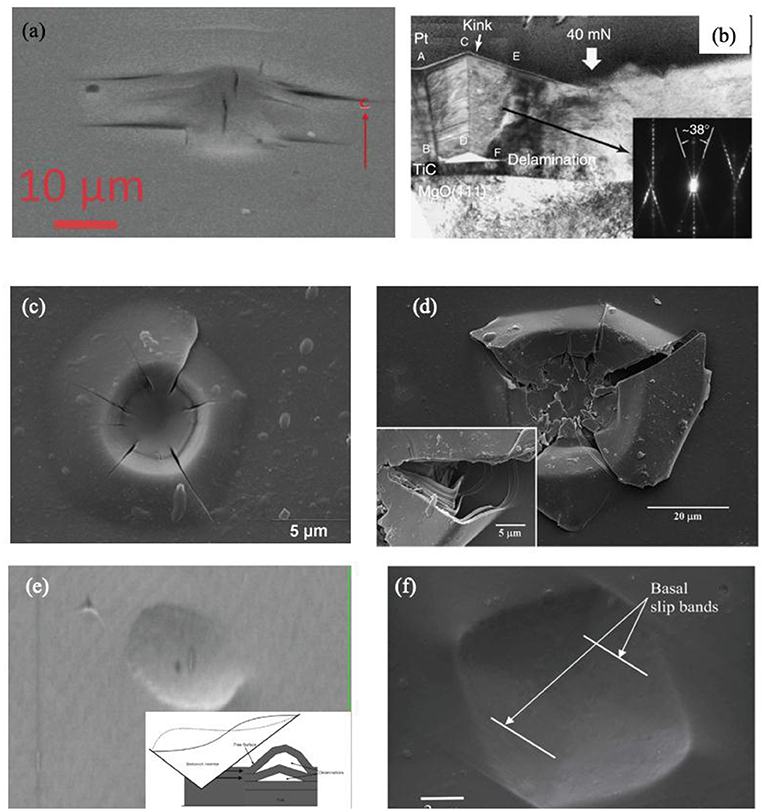
Figure 6. Nanoindentation marks in, (a) SEM micrograph of a spherical NI in (100) Ti3SiC2 grain (Murugaiah et al., 2004). (b) TEM cross-sectional micrograph of a Berkovich indentation in a thin Ti3SiC2 epitaxial layer (Molina-Aldareguia et al., 2003). (c) same as (a) but in a (000l) MAX single crystal, (d) same as (c) but for mica. In both a large pileup around indenter is observed. (e) (000l) Mg (Griggs, 2016) and, (f) (100) ZnO (Basu and Barsoum, 2007). Inset in e is schematic of how basal planes buckle to create pileups. (a,f) reproduced with permission from J. Mater. Res., Cambridge Univ. Press.
It is important to stress here that if the applied NI stress is lower than that needed to nucleate permanent KBs (see below), there is typically little trace of the indentation. The response, however, is not linearly elastic since considerable energy is dissipated during each cycle.
Transmission Electron Microscopy of Deformed Layered Solids
In the following, we summarize ours, and others', TEM work on deformed layered solids.
i) Kushima et al. showed direct evidence for ripplocations in MoS2 (Kushima et al., 2015). They also directly observed ripplocation generation, and motion, when few-layer MoS2 films were either lithiated or in situ loaded in the TEM.
ii) In the MAX phases, ripplocations in the TEM manifest themselves as dark streaks parallel to the basal planes (Figures 7A,B) (Gruber et al., 2016; Griggs et al., 2017). Crucially, geometric phase analysis of these features showed evidence for c-axis strain that was similar to our MD simulations of ripplocations in graphite (Figures 7D–G) (Gruber et al., 2016; Griggs et al., 2017). Since c-axis strain is impossible for BDs, the streaks have to be due to something else. Fast Fourier transforms of these features resulted in the observation of undulating basal planes that can be described as ripplocations (Figure 7C) (Gruber et al., 2016; Griggs et al., 2017).
iii) In a study on post-neutron irradiation defects in the MAX phases, we presented evidence for two types of defects: interstitial dislocation loops for which a g∙b condition was found that rendered them invisible and another set for which no g∙b condition was found that resulted in their disappearance (Tallman et al., 2017). The latter were assumed to be ripplocations. Here g is the direction of the electron beam and b is the Burgers vector of the dislocations. One way to prove the existence of dislocations is to alter the direction of the electron beam so as to render them invisible. If no condition can render the defects invisible it is indirect evidence that the defects are not dislocations.
iv) Kabiri et al. in situ deformed the MAX phase, Nb2AlC, both normal, and parallel, to the basal planes in a TEM (Kabiri et al., 2017). And while they concluded that BDs were the operative micromechanism, their results—critically the anisotropy observed—only make sense in a ripplocation framework. In that work, the reversibility of the process was also nicely demonstrated.
v) Alaferdov et al. presented TEM evidence of ripplocations in graphite nanoplatelets after sonication (Alaferdov et al., 2018).
vi) Nano-scale bending features or nanobridges (Figures 8A,B)—that cannot be explained by BDs alone—were ubiquitous in biotite grains (Aslin et al., 2019). These features created conjugate delamination array structures that are the result of elastic strain energy release due to the accumulation of layer-normal, or c-axis strain, due to the presence of ripplocations (see Figures 8C–E). This explains why the diamond-shaped expansional arrays are crystallographically controlled as evidenced by the fact that they have different orientations in different grains. In all cases, however, the arrays were aligned normal to the c-axis of each grain (Figures 8A,B). Conjugate delamination arrays represent the most efficient way to relieve stored grain-scale c-axis strain energy, just as conjugate normal faults result from extension on a larger scale. The orientations of principal stresses in this figure are therefore representative of the time when stored elastic strain energy is released (most probably during thinning the samples for TEM observation), and not necessarily the time during which the strain was being accumulated, i.e., in the geological formation they were found.
Figure 7. TEM and strain analysis of Ti3SiC2: (A) typical TEM image of an indented Ti3SiC2 grain normal to [0001], showing a high defect density. Inset shows diffraction pattern. (B) High resolution TEM image showing an individual ripplocation; (C) Fast Fourier transform of the same region shown in (B) where distortion of the basal planes is clearly visible. Geometric phase analysis is leveraged within this area to produce, (D) c-strain, εzz, and, (E) basal plane lattice micro-rotation maps. The black box in (D) denotes the reference lattice for geometric phase analysis. These are similar to calculated fields of, (F) εzz and, (G) micro-rotation in graphite determined from MD atomistic simulations. In all cases, the z-direction was normal to the basal planes. Reproduced under the Creative Commons CC BY license.
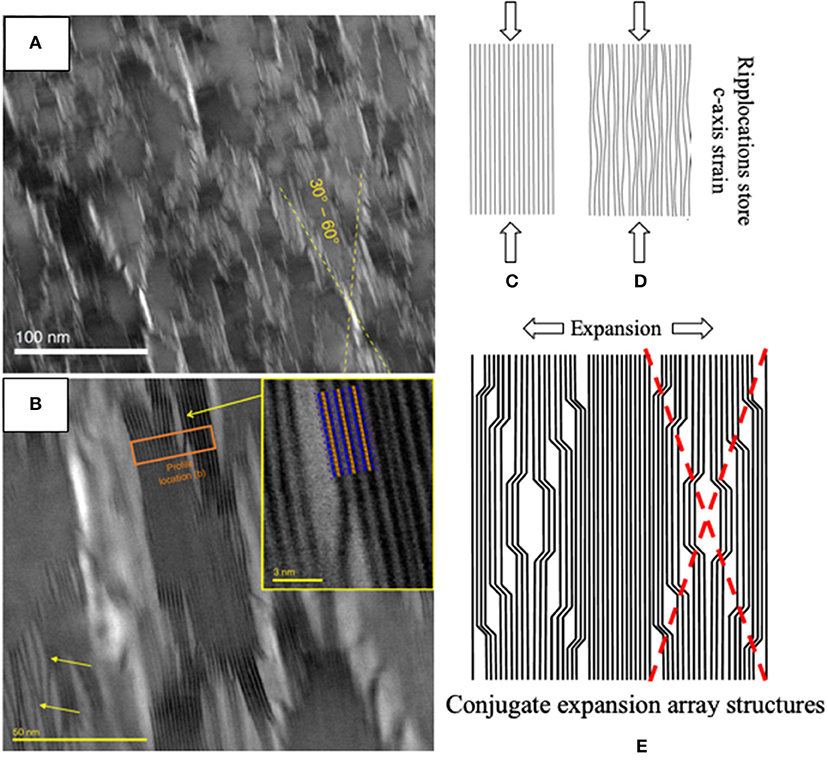
Figure 8. (A) Transmission electron microscope micrographs of a natural biotite. Bright streaks are revealed to be up to 60 Å wide, lozenge-shaped lattice expansion, or delamination, structures of biotite basal planes. The acute angles of these diamonds measure between 30° and 60°. (B) Lattice curvature and interlayer expansion. Inset is a higher magnification image of the orange rectangle shown in micrograph emphasizing atomic nature of the deformation. (C) Perfect layers subjected to compression. (D) Ripplocations store c-axis strain that, when released, results in, (E) Conjugate arrays of expansion structures and delaminations observed (Aslin et al., 2019). Reproduced under the Creative Commons CC BY license.
To summarize this section, direct, and indirect, TEM evidence of RBs and features—like nanobridges and conjugate arrays of expansion—that can only be explained by the presence of ripplocations exist. The importance of the biotite work cannot be overemphasized since it is the first to present direct evidence for ripplocations and RBs in an important geological material. BR provide the missing mechanism necessary to understand phyllosilicate deformation, with important rheological implications for phyllosilicate bearing seismogenic faults and subduction zones.
In the past, delaminations and hysteresis in weakly bonded geological materials were assumed to be due to fast fracture and concomitant delaminations. And while this may be true of non-layered solids, (Walsh, 1965; David et al., 2012) this claim has to be carefully scrutinized in case of layered solids. For example, the results shown in Figure 8, belie this notion since, at least in this material, the delaminations were due to c-axis expansions. Said otherwise, in some cases, the cracks and delaminations are due to ripplocations. The distinction is important: In the brittle case, the cracks would extend across the entire sample or formation, in the other, the deformed region hardens which then results in more delaminations and ultimately conjugate arrays (Figure 8). In short, conjugate delamination array structures in layered solids are clear evidence of the release of c-axis strain associated with ripplocations and RBs.
Lastly in this section it is important to note that direct TEM evidence for ripplocations in graphite have long existed. The features observed were not labeled as such, however (Muto and Tanabe, 1999; Asthana et al., 2005; Eapen et al., 2014).
MD Simulations
The following applies to bulk ripplocations in graphite at 10 K. A straightforward method to nucleate ripplocations is to add carbon atoms to a given graphitic basal plane (Kushima et al., 2015; Gruber et al., 2016). Based on our, work and that of others, it is more or less established that:
i) Ripplocations nucleate as a result of buckling. In the bulk, the buckling is confined (Gruber et al., 2016). At, or near, surfaces it is unconfined (Kushima et al., 2015). Ripplocation nucleation results in a clear change in the slope of the force vs. strain curves (Figure 9c).
ii) The process is almost fully reversible/recoverable and removal of the indenter results in a pristine sample. The areas of the stress-strain loops are quite small, however compared to those measured in our macroscopic experiments. These areas, for reasons that are not clear at this time, are a strong function of strain rates (Barsoum et al., 2019). More work is needed to understand this intriguing result.
iii) Once nucleated BRs, whose extent is equal to the size of the indenting surface, very rapidly propagate like waves away from under the indenter (Figure 9a). Upon reaching a boundary, standing waves arise (Figure 9b). As noted above, the locus of points joining the highest curvature in each layer of the standing waves was termed a RB. These are shown as dotted yellow lines in Figure 9b and are similar to those observed in Figure 3C (Frieberg et al., 2018).
iv) BRs are attracted to each other regardless of their polarity (Gruber et al., 2016). A single ripplocation, like a dislocation interstitial loop has no Burgers vector (Gruber et al., 2016). A single ripplocation, like a single dislocation is scientifically interesting, but of limited utility. In graphite, ripplocations are attracted to other ripplocations, both within the same layer and on adjacent layers. Interestingly enough, single surface ripplocations act as solitons (Savin et al., 2019).
v) As noted above, the critical distinction between a KB and RB is that while the latter is fully reversible, the former is not.
vi) When the radii of curvatures of the RBs are no longer sustainable, they transform to the ubiquitous and well-established KBs. Once a KB forms (not shown), the system is “broken” and no-longer fully reversible.
vii) BRs can only nucleate at free surfaces. Nucleating a BR in solids entails severing/cutting atomic planes. Once severed, the two free ends of the basal planes can move in opposite directions (Griggs et al., 2017). Ripplocations spontaneously also migrate away from remote compressive stresses (Gruber et al., 2020).
viii) In graphite, even at 10 K, ripplocations are quite mobile indeed and are attracted to vacancies (Gruber et al., 2020). The energy needed to move them is a function of their widths, but asymptotically reach ≈ 32 meV.
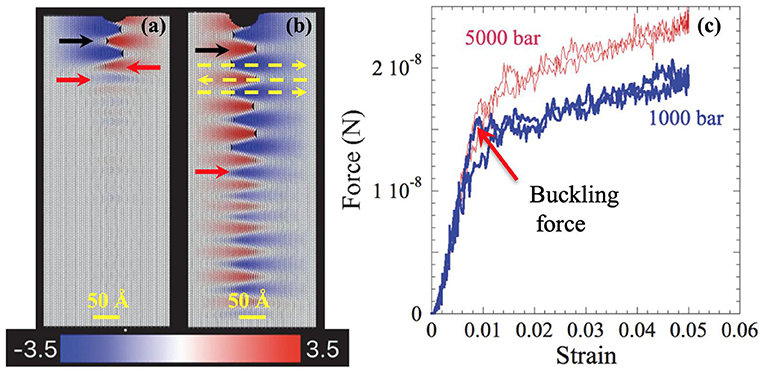
Figure 9. (a) Molecular dynamics, MD, simulation of indenting graphite layers edge-on at the nucleation of the RBs. Color scale in (a) quantifies atomic motion along the z axis, in Å, to the right (blue) or left (red). (b) same as (a), but at maximum penetration. (c) MD load vs. strain curves. Point at which the slope of the force/strain curves changes coincides with nucleation of ripplocation boundaries, RBs. Process is fully reversible (Barsoum et al., 2019). Yellow arrows denote RBs of opposite signs. Black arrows point to delaminations. Horizontal red arrows point to regions where the deformation in accommodated without delaminations. Black arrows point to delaminations.
To understand RB nucleation, we cyclically loaded, in silico, the basal planes of graphite single crystals edge-on with cylinders of radii of 50, 100, and 250 nm (Frieberg et al., 2018). The response was initially linear elastic, followed by the nucleation and growth of multiple, fully reversible RBs below the indenter. The RBs that nucleate from the alignment of ripplocations on adjacent layers are exceedingly non-local and propagate, wavelike, away from the indented surface. As importantly, and consistent with buckling, because the number of atomic columns loaded under the 50 nm indenter are fewer than the ones that form under the 250 nm indenter, they nucleated at lower stresses (Frieberg et al., 2018).
We also carried out molecular dynamics simulations on graphite at 10 K and faithfully reproduced many features observed below indenters in Ti3SiC2. Here we give three examples. In Figures 10a,b, we indented a (000l) surface with a spherical NI. At low penetrations (Figure 10a), how the basal planes buckle out of the way is obvious. The similarities between Figure 10a and say Figure 6b should be clear at this time. At higher penetrations (Figure 10b) the buckling becomes much more complicated. At maximum penetration the regions next to the indenter look quite unusual indeed (Figure 10c). Such structures would seem fantastical had they not been directly observed (Figure 10d) near the buckled corner shown in Figure 1A, where small Ti3SiC2 cubes were deformed (Barsoum and El-Raghy, 1999). Lastly, Figure 10e, shows a SEM micrograph of a Cr2AlC single crystal that was deformed at high temperatures. That the basal planes buckled is clear. The inset in Figure 10e is a MD simulation of graphite in which the basal planes were loaded edge-on without constraining the sides (i.e., deformation is allowed along the vertical direction). The similarities between the simulation and the deformed sample is quite striking given the orders of magnitude differences in scale and bonding between the two materials. There is also little doubt that the deformation mode observed is one due to compressive buckling and not shear. Indeed, it would be very difficult, if not impossible, to explain these micrographs in a shear-based universe.
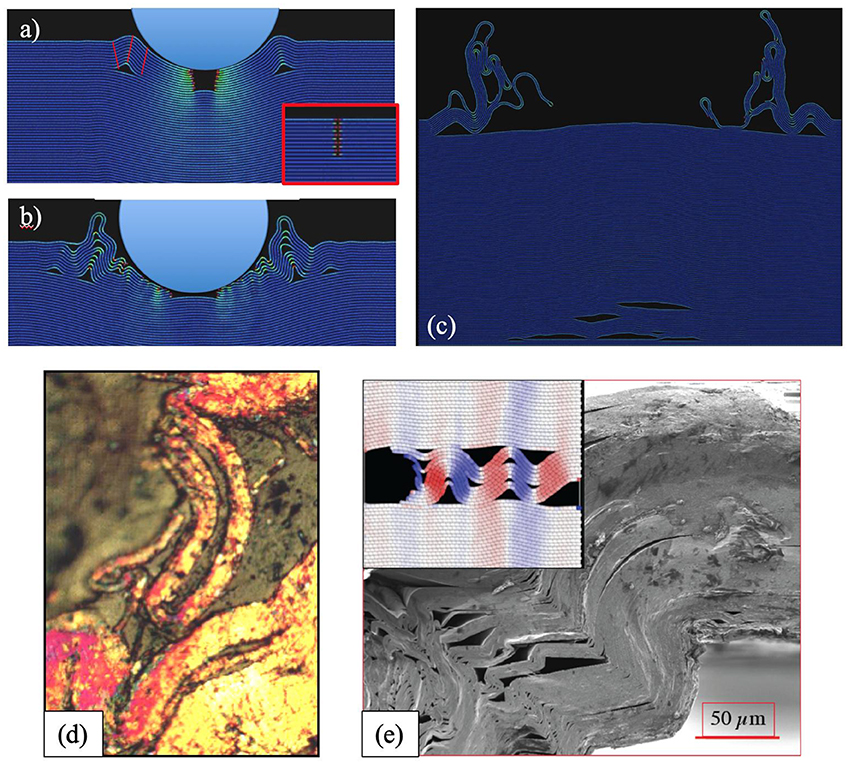
Figure 10. (a) Freeze-frames from MD simulation of graphitic basal planes loaded along [0001] with a cylindrical indenter at, (a) intermediate penetration where two kink bands—comprising three kink boundaries denoted with short red lines form on either side of the indenter. Note delaminations. Inset shows initial configuration in which the 10 topmost layers are severed before loading (Griggs et al., 2017). (b) Higher penetration and, (c) after complete unloading. Note permanent delaminations cracks near the bottom of the frame. (d) Optical microscope micrograph of a single Ti3SiC2 grain deformed at room temperature when a cube was loaded in compression (Barsoum and El-Raghy, 1999). Etching imparts the vivid colors seen; the brown background is that of the mounting epoxy. (e) SEM micrograph Cr2AlC single crystal that was deformed at high temperatures with minimal constraints. Inset shows what occurs to graphite layers that were compressed with no side constraints, i.e., by allowing layers to move freely in vertical direction (Barsoum et al., 2019). (a–c) Reproduced with permission from Acta Materialia, Elsevier. (d) Reproduced with permission from Metallurgical and Mater. Trans. A, Springer Nature.
Summary and Conclusions
The atomic planes in crystalline solids, like other layered systems or formations, buckle when loaded in compression. The micromechanism responsible for the buckling is a ripplocation. Ripplocations in graphite are attracted to vacancies and to each other, regardless of their polarity. They are also quite mobile even at 10 K in graphite. When a few layers of graphite are loaded with a cylindrical indenter, the response is initially linear elastic. At a critical buckling stress, multiple ripplocation boundaries, RBs, are nucleated. Once nucleated, these RBs—whose width or breadth is equal to that of the indenter used—very rapidly propagate, wave-like, away from under indenter and result in standing waves, the crests of which we labeled RBs.
It is the to-and-fro motion of RBs and the concomitant friction that is responsible for the dissipated energies when layered solids are cycled. The elastic energy stored in the crests of the RBs and surrounding matrices is responsible for the near full reversibility or recoverability of the process.
Lastly, Figure 11, reproduces the RBs that form when playing cards, thin steel sheets and graphite single crystals are loaded edge on. No micron markers are shown to emphasize the self-similarities of these features that span ≈ 9 orders of magnitude in scale. The existence of bulk ripplocations and ripplocation boundaries, will require a revisiting and reassessment of our understanding of how layered crystalline solids deform.
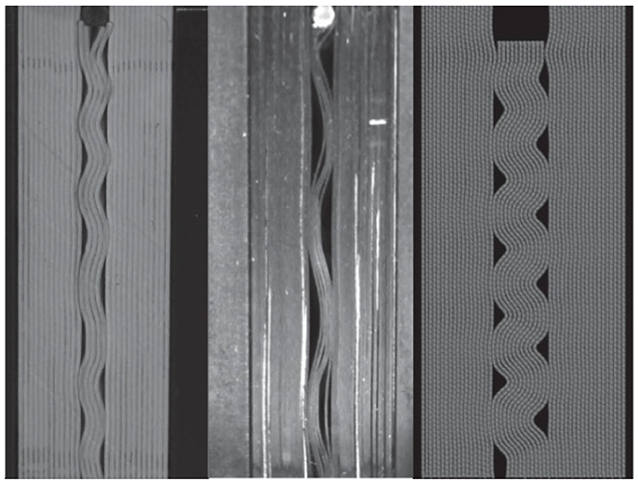
Figure 11. Snapshots of RBs formed when a cylindrical indenter is loaded edge-on into plastic cards (left), thin steel plates (middle), and graphite (right). The latter is a result of a MD simulation. The scales are intentionally not shown.
Author Contributions
The author confirms being the sole contributor of this work and has approved it for publication.
Funding
CMMI division of NSF funded this work (grant number 1728041). The budget did not include publication fees.
Conflict of Interest
The author declares that the research was conducted in the absence of any commercial or financial relationships that could be construed as a potential conflict of interest.
Acknowledgments
This work would not have been possible without my colleagues, G. Tucker and L. Lamberson, who are now at the Colorado School of Mines, CO, who developed the MD simulations of graphite and the mechanics model, respectively. Without their crucial contributions to the problem our understanding of ripplocations would not have come as far as it has in a relatively short time. This work was funded by CMMI division of NSR, Grant No. 1728041.
References
Alaferdov, A. V., Savu, R., Canesqui, M. A., Kopelevich, Y. V., da Silva, R. R., Rozhkova, N. N., et al. (2018). Ripplocation in graphite nanoplatelets during sonication assisted liquid phase exfoliation. Carbon 129, 826–829. doi: 10.1016/j.carbon.2017.12.100
Anasori, B., Sickafus, K. E., Usov, I. O., and Barsoum, M. W. (2011). Spherical nanoindentation study of effect of ion irradiation on deformation micromechanism of LiTaO3 single crystals. J. Appl. Phys. 110:023516. doi: 10.1063/1.3608158
Aslin, J., Mariani, E., Dawson, K., and Barsoum, M. W. (2019). Ripplocations provide a new mechanism for the deformation of phyllosilicates in the lithosphere. Nat. Comm. 10:686. doi: 10.1038/s41467-019-08587-2
Asthana, A., Matsui, Y., Yasuda, M., Kimoto, K., Iwata, T., and Ohshima, K. (2005). Investigations on the structural disordering of neutron-irradiated highly oriented pyrolytic graphite by X-ray diffraction and electron microscopy. J. Appl. Crystallogr. 38, 361–367. doi: 10.1107/S0021889805004292
Badr, H., Zhao, X., Koumlis, S., Tucker, G., Lamberson, L., and Barsoum, M. W. (2020). Effect of Constraining Load and Thicknesses of Thin Steel Sheets on Their Ripplocation Mechanics. Sub. for pub.
Barcelo, F., Doriot, S., Cozzika, T., Le Flem, M., Béchade, J.-L., Radovic, M., et al. (2010). Electron-backscattered diffraction and transmission electron microscopy microstructural study of post-creep Ti3SiC2. J. Alloy Compds. 488, 181–189. doi: 10.1016/j.jallcom.2009.08.073
Barsoum, M. W., and El-Raghy, T. (1999). Room temperature ductile carbides. Metallurg. Mater. Trans. 30A, 363–369. doi: 10.1007/s11661-999-0325-0
Barsoum, M. W., Farber, L., El-Raghy, T., and Levin, I. (1999). Dislocations, kink bands and room temperature plasticity of Ti3SiC2. Met. Mater. Trans. 30A, 1727–1738 doi: 10.1007/s11661-999-0172-z
Barsoum, M. W., Murugaiah, A., Kalidindi, S. R., and Gogotsi, Y. (2004). Kink bands, nonlinear elasticity and nanoindentations in graphite. Carbon 42, 1435–1445. doi: 10.1016/j.carbon.2003.12.090
Barsoum, M. W., Zhao, X., Shanazarov, S., Romanchuk, A., Koumlis, S., Pagano, S. J., et al. (2019). Ripplocations: a universal deformation mechanism in layered solids. PR Mater. 3:013602. doi: 10.1103/PhysRevMaterials.3.013602
Barsoum, M. W., Zhen, T., Kalidindi, S. R., Radovic, M., and Murugahiah, A. (2003). Fully reversible, dislocation-based compressive deformation of Ti3SiC2 to 1 GPa. Nat. Mater. 2, 107–111. doi: 10.1038/nmat814
Barsoum, M. W., Zhen, T., Zhou, A., Basu, S., and Kalidindi, S. (2005). Microscale modeling of kinking nonlinear elastic solids. Phys. Rev. B. 71:134101. doi: 10.1103/PhysRevB.71.134101
Basu, S., and Barsoum, M. W. (2007). Deformation micromechanisms of ZnO single crystals as determined from spherical nanoindentation stress-strain curves. J. Mater. Res. 22, 2470–2477. doi: 10.1557/jmr.2007.0305
Basu, S., and Barsoum, M. W. (2009). On spherical nanoindentations, kinking nonlinear elasticity of mica single crystals and their geological implications. J. Struct. Geology 31 791–801. doi: 10.1016/j.jsg.2009.05.008
Basu, S., Barsoum, M. W., and Kalidindi, S. R. (2006a). Sapphire: a kinking nonlinear elastic solid. J. Appl. Phys. 99:063501. doi: 10.1063/1.2179974
Basu, S., Moseson, A., and Barsoum, M. W. (2006b). On the determination of indentation stress-strain curves using spherical indenters. J. Mater. Res. 21, 2628–2637. doi: 10.1557/jmr.2006.0324
Basu, S., Zhou, A. G., and Barsoum, M. W. (2008). Reversible dislocation motion under contact loading in LiNbO3 single crystal. J. Mater. Res. 23, 1334–1338. doi: 10.1557/JMR.2008.0150
Bell, I. A., and Wilson, C. J. (1981). Deformation of Biotite and Muscovite - TEM microstructure and Deformation Model Tectophysics 78, 201–228. doi: 10.1016/0040-1951(81)90014-7
Bell, I. A., Wilson, C. J. L., McLaren, A. C., and Etheridge, M. A. (1986). Kinks in mica: role of dislocations and (001) cleavage. Tectonophys 127, 49–65. doi: 10.1016/0040-1951(86)90078-8
Biot, M. A. (1964). Theory of internal buckling of a confined multilayered structure. Geolog. Soc. Am. Bull. 75, 563–568. doi: 10.1130/0016-7606(1964)75[563:TOIBOA]2.0.CO;2
Biot, M. A. (1965). Further development of the theory of internal buckling of multilayers. Geolg. Soc. Amer. Bull. 76, 833–840. doi: 10.1130/0016-7606(1965)76[833:FDOTTO]2.0.CO;2
Budd, C. J., Edmunds, R., and Hunt, G. W. (2003). Nonlinear model for parallel folding with friction. Proc. Royal Soc. London. Seri. A, 459, 2097–2119. doi: 10.1098/rspa.2003.1139
Budiansky, B., Fleck, N. A., and Amazigo, J. C. (1998). On kink-band propagation in fibre composites. J. Mech. Phys. Solids 46, 1637–1653. doi: 10.1016/S0022-5096(97)00042-2
Christoffersen, R., and Kronenberg, A. K. (1993). Dislocation interactions in experimentally deformed biotite. J. Struc. Geolg. 15:1077. doi: 10.1016/0191-8141(93)90157-6
David, E. C., Brantut, N., Schubnel, A., and Zimmerman, R. W. (2012). Sliding crack model for nonlinearity and hysteresis in the uniaxial stress-strain curve of rock. I. J. Rock Mechan. Mining. Scien. 52, 9–17. doi: 10.1016/j.ijrmms.2012.02.001
Eapen, J., Krishna, R., Burchell, T. D., and Murty, K. L. (2014). Early damage mechanisms in nuclear grade graphite under irradiation. Mater. Res. Lett. 2, 43–50. doi: 10.1080/21663831.2013.841782
Edmunds, R., Hicks, B. J., and Mullineux, G. (2010). Drawing parallels: modelling geological phenomena using constraint satisfaction. J. Struct. Geol. 32, 997–1008. doi: 10.1016/j.jsg.2010.06.005
Edmunds, R., Hunt, G. W., and Wadee, M. A. (2006). Parallel folding in multilayered structures. J. Mech. Phys. Solids 54, 384–400. doi: 10.1016/j.jmps.2005.08.013
El-Raghy, T., Zavaliangos, A., Barsoum, M. W., and Kalidindi, S. R. (1997). Damage mechanisms around hardness indentations in Ti3SiC2. J. Amer. Cer. Soc. 80, 513–516. doi: 10.1111/j.1151-2916.1997.tb02861.x
Frank, F. C., and Stroh, A. N. (1952). On the theory of kinking. Proc. Phys. Soc. 65, 811–821. doi: 10.1088/0370-1301/65/10/311
Frieberg, D., Barsoum, M. W., and Tucker, G. (2018). On the nucleation of bulk ripplocations in graphite. PRMaterials 2:053602. doi: 10.1103/PhysRevMaterials.2.053602
Gilbert, C. J., Bloyer, D. R., Barsoum, M. W., El-Raghy, T., Tomasia, A. P., and Ritchie, R. O. (2000). Fatigue-crack growth and fracture properties of coarse and fine-grained Ti3SiC2. Scripa Materialia 42, 761–767. doi: 10.1016/S1359-6462(99)00427-3
Gilman, J. J. (1954). Mechanism of ortho kink-band formation in compressed zinc monocrystals. Trans. AIME 200, 621–629. doi: 10.1007/BF03398884
Griggs, J. (2016). Investigation of the Reversible Hysteresis Effect in Hexagonal Metal Single Crystals and the MAX Phases. Drexel University.
Griggs, J., Lang, A., Gruber, J., Tucker, G., Taheri, M., and Barsoum, M. W. (2017). Spherical nanoindentation and transmission electron microscopy evidence for ripplocations in Ti3SiC2. Acta Mater. 131, 141–155. doi: 10.1016/j.actamat.2017.03.055
Gruber, J., Barsoum, M. W., and Tucker, G. J. (2020). Characterization of ripplocation mobility in graphite. Mater. Res. Letts. 8, 82–87. doi: 10.1080/21663831.2019.1702115
Gruber, J., Lang, A., Griggs, J., Taheri, M., Tucker, G., and Barsoum, M. W. (2016). Evidence for bulk ripplocations in layered solids. Sci. Rep. 6:33451. doi: 10.1038/srep33451
Hess, J. B., and Barrett, C. S. (1949). Structure and nature of kink bands in zinc. Trans. AIME 185, 599–606. doi: 10.1007/BF03398902
Hu, C., Sakka, Y., Grasso, S., Nishimura, T., Guo, S., and Tanaka, H. (2011). Shell-like nanolayered Nb4AlC3 ceramic with high strength and toughness. Scripta Mater. 64, 765–768. doi: 10.1016/j.scriptamat.2010.12.045
Hunt, G., Butler, R., and Budd, C. (2012). Geometry and mechanics of layered structures and materials (Theme Issue). Phil. Trans. R. Soc. A 370, 1723–1729. doi: 10.1098/rsta.2011.0539
Jillson, D. C. (1950). An experimental survy of deformation and annealing processes in zinc. Trans. AIME 188, 1009–1018. doi: 10.1007/BF03399099
Kabiri, Y., Schrenker, N., Julian Müller Mirza Mačkov, C., and Spiecker, E. (2017). Direct observation of dislocation formation and plastic anisotropy in Nb2AlC MAX phase using in situ nanomechanics in transmission electron microscopy. Scrip. Mater. 137, 104–108. doi: 10.1016/j.scriptamat.2017.04.015
Kooi, B. J., Poppen, R. J., Carvalho, N. J. M., and Barsoum, M. W. (2003). Ti3SiC2: a damage tolerant ceramic studied with nanoindentations and transmission electron microscopy. Acta Mater. 51, 2859–2872. doi: 10.1016/S1359-6454(03)00091-0
Kronenberg, A., Kirby, S., and Pinkston, J. (1990). Basal slip and mechanical anisotropy in biotite. J. Geophys. Res. 95:257. doi: 10.1029/JB095iB12p19257
Kushima, A., Qian, X., Zhao, P., Zhang, S., and Li, J. (2015). Ripplocations in van der Waals Layers. Nano Letters 15, 1302–1308. doi: 10.1021/nl5045082
Mares, V. M., and Kronenberg, A. K. (1993). Experimental deformation of muscovite. J. Struct. Geol. 15, 1061–1075. doi: 10.1016/0191-8141(93)90156-5
Meike, A. (1989). in situ deformation of micas: a high-voltage electron-microscope study. Am. Mineral 74:780.
Molina-Aldareguia, J. M., Emmerlich, J., Palmquist, J., Jansson, U., and Hultman, L. (2003). Kink formation around indents in laminated Ti3SiC2 thin-films studied in the nano scale. Scripta Mater. 49, 155–160. doi: 10.1016/S1359-6462(03)00214-8
Moseson, A. J., Basu, S., and Barsoum, M. W. (2008). Determination of the effective zero point of contact for spherical nanoindentation. J. Mater. Res. 23, 204–209. doi: 10.1557/JMR.2008.0012
Murugaiah, A., Barsoum, M. W., Kalidindi, S. R., and Zhen, T. (2004). Spherical Nanoindentations in Ti3SiC2. J. Mater. Res. 19, 1139–1148. doi: 10.1557/JMR.2004.0148
Muto, S., and Tanabe, T. (1999). Fragmentation of graphite crystals by electron irradiation at elevated temperatures. J. Electron Micros. 48, 519–523. doi: 10.1093/oxfordjournals.jmicro.a023710
Narayanan, S., and Schadler, L. S. (1999). Mechanisms of kink-band formation in graphite/epoxy composites: a micromechanical experimental study. Composites Sci. Tech. 59, 2201–2213. doi: 10.1016/S0266-3538(99)00074-3
Radovic, M., Barsoum, M. W., El-Raghy, T., Seidensticker, J., and Wiederhorn, S. M. (2000). Tensile properties of Ti3SiC2 in the 25-1300C temperature range. Acta Mater. 48:453. doi: 10.1016/S1359-6454(99)00351-1
Savin, A. V., Korznikova, E. A., and Dmitriev, S. V. (2019). Dynamics of surface graphene ripplocations on a flat graphite substrate. Phys. Rev. B 99:235411. doi: 10.1103/PhysRevB.99.235411
Shamma, M., Caspi, E., Anasori, B., Clausen, B., Brown, D., Vogel, S., et al. (2015). in situ neutron diffraction evidence for fully reversible dislocation motion in highly textured polycrystalline Ti2AlC samples. Acta Mater. 98, 51–63. doi: 10.1016/j.actamat.2015.07.023
Sun, Z.-M., Murugaiah, A., Zhen, T., Zhou, A., and Barsoum, M. W. (2005). Microstructure and mechanical properties of porous Ti3SiC2. Acta Mater. 53, 4359–4366. doi: 10.1016/j.actamat.2005.05.034
Tallman, D. J., He, L., Gan, J., Caspi, E., Hoffman, E. N., and Barsoum, M. W. (2017). Effects of neutron irradiation of Ti3SiC2 and Ti3AlC2 in the 121-1085 °C temperature range. J. Nucl. Mater. 484, 120–134. doi: 10.1016/j.jnucmat.2016.11.016
Wadee, M. A., and Edmunds, R. (2005). Kink band propagation in layered structures. J. Mech. Phys. Solids 53, 2017–2035. doi: 10.1016/j.jmps.2005.04.005
Wadee, M. A., Hunt, G. W., and Peletier, M. A. (2004). Kink band instability in layered structures. J. Mech. Phys. Solids 52, 1071–1091. doi: 10.1016/j.jmps.2003.09.026
Walsh, J. B. (1965). The effect of cracks on the uniaxial compression of rock. J. Geophys. Res. 70:399. doi: 10.1029/JZ070i002p00399
Zhen, T., Barsoum, M. W., and Kalidindi, S. R. (2005a). Effects of temperature, strain rate and grain size on the compressive properties of Ti3SiC2. Acta Mat. 53, 4163–4171. doi: 10.1016/j.actamat.2005.05.020
Zhen, T., Barsoum, M. W., Kalidindi, S. R., Radovic, M., Sun, Z. M., and El-Raghy, T. (2005b). Compressive creep of fine and coarse-grained T3SiC2 in air in the 1100 to 1300°C temperature range. Acta Mater. 53, 4963–4973. doi: 10.1016/j.actamat.2005.05.037
Zhou, A. G., Barsoum, M. W., Basu, S., Kalidindi, S. R., and El-Raghy, T. (2006). Incipient and regular kink bands in dense and 10 vol.% porous Ti2AlC. Acta Mat. 54:1631e1639. doi: 10.1016/j.actamat.2005.11.035
Keywords: buckling, layered solids, ripplocations, non-linear elastic deformations, kink bands
Citation: Barsoum MW (2020) Ripplocations: A Progress Report. Front. Mater. 7:146. doi: 10.3389/fmats.2020.00146
Received: 11 December 2019; Accepted: 24 April 2020;
Published: 21 May 2020.
Edited by:
Giles Hunt, University of Bath, United KingdomReviewed by:
M. Ahmer Wadee, Imperial College London, United KingdomFrancesco Dal Corso, University of Trento, Italy
Copyright © 2020 Barsoum. This is an open-access article distributed under the terms of the Creative Commons Attribution License (CC BY). The use, distribution or reproduction in other forums is permitted, provided the original author(s) and the copyright owner(s) are credited and that the original publication in this journal is cited, in accordance with accepted academic practice. No use, distribution or reproduction is permitted which does not comply with these terms.
*Correspondence: Michel W. Barsoum, YmFyc291bXdAZHJleGVsLmVkdQ==