
95% of researchers rate our articles as excellent or good
Learn more about the work of our research integrity team to safeguard the quality of each article we publish.
Find out more
ORIGINAL RESEARCH article
Front. Mater. , 19 May 2020
Sec. Ceramics and Glass
Volume 7 - 2020 | https://doi.org/10.3389/fmats.2020.00140
This article is part of the Research Topic Advanced Electroceramics for Energy Conversion and Storage View all 9 articles
(1-x)K0.4Na0.6NbO3–xBiFeO3 lead-free piezoelectric ceramics were successfully prepared in a single perovskite phase using the conventional solid-state synthesis. Relative permittivity (εr) as a function of temperature indicated that small additions of BiFeO3 not only broadened and lowered the cubic to tetragonal phase transition (TC) but also shifted the tetragonal to orthorhombic phase transition (TO–T) toward room temperature (RT). Ceramics with x = 1 mol.% showed optimum properties with small and large signal piezoelectric coefficient, d33 = 182 pC/N and d∗33 = 250 pm/V, respectively, electromechanical coupling coefficient, kp = 50%, and TC = 355°C. kp varied by ∼5% from RT to 90°C, while d∗33 showed a variation of ∼15% from RT to 75°C, indicating that piezoelectric properties were stable with temperature in the orthorhombic phase field. However, above the onset of TO–T, the properties monotonically degraded in the tetragonal phase field as TC was approached.
Piezoelectric materials are essential in many applications and used in different electronic circuits as a sensor, actuator, or a transducer (Holterman and Groen, 2013). Commercial piezoelectric materials contain about 60% of PbO by weight. The toxicity of lead is well documented and legislation against its use are becoming more stricter with time, which has increased interest in lead–free alternatives for piezoelectric applications (Rödel et al., 2015). Amongst the potentially useful lead-free piezoelectrics, only Ca2+ and Zr4+ modified BaTiO3 and (Na,K)NbO3-based ceramics have low coercive fields similar to lead zirconate titanate (PZT). However, BaTiO3-based piezoelectric ceramics generally exhibit a low Curie temperature (TC < 100°C), making them unsuitable for high temperature piezoelectric applications (Liu and Ren, 2009). (K,Na)NbO3 has a high Curie temperature of >350°C and capable of operating at low drive fields. Compositional engineering of K1–xNaxNbO3 is usually carried out around x = 0.5, i.e., part of the phase diagram where several various polymorphs have similar free energies. On cooling ceramics with x = 0.5, the crystal structure successively changes from cubic to tetragonal, tetragonal to orthorhombic, and orthorhombic to rhombohedral. Almost all compositions with large piezoelectric (d33) and coupling coefficients (kp) are optimized by substituents/dopants that shift the orthorhombic-tetragonal transition (TO–T) toward room temperature (RT; Wu et al., 2015; Hussain et al., 2019). Recently new phase boundaries have been constructed in (K,Na)NbO3 based ceramics by simultaneously moving the rhombohedral and tetragonal phases toward RT. Such a coexistence of rhombohedral-orthorhombic-tetragonal phase boundaries has been very successful in improving the d33 values and have significantly improved the temperature stability in these ceramics (Tao et al., 2019; Lv et al., 2020; Zheng et al., 2020). Although ceramics with x = 0.5 are most commonly investigated, piezoelectric properties are optimized in K1–xNaxNbO3 for 0.4 ≤ x ≤ 0.6. The piezoelectric properties are similar throughout this compositional range but for compositions with x = 0.6 (Na+ rich) have lower TO–T in comparison to x = 0.5 (Wu et al., 2008; Tellier et al., 2009).
BiFeO3 is one of the most extensively investigated perovskite compounds because of its RT multiferroic properties (Khesro et al., 2016). It is rarely, however, (Sun et al., 2008; Zuo et al., 2008) investigated in solid solution with (K,Na)NbO3. BiFeO3 could be an interesting choice for solid solution with KNN because of its relatively low melting point. Its ability to form a liquid phase can help in densification of KNN based ceramics (Na et al., 2011) in addition to the possibility of forming a phase boundary at RT.
Since, BiFeO3 was expected to have only limited solid solubility (Jiang et al., 2010), K0.4Na0.6NbO3 was chosen to increase the prospect of bringing the TO–T closer to RT. Moreover, K+ rich compositions are prone to volatilization and are thus more difficult to process with precise stoichiometry (Wang et al., 2016). Therefore, in the present study, the dielectric, ferroelectric and piezoelectric properties of the solid solution (1-x)K0.4Na0.6NbO3–xBiFeO3 are studied. In situ measurements of the piezoelectricity were performed to verify the temperature stability of these ceramics.
(1-x)K0.4Na0.6NbO3–xBiFeO3 for x = (0, 0.5, 0.75, 1, 1.25, 1.5, 2, and 3) mol.% ceramics were prepared via a mixed oxide solid state route using K2CO3, Na2CO3, Bi2O3, Fe2O3, and Nb2O5 raw materials. K2CO3 and Na2CO3 were dried at 300°C, Bi2O3, and Fe2O3 were dried at 500°C and Nb2O5 was dried at 900°C. Raw materials were weighed according to the molar ratios of the compositions and mixed/milled for 1 h in an attrition mill using 3 mm diameter yttria-stabilized zirconia media in isopropanol. Powders were dried in an oven at 80°C, sieved, and calcined in a covered alumina crucible at 850°C for 6 h. The calcined powders were remilled, dried and sieved. Polyvinyl alcohol (PVA) binder solution was added and the powders were pressed into 10 mm diameter pellets using a uniaxial pellet press. After binder burnt out at 550°C, pellets were sintered in the temperature range 1100 to 1140°C for 6 h, at a heating/cooling rate of 5°/min. Densities of the sintered pellets were measured using Mettler Toledo model MS104S digital densitometer.
Ceramics with x = 0.5, 0.75, and 1 mol.% showed a relative density >94% while the remaining samples ranged between 88–90%. Phase analysis of the sintered specimens was carried out using a Bruker D2-Phaser X-ray powder diffractometer (XRD). The microstructure of the samples was examined using a FEI Inspect-F scanning electron microscope (SEM). For electrical measurements, sintered samples were electroded with silver. Samples were poled at RT in silicone oil with at an applied field of 30–40 kV/cm. The small signal piezoelectric coefficient (d33) was measured using a Piezotest PM300 d33 meter. Polarization hysteresis and strain-electric field measurements were carried out using an aixACCT TF 2000 ferroelectric tester at a frequency of 1 Hz from RT to 150°C, where the displacement data was synchronously captured by a laser interferometer. Relative permittivity (εr) and tan δ data was measured from RT to 500°C using an Agilent 4184A multifrequency precision LCR meter. The planar electromechanical coupling factor (kp) was determined from the resonance and antiresonance frequencies peaks, which were measured using an Agilent 4294A impedance/gain-phase analyzer according to IEEE standards on piezoelectricity (American National Standards Institute, 1988).
Figure 1 shows RT XRD patterns of sintered (1-x)K0.4Na0.6NbO3–xBiFeO3 (x = 0–3 mol.%) ceramics. Traces were indexed according to a single perovskite phase with no secondary peaks. For K0.5Na0.5NbO3-based ceramics, the (200) doublet peak is usually considered to define the structure. For orthorhombic structure, I002/I020 = 2:1 (I = intensity; Feng et al., 2016) but for the tetragonal structure, an opposite trend is observed, having I002/I200 = 1:2 (Zhou et al., 2015). In our samples at x = 0, obvious split of the 200 peak was detected at 2θ ∼ 46° which is consistent with the orthorhombic phase frequently reported for K0.5Na0.5NbO3 ceramics (Sun et al., 2008). With increase in concentration of BiFeO3, the splitting became less apparent, coupled with a decrease in the intensity’s ratios. At x = 1.25 mol.%, the peaks merged, indicating a co-existence of tetragonal, and orthorhombic phases. At x = 1.5 mol.%, a shoulder was observed on the left-hand side of the (200) peak but without the clear splitting expected from a tetragonal structure. At x = 3 mol.%, the structure appears to be pseudocubic, showing only one broad peak which may be ascribed to nanoscale competition between tetragonal and orthorhombic phases (Bomlai et al., 2007). To confirm the phase evolution of KNN-BF, full-pattern Rietveld refinement of XRD data was conducted using a two-phase mix of orthorhombic (Bmm2), and tetragonal KMO (P4mm) as given in Figure 2. With the increase of BF content, coexistence of two phases was found at x = 1.25 mol.%, and then the fraction of tetragonal phase gradually increased and dominated as shown in Table 1.
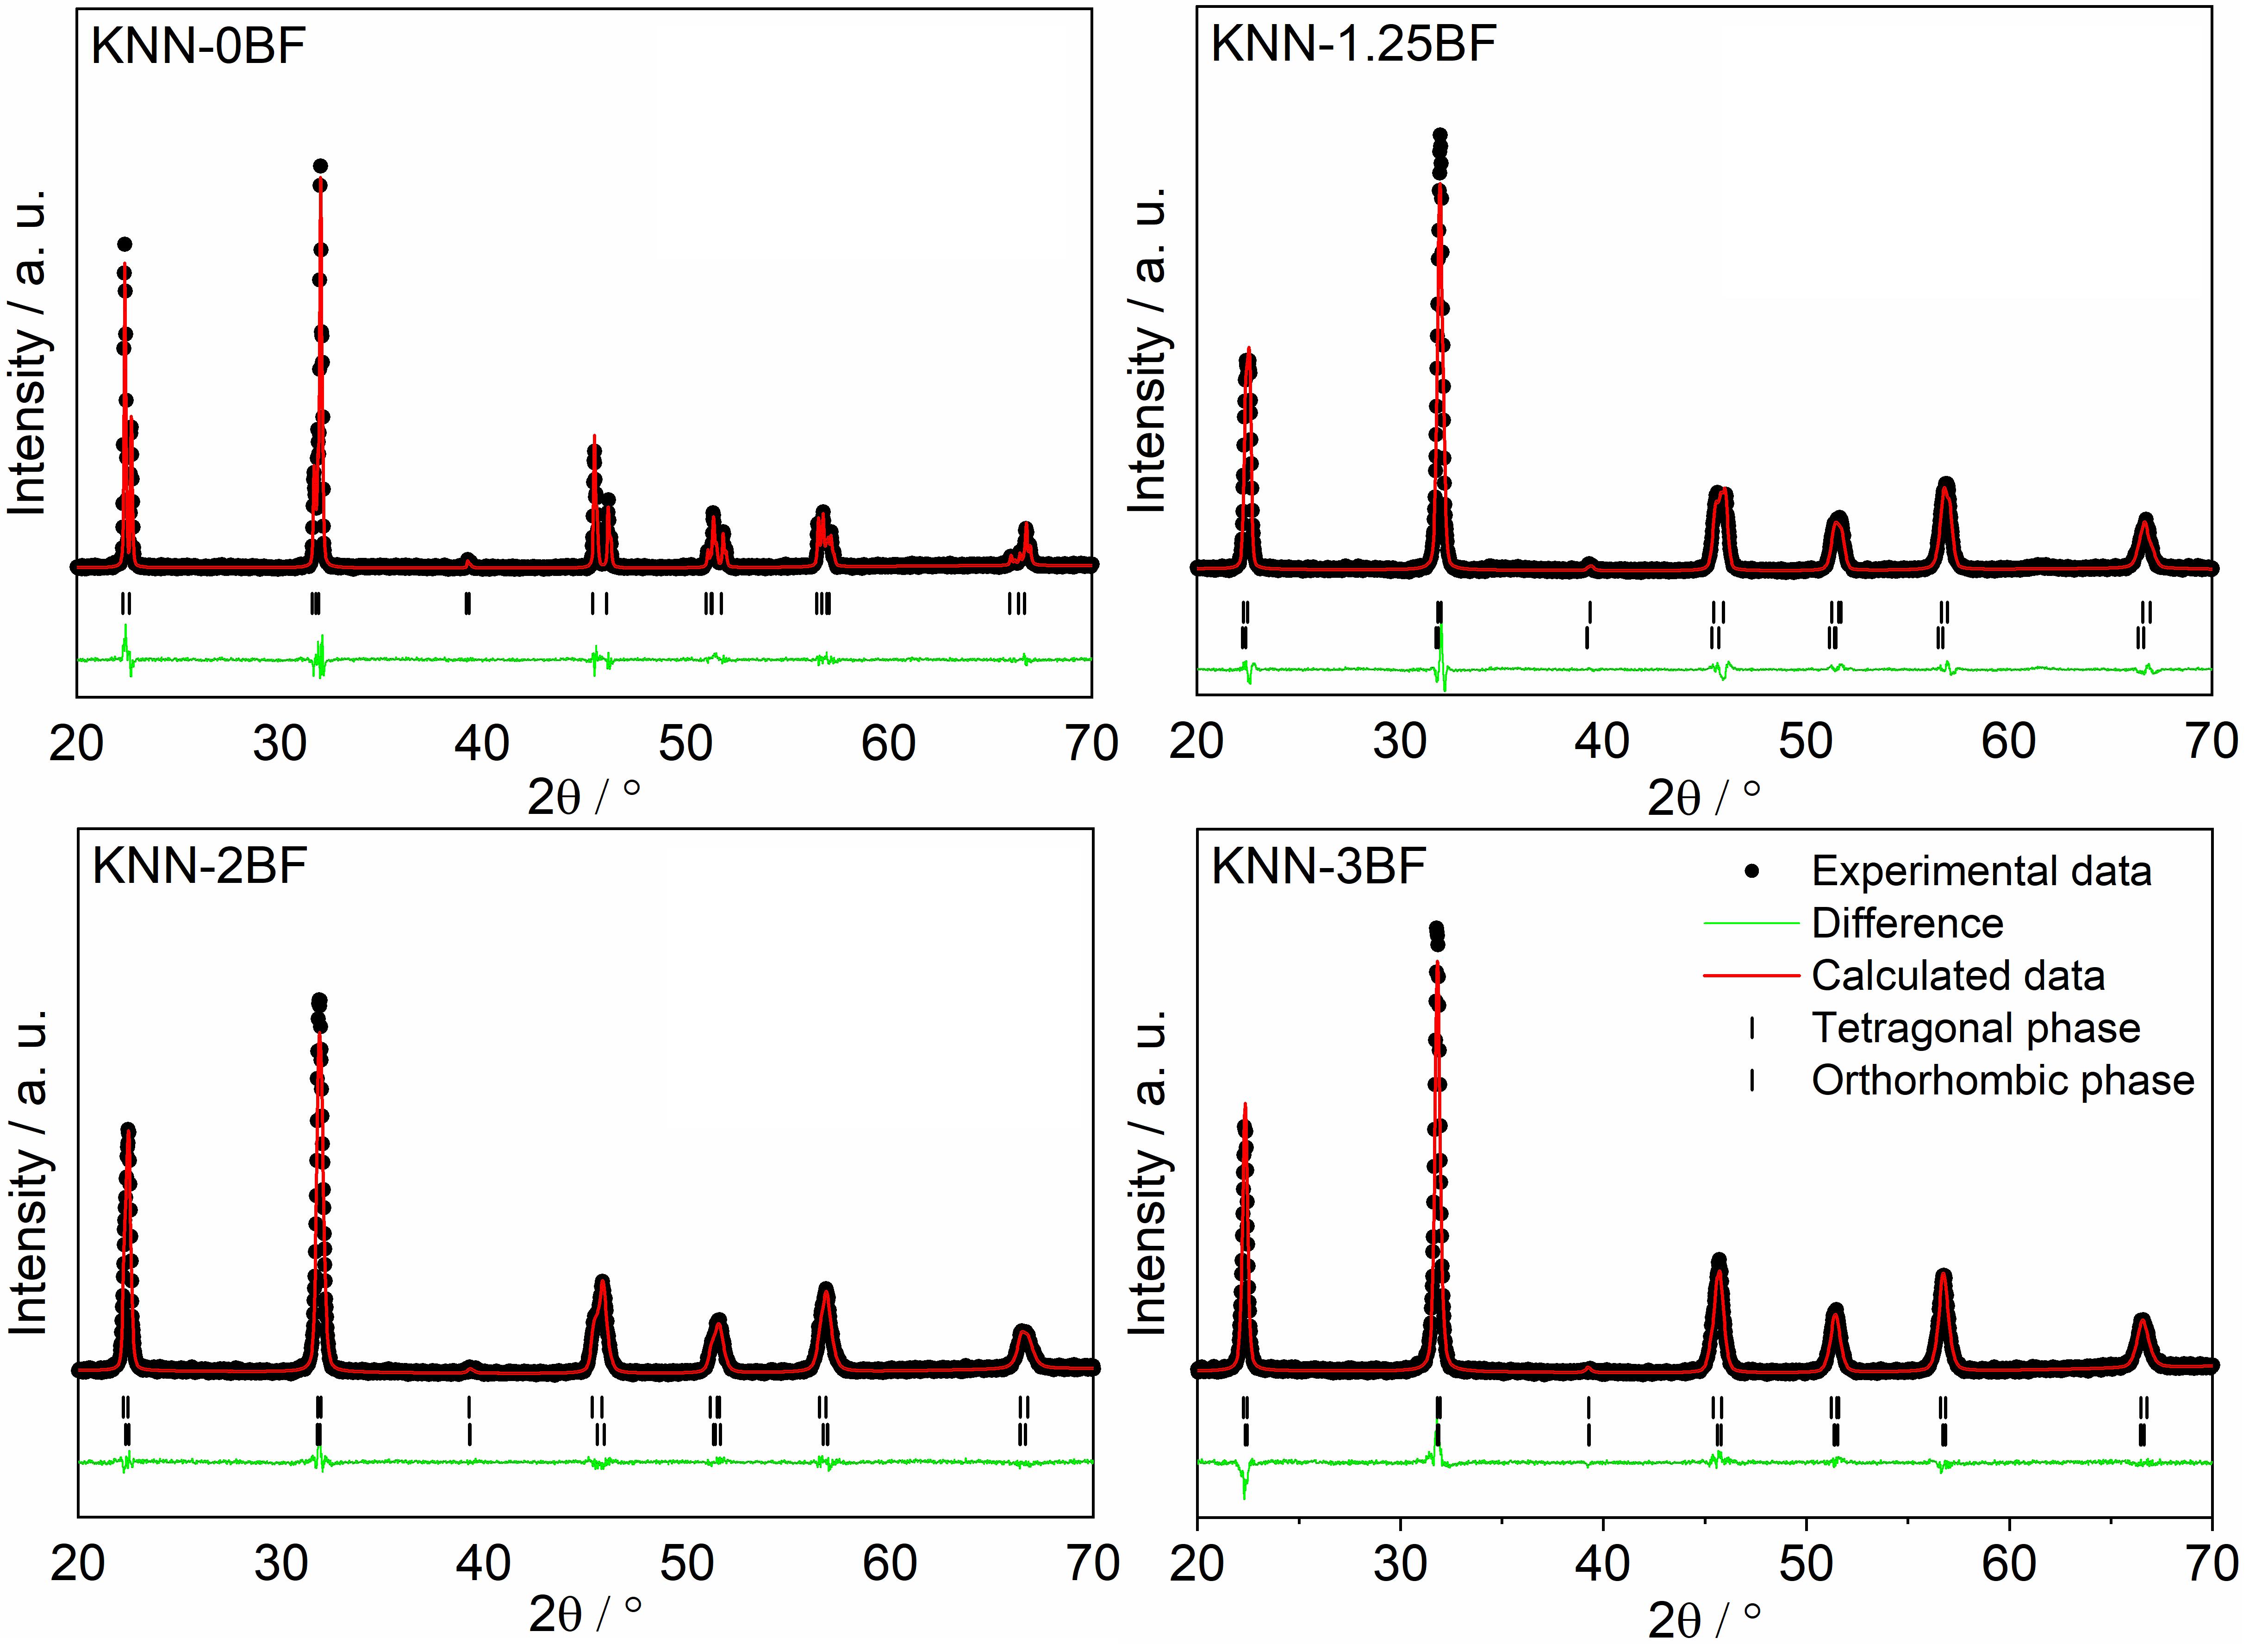
Figure 2. Rietveld refinement analysis of (1-x)K0.4Na0.6NbO3–xBiFeO3 (x = 0, 1.25, 2, and 3 mol.%) using the GSAS + EXPGUI package.
Figure 3 shows SEM micrographs of sintered (1-x)K0.4Na0.6NbO3–xBiFeO3 (x = 1–3 mol.%) ceramics which revealed that the average grain size decreases with increase in x. For samples with x = 0 and 0.5 mol.%, few grains indicated abnormal growth of (>5 μm). Such abnormal grain growth is usually associated with liquid phase sintering (Jo et al., 2006; Song et al., 2007; Han et al., 2012). Each large grain observed is believed to be the combination of many small grains which self-assemble into a larger cluster. The sintering temperature of K0.5Na0.5NbO3 is close to its melting-point and consequently it is not easy to achieve a dense ceramic without liquid phase sintering (Wang and Li, 2012). It has been reported (Zhen and Li, 2007; Kim et al., 2009) that grain size and core-shell structures in such grains influence piezoelectric properties. The BF content is affecting the sintering temperature, for larger contents of BF the conditions don’t favor formation of large cluster and the constituent grains are disintegrated, thereby showing smaller grains. This is evident from a sharp decrease at x = 0.75 mol.%. With further increase of BiFeO3 the grain size gradually decreased to ∼100–400 nm for x = 3 mol.%.
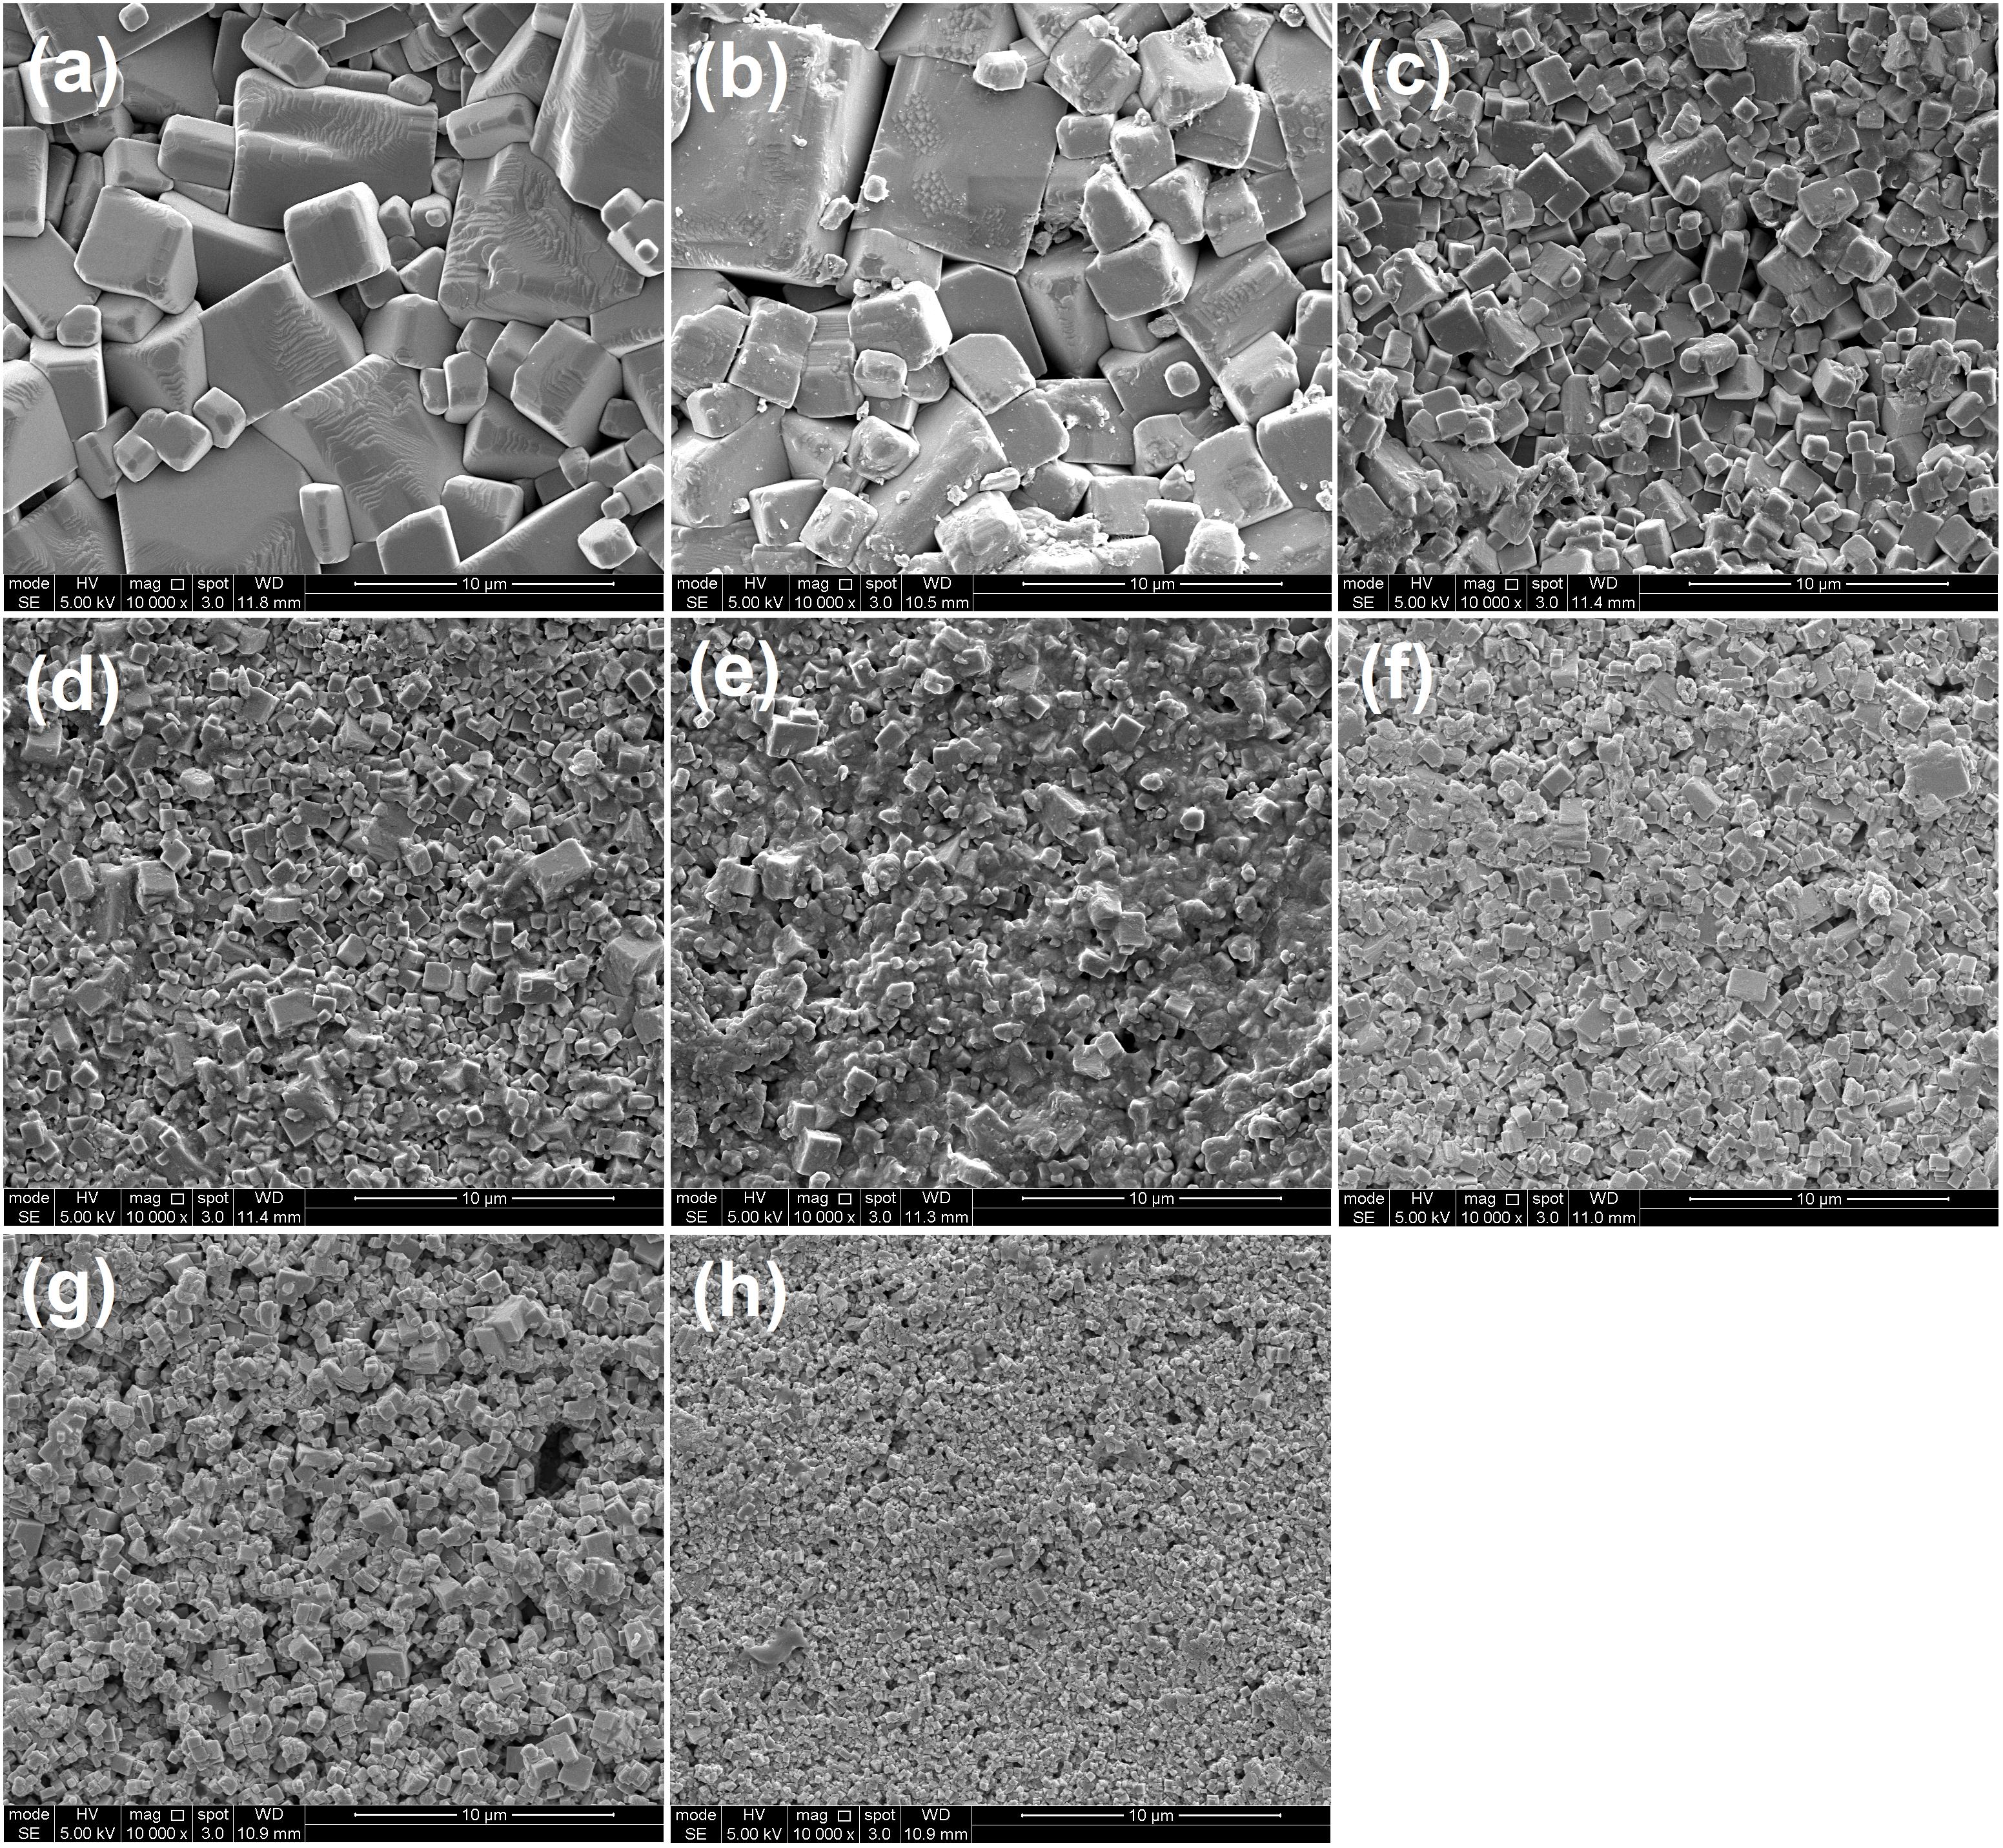
Figure 3. SEM images of as sintered (1-x)K0.4Na0.6NbO3–xBiFeO3 (x = 1–3 mol.%) ceramics. Where (a) shows x = 0; (b) shows x = 0.5 mol.%; (c) shows x = 0.75 mol.%; (d) shows x = 1 mol.%; (e) shows x = 1.25 mol.%; (f) shows x = 1.5 mol.%; (g) shows x = 2 mol.%; and (h) shows x = 3 mol.%.
εr versus temperature for all (1-x)K0.4Na0.6NbO3–xBiFeO3 compositions are shown in Figure 4. At x = 0, TO–T was observed at ∼175°C, which is lower than that for Na0.5K0.5NbO3 ceramics (i.e., ∼200°C). TO–T decreased with increasing BiFeO3 amount from ∼176°C (x = 0) to ∼107°C (x = 1 mol.%). For sample with x = 1.25 mol.%, TO–T is not sharp but diffused consistent with the overlapped peaks observed in XRD plot (Figure 1). As BiFeO3 concentration increases, no anomaly associated with the TO–T is observed. It is expected that TO–T may have been shifted below RT and/or may have smeared out because of chemical heterogeneity. It is noted that the sharp peak observed for the tetragonal to cubic transition (TC) in samples with x ≤ 1 mol. % has also broadened for x > 1 mol. %. In addition, samples with x > 1 mol. % showed smaller magnitude of εr at peak maxima which is strongly frequency dependent. Low εr is attributed to low density, but its frequency dependence is most evident in the range 1 to 10 kHz. Above 100 kHz, εr is frequency independent. Such behavior indicates contributions from space charge polarization at lower frequencies due to ion migration which relax at >1 kHz (Lingwal et al., 2006). The contribution from space charge and increased with increase in x, which may be due to vaporization of volatile species such as Bi, Na, and K ions. A similar trend was observed in the dielectric loss versus temperature where high tanδ was noticed at low frequencies. We also note that tanδ (100 kHz) is less than 5% at RT but the sample with x > 1 mol.% exhibit greater loss as a function of temperature in comparison to samples with x ≤ 1 mol.%. Higher losses at x > 1 mol.% can be attributed to low densification and/or volatility of A-site Cations. Moreover, BF itself is intrinsically very leaky and its larger contents may be resulting in higher conductions.
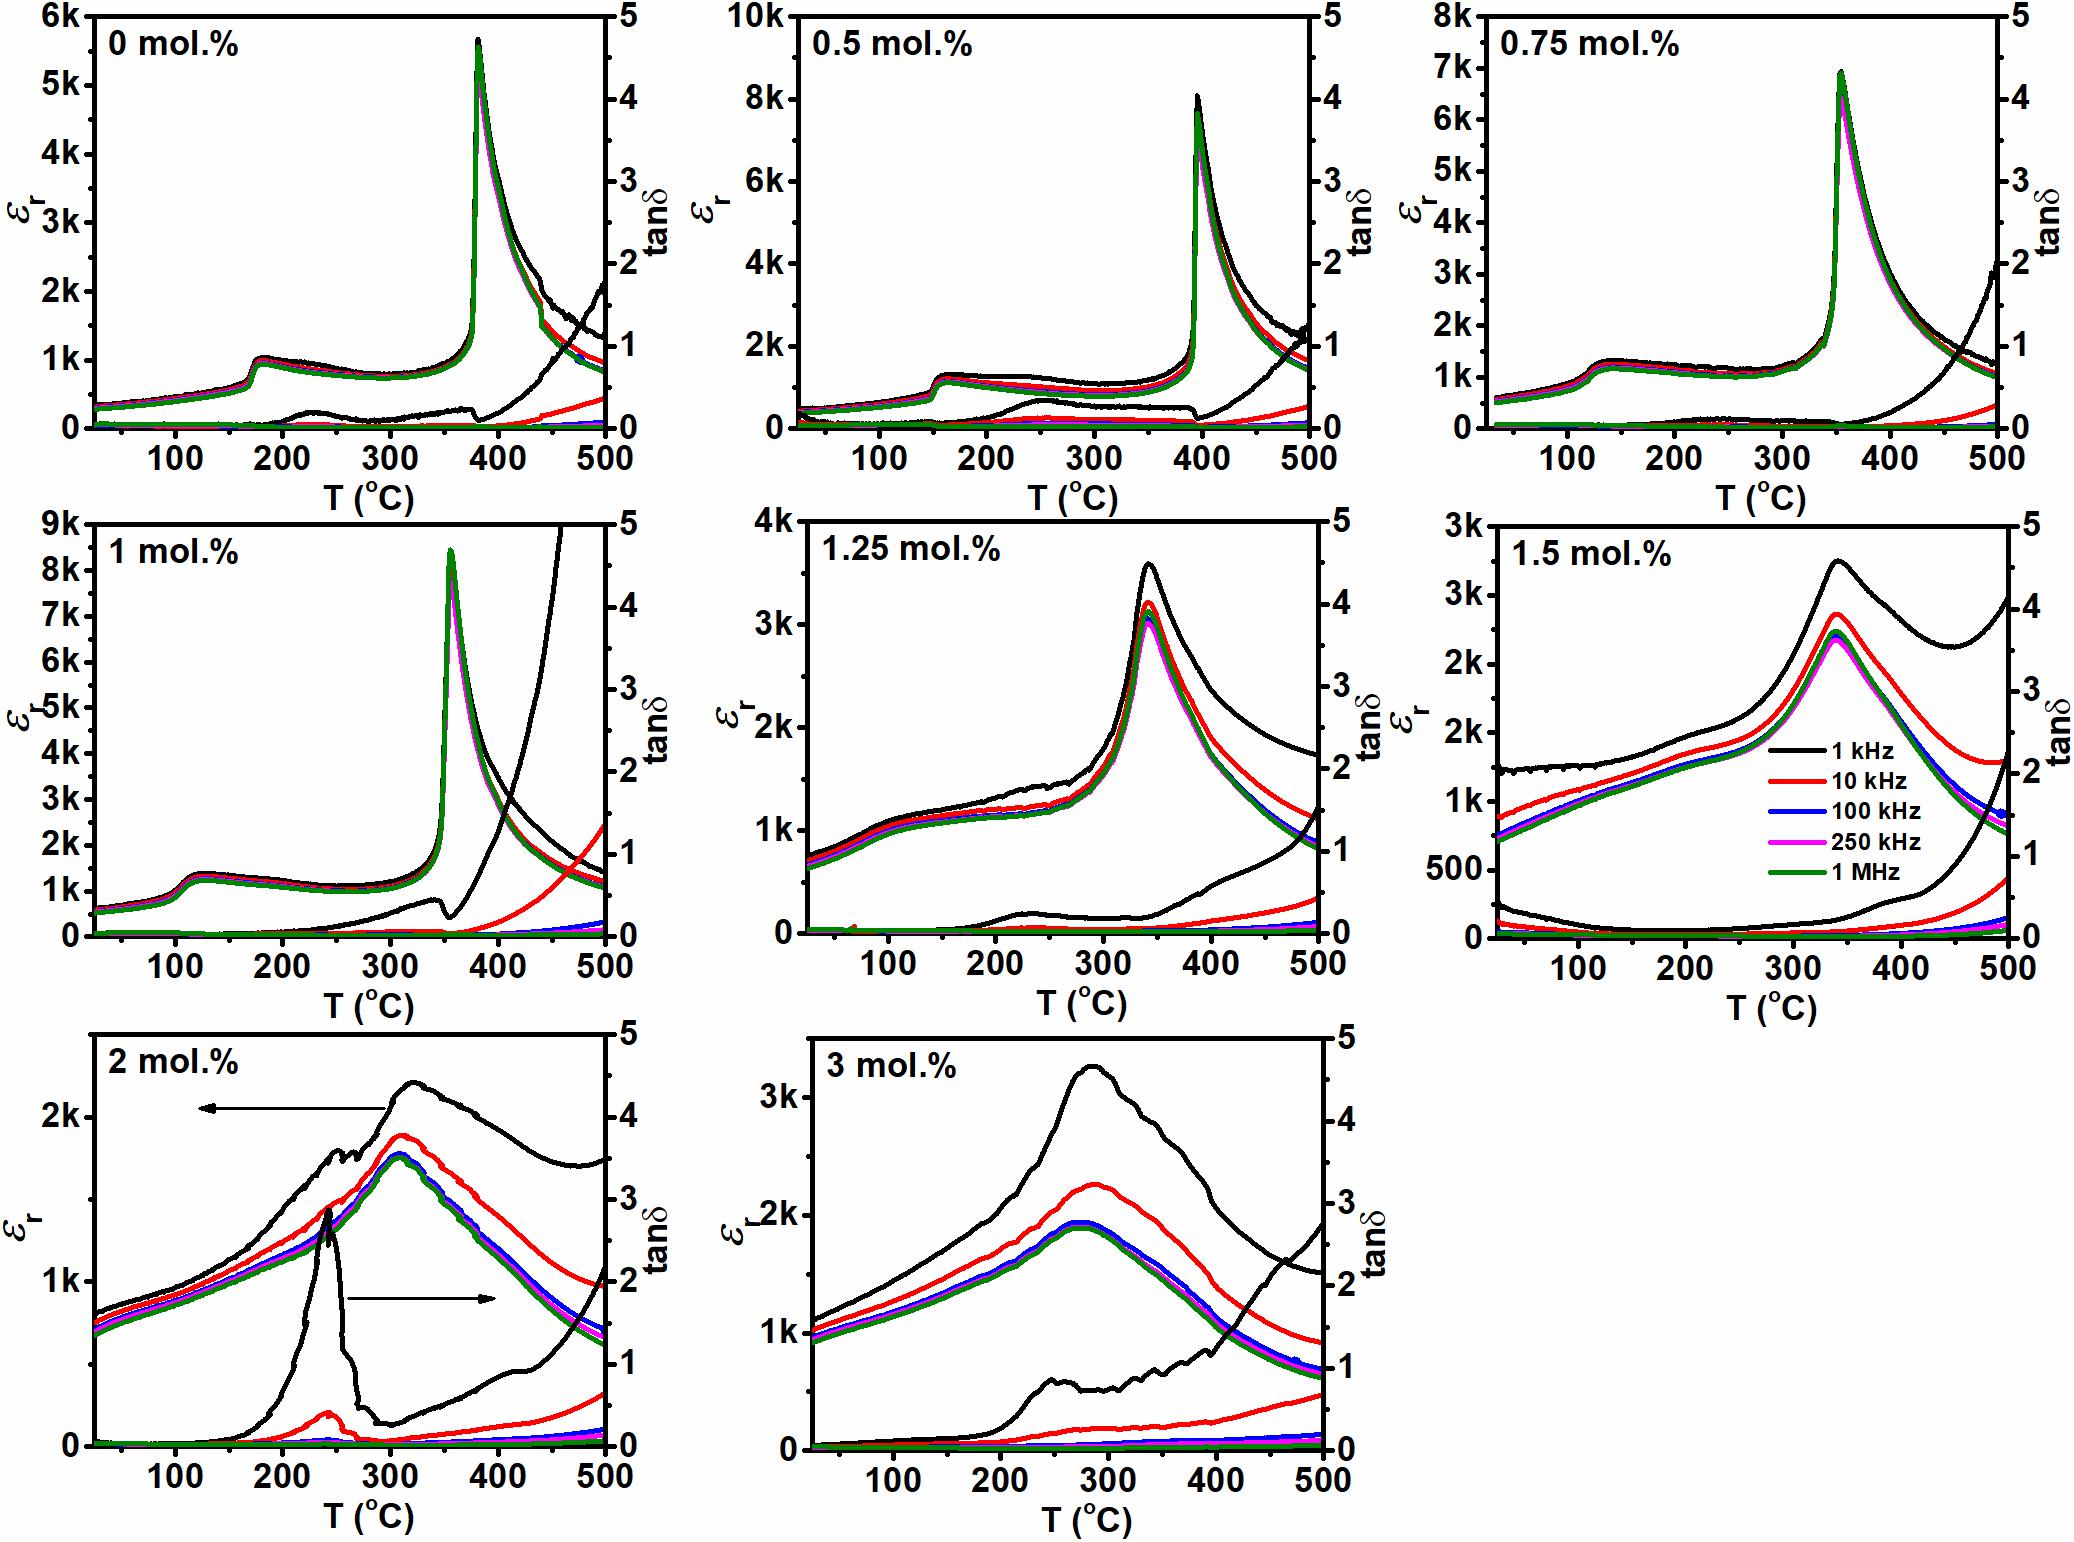
Figure 4. Relative permittivity and tan δ as a function of temperature at constant frequencies of 1, 10, 100, 250 kHz, and 1 MHz for (1-x)K0.4Na0.6NbO3–xBiFeO3 (x = 1–3 mol.%) ceramics.
Figure 5 shows d33 for (1-x)K0.4Na0.6NbO3–xBiFeO3 (x = 1–3 mol.%) ceramics after DC poling at 40 kV/mm for 5 min. At x = 0, d33 = 82 pC/N was obtained which was similar to previously reported data (Egerton and Dillon, 1959; Jaeger and Egerton, 1962). d33 increased with BiFeO3 concentration and reached a maximum of ∼182 pC/N at x = 1 mol.%. The increase in d33 may be due to a decrease in TO–T as noticed in dielectric data (Figure 4) and/or an increase of the density, whereas the sharp decrease in d33 observed for x > 1 mol.% may be correlated to the significantly lower densities, as shown in Figure 5. In addition, high electrical conductivities in these samples are responsible for low d33 values, as they inhibit poling and often result in electrical breakdown. TO–T is supposed to be at RT for x = 1.25–1.5 mol.% which should lead to higher d33 values, provided that ceramics exhibiting higher resistivities, and densities can be successfully fabricated. The higher conductivity exhibited by ceramics with x > 1 mol.% leads to rounded polarization (P) vs. electric field (E) loops, with remanent polarization (Pr) higher than maximum polarization (Pmax) which suggest high leakage current, Figure 6. Therefore, it is concluded that samples with x > 1 mol.% are unsuitable for large field measurements without further processing efforts to increase density and increase resistivity.
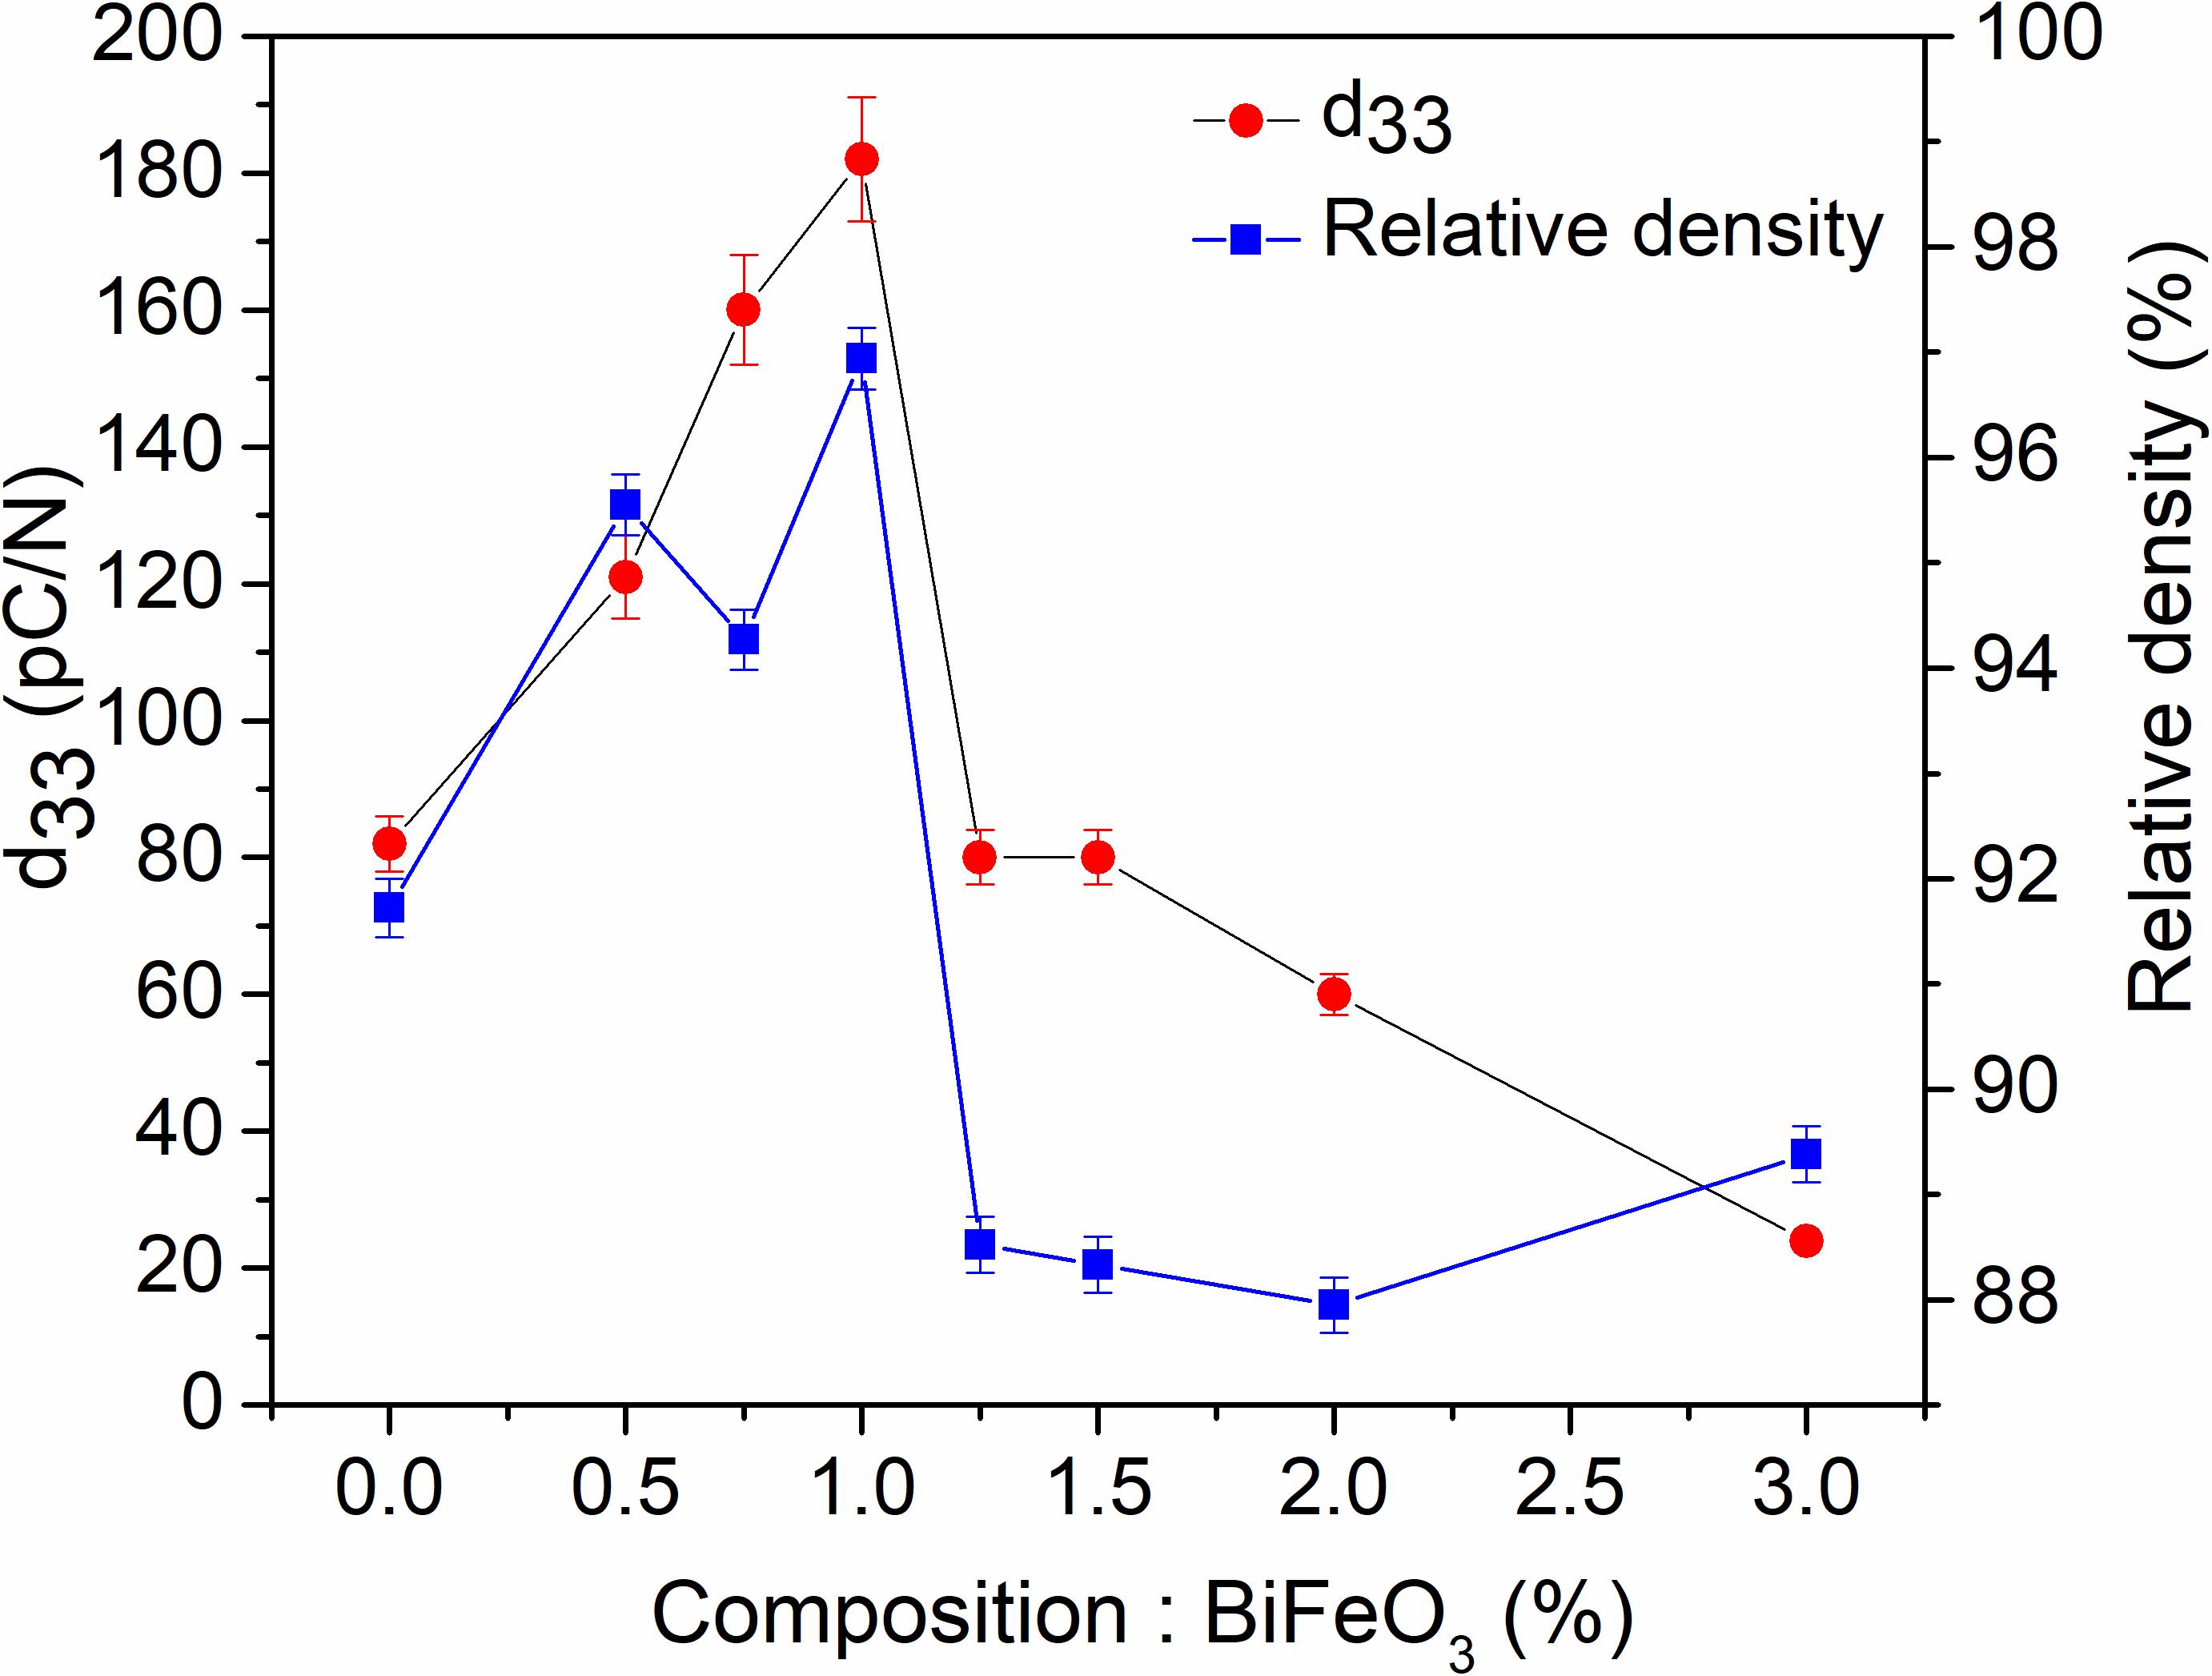
Figure 5. d33 and relative density as a function of composition in the system (1–x)K0.4Na0.6NbO3–xBiFeO3 (x = 0–3 mol.%).
Figure 7 shows polarization and strain vs. electric field loops for samples (1-x)K0.4Na0.6NbO3–xBiFeO3 with 0–1 mol.%. Ceramics with x = 0.5 mol.% also exhibited high loss and hence the value of Pr is meaningless but samples with x = 0.75 and 1 mol.% exhibited well saturated loops with a high Pr of ∼ 28 μC/cm2 and low coercive field (EC) of <1 kV/mm. It was also noted that the P–E loops for x = 0.75 and 1 mol.% are square. According to Haertling and Zimmer (1966), the degree of squareness (Rsq) of a P–E loop can be calculated from the empirical formula introduced in Eq. 1, which for an ideal square loop is equal to 2.
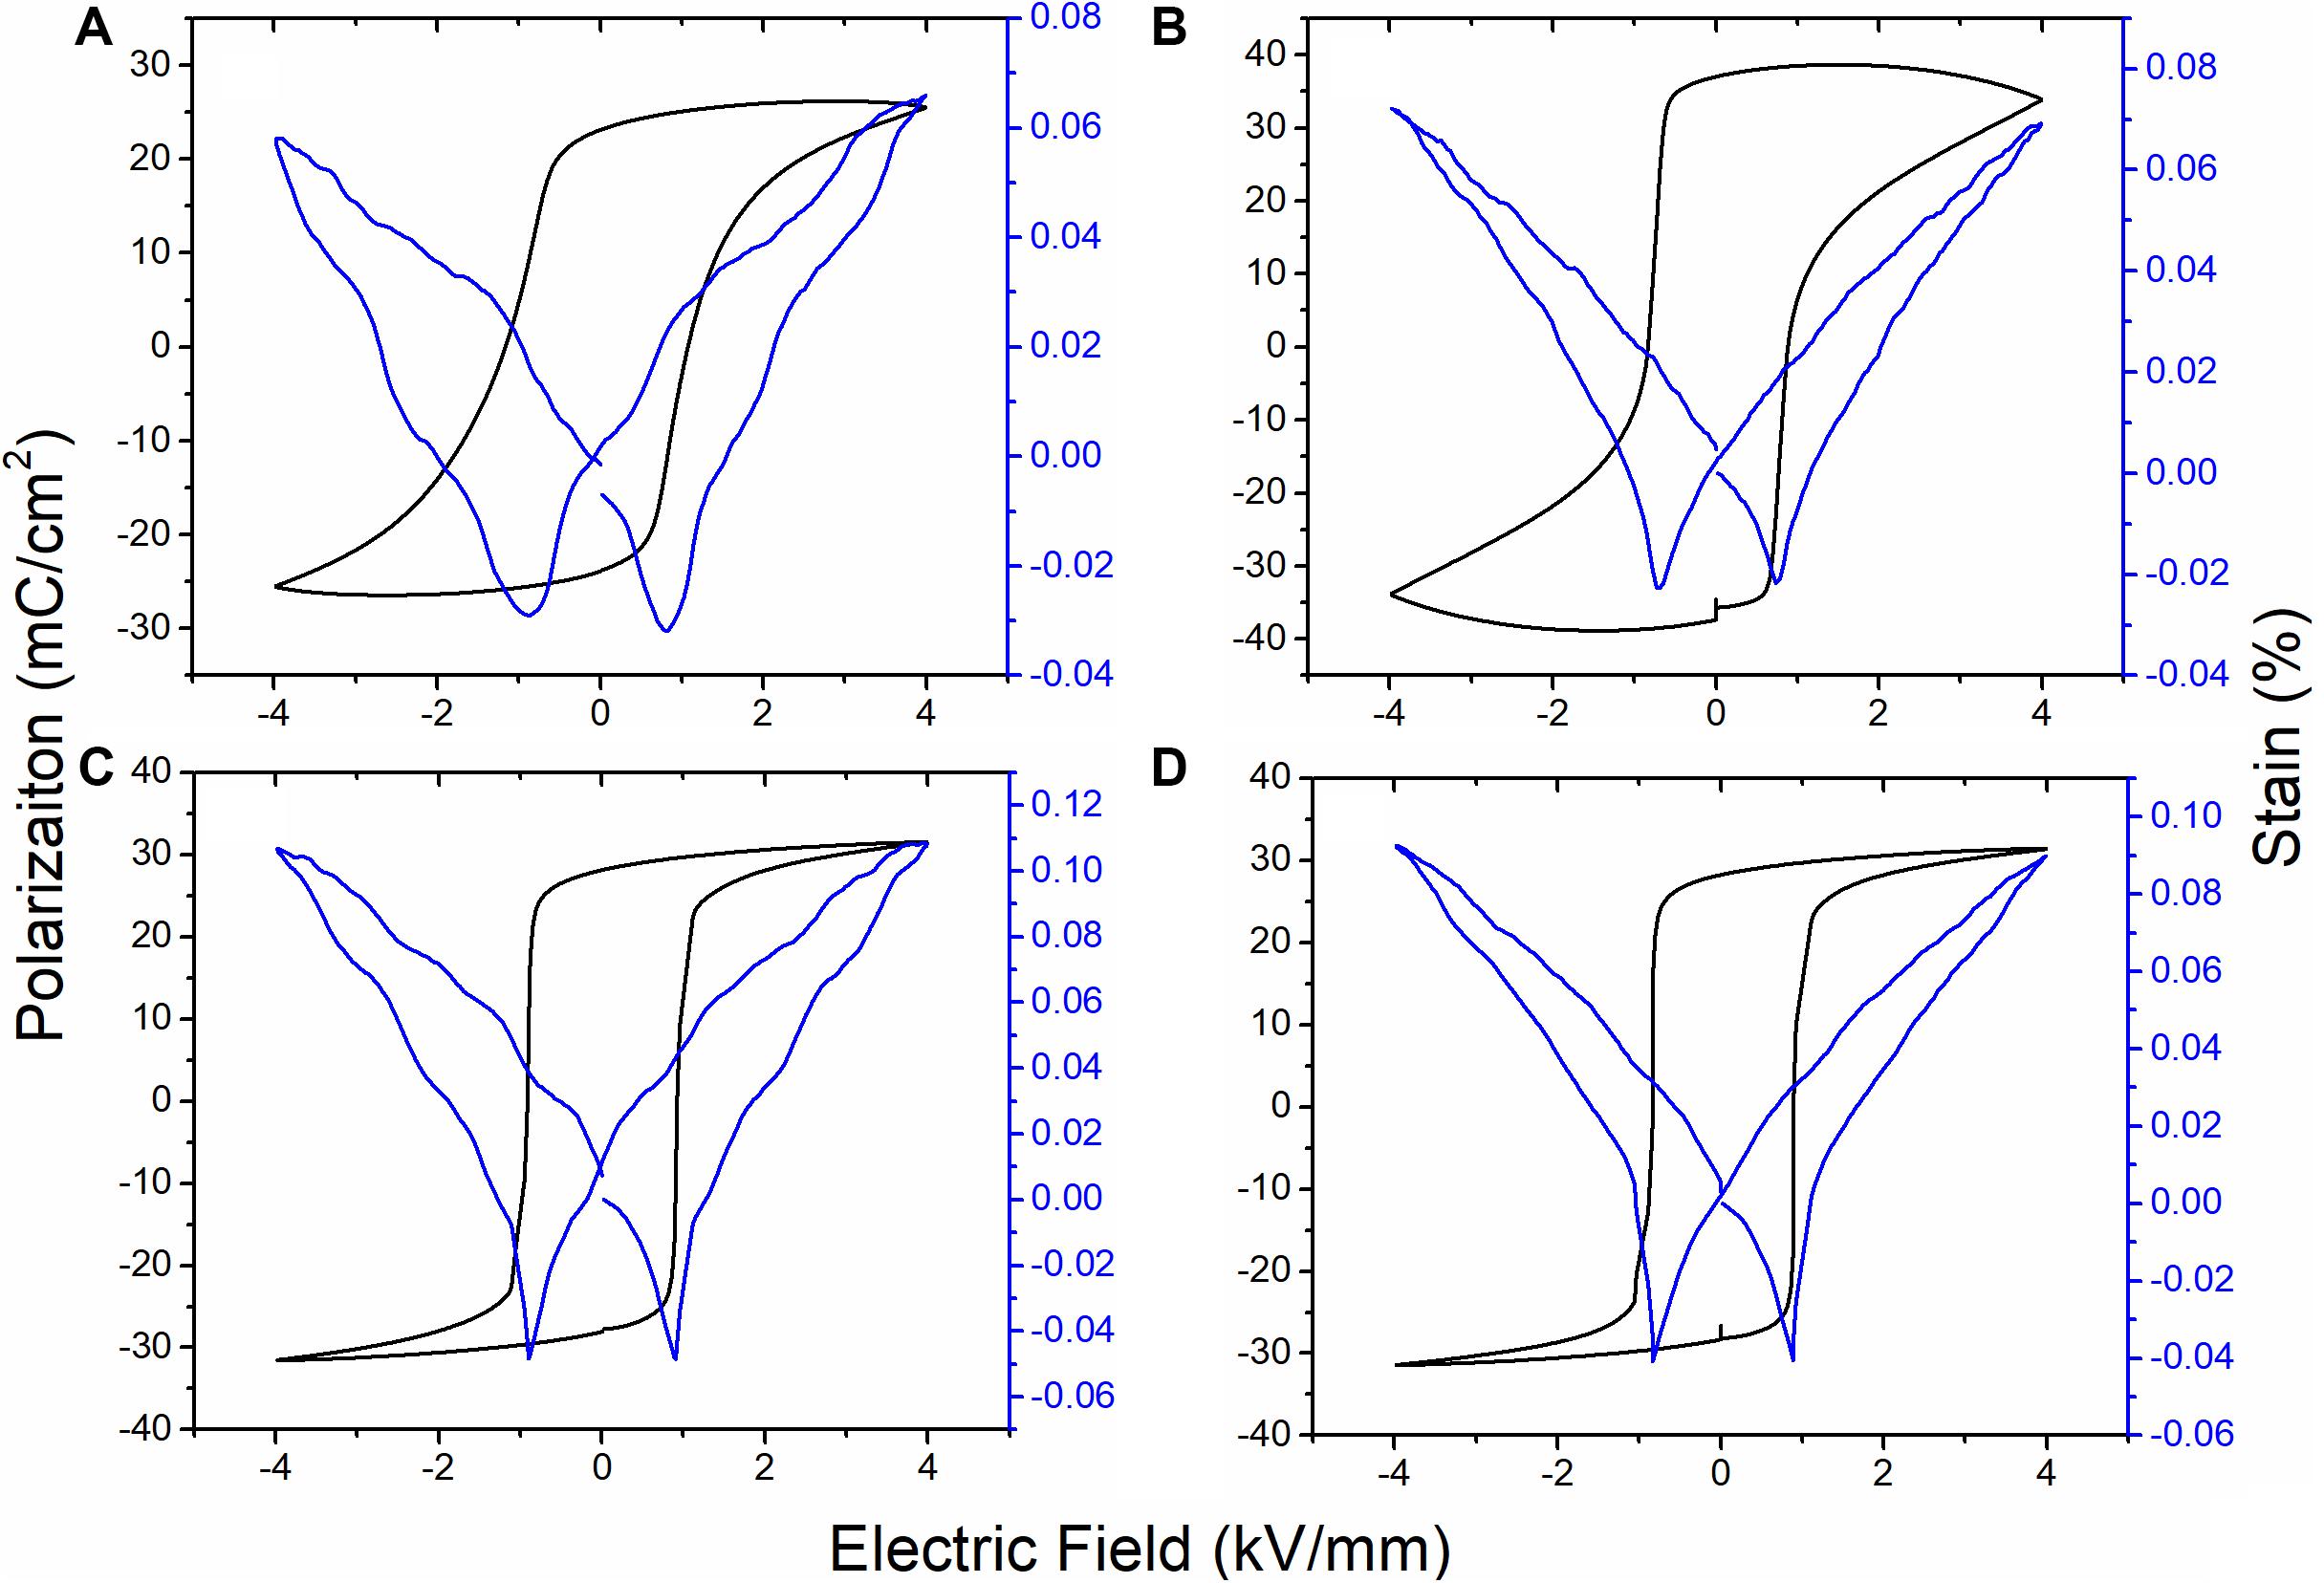
Figure 7. Polarization and strain vs. electric field for (A) x = 0; (B) x = 0.5 mol.%; (C) 0.75 mol.%; and (D) x = 1 mol.%.
where “Ps” is saturation polarization and P1.1 EC is the polarization at 1.1 times of coercive field (Ec).
Samples with x = 0.75 and 1 mol.% exhibited Rsq = 1.94 and 1.95, respectively, which is closer to the ideal value of 2, indicating uniform grain size and better homogeneity (Haertling, 1999). The strain was observed to increase from 0.06 to 0.09% with increase in x from 0 to 1 mol.% at an applied E = 4 kV/mm.
Figure 8A shows that well saturated P–E loops are obtained at an electric field of 2 kV/mm for optimized compositions with x = 1 mol.%. The coercive field was estimated to be 0.8 kV/mm from current (I) vs. E curve (Figure 8B), where a sharp peak was observed at the point of switching. The sharp peaks are indicative of well-defined coercive fields because of instantaneous domain switching, which is consistent with the square loops observed for these samples. S–E loops with peak to peak strain of 0.08% at E = 2 kV/mm are shown in Figure 8C. However, for practical applications, only a positive strain of 0.05% is useful. The negative strain in S–E loops is indicative of long-range ferroelectric order, consistent with the P–E loops. Strain values are influenced by both intrinsic and extrinsic factors (Donnelly et al., 2007). The extrinsic contributions are mainly dominated by domain wall motion, which due to low coercive field contributes at lower electric field. The optimum d∗33 value (250 pm/V) is therefore, observed at 2 kV/mm and further increase in electric field does not increase d∗33, as shown in Figure 8D.
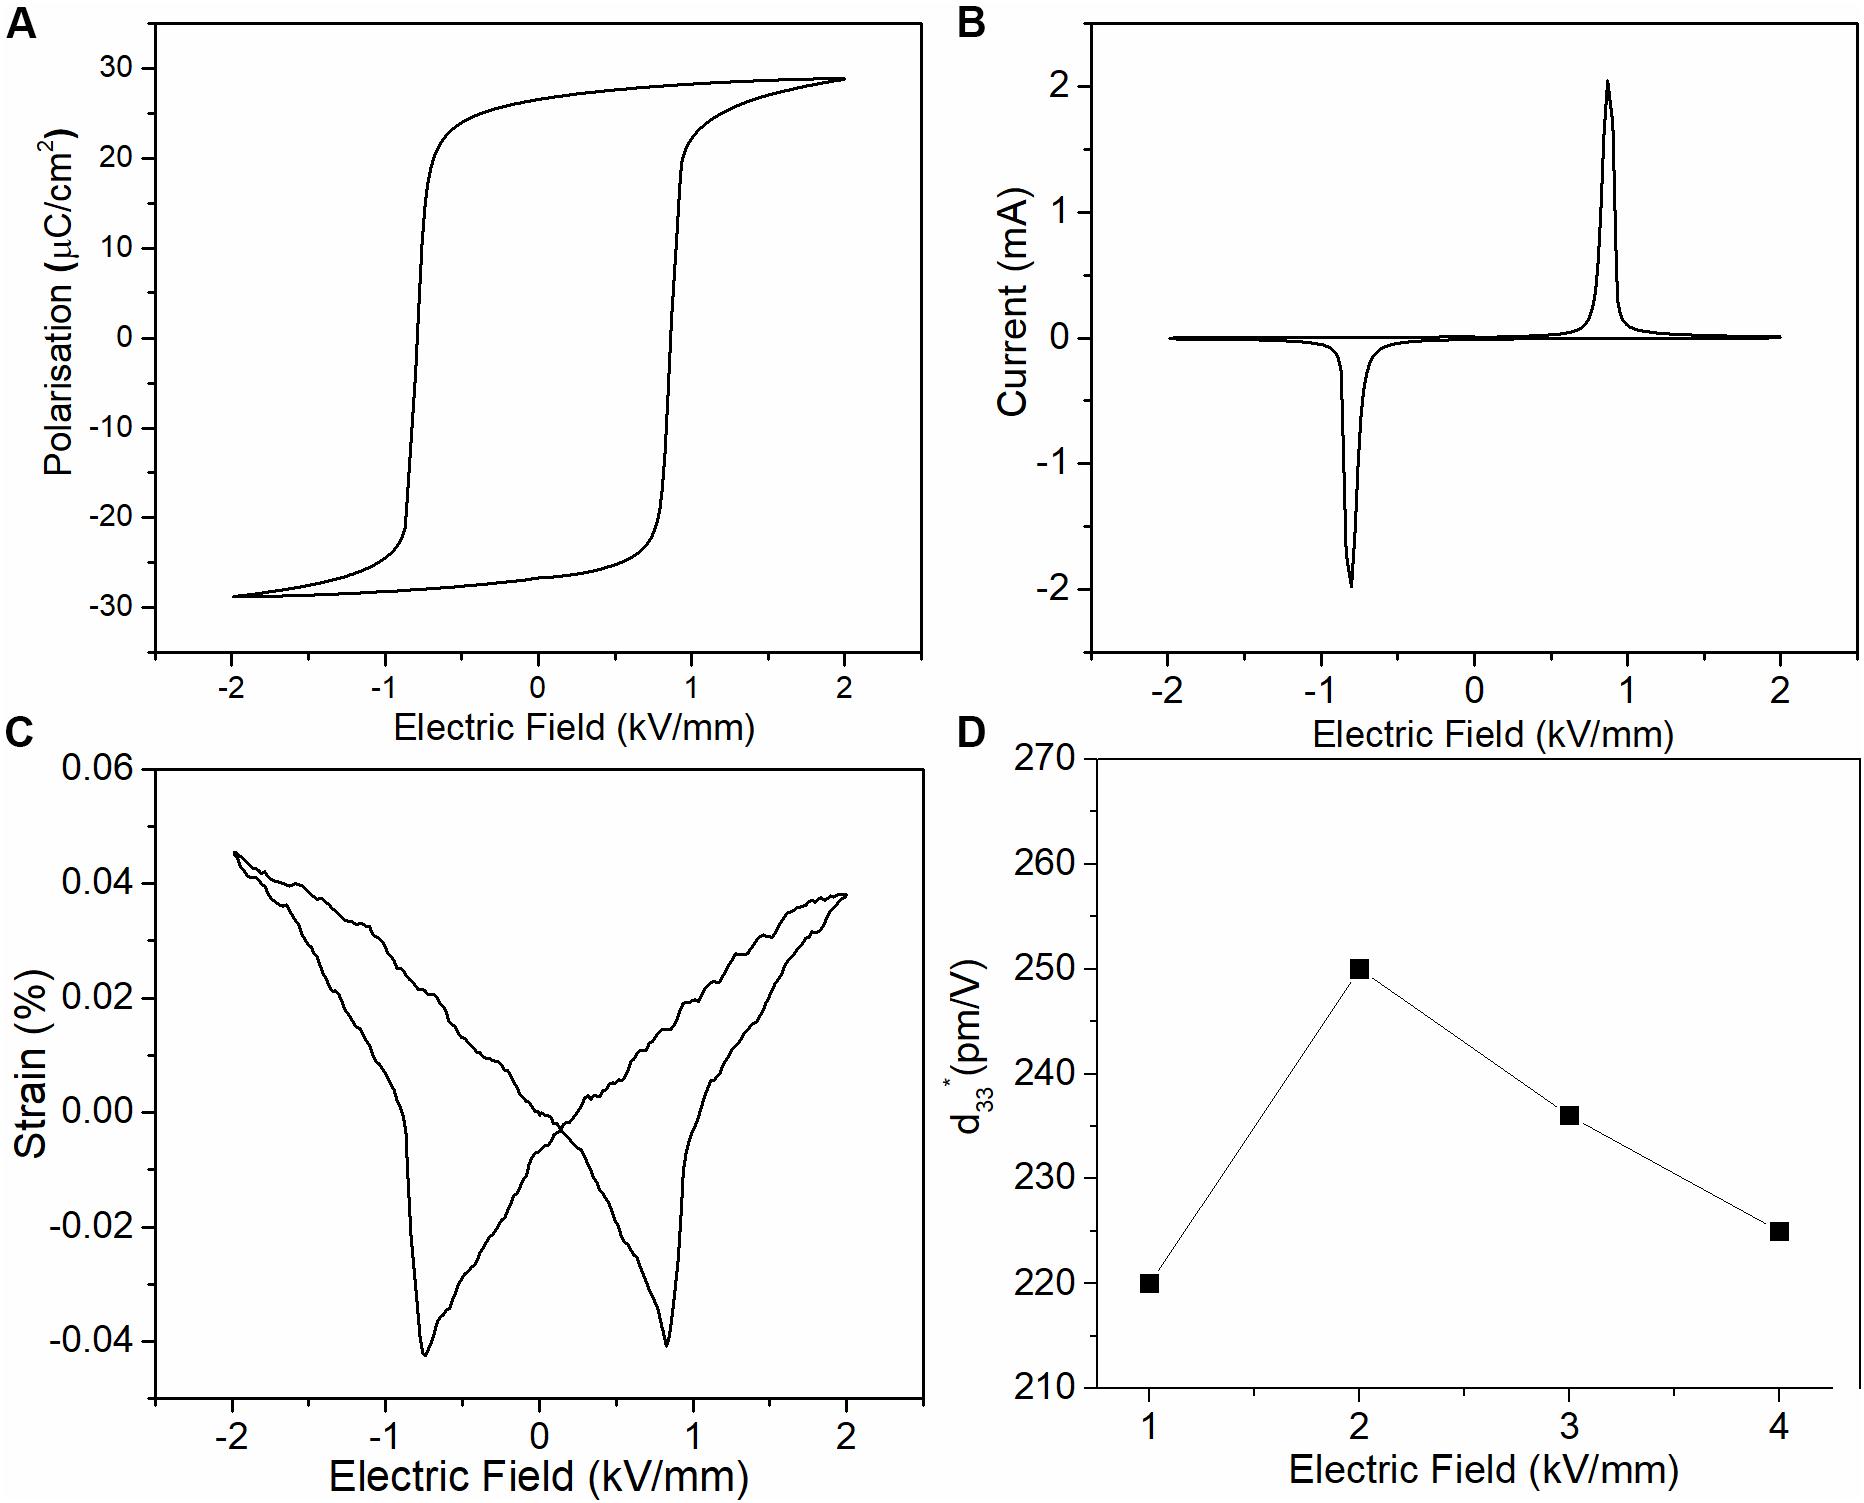
Figure 8. (A) P–E loops; (B) I–E loops; (C) S–E loops at room temperature for x = 1 mol.%; and (D) d∗33 as a function of electric field for x = 1 mol.%.
(1-x)K0.4Na0.6NbO3–xBiFeO3 ceramics have optimized piezoelectric properties at RT for ceramics with x = 1 mol.% (d33 = 182 pC/N, d∗33 = 250 pm/V, and kp = 50%). However, of equal importance for application are the temperature dependent of properties.
kp as a function of temperature for the sample with x = 1 mol.% is shown in Figure 9 which is stable up to 90°C with a variation of ∼5% and then linearly decreased at temperatures >100°C to ∼50% of its efficiency at 300°C. TO–T = 108°C, therefore, it can be concluded that kp is stable in the orthorhombic state, but degradation occurs when the structure changes to tetragonal symmetry (Khesro et al., 2016b). Though the reason of this degradation is unclear at this point, however it may be possible that the samples starts depoling at the onset of the phase transition which results in lower values of kP as the temperature is increased.
Figure 10A shows P–E loops at selected temperatures from 22 to 90°C. The coercive field decreased with increase in temperature, associated with easy domain switching at higher temperatures but the maximum polarization remains unchanged. Figure 10B shows the corresponding bipolar S-E loops, which reveal a limited temperature dependence of the field-induced strain. The change in positive strain is about 15% from 22 to 75°C. With increasing temperature, as the phase transition is approached there are significant changes on both P-E and S-E responses, as illustrated in Figures 10C–D, respectively. In the tetragonal phase, the P–E loops become tilted with an increase in coercive field as shown in Figure 10C. This change occurs at 125°C, which corresponds to the temperature at which the largest field-induced strain is observed, as shown in Figure 10D. The peak to peak strain at this temperature is ∼0.16% compared with ∼0.08 at RT. In summary, bipolar strain is relatively stable up to 75°C, reaches a maximum at 125°C but decreases above the TO–T transition. The maximum strain closer to the phase transition may be attributed to the increased domain wall motion due to increase in temperature and coexistence of crystal symmetries (Orthorhombic + Tetragonal) around 125°C, followed by a disappearance of the orthorhombic symmetry at higher temperatures, leading to lower achievable strains.
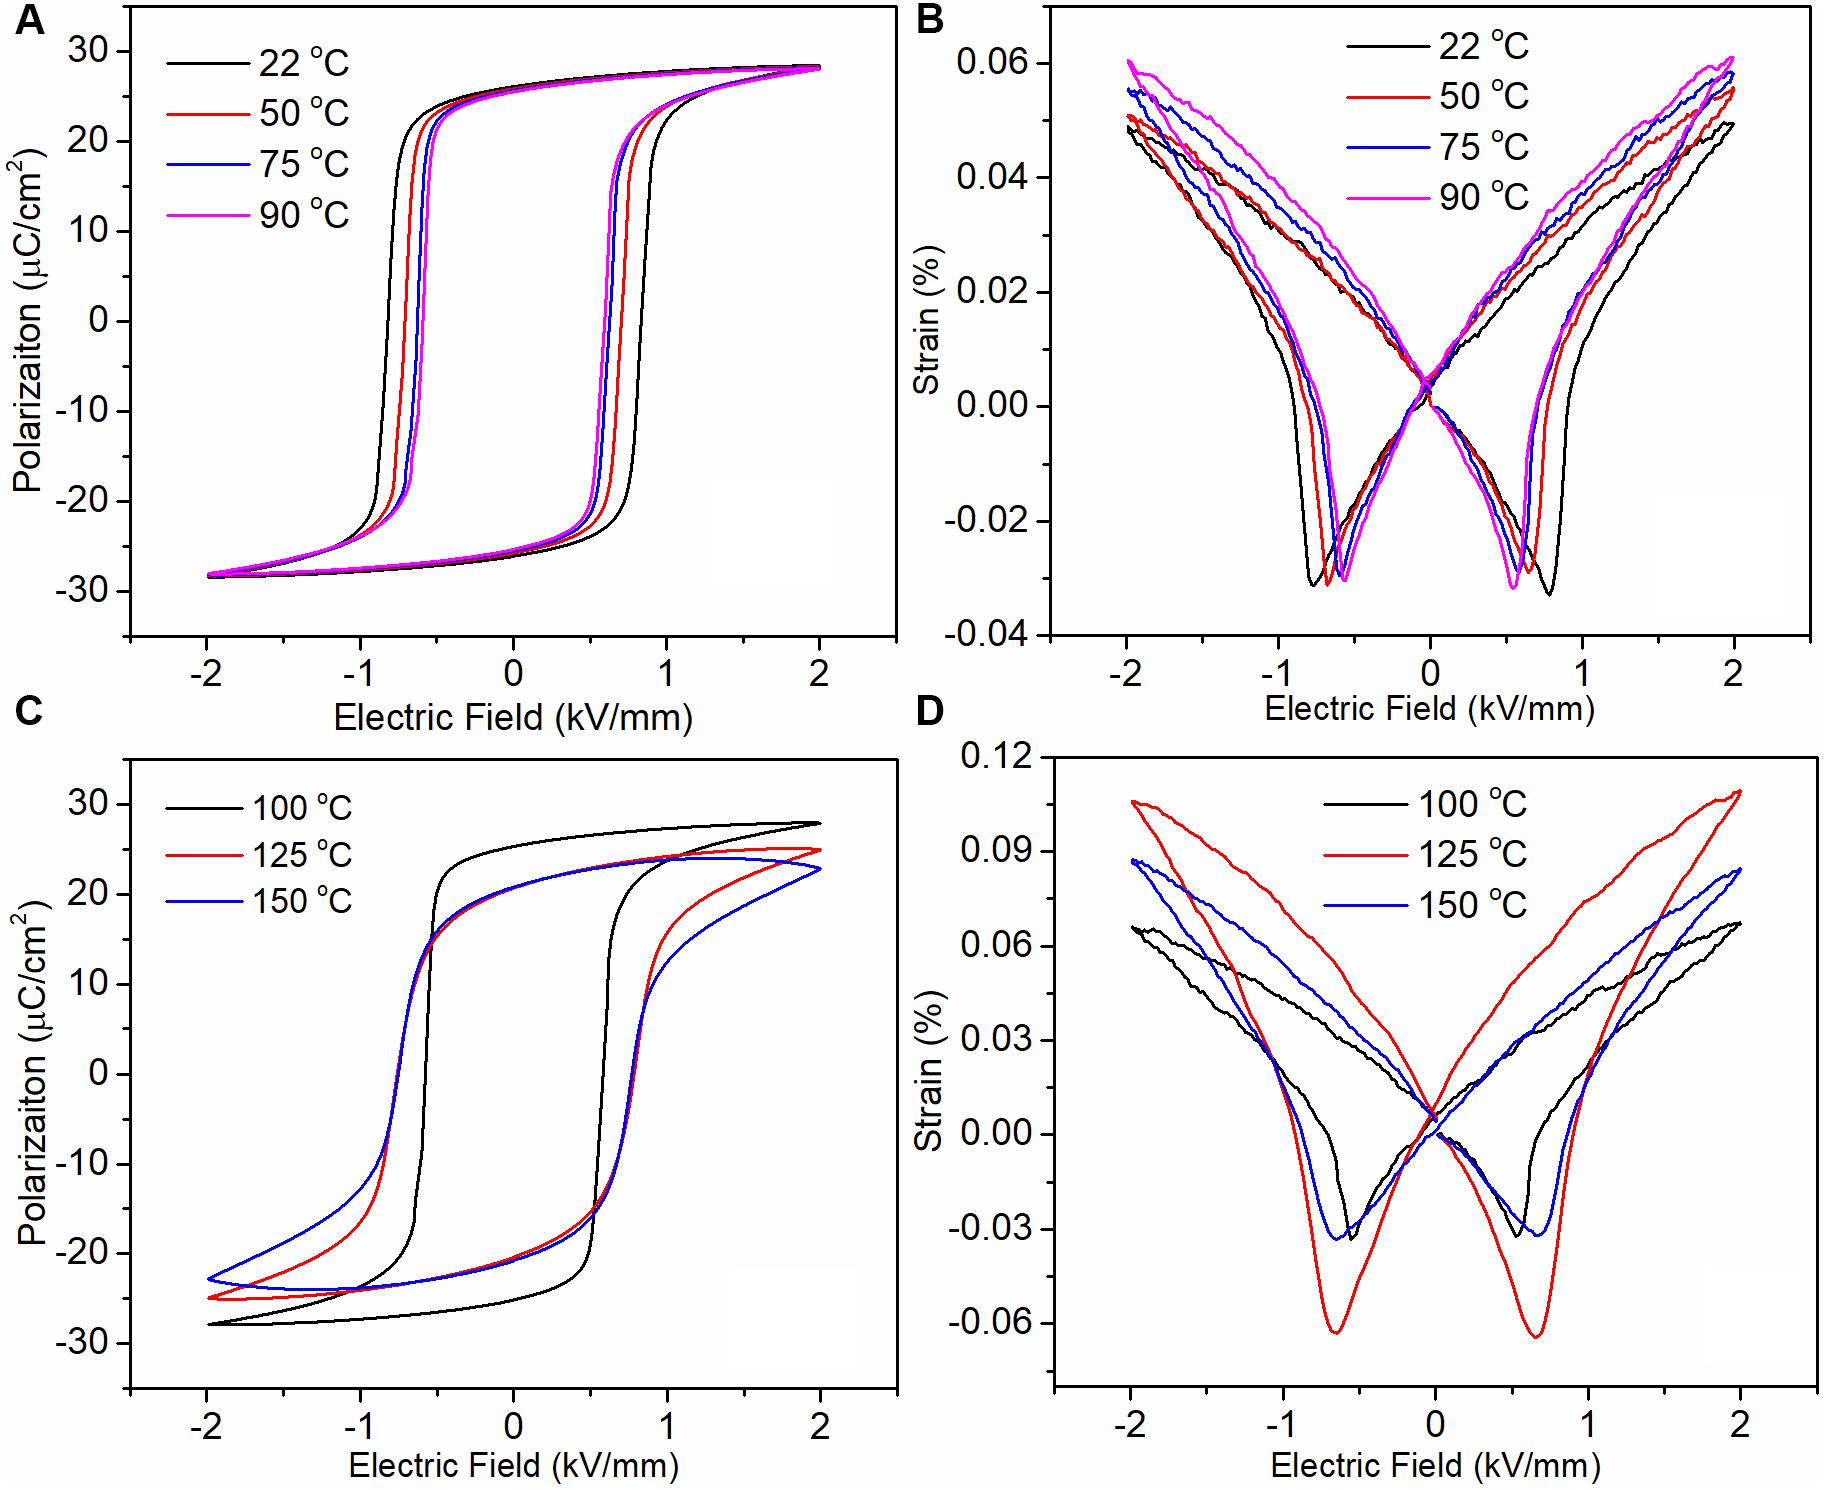
Figure 10. For composition at x = 1 mol.% (A) P–E loops at selected temperatures from 22–90°C; (B) S–E loops at selected temperatures from 22–90°C; (C) P–E loops at selected temperatures from 100–150°C; and (D) S–E loops at selected temperatures from 100–150°C.
Figure 11 summarizes key parameters for x = 1 mol.% as a function of temperature but is evident that in situ measurements demonstrate that piezoelectric properties of (1-x)K0.4Na0.6NbO3–xBiFeO3 are severely temperature dependent.
This study was seeking to find a compromise between high piezoelectric coefficients and temperature stability by pushing the polymorphic phase out of the operating window and achieve a single tetragonal phase. In this respect (1-x)K0.4Na0.6NbO3–xBiFeO3 still shows some limitations because compositions with x > 1 mol. % could not be fabricated as dense ceramics. Furthermore, the piezoelectric properties continuously degrade even in the pure tetragonal phase and hence the absence of a structural phase transition may not be sufficient to achieve temperature stable properties in K0.5Na0.5NbO3–based ceramics. Despite these issues, incentives such as the potential for co-firing with low cost Ni (Hayashi et al., 2012) and Cu (Gao et al., 2016) internal electrodes make K0.5Na0.5NbO3 a commercially attractive material for piezoelectric applications.
An investigation of the (1-x)K0.4Na0.6NbO3–xBiFeO3 system revealed that dense ceramics can be obtained for x ≤ 1 mol.%. Piezoelectric properties were enhanced as BiFeO3 content increased to 1%, beyond which the piezoelectric properties degraded. The degradation in properties was associated with poor densification during sintering. Optimum properties were obtained for ceramics with x = 1 mol.% (d33 = 182 PC/N, d∗33 = 250 pm/V, and kp = 50%). Though the composition has a high TC = 355°C, stability is limited by TO–T (108°C). The sample is stable in orthorhombic phase with kp showing a variation of only ∼5% from RT–90°C. The strain-electric field curves (d∗33) also showed stability RT–75°C, provided a variation of 15% is considered acceptable. At the onset of TO–T, large variations in piezoelectric coefficients are observed. The piezoelectric coefficients are not stable in tetragonal phase and a continuous degradation is observed as TC is approached. This study concludes that temperature stability in a limited range can be achieved in (1-x)K0.4Na0.6NbO3–xBiFeO3 as long as TO–T is ∼100–120°C (Khesro, 2016).
The datasets generated for this study are available on request to the corresponding author.
AK performed all the experimental work and wrote the manuscript. IR and DW supervised the work. FH and RM helped with processing of ceramics. GW helped with the rietveld refinements. AF helped with strain measurements. All authors provided critical feedback and contributed to the final manuscript.
AK acknowledges Abdul Wali Khan University Mardan for Ph.D. studentship. This work is part of thesis titled “Lead-free Ceramics for High Temperature Actuator Applications” submitted by AK to the University of Sheffield for the degree of Ph.D. All authors acknowledge the grant, Sustainability and Substitution of Functional Materials and Devices EPSRC (No. EP/L017563/1).
The authors declare that the research was conducted in the absence of any commercial or financial relationships that could be construed as a potential conflict of interest.
American National Standards Institute (1988). An American National Standard IEEE standard on piezoelectricity. Piscataway, NJ: IEEE, 8–10.
Bomlai, P., Wichianrat, P., Muensit, S., and Milne, S. J. (2007). Effect of calcination conditions and excess alkali carbonate on the phase formation and particle morphology of Na0.5K0.5NbO3 powders. J. Am. Ceram. Soc. 90, 1650–1655. doi: 10.1111/j.1551-2916.2007.01629.x
Donnelly, N. J., Shrout, T. R., and Randall, C. A. (2007). Addition of a Sr, K, Nb (SKN) combination to PZT(53/47) for high strain applications. J. Am. Ceram. Soc. 90, 490–491. doi: 10.1111/j.1551-2916.2006.01450.x
Egerton, L., and Dillon, M. (1959). Piezoelectric and dielectric properties of ceramics in the system potassium-sodium niobate. Mater. Sci. 42, 438–442. doi: 10.1016/j.ceramint.2011.04.097
Feng, W., Du, H., Chen, C., and Huang, Y. (2016). Electric-field-driven phase transition process in (K, Na, Li)(Nb, Ta, Sb)O 3 lead-free piezoceramics. J. Am. Ceram. Soc. 99, 135–140. doi: 10.1111/jace.13861
Gao, L., Ko, S.-W., Guo, H., Hennig, E., and Randall, C. A. (2016). Demonstration of copper co-fired (Na, K)NbO 3 multilayer structures for piezoelectric applications. J. Am. Ceram. Soc. 99, 2017–2023. doi: 10.1111/jace.14207
Haertling, G. H. (1999). Ferroelectric ceramics: history and technology. J. Am. Ceram. Soc. 82, 797–818. doi: 10.1111/j.1151-2916.1999.tb01840.x
Haertling, G. H., and Zimmer, W. J. (1966). Analysis of hot-pressing parameters for lead zirconate-lead titanate ceramics containing two atom percent bismuth. Am. Ceram. Soc. Bull. 45, 1084–1089.
Han, G., Ryu, J., Ahn, C. W., Yoon, W. H., Choi, J. J., Hahn, B. D., et al. (2012). High piezoelectric properties of KNN-based thick films with abnormal grain growth. J. Am. Ceram. Soc. 95, 1489–1492. doi: 10.1111/j.1551-2916.2012.05139.x
Hayashi, H., Kawada, S., Kimura, M., Nakai, Y., Tabata, T., Shiratsuyu, K., et al. (2012). Reliability of nickel inner electrode lead-free multilayer piezoelectric ceramics. Jpn. J. Appl. Phys. 51, 4–8. doi: 10.1143/JJAP.51.09LD01
Holterman, J., and Groen, P. (2013). An Introduction to Piezoelectric Materials and Applications. London: Stiching Applied Piezo.
Hussain, F., Khesro, A., Muhammad, R., and Wang, D. (2019). Effect of Ta-doping on functional properties of K0.51Na0.49NbO3. Mater. Res. Express 6:10.
Jaeger, R. E., and Egerton, L. (1962). Hot pressing of potassium-sodium niobates. J. Am. Ceram. Soc. 45, 209–213. doi: 10.1111/j.1151-2916.1962.tb11127.x
Jiang, M., Liu, X., and Liu, C. (2010). Effect of BiFeO3 additions on the dielectric and piezoelectric properties of (K0.44Na0.52Li0.04)(Nb0.84Ta0.1Sb0.06)O3 ceramics. Mater. Res. Bull. 45, 220–223. doi: 10.1016/j.materresbull.2009.09.014
Jo, W., Kim, D.-Y., and Hwang, N.-M. (2006). Effect of interface structure on the microstructural evolution of ceramics. J. Am. Ceram. Soc. 89, 2369–2380. doi: 10.1111/j.1551-2916.2006.01160.x
Khesro, A. (2016). Lead-free Ceramics for High Temperature Actuator Applications. Ph.D. thesis, The University of Sheffield, Sheffield.
Khesro, A., Boston, R., Sterianou, I., Sinclair, D. C., and Reaney, I. M. (2016). Phase transitions, domain structure, and pseudosymmetry in La- and Ti-doped BiFeO3. J. Appl. Phys. 119, 54101–54101. doi: 10.1063/1.4940391
Khesro, A., Wang, D., Hussain, F., Sinclair, D. C., Feteria, A., and Reaney, I. M. (2016b). Temperature stable and fatigue resistant lead-free ceramics for actuators. Appl. Phys. Lett. 109:142907. doi: 10.1063/1.4964411
Kim, M.-S., Jeong, S.-J., Kim, I.-S., Song, J.-S., and Oh, Y.-W. (2009). (NaxK0.98- xLi0.02)(Nb0.8Ta0.2)O3 lead-free piezoelectric ceramics. Jpn. J. Appl. Phys. 48:010204. doi: 10.1143/JJAP.48.010204
Lingwal, V., Semwal, B. S., and Panwar, N. S. (2006). Relaxational behavior of mixed NaNbO3 -KNbO3 system. Ferroelectrics 332, 219–225. doi: 10.1080/00150190600732777
Liu, W., and Ren, X. (2009). Large piezoelectric effect in Pb-free ceramics. Phys. Rev. Lett. 103, 1–4. doi: 10.1103/PhysRevLett.103.257602
Lv, X., Zhu, J., Xiao, D., Zhang, X., and Wu, J. (2020). Emerging new phase boundary in potassium sodium-niobate based ceramics. Chem. Soc. Rev. 49, 671–707. doi: 10.1039/C9CS00432G
Na, K., La, B., Zhang, C., Chen, Z., Ji, W., Wang, L., et al. (2011). Crystal structures and electrical properties of. J. Alloys Compd. 509, 2425–2429. doi: 10.1016/j.jallcom.2010.11.037
Rödel, J., Webber, K. G., Dittmer, R., Jo, W., Kimura, M., and Damjanovic, D. (2015). Transferring lead-free piezoelectric ceramics into application. J. Eur. Ceram. Soc. 35, 1659–1681. doi: 10.1016/j.jeurceramsoc.2014.12.013
Song, H.-C., Cho, K.-H., Park, H.-Y., Ahn, C.-W., Nahm, S., Uchino, K., et al. (2007). Microstructure and Piezoelectric Properties of (1-x)(Na0.5K0.5)NbO3- xLiNbO3 Ceramics. J. Am. Ceram. Soc. 90, 1812–1816. doi: 10.1143/JJAP.43.L1072
Sun, X., Chen, J., Yu, R., Xing, X., Qiao, L., and Liu, G. (2008). BiFeO3 -doped (Na0.5K0.5)NbO3 lead-free piezoelectric ceramics. Sci. Technol. Adv. Mater. 9:025004. doi: 10.1088/1468-6996/9/2/025004
Tao, H., Wu, H., Liu, Y., Zhang, Y., Wu, J., Li, F., et al. (2019). Ultrahigh performance in lead-free piezoceramics utilizing a relaxor slush polar state with multiphase coexistence. J. Am. Chem. Soc. 141, 13987–13994. doi: 10.1021/jacs.9b07188
Tellier, J., Malic, B., Dkhil, B., Jenko, D., Cilensek, J., and Kosec, M. (2009). Crystal structure and phase transitions of sodium potassium niobate perovskites. Solid State Sci. 11, 320–324. doi: 10.1016/j.solidstatesciences.2008.07.011
Wang, D., Hussain, F., Khesro, A., Feteria, A., and Reaney, I. M. (2016). Composition and temperature dependence of piezoelectricity in (1-x)(K1-yNay)NbO3-x(Bi1/2Na1/2)ZrO3 lead-free ceramics. J. Am. Ceram. Soc. 100, 627–637. doi: 10.1111/jace.14589
Wang, K., and Li, J.-F. (2012). (K, Na)NbO3-based lead-free piezoceramics: phase transition, sintering and property enhancement. J. Adv. Ceram. 1, 24–37. doi: 10.1007/s40145-012-0003-3
Wu, J., Xiao, D., and Zhu, J. (2015). Potassium-sodium niobate lead-free piezoelectric materials: past, present, and future of phase boundaries. Chem. Rev. 115, 2559–2595. doi: 10.1021/cr5006809
Wu, L., Zhang, J. L., Wang, C. L., and Li, J. C. (2008). Influence of compositional ratio K/Na on physical properties in (KxNa1-x)NbO3 ceramics. J. Appl. Phys. 103:084116. doi: 10.1063/1.2907866
Zhen, Y., and Li, J.-F. (2007). Abnormal grain growth and new core-shell structure in (K,Na)NbO3 -based lead-free piezoelectric ceramics. J. Am. Ceram. Soc. 90, 3496–3502. doi: 10.1111/j.1551-2916.2007.01977.x
Zheng, T., Zhang, Y., Ke, Q., Wu, H., Heng, L. W., Xiao, D., et al. (2020). High-performance potassium sodium niobate piezoceramics for ultrasonic transducer. Nano Energy 70:104559. doi: 10.1016/j.nanoen.2020.104559
Zhou, J. S., Wang, K., Yao, F. Z., Zheng, T., Wu, J. G., Xiao, D. Q., et al. (2015). Multi-scale thermal stability of niobate-based lead-free piezoceramics with large piezoelectricity. J. Mater. Chem. C 3, 8780–8787. doi: 10.1039/c5tc01357g
Keywords: piezoelectrics, lead free, K0.5Na0.5NbO3, temperature dependence, BiFeO3
Citation: Khesro A, Wang D, Hussain F, Muhammad R, Wang G, Feteira A and Reaney IM (2020) Temperature Dependent Piezoelectric Properties of Lead-Free (1-x)K0.6Na0.4NbO3–xBiFeO3 Ceramics. Front. Mater. 7:140. doi: 10.3389/fmats.2020.00140
Received: 10 February 2020; Accepted: 23 April 2020;
Published: 19 May 2020.
Edited by:
Rajesh Adhikari, Institut National de la Recherche Scientifique (INRS), CanadaReviewed by:
Soonil Lee, Changwon National University, South KoreaCopyright © 2020 Khesro, Wang, Hussain, Muhammad, Wang, Feteira and Reaney. This is an open-access article distributed under the terms of the Creative Commons Attribution License (CC BY). The use, distribution or reproduction in other forums is permitted, provided the original author(s) and the copyright owner(s) are credited and that the original publication in this journal is cited, in accordance with accepted academic practice. No use, distribution or reproduction is permitted which does not comply with these terms.
*Correspondence: Amir Khesro, YW1pcmtoZXNyb0Bhd2t1bS5lZHUucGs=
Disclaimer: All claims expressed in this article are solely those of the authors and do not necessarily represent those of their affiliated organizations, or those of the publisher, the editors and the reviewers. Any product that may be evaluated in this article or claim that may be made by its manufacturer is not guaranteed or endorsed by the publisher.
Research integrity at Frontiers

Learn more about the work of our research integrity team to safeguard the quality of each article we publish.