 Maria Cristina Gonçalves1,2*
 Rui F. P. Pereira3
 Raquel Alves3
 Sílvia C. Nunes1,4
 Mariana Fernandes1,2
 Helena M. R. Gonçalves1,5
 Sónia Pereira6
 M. Manuela Silva3
 Elvira Fortunato6
 Rosa Rego1,2
 Verónica de Zea Bermudez1,2*
- 1Chemisty Department, University of Trás-os-Montes e Alto Douro, Vila Real, Portugal
- 2CQ-VR, University of Trás-os-Montes e Alto Douro, Vila Real, Portugal
- 3Chemistry Department and Centre of Chemistry, University of Minho, Braga, Portugal
- 4Chemisty Department and CISC, University of Beira Interior, Covilhã, Portugal
- 5REQUIMTE, Instituto Superior de Engenharia do Porto, Porto, Portugal
- 6Departamento de Ciência de Materiais, Faculdade de Ciências e Tecnologia, FCT, Universidade Nova de Lisboa, Caparica, Portugal
A di-urethane cross-linked poly(oxyethylene)/silica hybrid matrix [di-urethanesil, d-Ut(600)], synthesized by the sol-gel process, was doped with lithium triflate (LiCF3SO3) and the 1-butyl-3-methylimidazolium chloride ([Bmim]Cl) ionic liquid. The as-produced xerogel film is amorphous, transparent, flexible, homogeneous, hydrophilic, and has low nanoscale surface roughness. It exhibits an ionic conductivity of 3.64 × 10⁻⁶ and 5.00 × 10⁻⁴ S cm–1 at 21 and 100°C, respectively. This material was successfully tested as electrolyte in an electrochromic device (ECD) with the glass/ITO/a-WO3/d-Ut(600)10LiCF3SO3[Bmim]Cl/c-NiO/ITO/glass configuration, where a-WO3 and c-NiO stand for amorphous tungsten oxide and crystalline nickel oxide, respectively. The device demonstrated attractive electro-optical performance: fast response times (1–2 s for coloring and 50 s for bleaching), good optical memory [loss of transmittance (T) of only 41% after 3 months, at 555 nm], four mode modulation [bright mode (+3.0 V, T = 77% at 555 nm), semi-bright mode (−1.0 V, T = 60% at 555 nm), dark mode (−1.5 V, T = 38 % at 555 nm), and very dark mode (−2.0 V, T = 11% and −2.5 V, T = 7% at 555 nm)], excellent cycling stability denoting improvement with time, and high coloration efficiency [CEin = −6727 cm2 C–1 (32th cycle) and CEout = +2794 cm2 C–1 (480th cycle), at 555 nm].
Introduction
The last decades have witnessed a considerable growth in energy consumption. To curb this trend, Goal 11 of the United Nations Sustainable Development Goals for 2030 targets inclusive, safe, resilient, and sustainable cities, to ensure universal access to affordable, reliable, sustainable, and modern energy to everyone (Goal 11: Make Cities Inclusive, 2019). The underlying idea is to provide more well-being, more security, less climate changes, and more economic progress. Non-polluting, renewable and efficient energy is needed for a more sustainable future.
A sustainable use of energy in the building sector will contribute significantly to the global energy solution. Windows are of particular interest, accounting for nearly 10% of the total energy consumed. In the last decade smart window technology has attracted increasing interest in the building sector (Casini, 2018). Smart windows [e.g., electrochromic (EC), thermochromic, and photochromic] have the ability to change a property (color) upon variation of the external environmental conditions [current/voltage, temperature, and ultraviolet (UV) radiation, respectively]. These dynamic systems have tremendous influence on the energy efficiency of a building, providing marked energy savings in terms of lighting, heating and ventilation.
Among the available smart window technologies, EC windows (ECWs) offer excellent prospects. This technology has demonstrated significant progress in the last few years and represents a valuable solution to address the energy issue (Granqvist et al., 2018). ECWs exert a beneficial impact on the visual and thermal comfort indoors, enabling the occupant to control incident solar radiation (light and heat), reduce glare, and increase outside view, at his/her choice, according to the season of the year, and the room’s orientation. The operation of an ECW relies on EC materials displaying a reversible color change upon application of a small voltage (usually less than 3.0 V). This phenomenon is used for designing systems with variable light transmittance (T) (smart windows) or reflection (dimmable rear view mirrors). Architectural buildings (SAGEGlass View, Inc.), self-dimming rear view mirrors (Gentex), and the Boeing 787 Dreamliner airplane are a few examples of successful commercial applications of ECWs.
Smart ECWs must fulfill a number of technical requirements which are related with the design of the electrochromic device (ECD) (Piccolo and Simone, 2015). A classical ECD has a typical sandwich multilayer configuration which includes oxide-based EC materials (Granqvist, 2014). This configuration is usually described by the notation substrate/TCO/EC1/IC/EC2/TCO/substrate, where TCO is a transparent conductive oxide layer, EC1 and EC2 are active electrode layers [often tungsten oxide (WO3) and nickel oxide (NiO), respectively], and IC is an ion conductor (electrolyte). The substrate may be simple glass or a polymer, such as poly(ethylene terephthalate) (PET). When a low voltage is applied to the electrodes, WO3 undergoes reduction and ion intercalation, whereas oxidation and ion deintercalation occur in NiO. This situation represents the colored or ON state, since both electrodes become colored. Upon inverting the voltage both electrodes bleach (OFF state). Typically, ECDs include near infrared (NIR)-absorbing TCOs, such as indium-doped tin oxide (ITO) or fluorine-doped tin oxide (FTO). As a consequence, sunlight (visible radiation) can be finely controlled, but solar heat (NIR radiation) is semi-blocked or completely blocked (Kraft and Rottmann, 2009). To overcome this shortcoming, several solutions have been suggested. Plasmonics was used to fabricate first a dual-band smart windows with selective and independent control of visible and NIR radiation, and later three-mode smart windows displaying bright mode (visible and NIR admitted), cool mode (visible admitted and NIR blocked), and dark mode (visible and NIR blocked) (Llordes et al., 2013; Kim et al., 2015). A sterile smart window composed of plasmonic gold nanostructures combined with WO3 was able to control optical transmission and photothermal conversion of visible and NIR lights (Xu et al., 2018). Completely different approaches were adopted more recently. An Al3+ intercalation/deintercalation-enabled dual-band smart window which demonstrated efficient and independent control of visible and NIR light T was introduced (Zhang et al., 2018). The combination of an active electrode layer of vanadium-modified titanium oxide with a nanocrystalline WO3 layer resulted in an ECD switchable across four distinct optical modes (fully transparent, visible blocked, NIR blocked, and visible plus NIR blocked) upon application of low voltages (Barawi et al., 2018). Recently we proposed the use of NIR-transparent TCOs enabling simultaneous modulation of light and heat (Fernandes et al., 2018; Cardoso et al., 2019; Nunes et al., 2019).
The electrolyte is another fundamental component of the ECD. It must exhibit high transparency to visible light, good adhesion to the electrodes, appropriate mechanical properties, high thermal stability, high ionic conductivity, and high electrochemical stability within the switching voltage range. With this goal in mind, we devoted significant efforts to the synthesis of sol-gel derived electrolytes (henceforth designated as ormolytes – organically modified silicate electrolytes) based on di-urea cross-linked poly(oxyethylene) (POE)/silica (di-ureasil) and di-urethane cross-linked poly(epsilon-caprolactone) PCL(530)/silica host hybrid matrices doped with alkaline metal salts (Nunes et al., 2007; Fernandes et al., 2011b, 2017; Pereira et al., 2016), transition metal salts (Alves et al., 2013), lanthanide metal salts (Leones et al., 2014; Alves et al., 2018; Nunes et al., 2019), mixtures of alkaline and lanthanide metal salts (Fernandes et al., 2011a, 2014a), mixtures of an alkaline metal triflate salt and a lanthanide complex (Fernandes et al., 2014b), mixtures of an alkaline metal salt and an ionic liquid (IL) (Fernandes et al., 2015), or solely an IL (Neto et al., 2015; Cardoso et al., 2019). In the last decade we also focused our attention on the synthesis of polymer electrolytes based on natural host polymers, such as polysaccharides [chitosan (Alves et al., 2018), kappa-carrageenan (Nunes et al., 2017, 2019), gelatin (Alves et al., 2013), and gellam gum (Neto et al., 2015)] and proteins [deoxyribonucleic acid (DNA) (Leones et al., 2014) and silk fibroin (Pereira et al., 2016)].
Herein we propose a new ormolyte for ECDs composed of the di-urethane cross-linked POE/silica matrix (di-urethanesil) d-Ut(600) (where 600 is the average molecular weight of the POE chain, corresponding to 8.5 oxyethylene repeat units) (Gonçalves et al., 2004, 2005) doped with lithium triflate (LiCF3SO3). This series of materials, introduced in a previous study (Gonçalves et al., 2010), was represented by the notation d-Ut(600)nLiCF3SO3 (where n, the composition, is the molar ratio between the oxyethylene chains and the Li+ ions). We demonstrated that the sample with the highest ionic conductivity was a powder with n = 1 (7.4 × 10⁻⁵ and 1.3 × 10⁻³ S cm–1 at 24 and 100°C, respectively) (Gonçalves et al., 2010). In the present work we decided to select the d-Ut(600)10LiCF3SO3 ormolyte film instead, on account of its high transparency, acceptable ionic conductivity (2.47 × 10⁻⁶ and 2.24 × 10⁻⁴ S cm–1, at 23 and 97°C, respectively) and significantly better mechanical properties. With the goal of further increasing the ionic conductivity of this ormolyte, we incorporated, apart from LiCF3SO3, the 1-butyl-3-methylimidazolium chloride ([Bmim]Cl) IL. ILs are extremely interesting compounds in the context of energy materials, owing to a myriad of attractive properties, which include non-volatility, non-flammability, recyclability, and good thermal, chemical and electrochemical stability (Ohno, 2005; MacFarlane et al., 2014, 2016; Watanabe et al., 2017). [Bmim]Cl was chosen because it is practically non-toxic (Fujita et al., 2019), and has high hydrogen bonding basicity associated with the high tendency of the chloride ion to form hydrogen bonds with other species (Holbrey et al., 2003; Saha et al., 2003; Satoshi et al., 2003). The thermal properties, morphology, structure, and ionic conductivity of the materials synthesized were studied. The d-Ut(600)10LiCF3SO3[Bmim]Cl ormolyte was tested in a glass/ITO/a-WO3/d-Ut(600)10LiCF3SO3[Bmim] Cl/c-NiO/ITO/glass (where a and c stand for amorphous and crystalline, respectively) ECD, the electro-optical performance of which was characterized in depth.
Results and Discussion
Physical-Chemical Characterization
The X-ray diffraction (XRD) patterns, and the differential scanning calorimetry (DSC) and thermal gravimetric analysis (TGA) curves of d-Ut(600)10LiCF3SO3[Bmim]Cl (blue lines) are shown in Figures 1a–c, respectively.
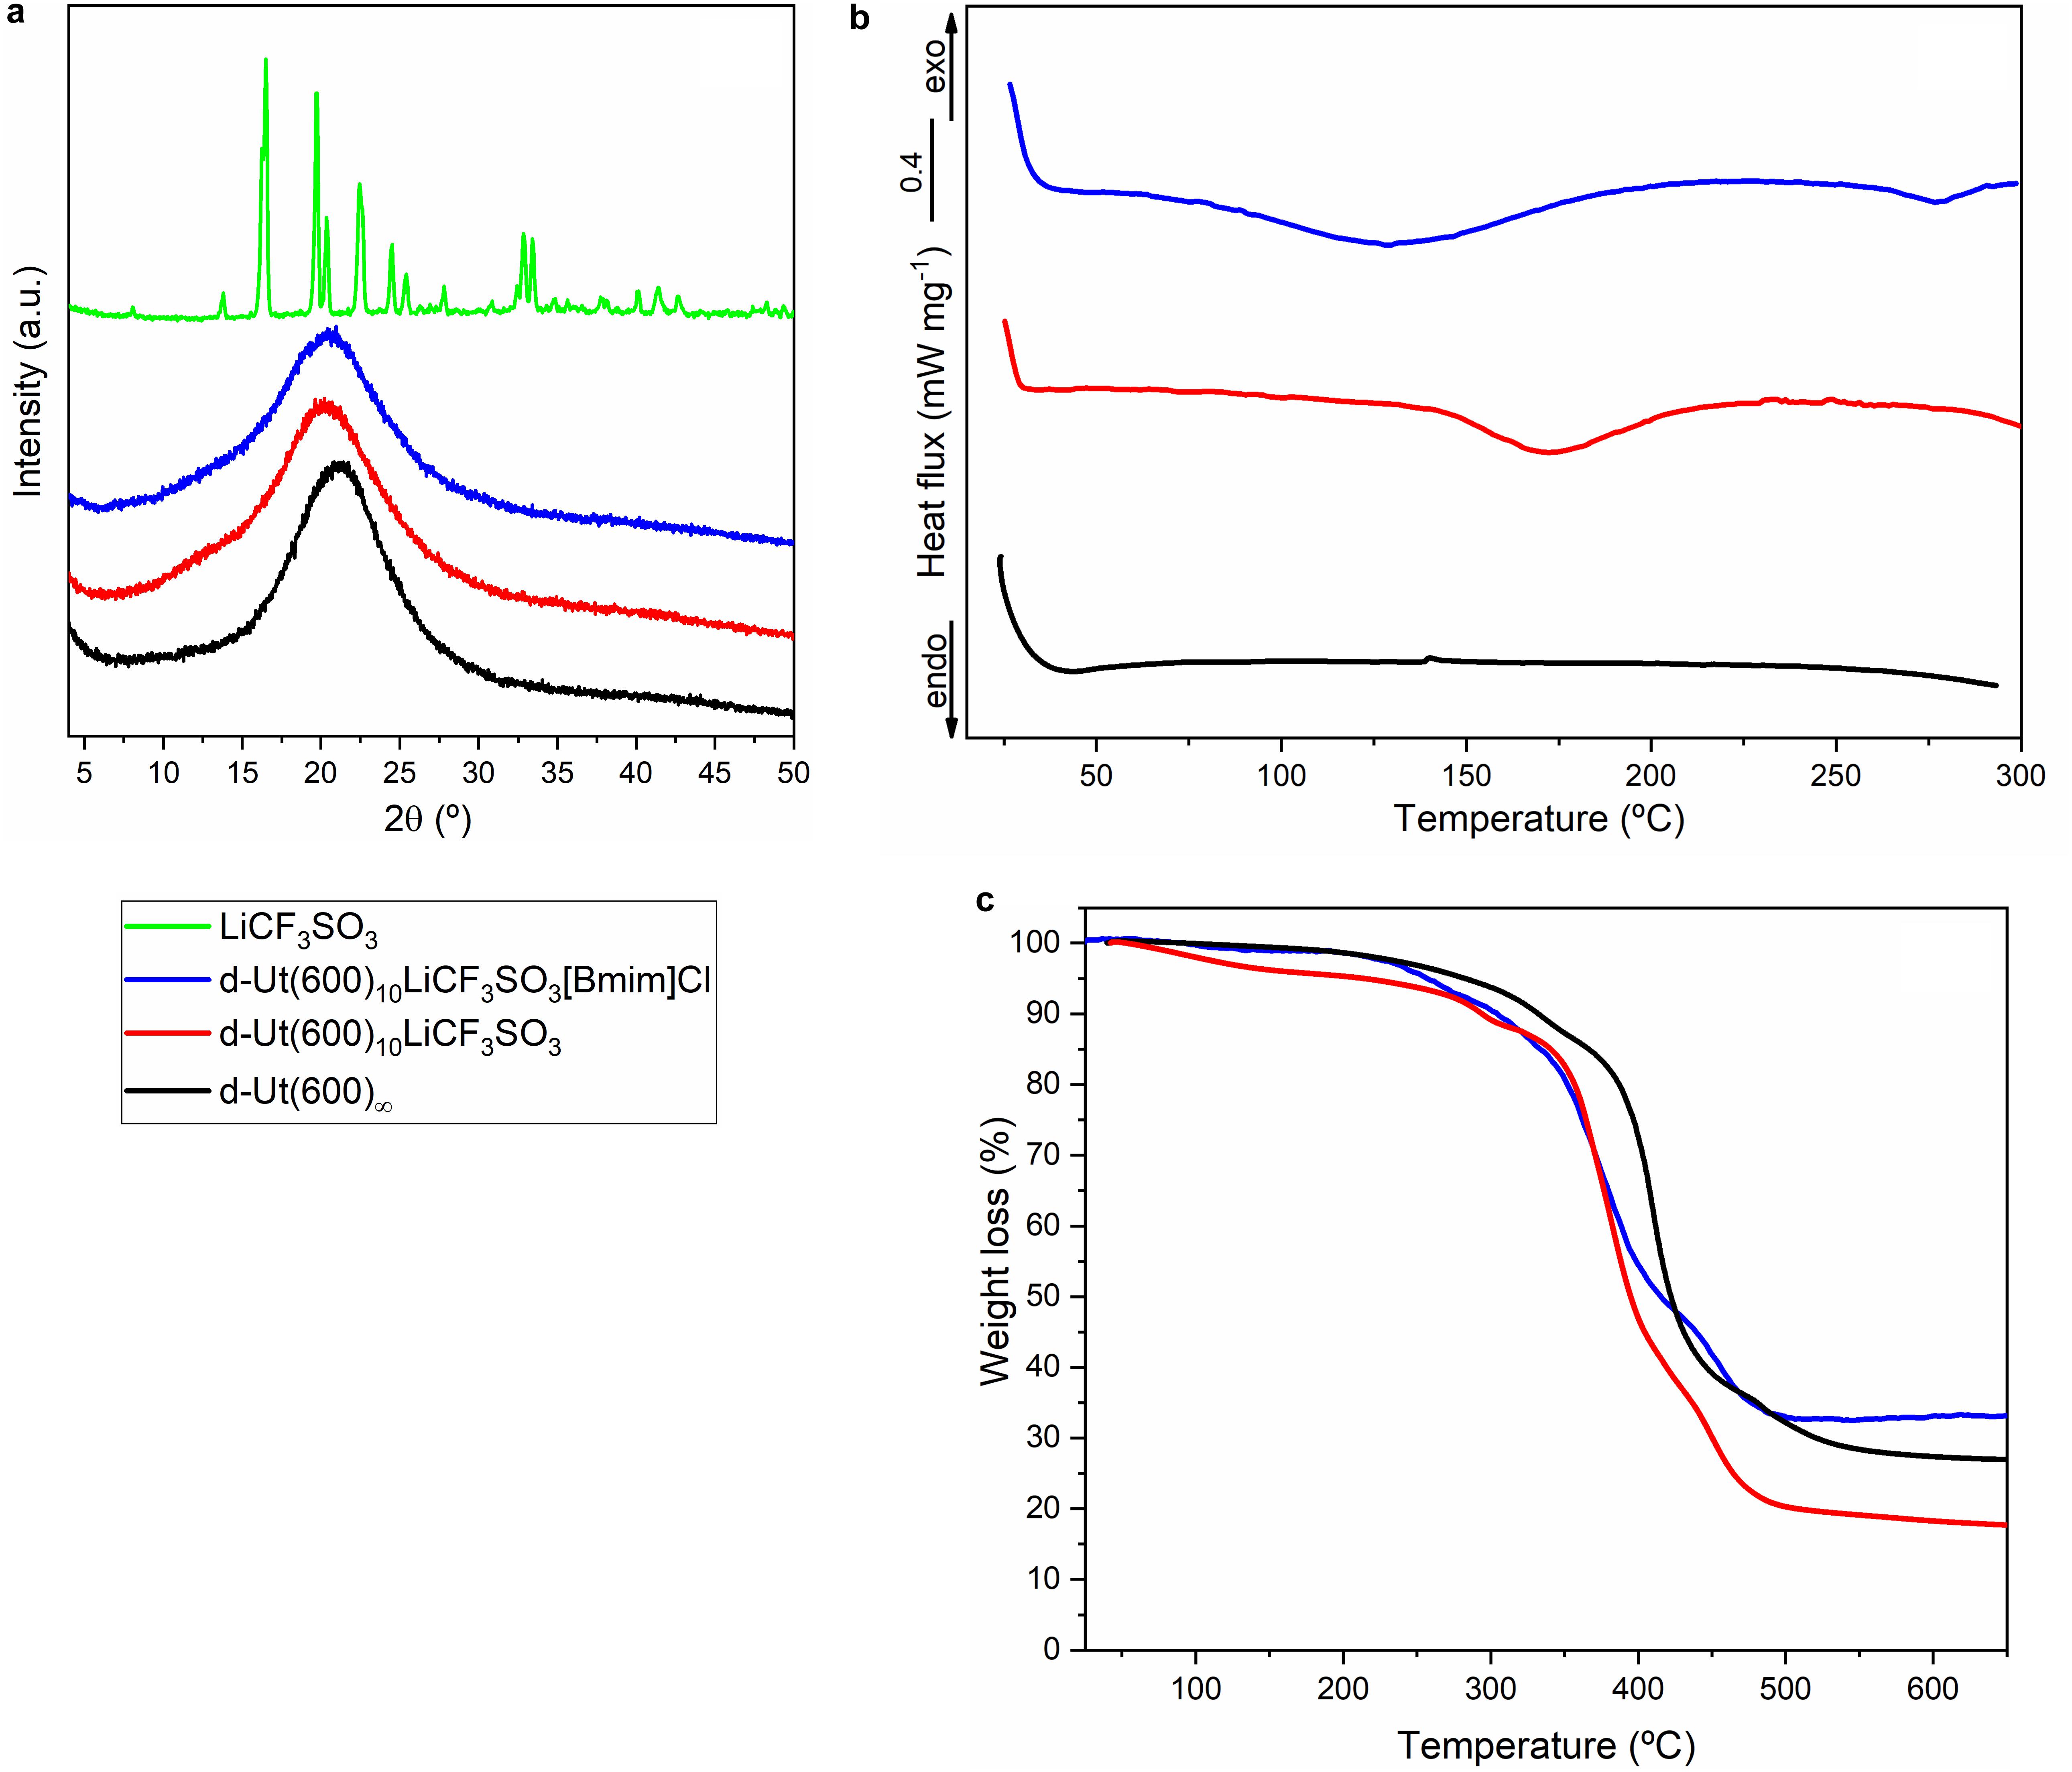
Figure 1. XRD patterns (a), and DSC (b) and TGA (c) curves of d-Ut(600)∞ (black line) (Gonçalves et al., 2005), d-Ut(600)10LiCF3SO3 (red line) (Gonçalves et al., 2010), d-Ut(600)10LiCF3SO3[Bmim]Cl (blue line), and LiCF3SO3 salt (green line) (Gonçalves et al., 2010).
The analysis of the XRD pattern of d-Ut(600)10LiCF3 SO3[Bmim]Cl (Figure 1a, blue line) allows concluding that this ormolyte is totally amorphous, a result also found in the case of d-Ut(600)∞ (Gonçalves et al., 2005; Figure 1a, black line) and d-Ut(600)10LiCF3SO3 (Gonçalves et al., 2010; Figure 1a, red line). In fact none of the characteristic peaks of the XRD pattern of LiCF3SO3 (Gonçalves et al., 2010; Figure 1a, green line) is detected. The structure of this salt is in the monoclinic system, space group P21c, and unit cell dimensions a = 10.2432(2) Å, b = 5.0591(1) Å, c = 9.5592(3) Å, β = 90.319(2)° (Tremayne et al., 1992). The broad peak centered at 20.0-21.6° in the XRD patterns of the three di-urethanesils is attributed to the coherent diffracting domains of the siliceous framework (Carlos et al., 1999). The structural unit distance, calculated using the Bragg law, is approximately 0.41–0.43 nm.
The DSC curve of d-Ut(600)10LiCF3SO3[Bmim]Cl displays a broad endothermic peak centered at ca. 129 °C (onset at about 54 °C) (Figure 1b, blue line). This thermal event is attributed to the loss of chemically and/or physically bonded water molecules and solvents ethanol (CH3CH2OH) and/or tetrahydrofuran (THF). This explanation is corroborated by the TGA curve of d-Ut(600)10LiCF3SO3[Bmim]Cl which reveals that a progressive loss of mass occurred immediately after starting the experiment (Figure 1c, blue line).
The scanning electron microscopy (SEM) image of d-Ut(600)10LiCF3SO3[Bmim]Cl, shown in Figure 2a, demonstrates that this sample has a homogeneous texture. Polarized optical microscopy (POM) data revealed that, although d-Ut(600)10LiCF3SO3[Bmim]Cl is essentially amorphous, as pointed out by the XRD data, it exhibits a minor proportion of anisotropic submicrometer domains, of unknown origin, responsible for the birefringence observed (Figure 2b).
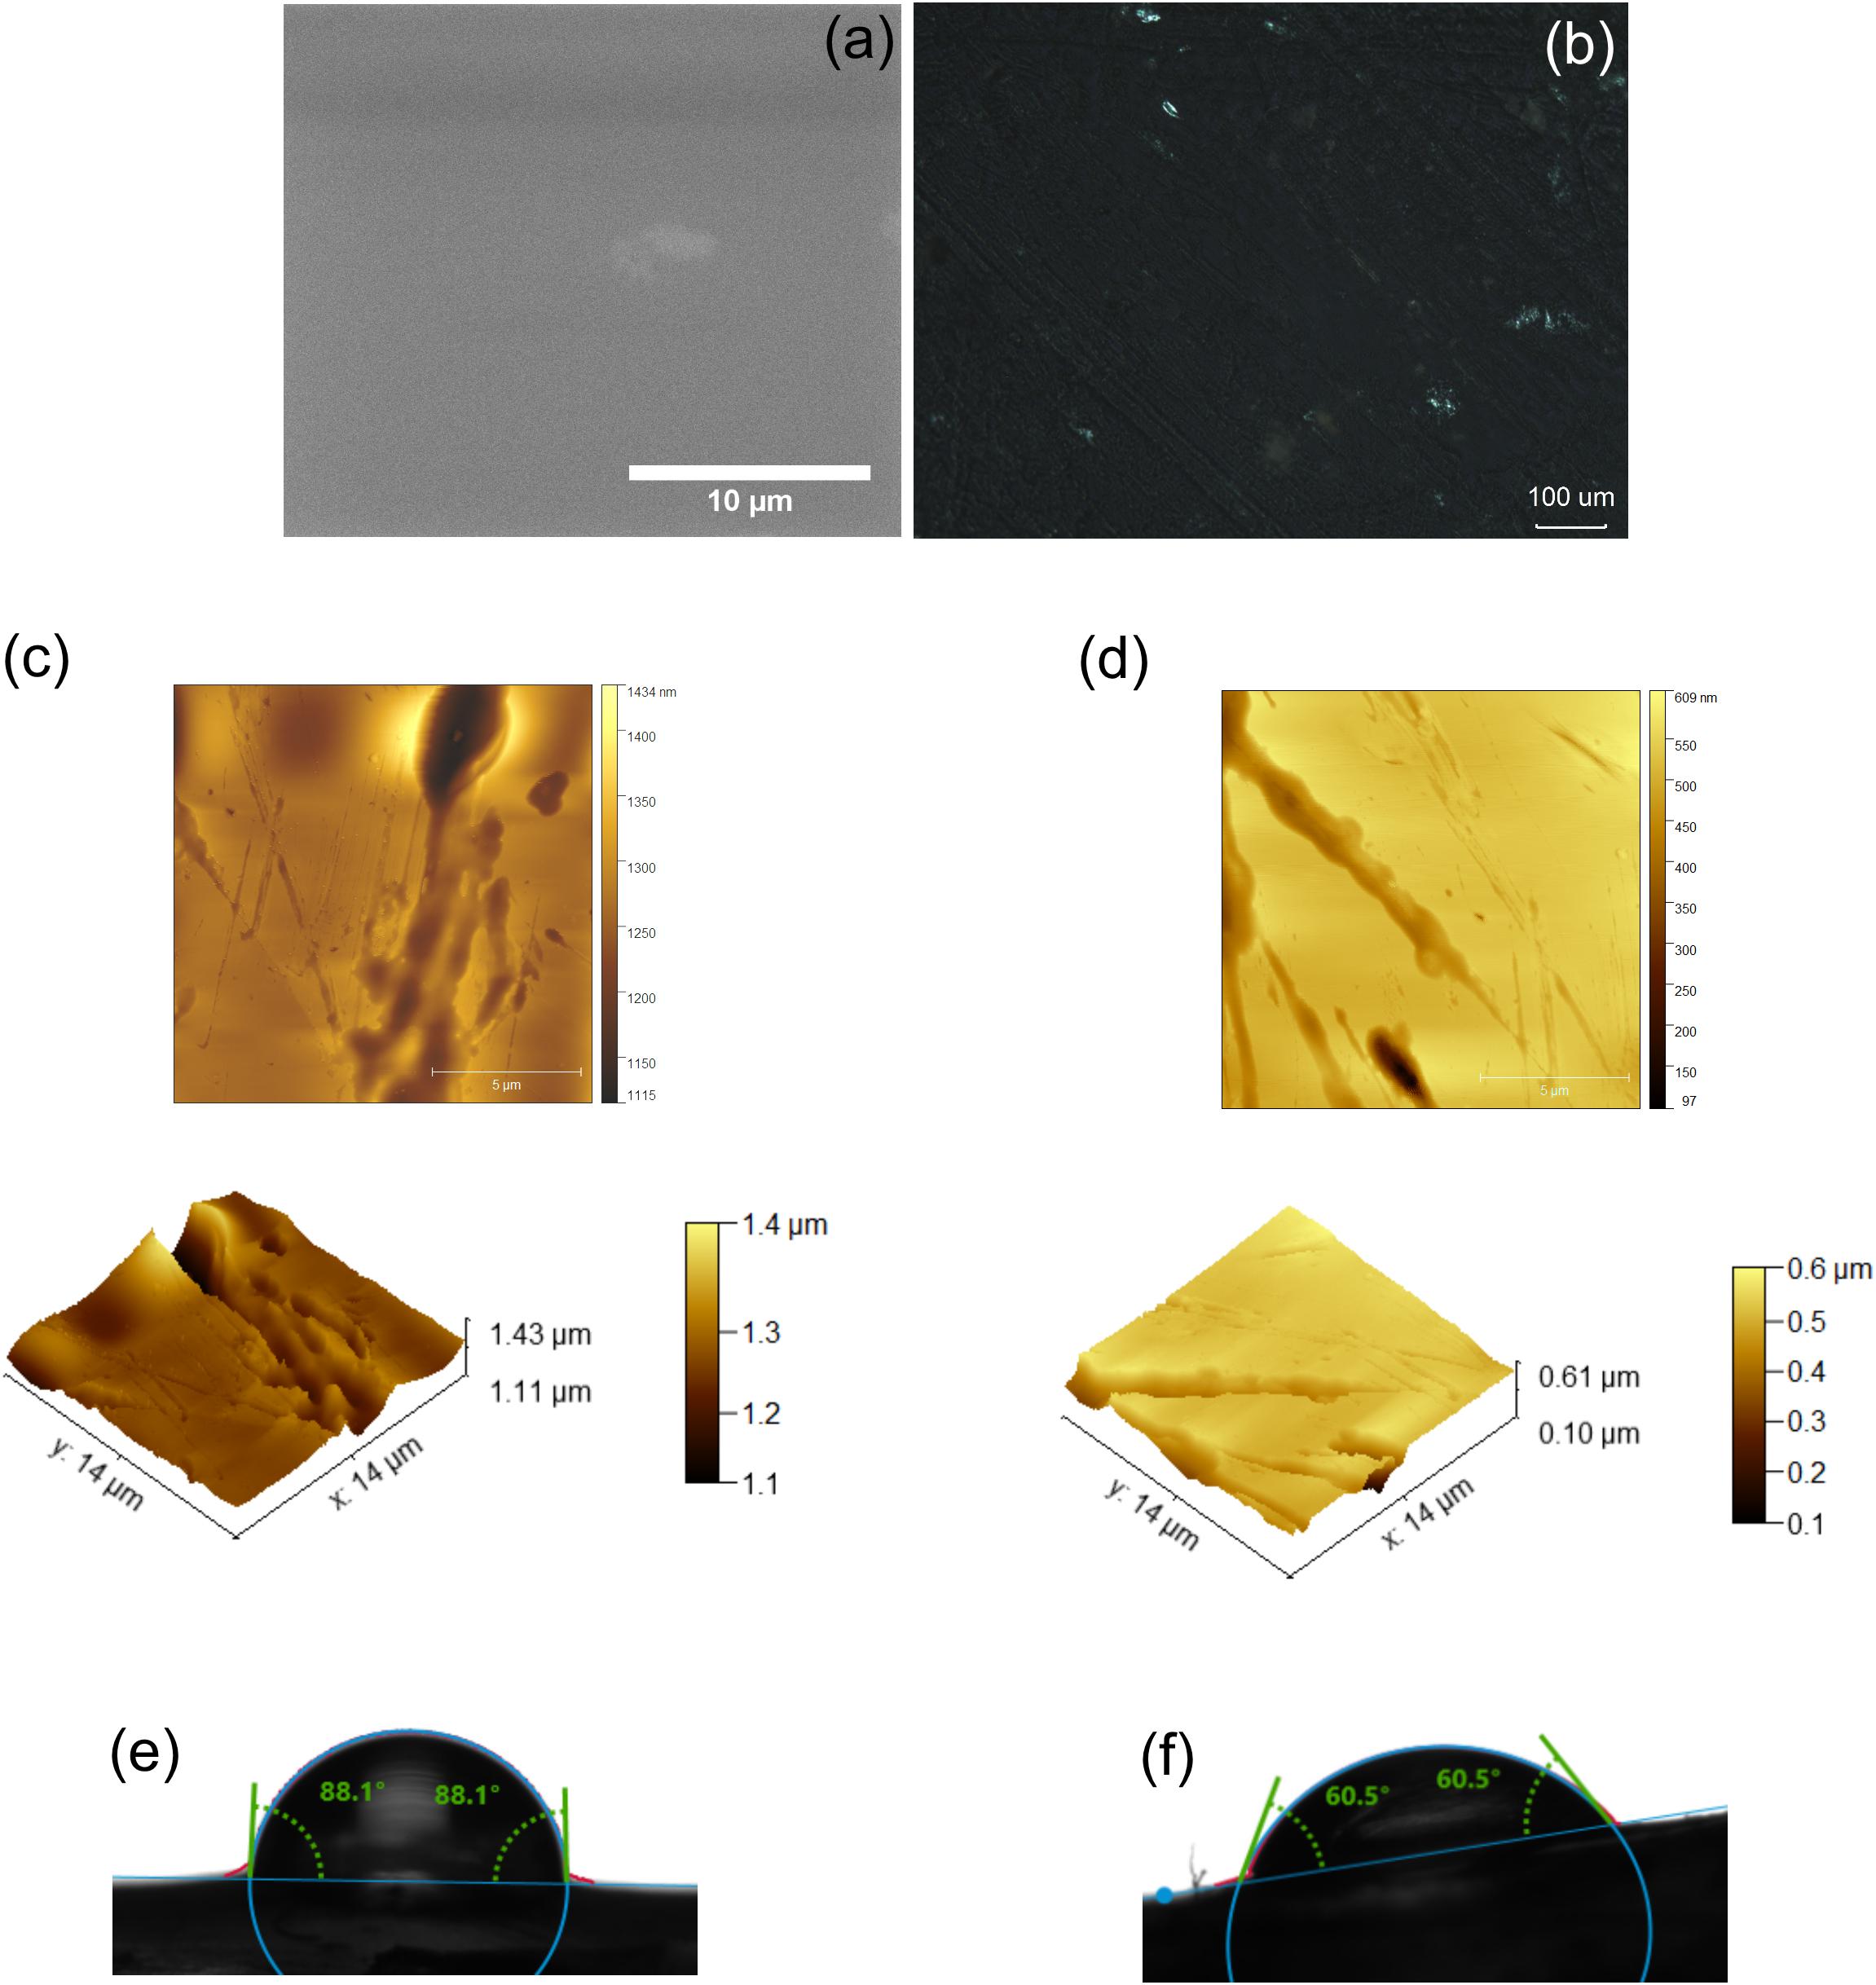
Figure 2. SEM (a) and POM (crossed polarizers) (b) images of d-Ut(600)10LiCF3SO3[Bmim]Cl. AFM (topographical (top) and 3D-topographical (bottom)) images of d-Ut(600)10LiCF3SO3 (c) and d-Ut(600)10LiCF3SO3[Bmim]Cl (d). Selected photographs of static water contact angle measurements of d-Ut(600)∞ (e) and d-Ut(600)10LiCF3SO3[Bmim]Cl (f).
To ascertain the influence of [Bmim]Cl on the surface of the xerogels, d-Ut(600)10LiCF3SO3 and d-Ut(600)10LiCF3SO3 [Bmim]Cl were examined by atomic force microscopy (AFM) (Figures 2c,d, respectively). The AFM data revealed, not only that both samples are homogenous, but also that a 50% decrease in the medium surface roughness value occurred upon IL addition (from 6.34 to 3.01 nm). The small defects and patterns observed on the surface of these materials mimic the imperfections on the mold where both sols were left to gel and subsequently dry. This quite interesting effect means that these xerogels are attractive candidates as coatings for topographical patterning purposes.
The static water contact angle measured for d-Ut(600)∞ was 90.39 ± 7.74° (Figure 2e). This is the value considered to be ideally the borderline between hydrophilic and hydrophobic behaviors. The values obtained for d-Ut(600)10LiCF3SO3 and d-Ut(600)10LiCF3SO3[Bmim]Cl (Figure 2f) (58.05 ± 13.36° and 63.39 ± 6.06°, respectively) show that the inclusion of LiCF3SO3 and [Bmim]Cl led to the increase of the hydrophilicity of the materials. This result is not surprising, considering the marked hygroscopic character of both these compounds.
The Fourier transform infrared (FT-IR) spectra of the d-Ut(600)10LiCF3SO3 and d-Ut(600)10LiCF3SO3[Bmim]Cl di-urethanesils in the “amide I” region (1800–1600 cm–1), represented in Figure 3a, were examined to evaluate the influence of LiCF3SO3 and [Bmim]Cl on the extent and magnitude of the hydrogen bonded network of d-Ut(600)∞ (Skrovanek et al., 1985).
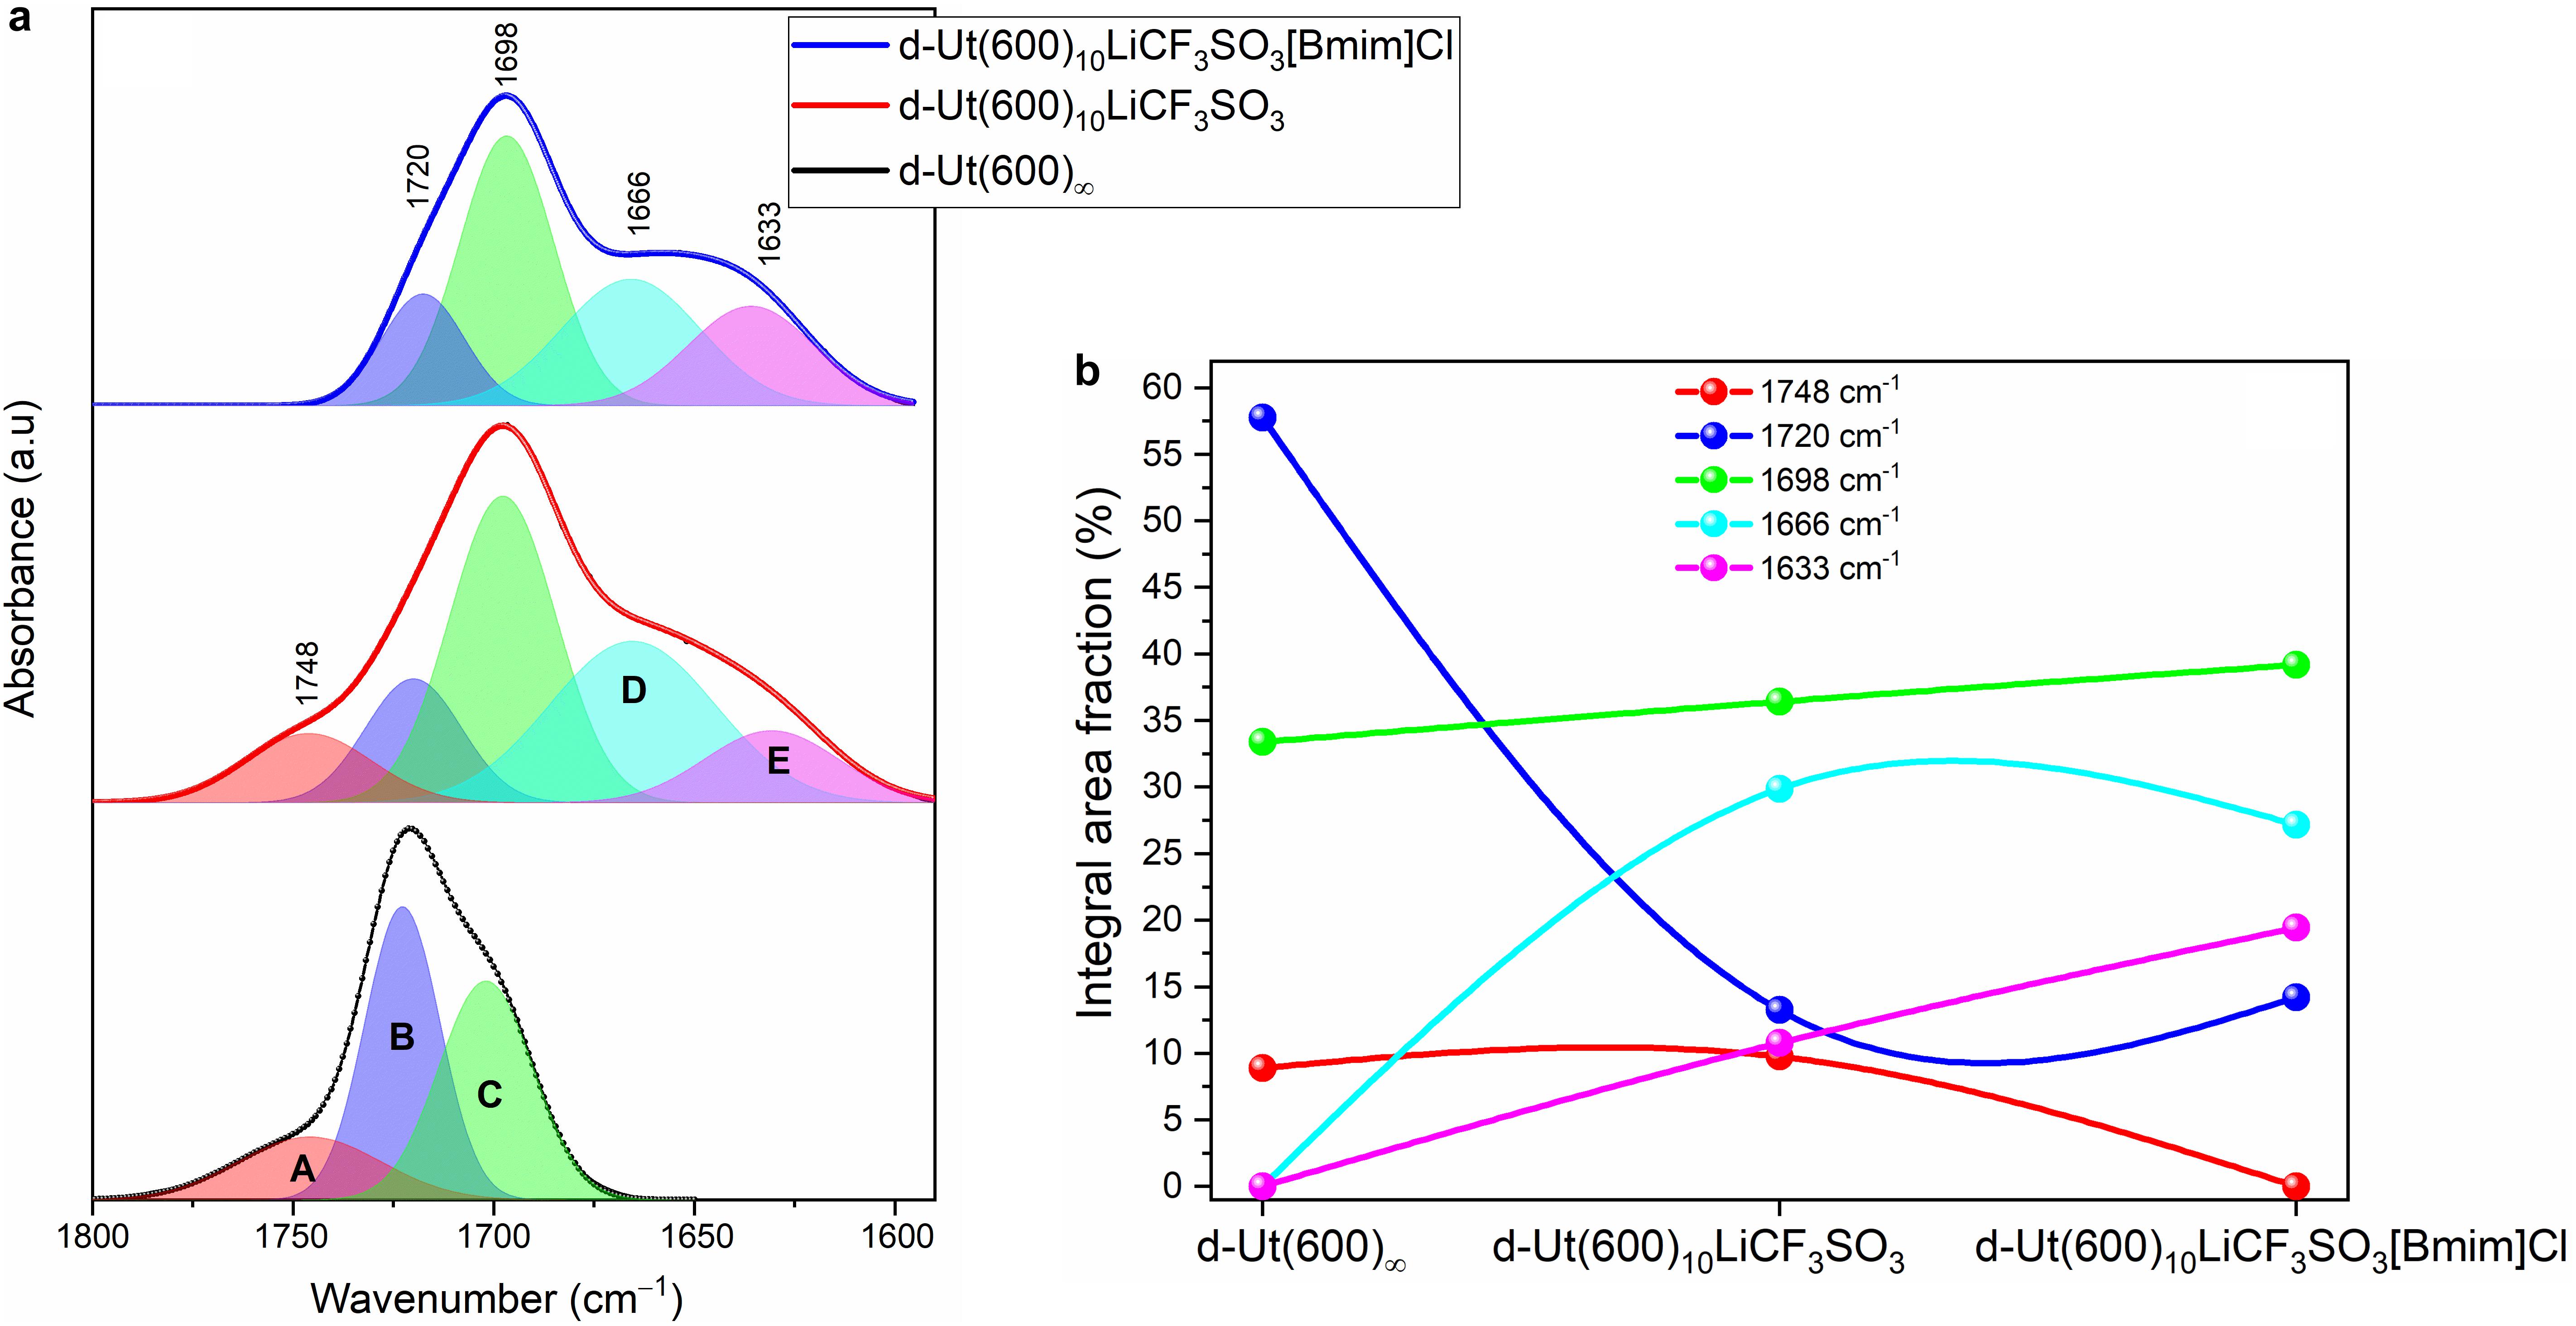
Figure 3. Curve-fitting results (a) of the FT-IR spectra in the “amide I” region of d-Ut(600)∞ (black line), d-Ut(600)10LiCF3SO3 (red line) and d-Ut(600)10LiCF3SO3[Bmim]Cl (blue line). Integral area fraction (b) of the “amide I” bands of the d-Ut(600)∞, d-Ut(600)10LiCF3SO3 and d-Ut(600)10LiCF3SO3[Bmim]Cl. The lines are a guide for the eyes.
The “amide I” envelope of the d-Ut(600)∞ was previously resolved into three distinct components centered at approximately 1748 (A), 1720 (B), and 1698 cm–1 (C) (Figure 3a; Gonçalves et al., 2010). The 1748 cm–1 band was assigned to urethane linkages whose N-H and C=O groups are non-bonded (de Zea Bermudez et al., 2004). The 1720 cm–1 event was attributed to the absorption of hydrogen-bonded C=O groups in disordered aggregates (urethane-POE aggregates) (de Zea Bermudez et al., 2004), whereas the band located at 1698 cm–1 was associated with the absorption of C=O groups belonging to considerably more ordered hydrogen-bonded aggregates (urethane-urethane aggregates) (de Zea Bermudez et al., 2004).
The presence of the lithium salt and [Bmim]Cl in the host hybrid matrix gave rise to a series of marked changes in the “amide I” region. Figure 3a shows that the intensity maximum of the “amide I” profile shifted to lower wavenumbers (from 1720 to 1698 cm–1) when solely LiCF3SO3 (d-Ut(600)10LiCF3SO3) or a mixture of lithium salt plus IL [d-Ut(600)10LiCF3SO3[Bmim]Cl] were incorporated, indicating that the strength of the hydrogen bonds globally increased. Figure 3a also reveals that the band position of the three components found in the spectrum of d-Ut(600)∞ remained unaffected by the introduction of LiCF3SO3. In contrast when the mixture of the guest salt and IL was added, the band at 1748 cm–1 vanished. In addition, in the FT-IR spectra of the doped di-urethanesils two new components, located at approximately 1666 and 1633 cm–1, are detected.
Figure 3b shows the composition dependence of the integral area fraction of the resolved 1748, 1720, 1698, 1666, and 1633 cm–1 components. The analysis of this graph allows inferring that in the d-Ut(600)10LiCF3SO3 ormolyte the proportion of non-bonded C=O groups remained practically the same (Figure 3b, red symbols) as that found in d-Ut(600)∞, whereas the fraction of urethane-urethane aggregates increased slightly (Figure 3b, green symbols) and the amount of urethane-POE aggregates decreased dramatically (Figure 3b, blue symbols). In addition, two new ordered hydrogen-bonded aggregates (D and E), with increasing strength, emerged (Figure 3b, cyanide and pink symbols). Based on previous observations (de Zea Bermudez et al., 2004), we propose that the latter aggregates, formed at the expense of a major destruction of urethane-POE aggregates, contain urethane C=O groups strongly bonded to Li+ ions. In the case of d-Ut(600)10LiCF3SO3[Bmim]Cl the most significant effects discerned in the “amide I” region are the absence of non-bonded C=O groups, and the increase of the fraction of the strongest aggregates (E). Considering that the salt concentration is identical in both d-Ut(600)10LiCF3SO3 and d-Ut(600)10LiCF3SO3[Bmim]Cl, these findings indicate that the incorporation of the IL increased, as expected, the extent of hydrogen bonding throughout the material, and simultaneously favored the creation of more Li+… O = C contacts.
Ionic Conductivity
At room temperature the ionic conductivity of d-Ut(600)10LiCF3SO3[Bmim]Cl [3.64 × 10⁻⁶ S cm–1 at 21°C (Figure 4a, blue symbols/line)] is higher than those of d-Ut(600)∞ [2.00 × 10⁻⁸ S cm–1 (Figure 4a, black symbols/line)] and d-Ut(600)10LiCF3SO3 [2.47 × 10⁻⁶ S cm–1 (Figure 4a, red symbols/line) (Gonçalves et al., 2010)]. The highest ionic conductivity of the doped samples d-Ut(600)10LiCF3SO3 and d-Ut(600)10LiCF3SO3[Bmim]Cl is achieved near 100°C [2.24 × 10⁻⁴ S cm–1 (Figure 4a, red symbols/line) and 5.00 × 10⁻⁴ S cm–1 (Figure 4a, blue symbols/line), respectively]. We recall that, while electrolytes to be used in batteries should exhibit at least 10–5 S cm–1, for ECDs the requirements are considerably less stringent.
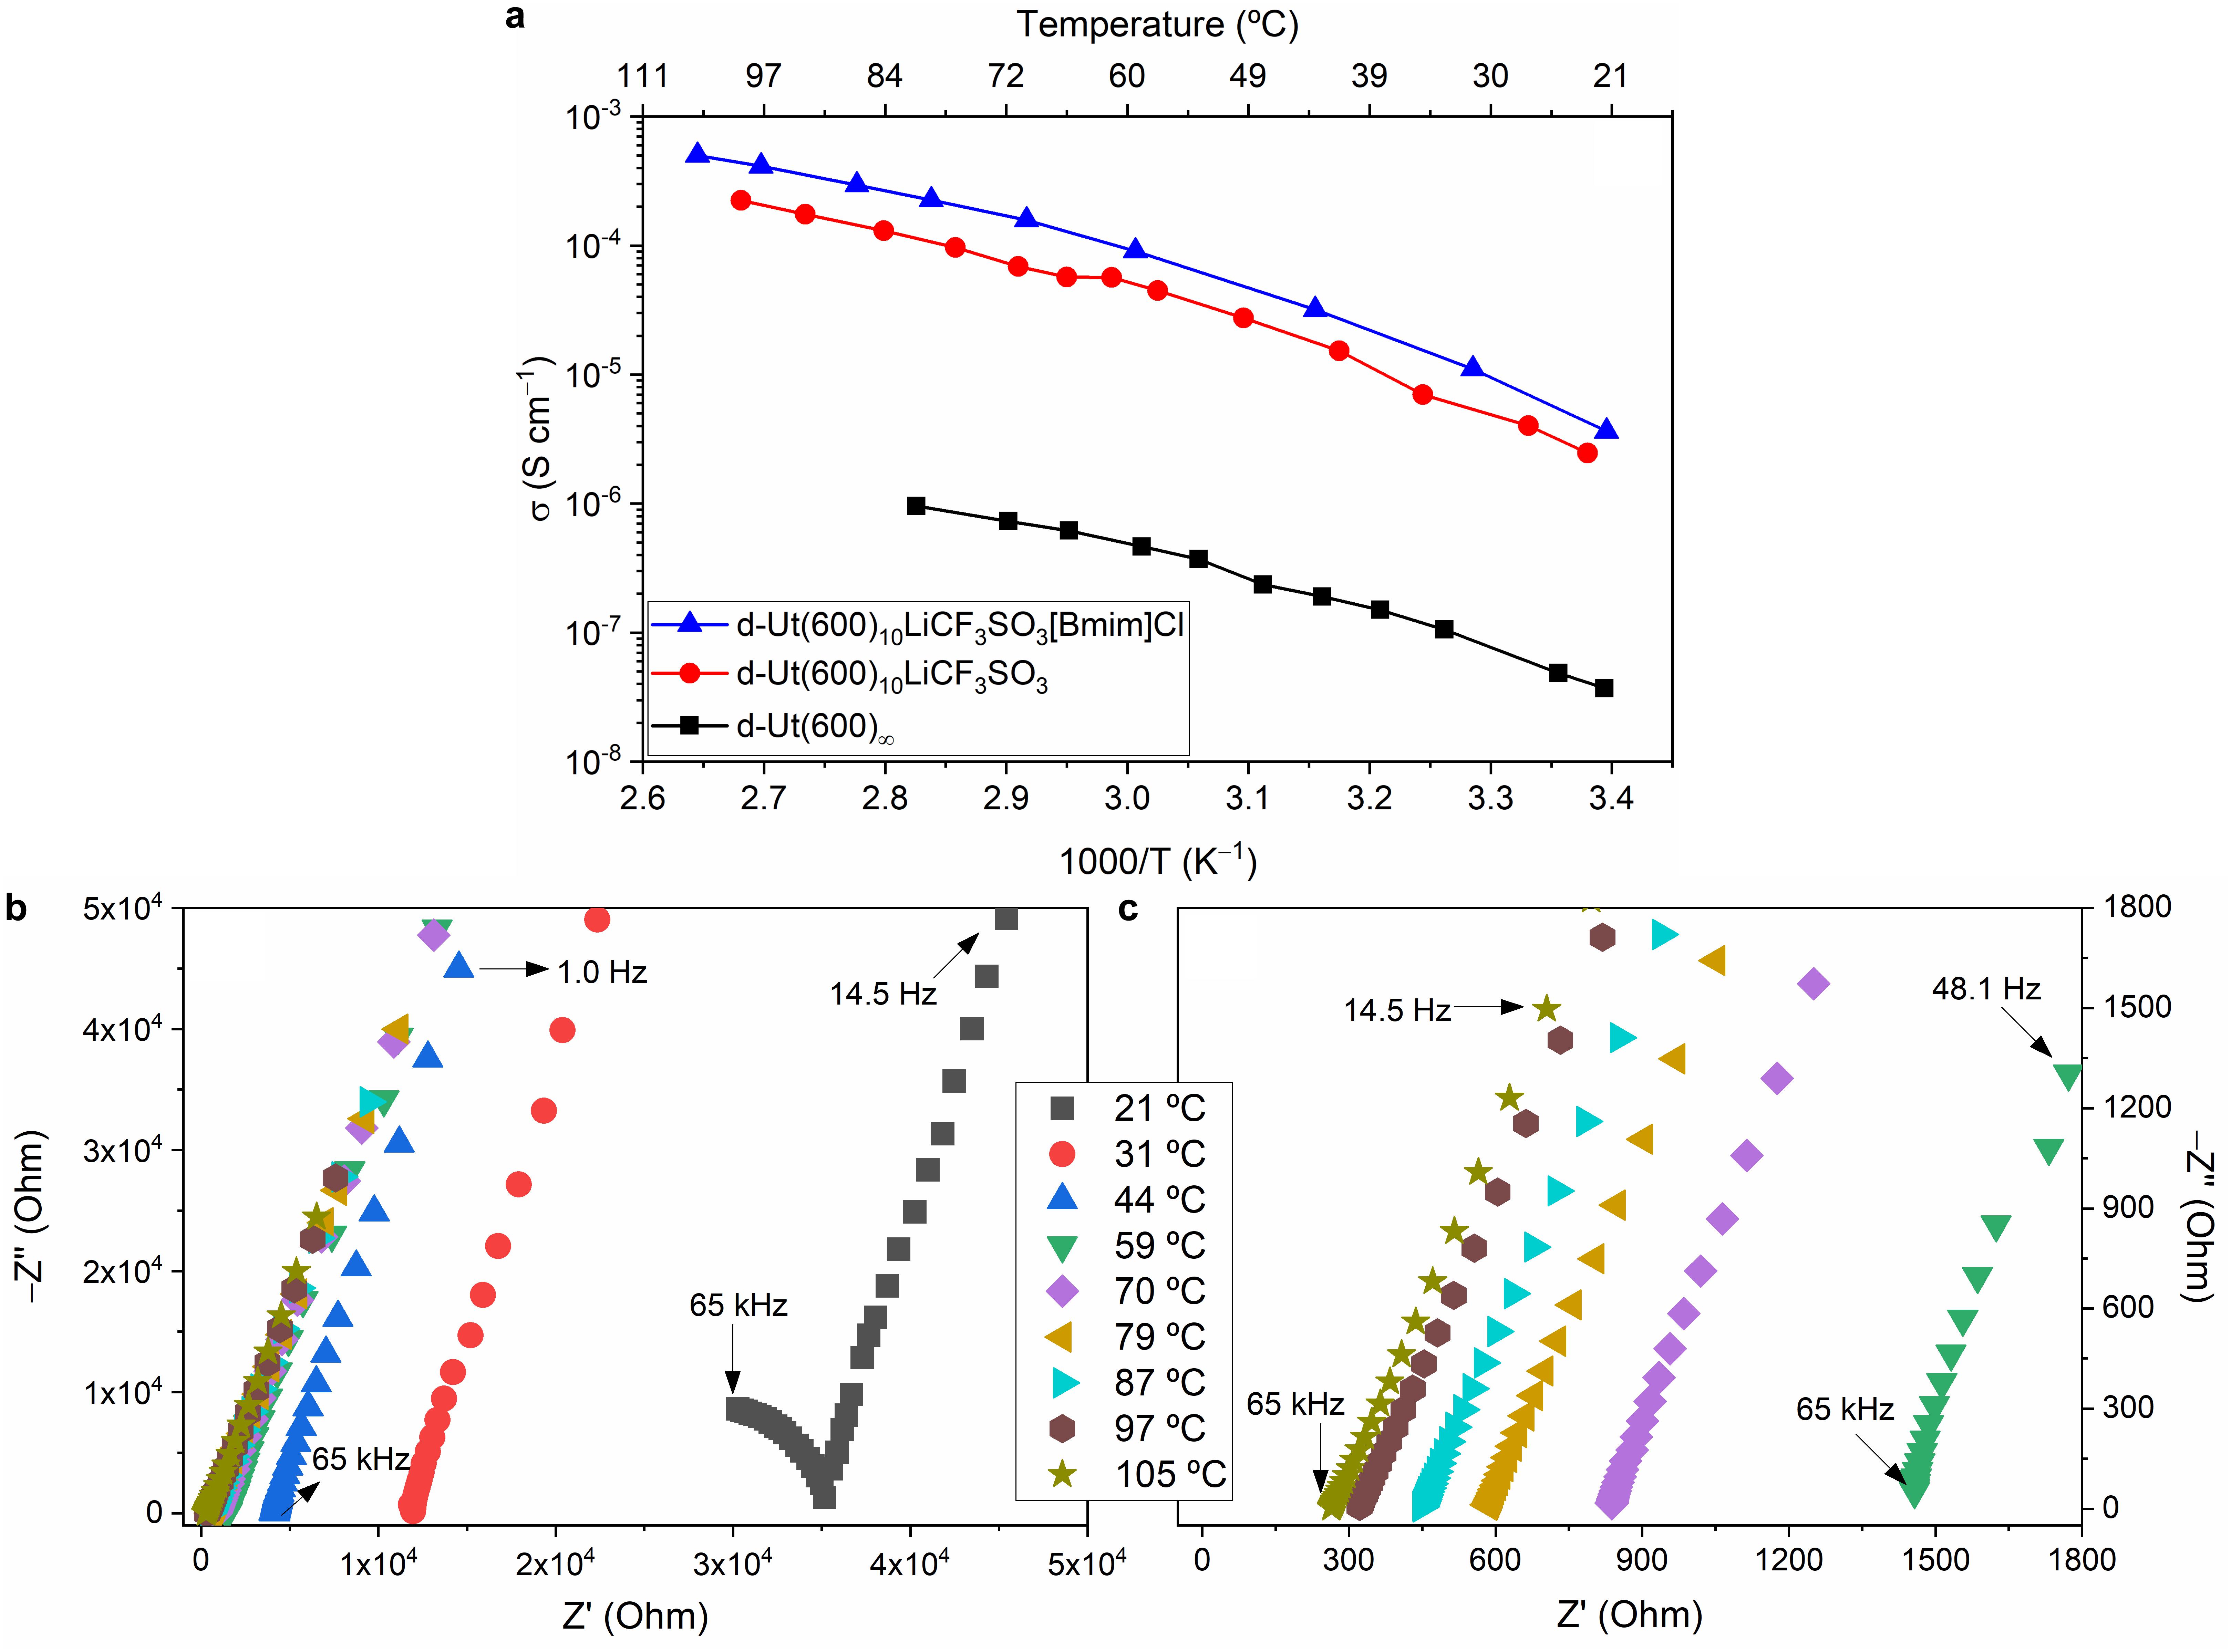
Figure 4. Ionic conductivity of d-Ut(600)∞ (black line) (Gonçalves et al., 2010), d-Ut(600)10LiCF3SO3 (red line) (Gonçalves et al., 2010), and d-Ut(600)10LiCF3SO3[Bmim]Cl (blue line) (a). The lines drawn are just a guide for the eyes. Nyquist plot (b) and zoom the 0–1800 Ohm interval (c) for d-Ut(600)10LiCF3SO3[Bmim]Cl.
Figures 4b,c show the Nyquist plot for d-Ut(600)10LiCF3SO3[Bmim]Cl at variable temperature. At 21°C a semicircle located in the high-frequency range that corresponds to the charge transfer process is detected. The straight line observed at lower frequency for higher temperatures is related to the diffusion process, i.e., the ormolyte/electrode interface (Park and Yoo, 2003; Chang and Park, 2010). Figures 4b,c demonstrate that the ionic conductivity increases with increasing temperature due to the increase of the free volume, polymer segmental mobility and charge mobility (Gray, 1991).
The three di-urethanesils exhibit a non-linear temperature dependence of the ionic conductivity described by the Vogel–Tammann–Fulcher (VTF) equation, typically adopted by disordered electrolytes. We note that the appreciable conductivity of the non-doped host matrix was correlated with proton hopping between the urethane cross-links (de Zea Bermudez et al., 1997). The slight enhancement of ionic conductivity observed upon addition of [Bmim]Cl is a clear indication that the IL led to an improvement of the ionic transport. Ionic conductivity is a transport property governed by the number and mobility of charge carriers, viscosity, and ionic charge. The presence of ILs affects the dipolar and ionic component of the host matrix due to the ionic character of the ILs and the presence of ion-dipole interactions. Moreover, the improvement of conductivity requires the low viscosity of the IL to increase the flexibility of the host polymer electrolyte and to promote the dissociation of paired ions.
Characterization of the ECDs
The following performance parameters were used to characterize the ECDs: the electrochromic contrast (ΔT = Tbleached – Tcolored, in %, at 555 nm), the coloration efficiency [CE = ΔOD/ΔQ, where ΔOD is the optical density change [Δ(OD) = −log(Tcolored/Tbleached)] and ΔQ is the amount of charge necessary to produce the optical change], the response time (time required for the coloring/bleaching process of an EC material), the optical memory (time the material retains its absorption state after the electrical field is removed), the 1976 Commission International d’Éclairage (CIE) L∗a∗b∗ color coordinates [where L∗ is the lightness (0 = black, 100 = diffuse white), a∗ is a red-green balance (+a∗ = red and −a∗ = green hues) and b∗ is a yellow-blue balance (+b∗ = yellow and −b∗ = blue)], and the cycling stability.
The two assembled ECD replicates were used to perform different studies. ECD1 was subject to voltages of variable magnitude: (1) +3.0 V for 200 s; (2) successively −1.0, −1.5, −2.0, and −2.5 V for 200 s each. The visible spectra were recorded after each step. A memory effect study was also conducted with ECD1. A voltage of −2.5 V was first applied for 200 s and then the device was left under open circuit. Visible spectra were then regularly registered during the 89 subsequent days. ECD2 was employed exclusively in the chronoamperometry (CA) experiments. In all the cases the voltage application resulted in homogeneous coloring of the entire area of the ECD (Figures 5d,e).
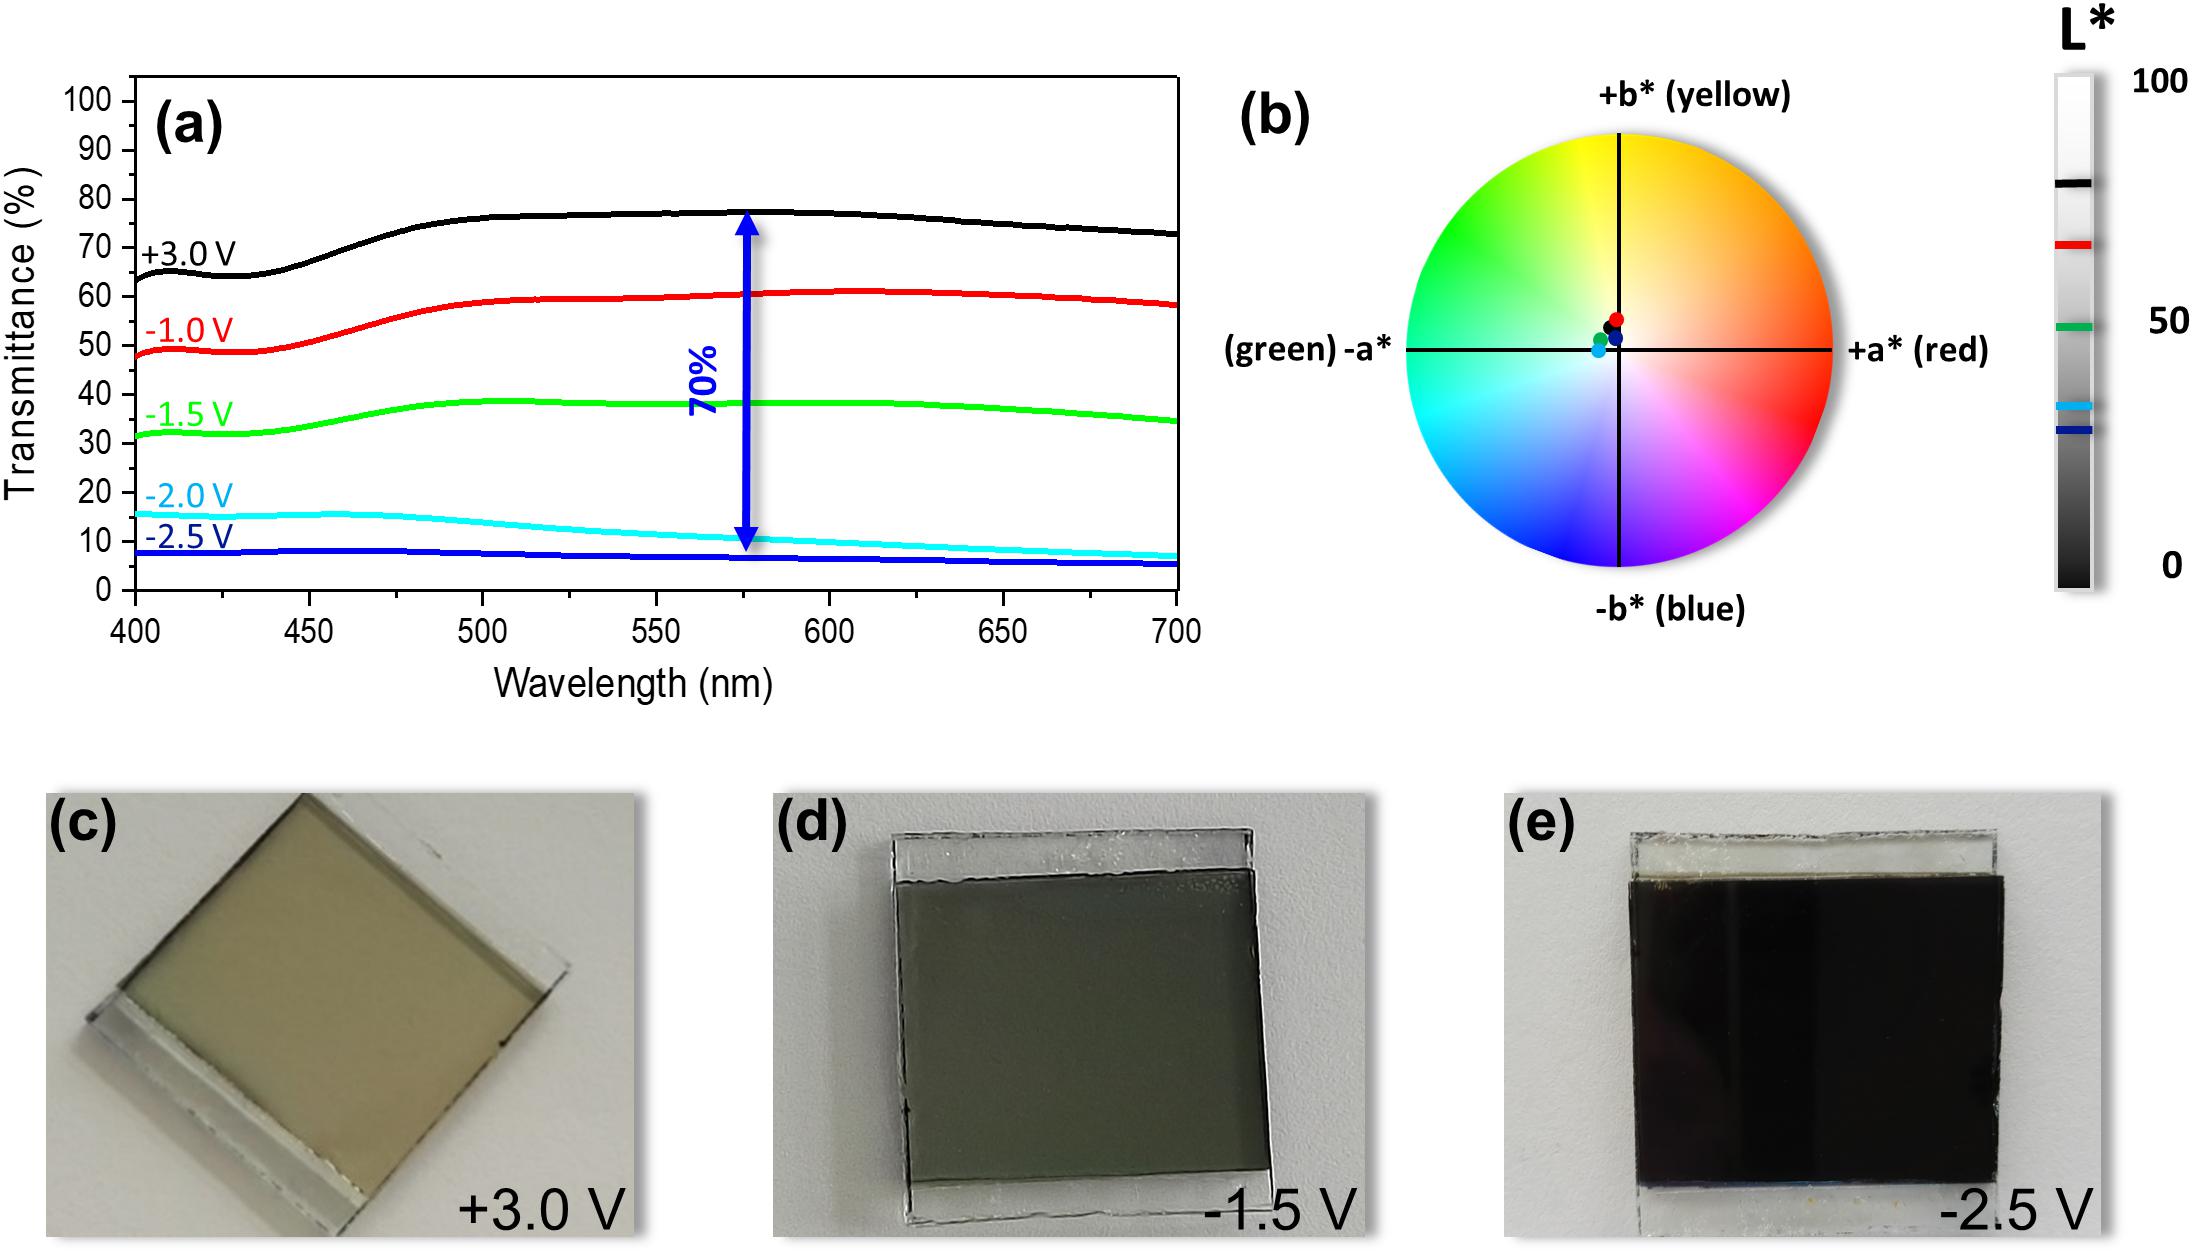
Figure 5. Transmission spectra in the visible region (a) and 1976 CIE L*a*b* color diagram (b) of the glass/ITO/a-WO3/d-Ut(600)10LiCF3SO3[Bmim]Cl/c-NiO/ITO/glass ECD: bleached state [bright mode, +3.0 V, black line, (c)] and colored states [semi-bright mode (–1.0 V, red line), dark mode [–1.5 V, green line, (d)], and very dark modes [–2.0 V, cyanide line, and –2.5 V, blue line, (e)].
The response times of the ECDs were 1–2 s for coloring and 50 s for bleaching. It is noteworthy that the time to color was thus much faster than that reported for the ECD including the di-ureasil d-U(2000) incorporating long POE chains and doped with a protonic IL (PIL) (Cardoso et al., 2019). The as-prepared ECD1 exhibited a T value of 73% at 555 nm. In the bleached state ECD1 exhibited a T value of 77% (Figure 5a, black line, Table 1) and a brownish hue (L∗ = 83.5, a∗ = −2.52, and b∗ = 5.86) (Figures 5b,c, black symbol, Table 1). The subsequent application of −1.0, −1.5, −2.0, and −2.5 V resulted in the progressive reduction of the T value to 60, 38, 11, and 7%, respectively, and of the progressive increment of the electrochromic contrast ΔT values to 17, 39, 66, and 70%, respectively (Table 2). Accordingly, the device became progressively darker (L∗ = 70.0, a∗ = −1.50, and b∗ = 7.90; L∗ = 50.6, a∗ = −5.66, and b∗ = 2.60 (Figure 5d); L∗ = 37.3, a∗ = −6.13, and b∗ = −0.32; and L∗ = 35.4, a∗ = −1.52, and b∗ = 3.33 (Figure 5e), respectively (Table 1). The maximum electrochromic and optical contrast values achieved upon application of −2.5 V [ΔT = 70% (Table 2) and ΔL∗ = 48.1 (Table 1), respectively] are of the same order of magnitude as those reported for the PIL-doped d-U(2000) (Cardoso et al., 2019; Table 2).
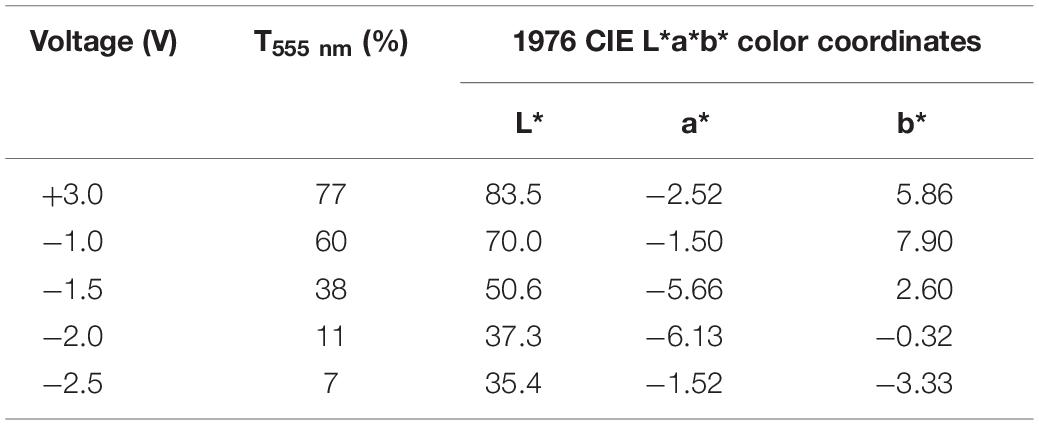
Table 1. Electro-optical parameters of the glass/ITO/a-WO3/d-Ut(600)10LiCF3SO3[Bmim]Cl/c-NiO/ITO/glass ECD.
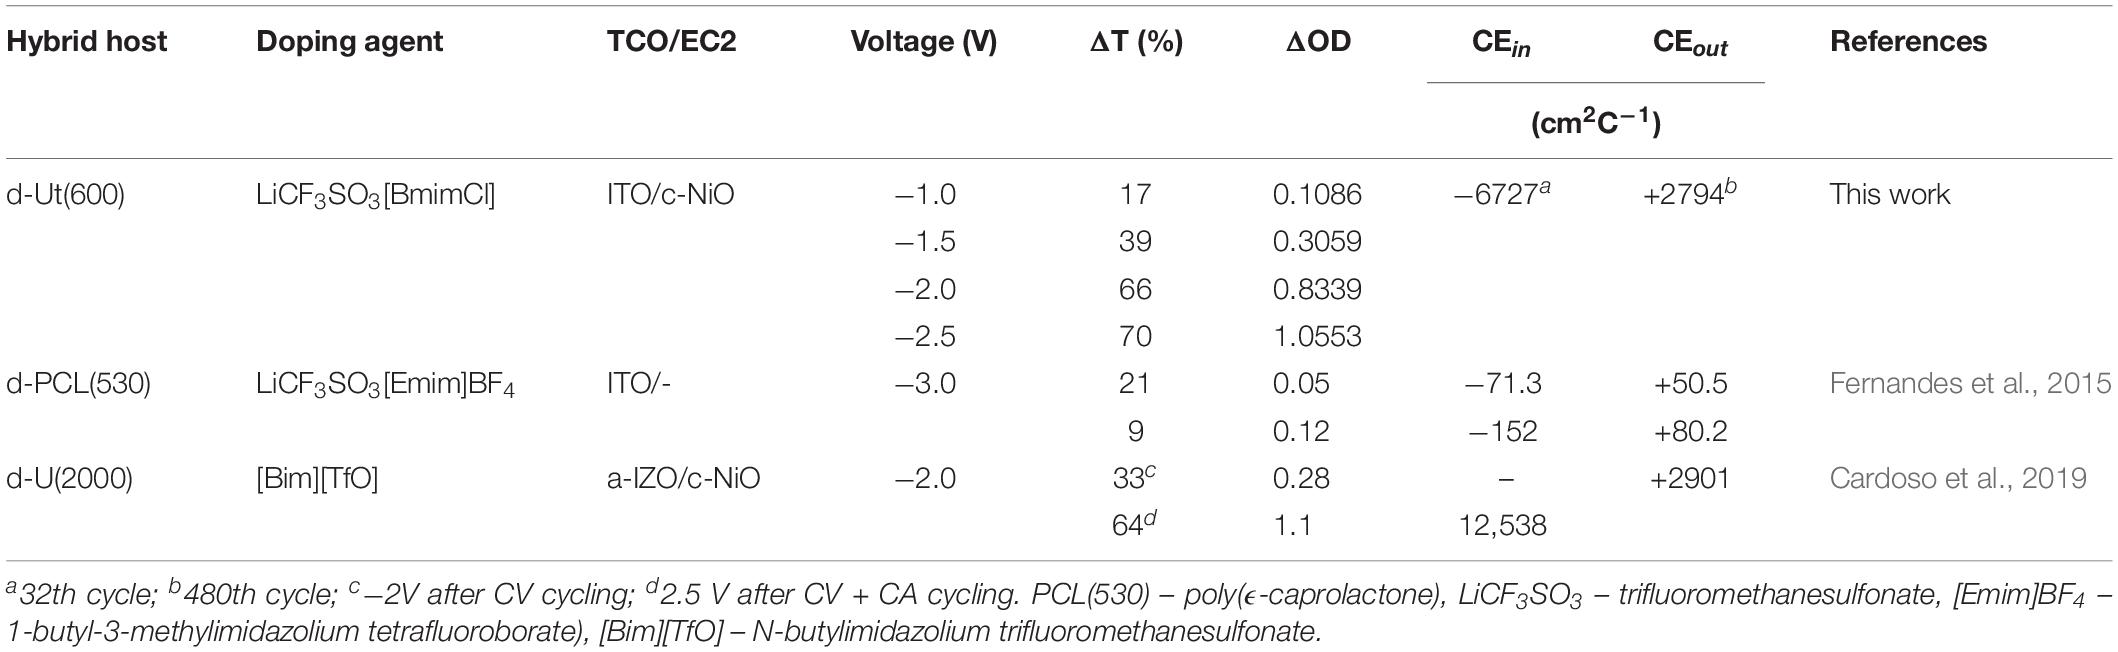
Table 2. Electro-optical parameters of ECDs with the configuration glass/TCO/WO3/ormolyte/EC2/TCO/glass.
Figure 6 proves that the device bleached under open-circuit at a very slow pace. After 3 months the colored state of ECD1 (T = 48%, corresponding to a loss of 41%) did not differ much from that obtained under the application of −1.5 V (T = 38%, Table 1).
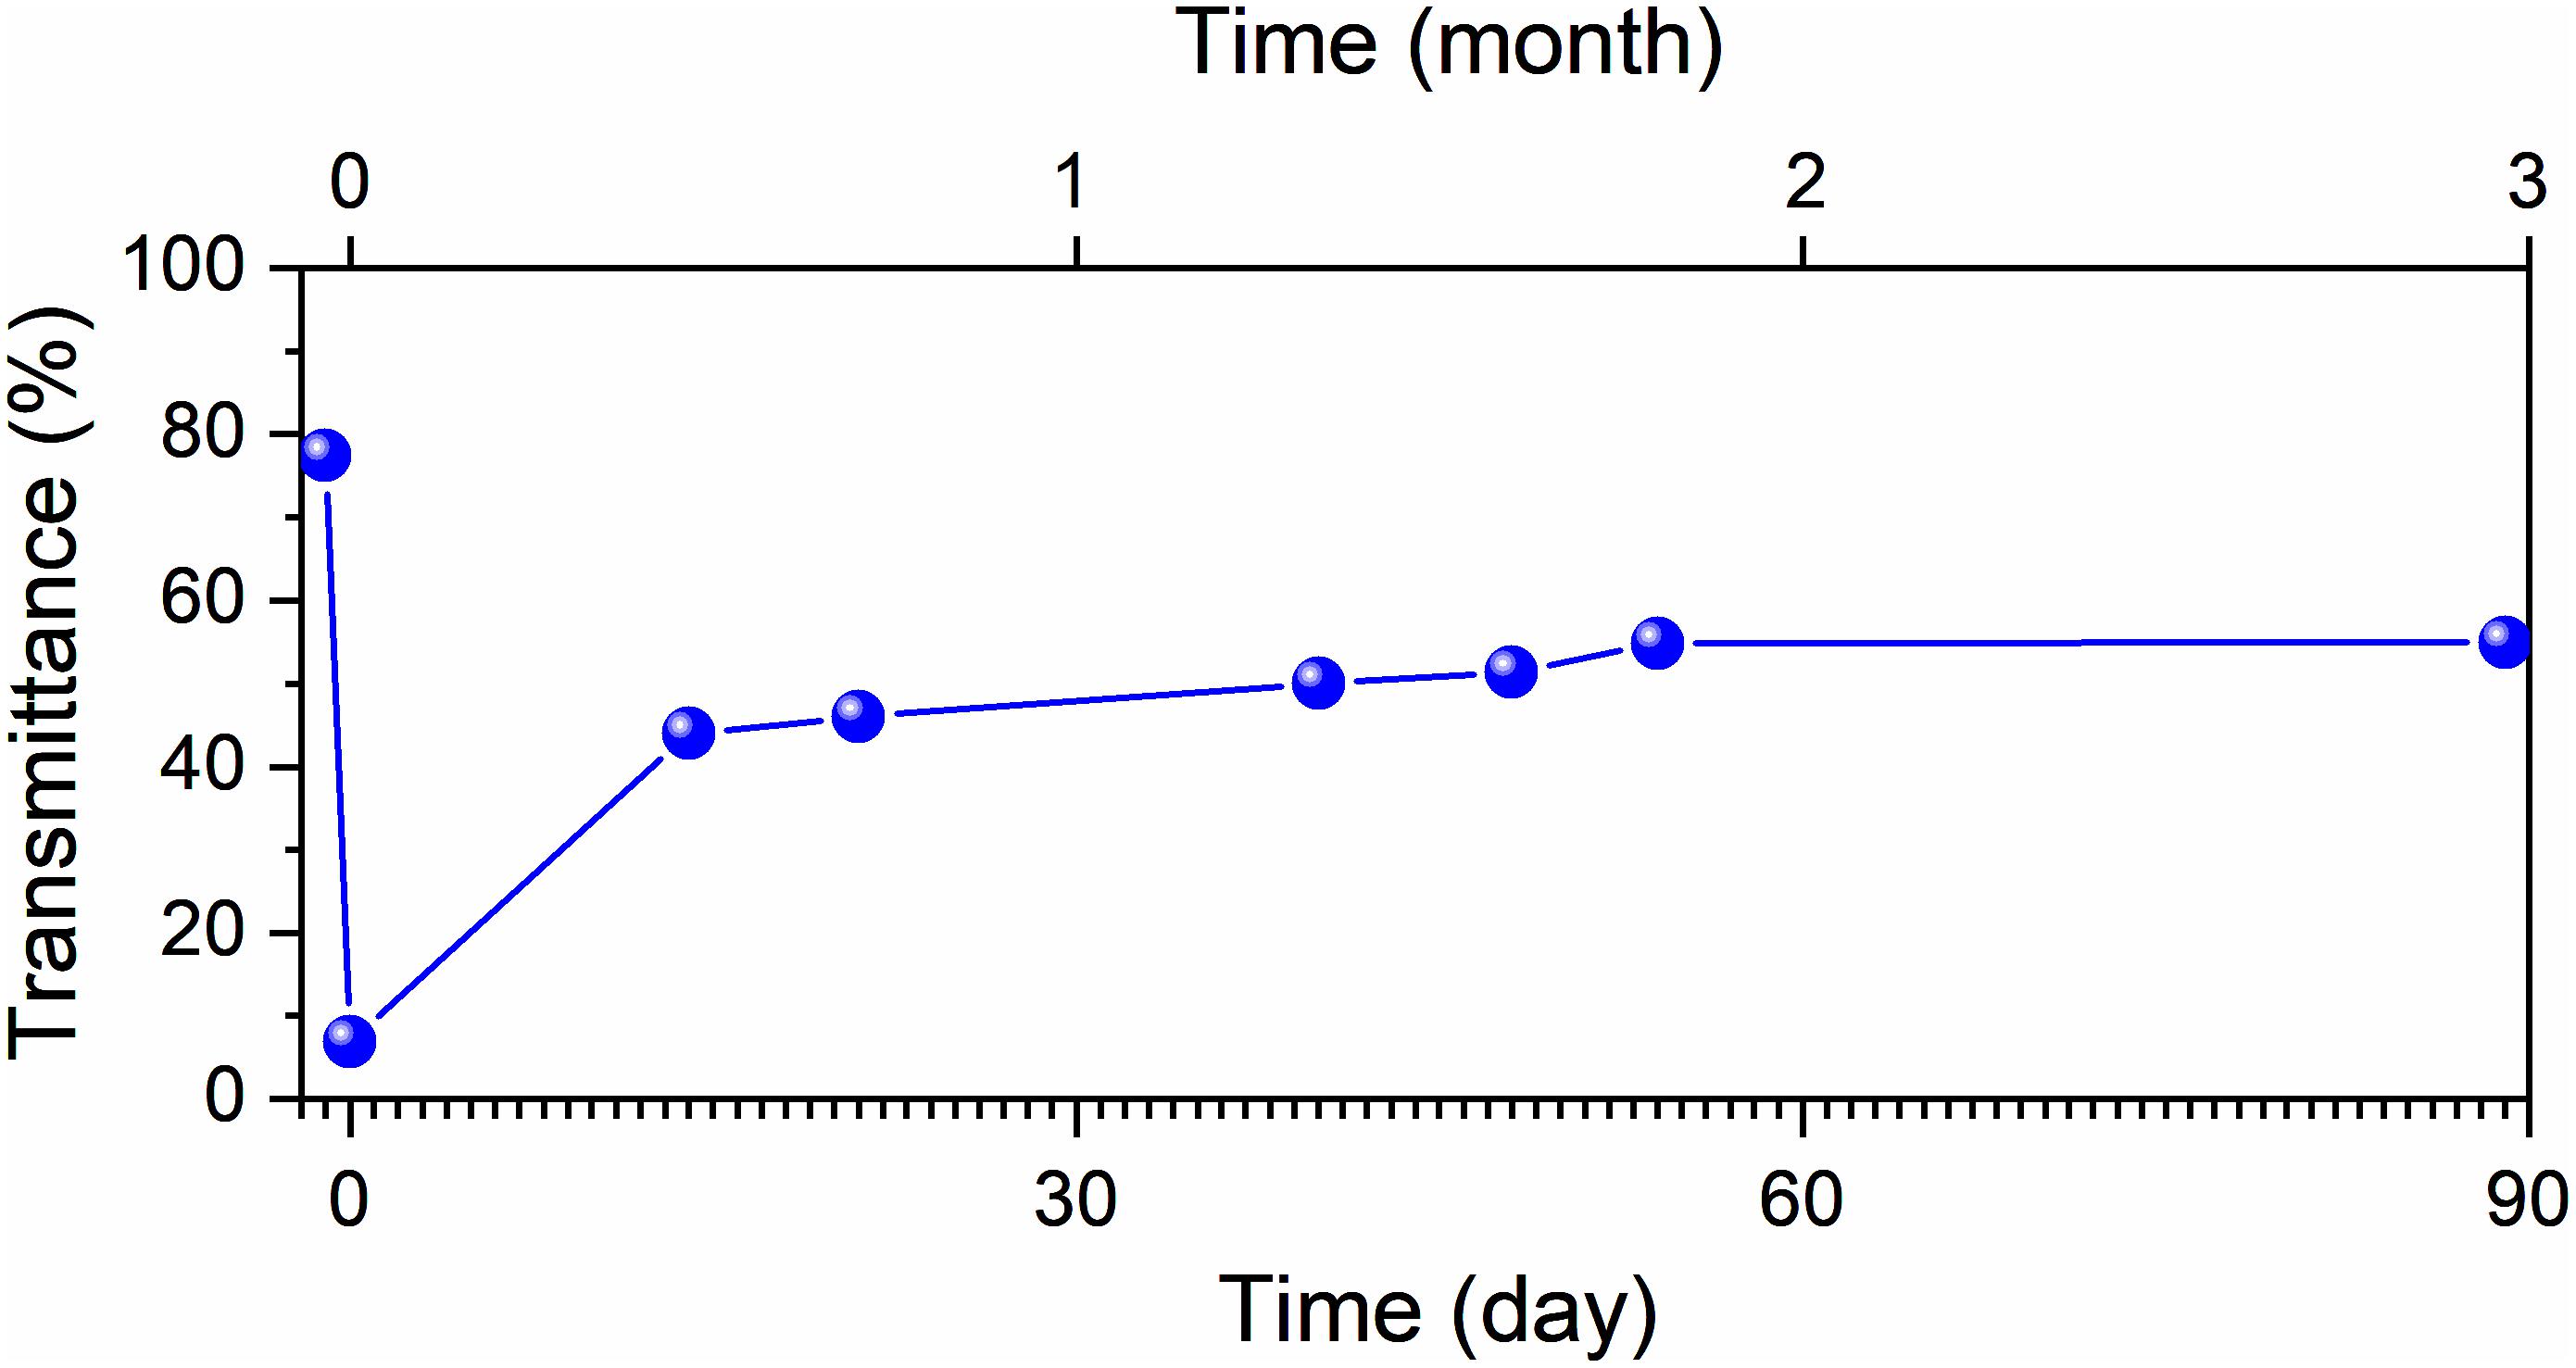
Figure 6. Optical memory test of the glass/ITO/a-WO3/d-Ut(600)10LiCF3SO3[BmimCl]/c-NiO/ITO/glass ECD.
Figure 7 shows that the ECD2, not only displayed excellent cycling stability, but also that it denoted progressive improvement as a function of time. In addition, the behavior of the device under CA cycling demonstrated different cathodic and anodic kinetics, as the time and charge necessary to trigger the color switch were much lower than those necessary to promote bleaching. The CE values calculated at 555 nm were quite high: −6727 cm2 C–1 for coloration (Qin = −0.156 mC cm–2, 32th cycle) and +2794 cm2 C–1 for bleaching (Qout = + 0.376 mC cm–2, 480th cycle) (Table 2).
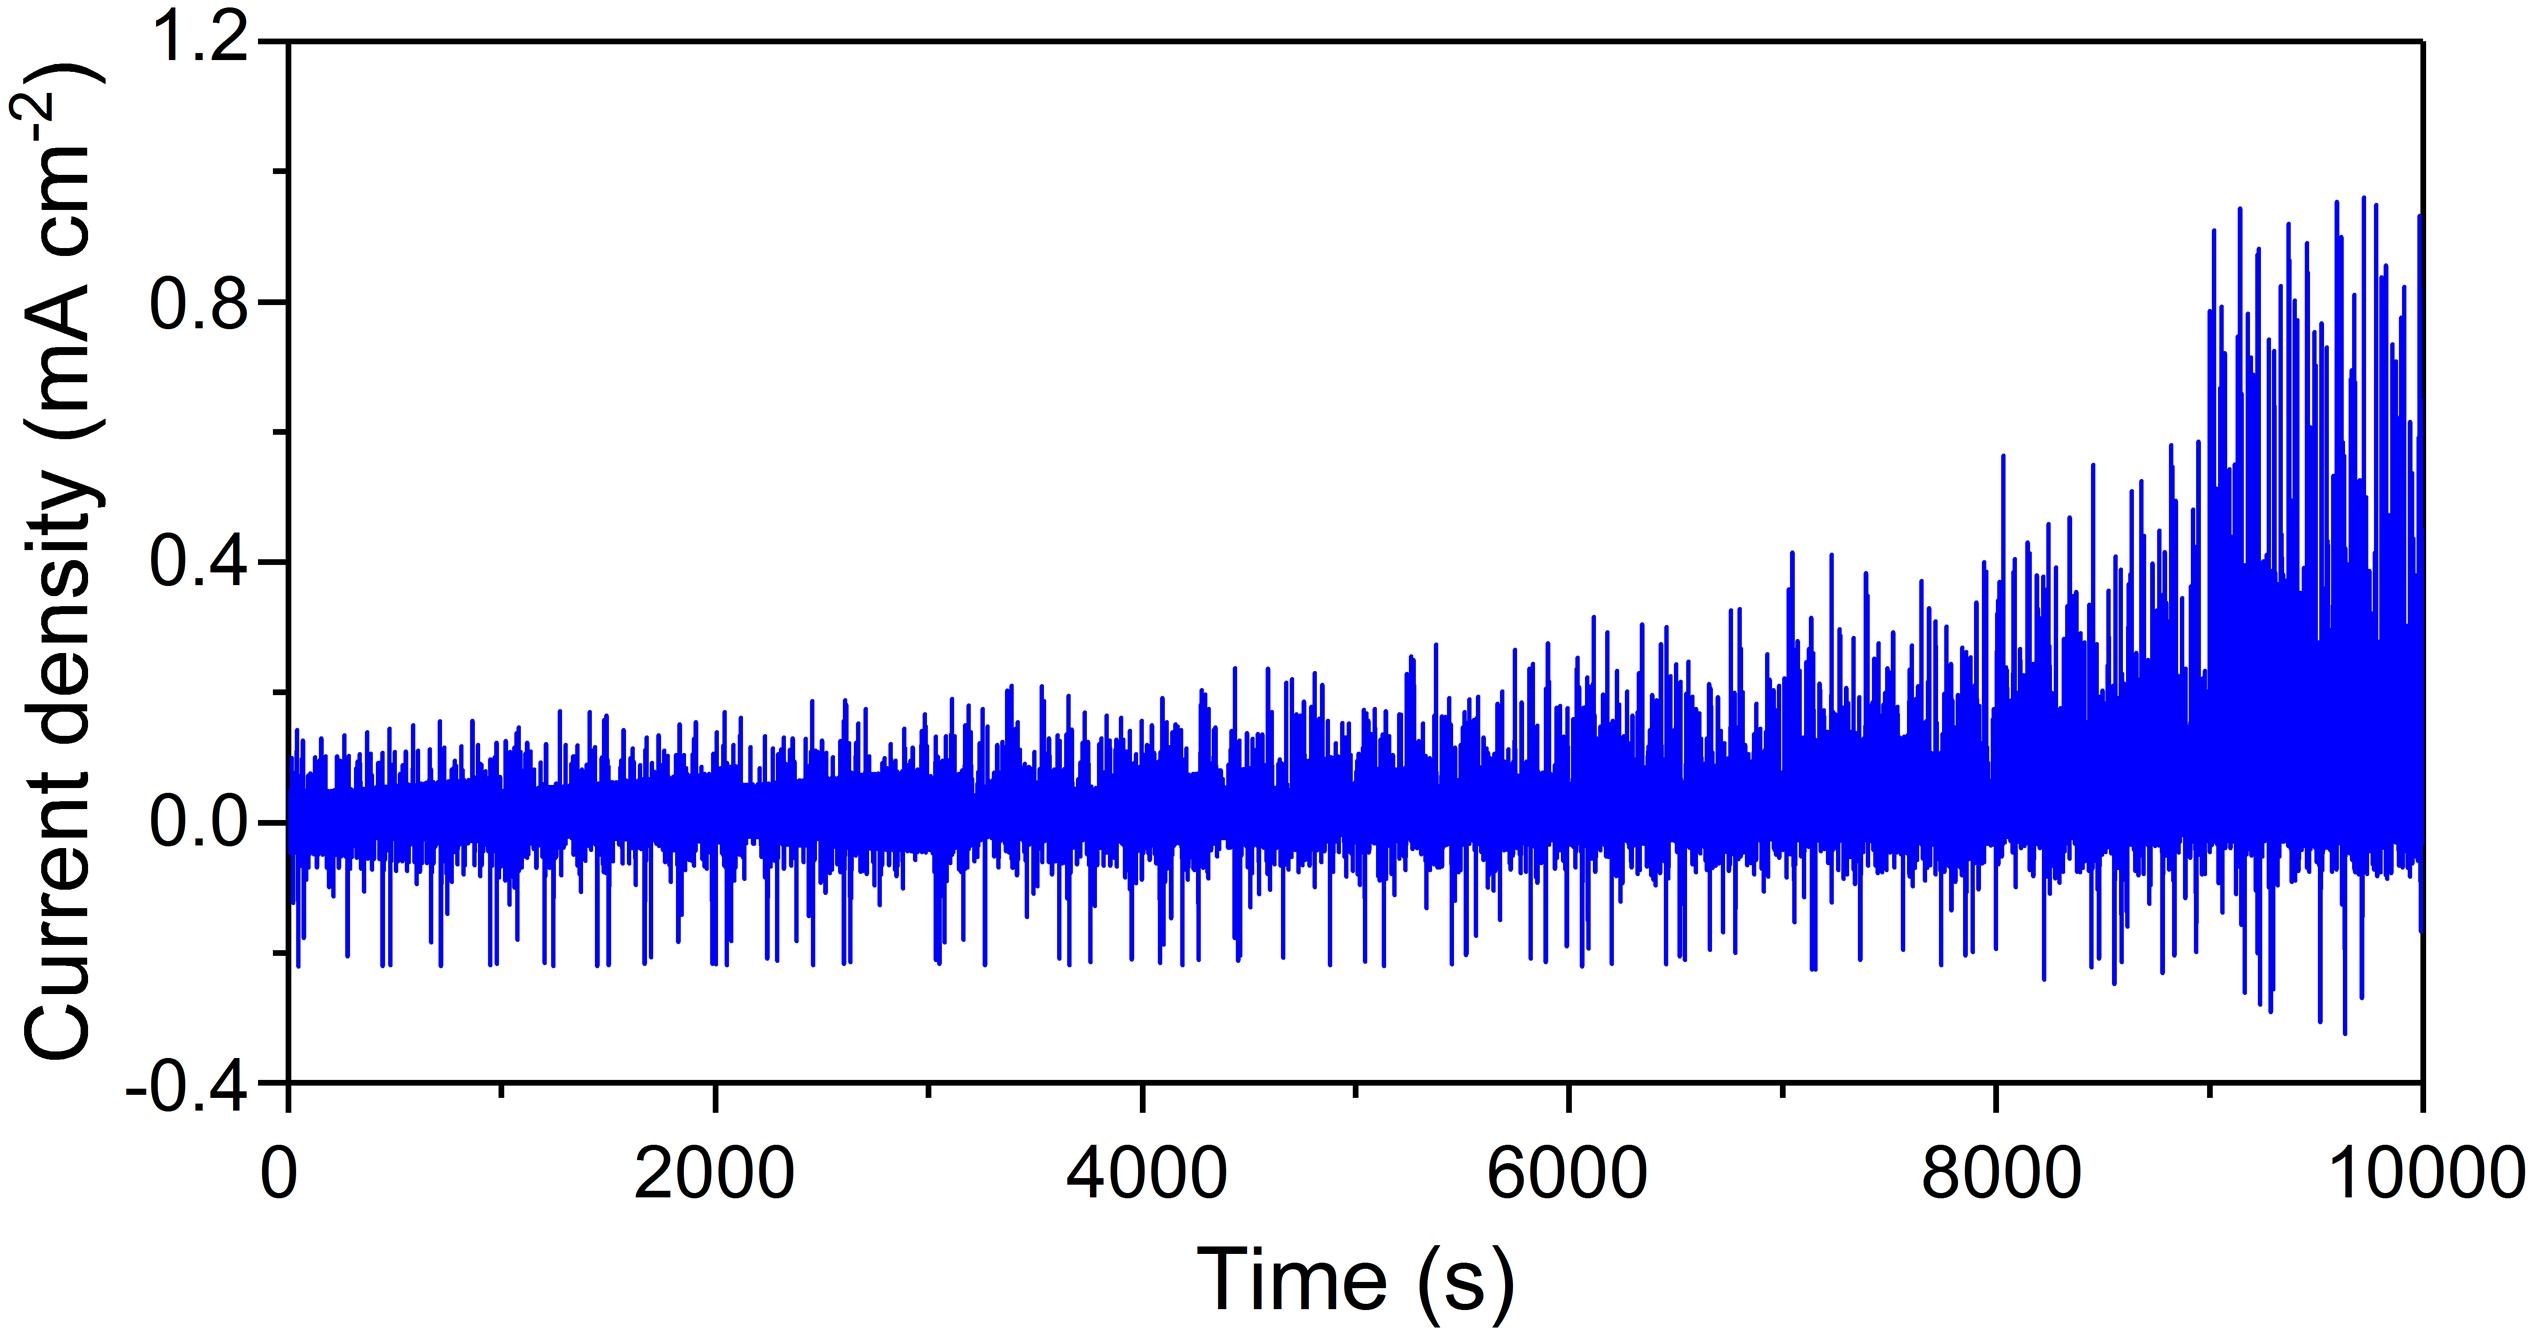
Figure 7. Variation of the current density with voltage steps of –2.5/+2.5 V at every 10/50 s over ca. 167 cycles for the glass/ITO/a-WO3/d-Ut(600)10LiCF3SO3[Bmim]Cl/c-NiO/ITO/glass ECD. This device was previously subject to 333 chronoamperometry cycles.
Finally, it is useful to compare the performance of the present ECD with that of two ECDs with similar configuration and incorporating ormolytes also doped with ILs. Table 2 allows concluding that the CEout and CEin values calculated for the glass/ITO/a-WO3/d-Ut(600)10LiCF3SO3[Bmim]Cl/c-NiO/ITO/glass ECD are significantly higher than those reported for the glass/ITO/a-WO3/d-PCL(530)LiCF3SO3-[Emim]BF4/ITO/glass ECD [where PCL is poly(ε-caprolactone) and [Emim]BF4 is 1-butyl-3-methylimidazolium tetrafluoroborate] (Fernandes et al., 2015; Table 2). Interestingly, the CEout value obtained here is practically identical to that exhibited by the glass/a-IZO/a-WO3/d-U(2000)[BIm][TfO]60/c-NiO/a-IZO/glass ECD (where [BIm][TfO] is N-butylimidazolium trifluoromethanesulfonate) (Cardoso et al., 2019; Table 2). In contrast, the CEin value, although high, is about half the value reported by Cardoso et al. (2019). This result gives further support to the claim that the replacement of ITO by a-IZO is beneficial, as already pointed out elsewhere (Cardoso et al., 2019).
Conclusion
The sol-gel method was used to produce a di-urethanesil d-Ut(600)-based ormolyte doped with a lithium salt and an IL [d-Ut(600)10LiCF3SO3[Bmim]Cl]. The structural, morphological, thermal and surface properties were characterized by XRD, DSC, TGA, SEM, AFM, and static water contact angle measurements. Complex impedance spectroscopy demonstrated that this sample exhibited an acceptable ionic conductivity (3.64 × 10⁻⁶ and 5.00 × 10⁻⁴ S cm–1 at 21 and 100°C, respectively). The study of the electro-optical performance of a glass/ITO/a-WO3/d-Ut(600)10LiCF3SO3[Bmim]Cl/c-NiO/ITO/glass ECD revealed a fast ON/OFF switch between brownish hue and very dark brown, good optical memory, four mode modulation (bright, semi-bright, dark, and very dark), excellent cycling stability over 530 cycles, denoting marked improvement with time, and quite high coloration efficiency [CEin = −6727 cm2 C–1 (32th cycle) and CEout = +2794 cm2 C–1 (480th cycle), at 555 nm], pointing out a large optical effect at low charge. The results reported here, involving the modulation of the visible region of the solar spectrum (sunlight control) definitely justify further investigation of the same ormolyte system in the analog ECD comprising a TCO transparent in the visible and NIR [such as a-IZO (Cardoso et al., 2019)] instead of ITO. This will allow to extend the modulation of the solar spectrum also to the NIR region (solar heat).
Materials and Methods
Chemicals
Lithium trifluoromethanesulfonate (LiCF3SO3, Aldrich, 99.995%), 1-butyl-3-methylimidazolium chloride ([Bmim]Cl, Across Organics, 98%), and 3-isocyanatepropyltriethoxysilane (ICPTES, Fluka, 95%) were used as received. Poly(ethylene glycol) (PEG, Sigma, Mw ≈ 600 g mol–1), tetrahydrofuran (THF, Merck) and ethanol (CH3CH2OH, Panreac PA) were stored over molecular sieves. High purity distilled water was used in all experiments.
Synthesis
A d-Ut(600)10LiCF3SO3[Bmim]Cl ormolyte (with [Bmim]Cl/PEG = 10% w/w) was prepared on the basis of the method described in detail elsewhere (Gonçalves et al., 2010). A transparent and flexible xerogel film was obtained. For comparison purposes, a non-doped sample [d-Ut(600)∞] (Gonçalves et al., 2005, 2010) and an ormolyte lacking [Bmim]Cl [d-Ut(600)10LiCF3SO3] (Gonçalves et al., 2010) were also synthesized.
Characterization
X-ray diffraction patterns were recorded at room temperature using a Philips X′Pert MPD Powder X-ray diffractometer system. The d-Ut(600)10LiCF3SO3[Bmim]Cl film was exposed to monochromated CuKα radiation (λ = 1.54 Å) over the 2θ range between 4 and 50° with a 2θ range resolution of 0.026.
The TGA curves of the d-Ut(600)10LiCF3SO3[Bmim]Cl sample were recorded using a Netzsch instrument (model STA 449 F3 Jupiter) using a Proteus software. Before the measurement the sample was stored in the desiccator with phosphorous pentoxide (P2O5) for at least one week. The sample, with a mass of 2–5 mg, was then cut into small pieces and transferred to an open alumina crucible. The thermogram was recorded during heating from room temperature to 700°C at 10°C min–1 in a high purity nitrogen (N2) environment (50 mL min–1 purge, 20 mL min–1 protective flow). The analysis was repeated thrice.
The DSC curve of the d-Ut(600)10LiCF3SO3[Bmim]Cl ormolyte was recorded with a DSC 204 Netzsch. A mass of 7–10 mg was placed in 40 μL aluminum pan and stored in a desiccator over P2O5 for 1–2 week(s) at room temperature under vacuum. After the drying treatment the pan was hermetically sealed and the thermogram was recorded. The ormolyte sample was heated from 20 to 300°C at 10°C min–1. The purge gas used was high purity N2 supplied at a constant 25 mL min–1 flow rate.
SEM images of the d-Ut(600)10LiCF3SO3[Bmim]Cl ormolyte were obtained using a FEI Quanta 400FEG/Edax Genesis X4M SEM at CEMUP-Porto (CEMUP-Porto contracts REEQ/1062/CTM/2005 and REDE/1512/RME/2005 FCT). Images were obtained at high or low vacuum, depending on charging, and using secondary electrons or backscattered electrons modes. Prior to being analyzed the samples were coated with gold/palladium.
The POM images were recorded using an OPTIKA B-600POL microscope equipped with an 8 M pixel Digital Photo Camera. The images were analyzed using the OPTIKAVision Pro software.
The AFM measurements were performed in a Nano-Observer AFM microscope (CSIntruments AFM Microscopes-France) in taping mode. A super sharp Si HQ:NSC19/FORTA probe with a frequency resonance of 60 kHz and a spring constant of 0.3 N m–1 were employed. Flattening and elimination of line noise tools and a Lowpass filter provided by the Gwyddion 2.52 software were performed to improve the quality of the images.
The wettability of the d-Ut(600)∞, d-Ut(600)10LiCF3SO3 and d-Ut(600)10LiCF3SO3[Bmim]Cl samples was assessed by means of static contact angle measurements using the sessile drop method. Contact angles were measured in a temperature-controlled chamber at 25 ± 1°C using a Krüss DSA25S drop shape analyzer controlled by the software ADVANCE. The volume of the liquid droplets was kept constant at 5 μL. Contact angles were measured from digital images acquired by a video camera using the Young-Laplace fitting. The contact angle values were measured at five different spots. At each spot five measurements were performed. The results reported correspond to the average value of all the measurements. The error analysis of the data was implemented by arithmetic mean of the root mean square error.
The FT-IR spectra of d-Ut(600)∞, d-Ut(600)10LiCF3SO3 and d-Ut(600)10LiCF3SO3[Bmim]Cl were registered with a Thermo Scientific Nicoleti S50 FT-IR spectrometer. The instrument was controlled by the Omnic software package (version 9.2.28) from Thermo Fisher Scientific, Inc. The spectra were collected in the 4000–400 cm–1 range by averaging 64 scans at a resolution of 4 cm–1. The compounds were finely ground (about 2 mg), mixed with approximately 175 mg of dried potassium bromide (Merck, spectroscopic grade) and pressed into pellets. Prior to recording the spectra, the discs were stored in an oven under vacuum at 90°C for several days in order to reduce the levels of adsorbed water. FT-IR band envelopes analysis was performed using the iterative least-squares curve-fitting procedure in the PeakFit software (version 4) [Peakfit, 2007 (version 4.0)]. The frequency, bandwidth, and intensity of the bands were changed to obtain the best fit. Band fitting was conducted using a Gaussian-cross product function, using a linear baseline correction with a tolerance of 0.2%. The standard errors of the curve-fitting procedure were less than 0.0002.
Bulk conductivity measurements of the d-Ut(600)10LiCF3SO3[Bmim]Cl ormolyte were carried out by placing a sample disk between two 10 mm diameter ion-blocking gold electrodes (Goodfellow, >99.9%). The electrode/ormolyte/electrode assembly was secured in a suitable constant volume support installed in a Buchi TO51 tube oven and the sample temperature was evaluated by a type K thermocouple placed close to the ormolyte disk. Measurements were obtained complex impedance spectroscopy using an Autolab PGSTAT-12 (Eco Chemie) equipment (frequency range: 500 mHz to 65 kHz; amplitude: 10 mV), from room temperature (21°C) to 105°C at approximately 10°C intervals.
ECD Tests
ECD Assembly
The solid-state ECD was constructed using the five-layer sandwich configuration shown in Scheme 1.
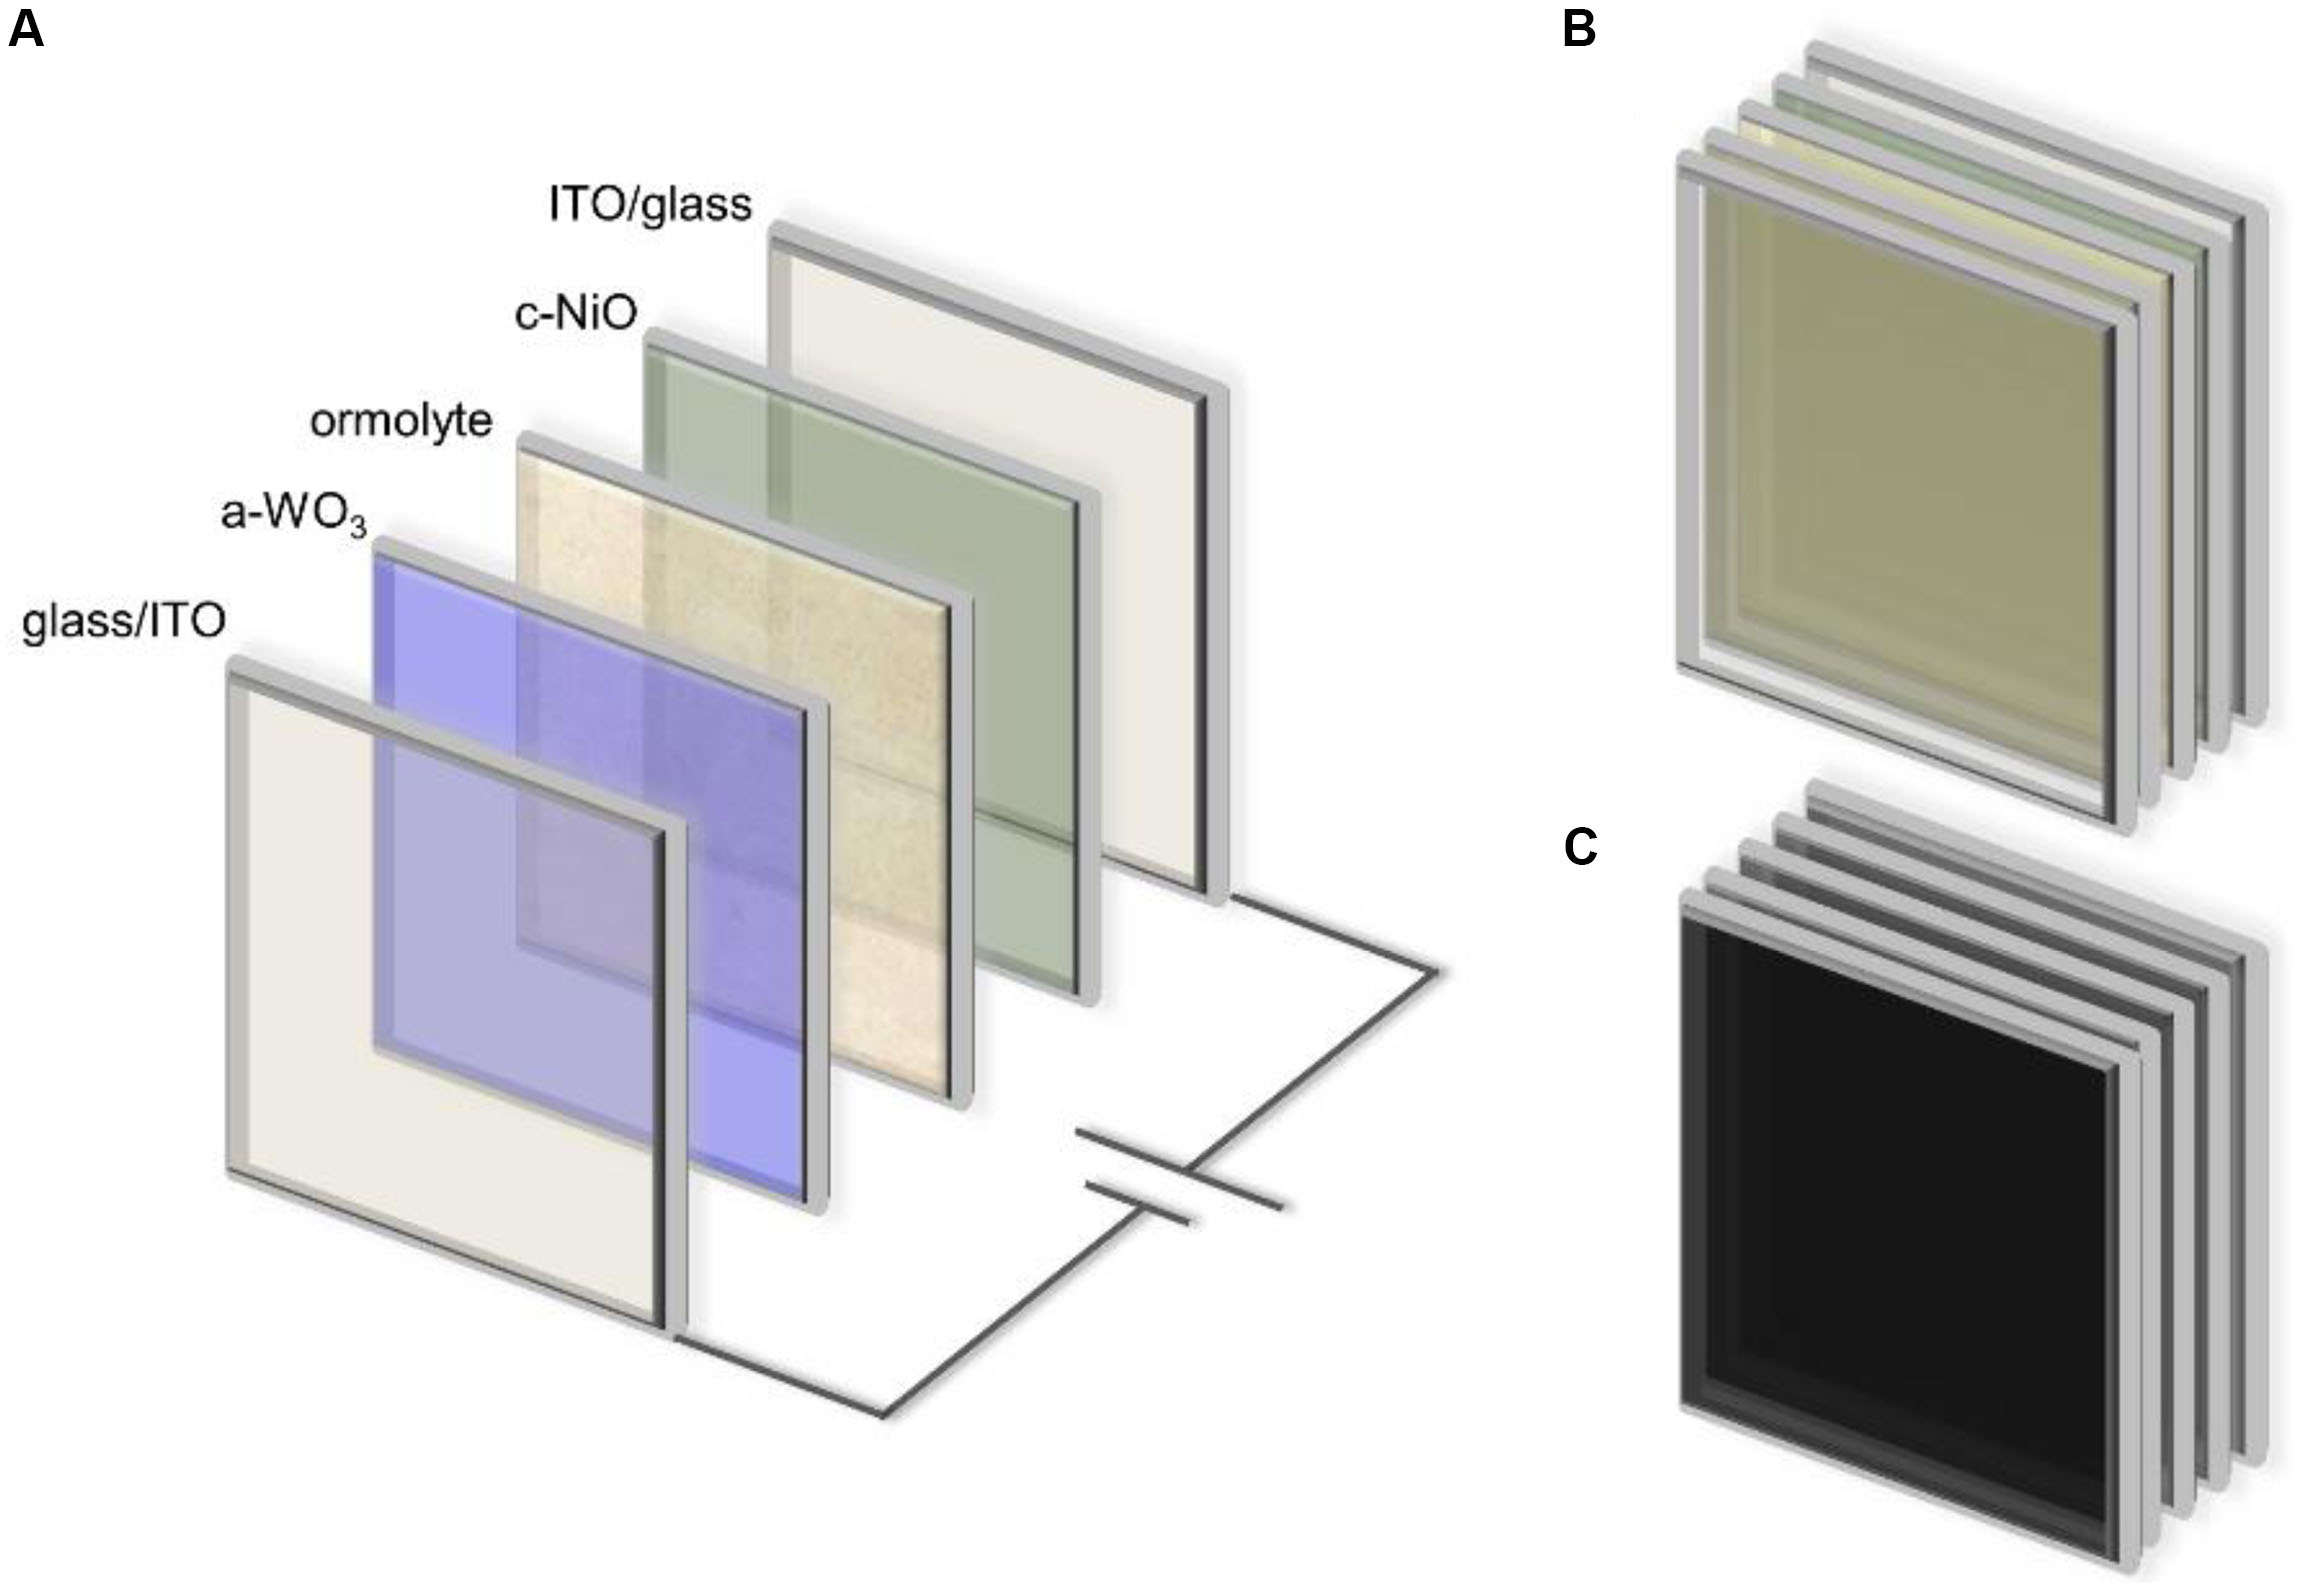
Scheme 1. Schematic representation of the glass/ITO/a-WO3/d-Ut(600)10LiCF3SO3[Bmim]Cl/c-NiO/ITO/glass ECD configuration (A), and of the bleached (B), and colored (C) states.
The external layers of the ECD were ITO films. The active EC layers of the ECD device (a-WO3 and c-NiO) were deposited on ITO-deposited glass plates by sputtering and e-beam evaporation, respectively.
The ITO was deposited on commercially purchased glass plates by radio frequency (r.f.) (13.56 MHz) magnetron sputtering using a ceramic oxide target of tin oxide (SnO)/indium oxide (In2O3) (5 cm diameter, Super Conductor Material, Inc., 99.99% purity). Sputtering was carried out at room temperature, under a partial pressure of oxygen of 2.5 × 10⁻³ Pa and a constant deposition pressure of 0.15 Pa. The distance between the substrate and the target was 10 cm and the r.f.-magnetron power was held constant at 100 W. The thickness of the ITO layers was 120 nm.
The a-WO3 was produced in an argon and oxygen atmosphere (oxygen partial pressure of 0.2 Pa) and a deposition pressure of 1.0 Pa, under an r.f. power of 200 W in a Pfeiffer Vacuum Classic 500 system using 3 diameter ceramic target (Plasmaterials), thus achieving a thickness of 300 nm.
A polycrystalline c-NiO film with a 300 nm thickness was obtained from NiO commercial pellets random pieces 3–6 mm (99.99%, Super Conductive Materials) and deposited by e-beam evaporation in a homemade system, with an initial chamber pressure of 7 × 10⁻⁴ Pa and growth rate of 6 nm min–1.
The other active layer of the ECDs was the ormolyte. About two drops of the d-Ut(600)10LiCF3SO3[Bmim]Cl sol were directly poured onto the surface of a 2.1 cm × 2.5 cm a-WO3/ITO-coated glass plate. The thickness of the ormolyte layer was less than 1 mm. A c-NiO/ITO-coated glass plate was placed on this ormolyte layer. The two plates were then pressed together in such a way that the two coatings faced each other inside the assembled system. In this manner a surface with an area of approximately 5.3 cm2 resulted. Free space was left on each side for the electrical contacts (Scheme 1). The entire assembly procedure described was carried out under atmospheric conditions and at room temperature. The unsealed ECD was kept for several days at these conditions for drying and was subsequently used in tests.
ECD Characterization
Two ECD replicates incorporating the ormolyte with the highest ionic conductivity [glass/ITO/a-WO3/d-Ut(600)10LiCF3SO3[BmimCl]/c-NiO/ITO/glass], noted as ECD1 and ECD2, were assembled. In the two electrode set-up employed for the electro-optical measurements the a-WO3/ITO substrate played the role of working electrode, the ormolyte acted as a reservoir of ions for insertion, and the c-NiO/ITO substrate acted as counter and reference electrodes.
The UV-visible spectra of the ECD1 were recorded in the 400–700 nm range with a UV/VIS Perkin Elmer Lambda 25 spectrophotometer.
CA measurements were performed using an Autolab 302 N model potentiostat/galvanostat. The ECD2 was first cycled 333 times between the colored and the bleached states, and the current response was monitored as a function of time while the applied voltage was stepped between −2.5 V (with a delay time of 10 s)/+2.5 V (with a delay time of 50 s). 167 cycles were then carried out under the same conditions. For the calculation of the CE the cathodic and anodic charge densities (Qin and Qout, respectively) were determined through integration of the CA curves during the coloring and bleaching processes, respectively.
Data Availability Statement
The raw data supporting the conclusions of this article will be made available by the authors, without undue reservation, to any qualified researcher.
Author Contributions
MG synthesized the samples, registered the FT-IR, SEM, POM, and electro-optical data, organized all the data, was deeply involved in the discussion of the characterization data and wrote the first draft of the manuscript. RP, RA, and MS recorded and discussed the ionic conductivity data. SN registered the DSC curves. MF registered the TGA curves and measured the contact angles. HG recorded and discussed the AFM data. SP and EF deposited and characterized the oxide layers. RR recorded and discussed the electro-optical data. VZ proposed the study and was deeply involved in the discussion of the results and in the writing of the manuscript. All authors contributed to manuscript revision and, read and approved the submitted version.
Funding
The authors are grateful to Fundação para a Ciência e a Tecnologia (FCT) and when applicable by FEDER under the PT2020 Partnership Agreement for financial support under contracts PEst-OE/SAU/UI0709/2014, UID/Multi/00709/2013, UID/QUI/00686/2016, UID/QUI/00686/2018, UID/QUI/00686/2019, PEst-OE/QUI/UI0616/2016, FCOMP-01-0124-FEDER-037271, UID/CTM/50011/2013, LUMECD project (POCI-01-0145-FEDER-016884 and PTDC/CTM-NAN/0956/2014), UniRCell project (SAICTPAC/0032/2015 and POCI-01-0145-FEDER-016422). RP and SN acknowledge FCT-MCTES for grants (SFRH/BPD/87759/2012 and LUMECD, respectively). RP thanks FCT-UM for the contracts in the scope of Decreto-Lei 57/2016 and 57/2017. MF acknowledges FCT-UTAD for the contract in the scope of Decreto-Lei 57/2016 – Lei 57/2017. HG acknowledges projects POCI-01-0145-FEDER-030858 and PTDC/BTM-MAT/30858/2017 for financial support.
Conflict of Interest
The authors declare that the research was conducted in the absence of any commercial or financial relationships that could be construed as a potential conflict of interest.
Acknowledgments
We thank F. A. Paz (CICECO – Aveiro Institute of Materials, University of Aveiro, Portugal) for the XRD measurements.
References
Alves, R., Sentanin, F., Sabadini, R., Fernandes, M., Bermudez, V., Pawlicka, A., et al. (2018). Samarium (III) triflate-doped chitosan electrolyte for solid state electrochromic devices. Electrochim. Acta 267, 51–62.
Alves, R. D., Rodrigues, L. C., Andrade, J. R., Fernandes, M., Pinto, J. V., Pereira, L., et al. (2013). GelatinnZn(CF3SO3)2 polymer electrolytes for electrochromic devices. Electroanalysis 25, 1483–1490.
Barawi, M., Veramonti, G., Epifani, M., Giannuzzi, R., Sibillano, T., Giannini, C., et al. (2018). A dual band electrochromic device switchable across four distinct optical modes. J. Mater. Chem. A 6, 10201–10205.
Cardoso, M. A., Pereira, R. F. P., Pereira, S., Gonçalves, H., Silva, M. M., Carlos, L. D., et al. (2019). Three-mode modulation electrochromic device with high energy efficiency for windows of buildings located in continental climatic regions. Adv. Sustain. Syst. 3:1800115.
Carlos, L. D., Bermudez, V. D., Ferreira, R. A. S., Marques, L., and Assuncao, M. (1999). Sol-gel derived urea cross-linked organically modified silicates. 2. Blue-light emission. Chem. Mater. 11, 581–588.
Chang, B.-Y., and Park, S.-M. (2010). Electrochemical impedance spectroscopy. Ann. Rev. Analyt. Chem. 3, 207–229.
de Zea Bermudez, V., Ostrovskii, D., Goncalves, M. C., Carlos, L. D., Ferreira, R. A. S., Reis, L., et al. (2004). Urethane cross-linked poly(oxyethylene)/siliceous nanohybrids doped with Eu3+ ions Part 1. Coordinating ability of the host matrix. Physical Chemistry Chemical Physics 6, 638–648.
de Zea Bermudez, V., Poinsignon, C., and Armand, M. B. (1997). Chemistry and physical properties of sulfamide and its derivatives: proton conducting materials. Journal of Materials Chemistry 7, 1677–1692.
Fernandes, M., Freitas, V., Pereira, S., Leones, R., Silva, M. M., Carlos, L. D., et al. (2018). Luminescent electrochromic devices for smart windows of energy-efficient Buildings. Energies 11:3513.
Fernandes, M., Botas, A., Leones, R., Pereira, S., Silva, M., Ferreira, R., et al. (2014a). Luminescent electrochromic device based on a biohybrid electrolyte doped with a mixture of potassium triflate and a europium beta-diketonate complex. ECS Transactions 61, 213–225.
Fernandes, M., Freitas, V. T., Pereira, S., Fortunato, E., Ferreira, R. A. S., Carlos, L. D., et al. (2014b). Green Li+- and Er3+-doped poly(epsilon-caprolactone)/siloxane biohybrid electrolytes for smart electrochromic windows. Solar Energy Materials and Solar Cells 123, 203–210.
Fernandes, M., Leones, R., Costa, A. M. S., Silva, M. M., Pereira, S., Mano, J. F., et al. (2015). Electrochromic devices incorporating biohybrid electrolytes doped with a lithium salt, an ionic liquid or a mixture of both. Electrochim. Acta 161, 226–235.
Fernandes, M., Leones, R., Pereira, S., Costa, A. M. S., Mano, J. F., Silva, M. M., et al. (2017). Eco-friendly sol-gel derived sodium-based ormolytes for electrochromic devices. Electrochim. Acta 232, 484–494.
Fernandes, M., Nobre, S. S., Rodrigues, L. C., Goncalves, A., Rego, R., Oliveira, M. C., et al. (2011a). Li+- and Eu3+-doped poly(ε-caprolactone)/siloxane biohybrid electrolytes for electrochromic devices. ACS Appl. Mater. Interf. 3, 2953–2965. doi: 10.1021/am200391b
Fernandes, M., Rodrigues, L. C., Ferreira, R. A. S., Goncalves, A., Fortunato, E., Silva, M. M., et al. (2011b). K+-doped poly(epsilon-caprolactone)/siloxane biohybrid electrolytes for electrochromic devices. Solid State Ionics 204, 129–139. doi: 10.1021/am200391b
Fujita, K., Nakano, R., Nakaba, R., Nakamura, N., and Ohno, H. (2019). Hydrated ionic liquids enable both solubilisation and refolding of aggregated concanavalin A. Chem. Commun. 55, 3578–3581. doi: 10.1039/c8cc10102g
Goal 11: Make Cities Inclusive (2019). Goal 11: Make Cities Inclusive Resilient and Sustainable. Available online at: https://www.un.org/sustainabledevelopment/cities/ (accessed June 20, 2019).
Gonçalves, M. C., de Zea Bermudez, V., Ferreira, R. A. S., Carlos, L. D., Ostrovskii, D., and Rocha, J. (2004). Optically functional di-urethanesil nanohybrids containing Eu3+ ions. Chem. Mater. 16, 2530–2543.
Gonçalves, M. C., de Zea Bermudez, V., Silva, M. M., Smith, M. J., Morales, E., Ferreira, R. A. S., et al. (2010). Structure, thermal properties, conductivity and electrochemical stability of di-urethanesil hybrids doped with LiCF3SO3. Ionics 16, 193–201.
Gonçalves, M. C., Silva, N. J. O., de Zea Bermudez, V., Ferreira, R. A. S., Carlos, L. D., Dahmouche, K., et al. (2005). Local structure and near-infrared emission features of neodymium-based amine functionalized organic/inorganic hybrids. J. Phys. Chem. B 109, 20093–20104. doi: 10.1021/jp052097n
Granqvist, C. G. (2014). Electrochromics for smart windows: Oxide-based thin films and devices. Thin Solid Films 564, 1–38.
Granqvist, C. G., Arvizu, M. A., Bayrak Pehlivan, I., Qu, H. Y., Wen, R. T., and Niklasson, G. A. (2018). Electrochromic materials and devices for energy efficiency and human comfort in buildings: a critical review. Electrochim. Acta 259, 1170–1182.
Gray, F. M. (1991). “Transport properties: effects of dynamic disorder,” in Solid Polymer Electrolytes: Fundamentals and Technological Applications, (New York, NY: Wiley-VCH).
Holbrey, J. D., Reichert, W. M., Nieuwenhuyzen, M., Johnson, S., Seddon, K. R., and Rogers, R. D. (2003). Crystal polymorphism in 1-butyl-3-methylimidazolium halides: supporting ionic liquid formation by inhibition of crystallization. Chem. Commun. 2003, 1636–1637.
Kim, J., Ong, G. K., Wang, Y., LeBlanc, G., Williams, T. E., Mattox, T. M., et al. (2015). Nanocomposite architecture for rapid, spectrally-selective electrochromic modulation of solar transmittance. Nano Lett. 15, 5574–5579. doi: 10.1021/acs.nanolett.5b02197
Kraft, A., and Rottmann, M. (2009). Properties, performance and current status of the laminated electrochromic glass of Gesimat. Solar Energy Mater. Solar Cells 93, 2088–2092.
Leones, R., Fernandes, M., Sentanin, F., Cesarino, I., Lima, J. F., de Zea Bermudez, V., et al. (2014). Ionically conducting Er3+-doped DNA-based biomembranes for electrochromic devices. Electrochim. Acta 120, 327–333.
Llordes, A., Garcia, G., Gazquez, J., and Milliron, D. J. (2013). Tunable near-infrared and visible-light transmittance in nanocrystal-in-glass composites. Nature 500, 323–326. doi: 10.1038/nature12398
MacFarlane, D. R., Forsyth, M., Howlett, P. C., Kar, M., Passerini, S., Pringle, J. M., et al. (2016). Ionic liquids and their solid-state analogues as materials for energy generation and storage. Nat. Rev. Mater. 1:15005.
MacFarlane, D. R., Tachikawa, N., Forsyth, M., Pringle, J. M., Howlett, P. C., Elliott, G. D., et al. (2014). Energy applications of ionic liquids. Energy Environ. Sci. 7, 232–250.
Neto, M. J., Sentanin, F., Esperança, J. M. S. S., Medeiros, M. J., Pawlicka, A., De Zea Bermudez, V., et al. (2015). Gellan gum-ionic liquid membranes for electrochromic device application. Solid State Ionics 274, 64–70.
Nunes, S. C., Bermudez, V. D., Silva, M. M., Smith, M. J., Ostrovskii, D., Ferreira, R. A. S., et al. (2007). Sol-gel-derived potassium-based di-ureasils for “smart windows”. J. Mater. Chem. 17, 4239–4248.
Nunes, S. C., Pereira, R. F. P., Sousa, N., Silva, M. M., Almeida, P., Figueiredo, F. M. L., et al. (2017). Eco-friendly red seaweed-derived electrolytes for electrochemical devices. Adv. Sustain. Syst. 1:1700070.
Nunes, S. C., Saraiva, S. M., Pereira, R. F. P., Pereira, S., Silva, M. M., Carlos, L. D., et al. (2019). Sustainable dual-mode smart windows for energy-efficient buildings. ACS Appl. Energy Mater. 2, 1951–1960.
Park, S.-M., and Yoo, J.-S. (2003). Electrochemical impedance spectroscopy for better electrochemical measurements. Anal. Chem. 75, 455A–461A.
Pereira, R. F. P., Sentanin, F., Pawlicka, A., Goncalves, M. C., Silva, M. M., and de Zea Bermudez, V. (2016). Smart windows prepared from Bombyx mori silk. Chemelectrochem 3, 1084–1097.
Piccolo, A., and Simone, F. (2015). Performance requirements for electrochromic smart window. J. Build. Eng. 3, 94–103.
Saha, S., Hayashi, S., Kobayashi, A., and Hamaguchi, H.-O. (2003). Crystal structure of 1-butyl-3-methylimidazolium chloride. A clue to the elucidation of the ionic liquid structure. Chem. Lett. 32, 740–741.
Satoshi, H., Ryosuke, O., and Hiro-O, H. (2003). Raman Spectra, Crystal polymorphism, and structure of a prototype ionic-liquid [Bmim]Cl. Chem. Lett. 32, 498–499.
Skrovanek, D. J., Howe, S. E., Painter, P. C., and Coleman, M. M. (1985). Hydrogen bonding in polymers: infrared temperature studies of an amorphous polyamide. Macromolecules 18, 1676–1683.
Tremayne, M., Lightfoot, P., Mehta, M. A., Bruce, P. G., Harris, K. D. M., Shankland, K., et al. (1992). Ab initio structure determination of LiCF3SO3 from X-ray powder diffraction data using entropy maximization and likelihood ranking. J. Solid State Chem. 100, 191–196.
Watanabe, M., Thomas, M. L., Zhang, S., Ueno, K., Yasuda, T., and Dokko, K. (2017). Application of ionic liquids to energy storage and conversion materials and devices. Chem. Rev. 117, 7190–7239. doi: 10.1021/acs.chemrev.6b00504
Xu, J., Zhang, Y., Zhai, T.-T., Kuang, Z., Li, J., Wang, Y., et al. (2018). Electrochromic-Tuned Plasmonics for Photothermal Sterile Window. ACS Nano 2018, 6895–6903. doi: 10.1021/acsnano.8b02292
Keywords: di-urethanesil, sol-gel, lithium triflate, 1-butyl-3-methylimidazolium chloride, electrochromic device
Citation: Gonçalves MC, Pereira RFP, Alves R, Nunes SC, Fernandes M, Gonçalves HMR, Pereira S, Silva MM, Fortunato E, Rego R and de Zea Bermudez V (2020) Electrochromic Device Composed of a Di-Urethanesil Electrolyte Incorporating Lithium Triflate and 1-Butyl-3-Methylimidazolium Chloride. Front. Mater. 7:139. doi: 10.3389/fmats.2020.00139
Received: 07 January 2020; Accepted: 21 April 2020;
Published: 27 May 2020.
Edited by:
Brahim Aissa, MPB Technologies & Communications (Canada), CanadaCopyright © 2020 Gonçalves, Pereira, Alves, Nunes, Fernandes, Gonçalves, Pereira, Silva, Fortunato, Rego and de Zea Bermudez. This is an open-access article distributed under the terms of the Creative Commons Attribution License (CC BY). The use, distribution or reproduction in other forums is permitted, provided the original author(s) and the copyright owner(s) are credited and that the original publication in this journal is cited, in accordance with accepted academic practice. No use, distribution or reproduction is permitted which does not comply with these terms.
*Correspondence: Maria Cristina Gonçalves, cristina@utad.pt; Verónica de Zea Bermudez, vbermude@utad.pt