 Roman Sajzew
 Rene Limbach
 Lothar Wondraczek
- Otto Schott Institute of Materials Research, Friedrich Schiller University Jena, Jena, Germany
Fiber or fiber tapers are the material of choice when studying the mechanical properties and intrinsic load-response of glasses at highest sample quality and experimental repeatability. However, surface curvature strongly complicates meaningful analysis using local (sharp) contact probes. Wedge-indentation provides a means for overcoming some of the problems of normal indentation on curved glass surfaces. In particular, it enables testing in comparably homogenous, two-dimensional stress fields, avoiding the effects of the sharp edges of pyramidal indenters and facilitating auxiliary in situ or ex situ structural mapping, for example, by vibrational spectroscopy. Adjusting the wedge’s opening angle, length and orientation relative to the fiber surface enables highly reproducible studies of material deformation, surface crack initiation, and effects of fiber anisotropy.
Introduction
Despite superior intrinsic material properties, commercially available glass products usually exhibit very low practical strength. This is due to the defect susceptibility of glass surfaces. Paired with high brittleness, surface defects cause local stress amplification, and, hence, material failure (Wondraczek et al., 2011). Microscopic defects may already form during the manufacturing process (Varshneya, 2018), thus determining characteristic limits of practical strength for different glass products. For example, while untreated container glasses rarely reach tensile strength above 100 MPa, optical glass fiber may very well approach 10 GPa, or more (Kurkjian et al., 2003; Kurkjian et al., 2010). Defect susceptibility occurs across all length scales; ultimately, stress accumulation, and glass deformation are mediated by rigidity fluctuation which results from structural heterogeneity of the glass network itself (Benzine et al., 2018). The generation and growth of microscopic defects in glasses has been studied intensely over the past decades (Rouxel and Yoshida, 2017), in particular, using methods of micro or nanoindentation (Yoshida, 2019). However, indentation methods remain problematic and highly ambiguous when analyzing glass fracture and material toughness (Cook, 2020). Lateral indentation was introduced as a complementary method for assessing scratch hardness (Sawamura and Wondraczek, 2018; Sawamura et al., 2019) and surface cracking (Moayedi and Wondraczek, 2017), but requires flat and smooth specimen surfaces. On the other hand, fiber drawn from silica or aluminosilicate glass rods (Kurkjian et al., 2003; Kurkjian et al., 2010), or tapered silica (Brambilla and Payne, 2009) have been the closest in terms of reaching the limits of theoretical (intrinsic) glass strength in praxis. Carefully prepared glass fibers benefit from very high surface quality. This prevents stress amplification at surface flaws and enables very high levels of applied stress before fracture occurs (Wondraczek, 2019). Such conditions do not only allow for observing intrinsic strength, but also facilitate studies of plastic deformation processes. For example, thin films of flawless a-Al2O3 have been observed to exhibit pronounced plasticity when sufficiently high levels of stress are reached (Frankberg et al., 2019). Indentation studies on glass fiber remain challenging, though. In particular, surface curvature makes conventional testing protocols impractical, leading to systematic overestimation of contact area (Lonnroth et al., 2008; McAllister et al., 2012), and very strong sensitivity to tip-surface alignment.
Here, we employ wedge-indentation as a means to overcome some of the problems of normal indentation on curved glass surfaces. In particular, such indentation experiments enable testing in comparably homogenous, two-dimensional stress fields, avoiding the effects of the sharp edges of pyramidal indenters. Adjusting the wedge’s opening angle, length and orientation relative to the fiber surface provides for highly reproducible studies of material deformation, surface crack initiation, and effects of fiber anisotropy.
Materials and Methods
Sample Preparation
The pristine silica glass fibers used for this study were provided by the Leibniz Institute of Photonic Technology (IPHT), Jena, Germany: individual glass fibers with diameters of d = 440 μm, 220 μm, and 125 μm, respectively, were drawn from a vitreous silica glass rod (Suprasil F300, Heraeus Quarzglas GmbH & Co. KG) on an optical fiber drawing tower. A flat slide of vitreous silica (Suprasil 2B, Heraeus Quarzglas GmbH & Co. KG) was included into the study for reference. Prior to the mechanical analysis, the polymeric fiber coating was removed by etching for 20 s at 100°C in concentrated sulfuric acid. After etching, the uncoated silica glass fibers were rinsed for 10 s with deionized water and subsequently dried in flowing nitrogen. Segments of the bare silica glass fibers (20 mm) were then glued on microscope slides (Carl Roth GmbH & Co. KG) in horizontal direction using a thin film of an acrylate adhesive (Verifix MV 760, Bohle AG, and Young’s modulus E = 1.2 GPa). The adhesive was cured for 10 min under a UV-A lamp. To ensure that each fiber segment was glued to the substrate over its entire length, an auxiliary glass slide was temporarily placed on top of the fiber segment as a counter weight during UV exposure. After removing the supporting glass slide, the polymer was allowed to cure for another 12–16 h in laboratory air under ambient conditions before mechanical characterization was conducted.
Nanoindentation
Instrumented indentation testing was carried out using a nanoindentation platform (G200, KLA Co.) equipped with a high-load option for loads up to P = 10 N. Young’s modulus E and hardness H were determined from indentation experiments with a Vickers diamond tip (Micro Star Technologies). On each glass sample, at least five indents were created with a maximum load of 2.94 N. The loading duration and dwell time were kept constant at 10 s and 5 s, respectively. The values of H were determined from the maximum load Pmax divided by the projected contact area of the indenter tip Ac (Oliver and Pharr, 1992):
The values of E were estimated from the combined elastic response of the diamond tip (Ei = 1141 GPa and vi = 0.07) and the material tested (Johnson, 1985):
with the reduced elastic modulus Er (Pharr et al., 1992)
The parameter S denotes the contact stiffness, i.e., the initial slope of the load-displacement P-h curve upon unloading (Oliver and Pharr, 1992). The tip area function and instrument frame compliance were calibrated prior to the first experiments on a silica reference glass sample (Corning Code 7980, Corning Inc.). In order to derive the values of E from Er (Eq. (2)), a constant Poisson’s ratio of v = 0.17 (Limbach et al., 2015) was assumed for all glass samples examined in this work. All Vickers indentations on the silica glass fibers were realized with one diagonal oriented parallel to the fiber axis.
Wedge-indentation experiments were conducted on the silica glass fibers using sharp wedge-shaped diamond tips (Synton-MDP, Switzerland; Figure 1). Two different wedge indenters were employed: (i) a tip with an opening angle of θ = 90° and an effective length of L = 215 μm and (ii) another tip with θ = 60° and L = 180 μm. Indentation experiments were conducted with defined indenter displacement h ranging from 0.5 to 10 μm in the high-load mode and with a constant strain-rate of = 0.05 s–1 (defined as the loading rate dP/dt divided by the actual load). If not otherwise stated, wedge indentations were realized with the wedge tip aligned at 90° with respect to the fiber axis (see, e.g., Figure 1). All indentation experiments were carried out in laboratory air under ambient conditions and with thermal drift rates of <0.05 nm/s. After indentation, the residual imprints were analyzed by standard optical microscopy and widefield confocal microscopy (Smartproof 5, Zeiss AG).
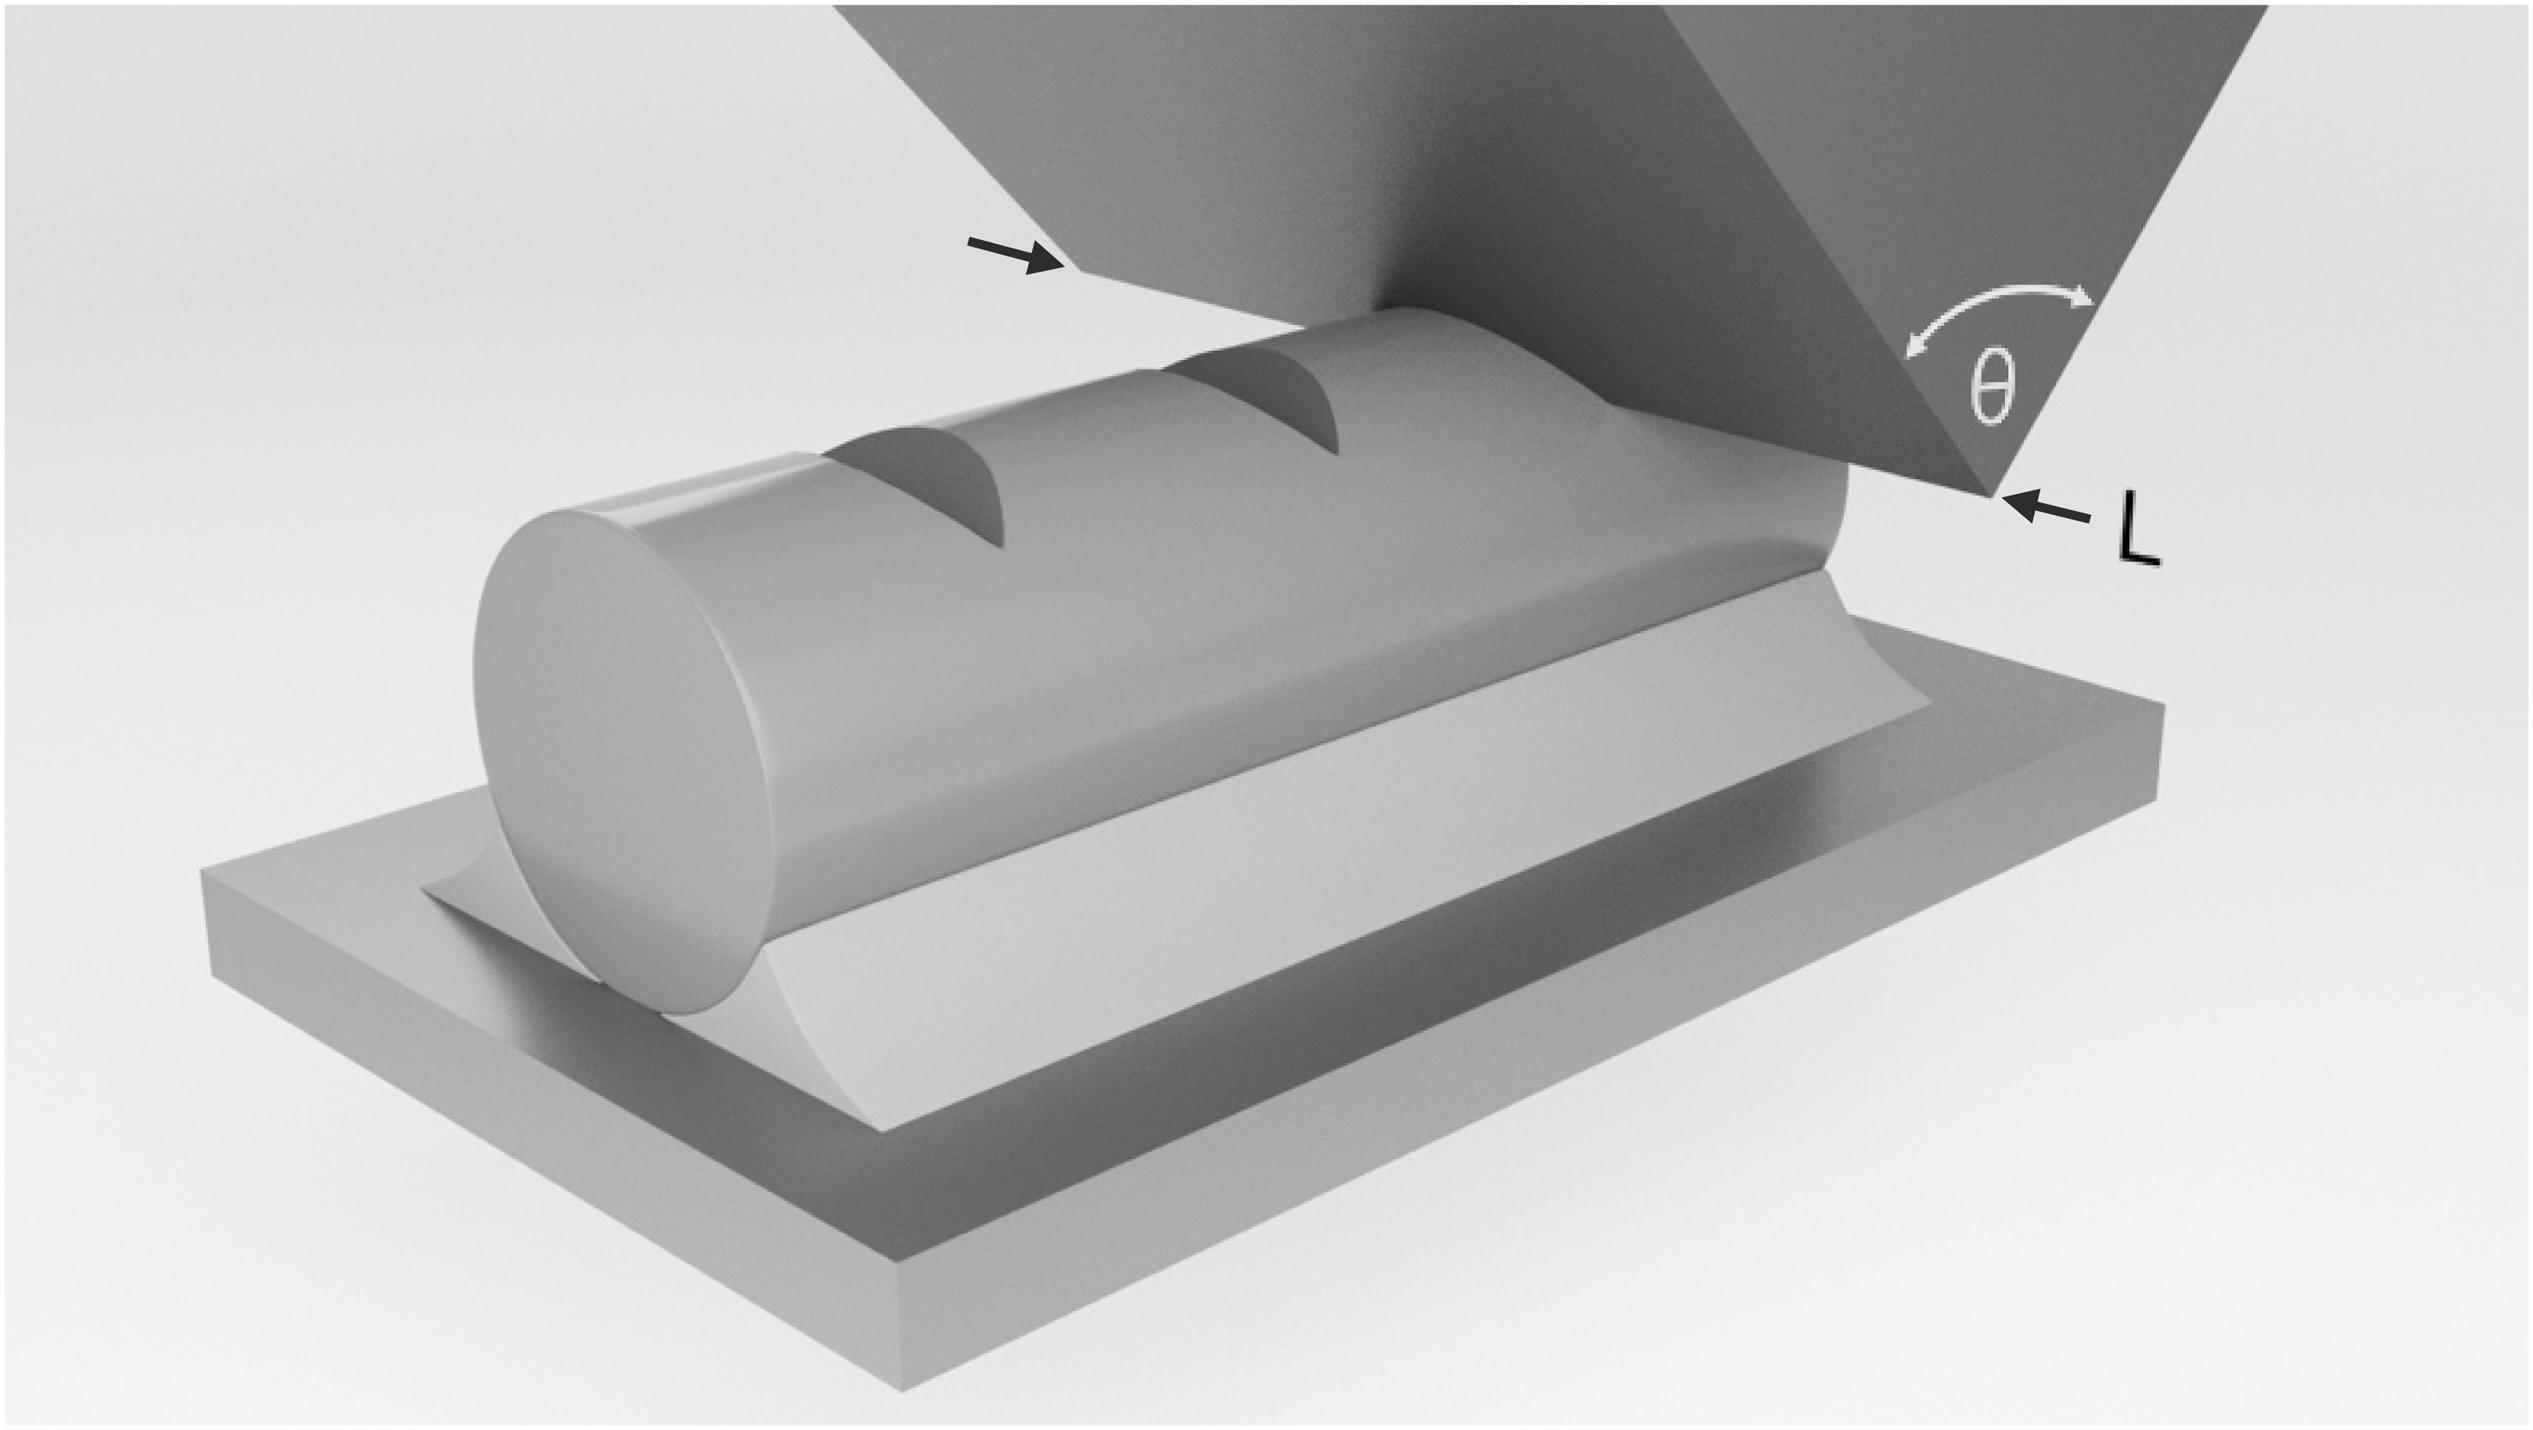
Figure 1. Schematic representation of a nanoindentation experiment on a silica glass fiber using a wedge-shaped tip with the opening angle θ and the effective length L.
Raman Spectroscopy
Raman spectroscopic analysis was carried out post mortem using a confocal Raman microscope (inVia, Renishaw Inc.) in scanning mode. Raman spectra were collected across a surface area of 30 μm × 10 μm with 1 μm spacing between individual measurement positions and a focal depth of 0–6 μm using an Argon laser (λ = 514.5 nm) and a 50× microscope objective. All spectra were recorded for wavenumbers ranging from 150 to 1500 cm–1 and with an accumulation time of 60 s per spectrum.
Results
Vickers Indentation on Silica Glass Fiber
In this section, we first illustrate the differences in the contact behavior between a sharp pyramidal Vickers indenter tip and a flat (Figure 2A) or a curved glass surface (Figure 2B). Exemplary P-h curves recorded during nanoindentation experiments on silica glass fibers with d = 440; 220; and 125 μm, respectively, are shown in Figure 2C. Experimental data from Vickers indentation on a bulk silica glass sample is added for reference. Regardless of the surface curvature, reproducible and smooth parabolic P-h curves were obtained. However, at any given load, consistently higher indenter displacements are recorded on the silica glass fibers in comparison to the flat bulk glass specimen. The magnitude of this effect increases with increasing surface curvature, i.e., decreasing fiber diameter: at Pmax = 245 mN, the values of h gradually increase from 1503 ± 4 nm (bulk silica glass) to 1520 ± 1 nm (d = 440 μm), 1528 ± 4 nm (d = 220 μm), and 1565 ± 1 nm (d = 125 μm), respectively. This trend is more obvious when P is plotted against h2 (Figure 2C, inset). Since the slope of the P-h2 curve directly scales with hardness H, this observation indicates that H is systematically underestimated with decreasing d. The same effect was observed for the whole load range up to 2.94 mN. For verification, the values of the apparent hardness Ha were estimated following the protocol described in section “Nanoindentation.” The results of these calculations are shown in Figure 2D. Corresponding data on apparent Young’s modulus Ea are provided for comparison. In accordance with a previous report (Lonnroth et al., 2008), both Ea and Ha scale linearly with 1/d.
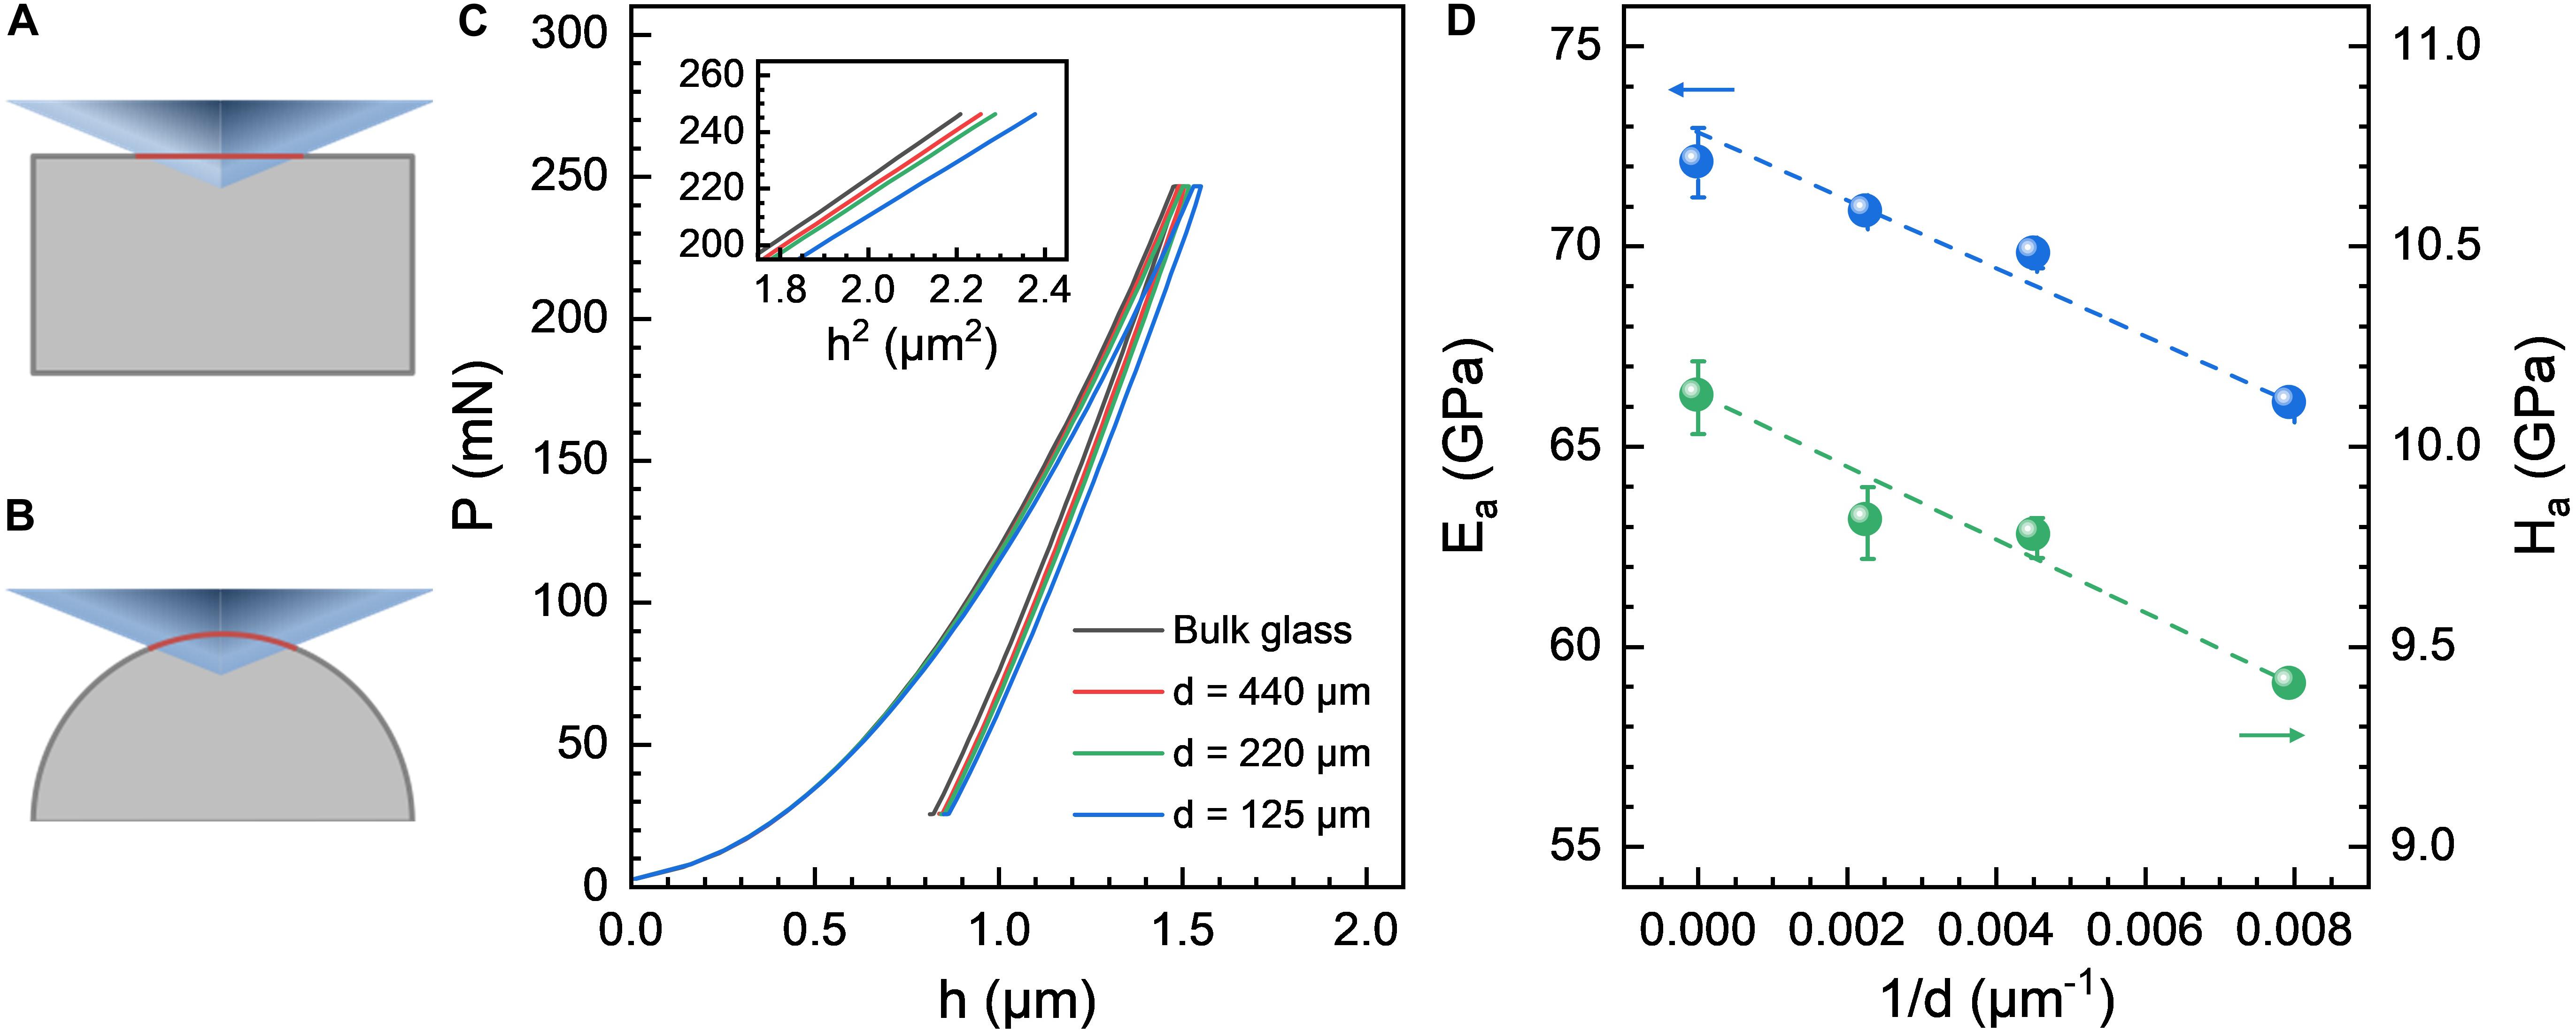
Figure 2. (A) Schematic illustration of the contact behavior between a Vickers tip and (A) flat or (B) curved glass surfaces. The contact areas projected on the original surfaces are marked in red. (C) Representative load-displacement P-h curves as recorded from nanoindentation experiments on bulk vitreous silica and silica glass fibers of varying diameter d using a Vickers tip. The inset displays P as a function of h2. (D) Apparent Young’s modulus Ea and hardness Ha as a function of fiber diameter.
Wedge-Indentation on Silica Glass Fiber
In contrast to standard nanoindentation protocols on flat glass surfaces, where only the distance between the individual indents needs to be considered in order to avoid cross-interaction (Phani and Oliver, 2019), the mechanical characterization of silica glass fibers by instrumented indentation testing offers further challenges. This is not only due to surface curvature and its implications for the contact behavior (Lonnroth et al., 2008), but also because even small offsets between the tip position and the fiber apex may lead to strongly varying experimental results (Dabbs and Lawn, 1985; do Nascimento and Lepienski, 2006; Lonnroth et al., 2008; McAllister et al., 2012). We demonstrate this by intentionally misaligning the Vickers indenter on a 125 μm silica glass fiber (Figure 3A): post mortem optical inspection of the residual imprint reveals a highly asymmetric shape (the micrographs recorded by widefield confocal microscopy only display the illuminated area which was in focus during image capture). Nanoindentation testing using a wedge-shaped tip, on the other hand, usually resulted in repeatable, highly symmetric indents (Figure 3B). Apparent self-alignment of the wedge indenter relative to the fiber apex occurs for as long as the effective length of the wedge-shaped tip exceeds the contact length Lc during indentation (e.g., Lc ∼ 83 μm for a 3.26 N indent on a 440 μm silica glass fiber produced by a wedge indenter with θ = 90° and L = 215 μm). This provides for highly reproducible contact conditions for any given orientation between the wedge and the fiber axis (Figure 3C).
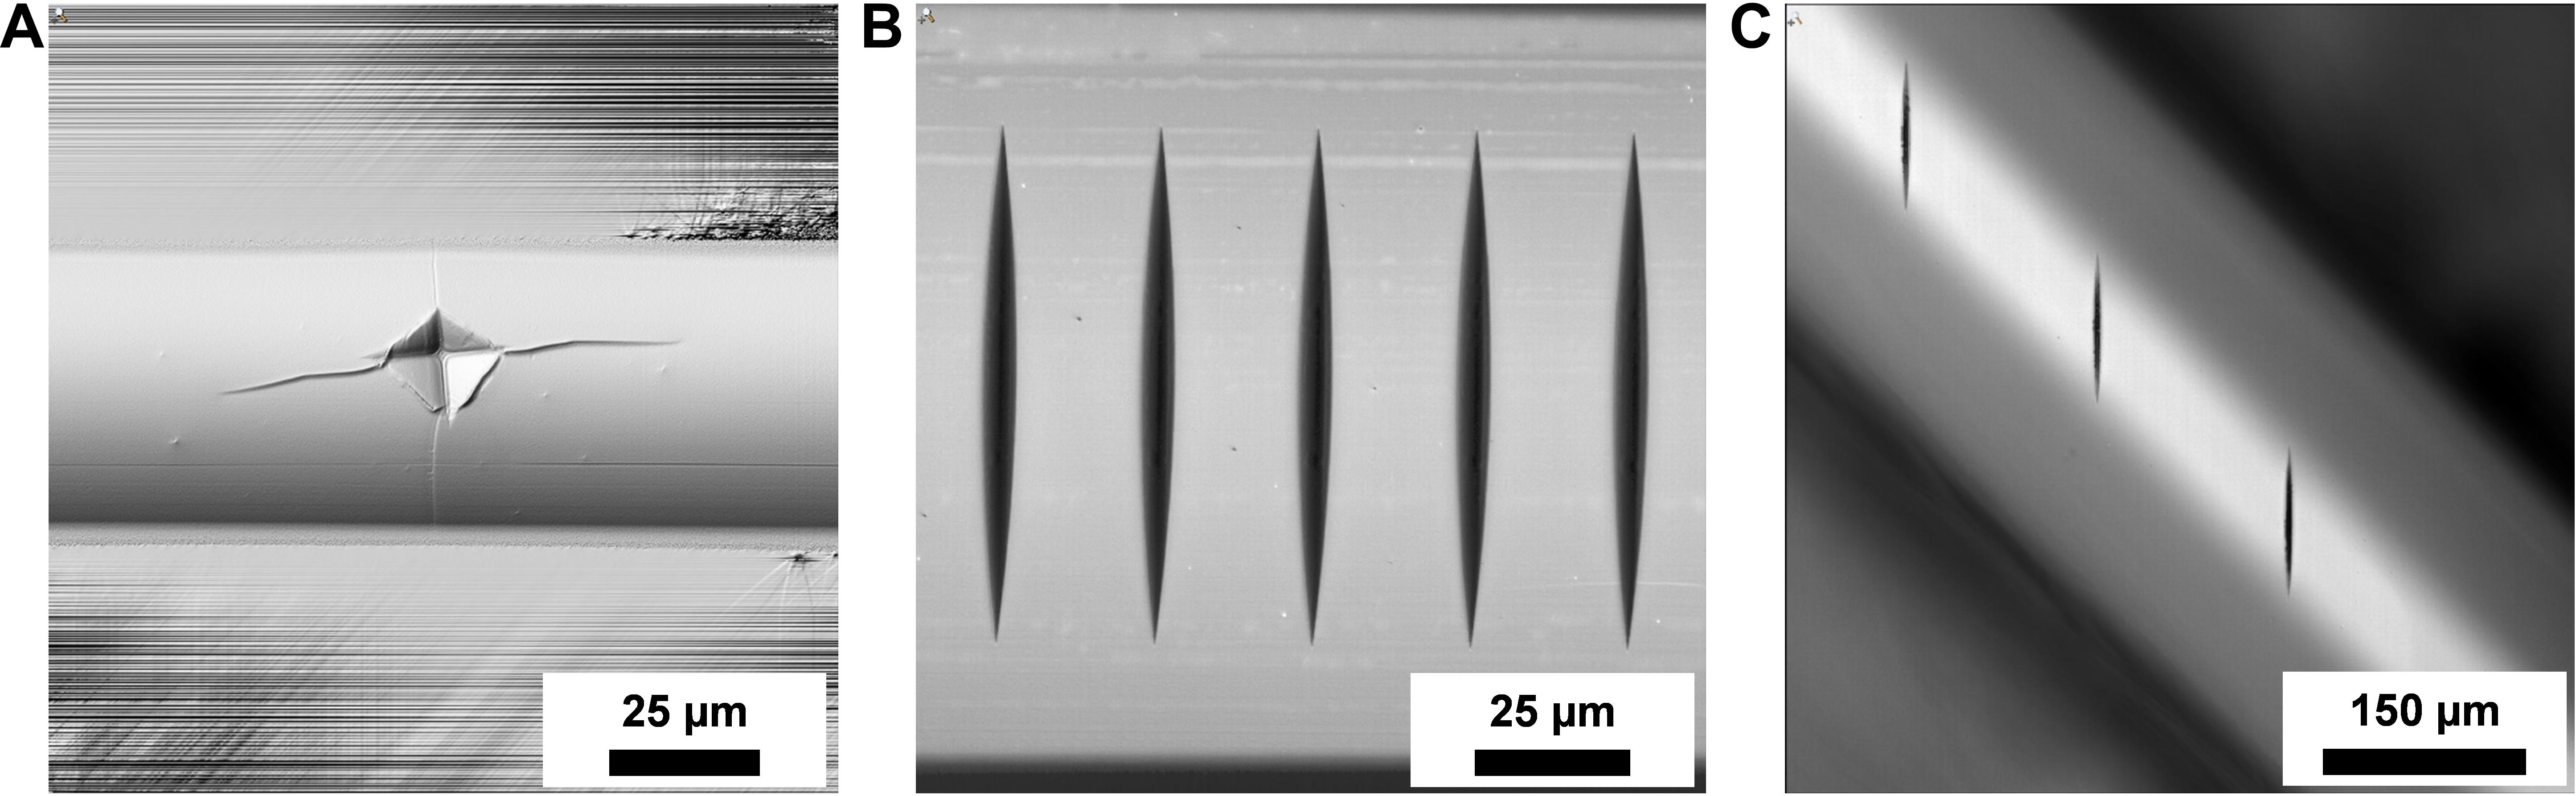
Figure 3. (A) Surface visualization of a residual Vickers hardness imprint created at a normal load of 2.94 N on a 125 μm silica glass fiber. The asymmetric shape results from intentional misalignment of the Vickers tip relative to the fiber apex by about 7 μm. (B–C) Optical micrographs of residual imprints on a 440 μm silica glass fiber produced with a wedge-shaped tip with an opening angle of 90° and an effective length of 215 μm in (B) 90° and (C) 45° orientation relative to the fiber axis. The maximum loads were 3.62 N and 4.06 N, respectively.
Representative P-h curves of wedge-indentation (θ = 90° and L = 215 μm on a 440 μm silica glass fiber, Figure 3B) are presented in Figure 4, recorded during indentation to maximum normal loads ranging from 290 mN up to 8.98 N. Similar to indentation with the sharp Vickers tip (Figure 2C), repeatable and smooth parabolic P-h curves were obtained over the full range of loads. This directly reflects the aforementioned self-alignment of the wedge indenter leading to highly reproducible contact conditions. Optical inspection of the residual imprints (Figures 4B–E) indicates a gradually increasing imprint size with increasing maximum load, on first view without any further variations in the overall material response. In particular, no cracking is observed up to Pmax = 8.98 N [for reference, vitreous silica starts to crack at ∼0.25 N (Li et al., 2019) to 1.50 N (Mound and Pharr, 2019) when sharp Vickers or Berkovich tips are used].
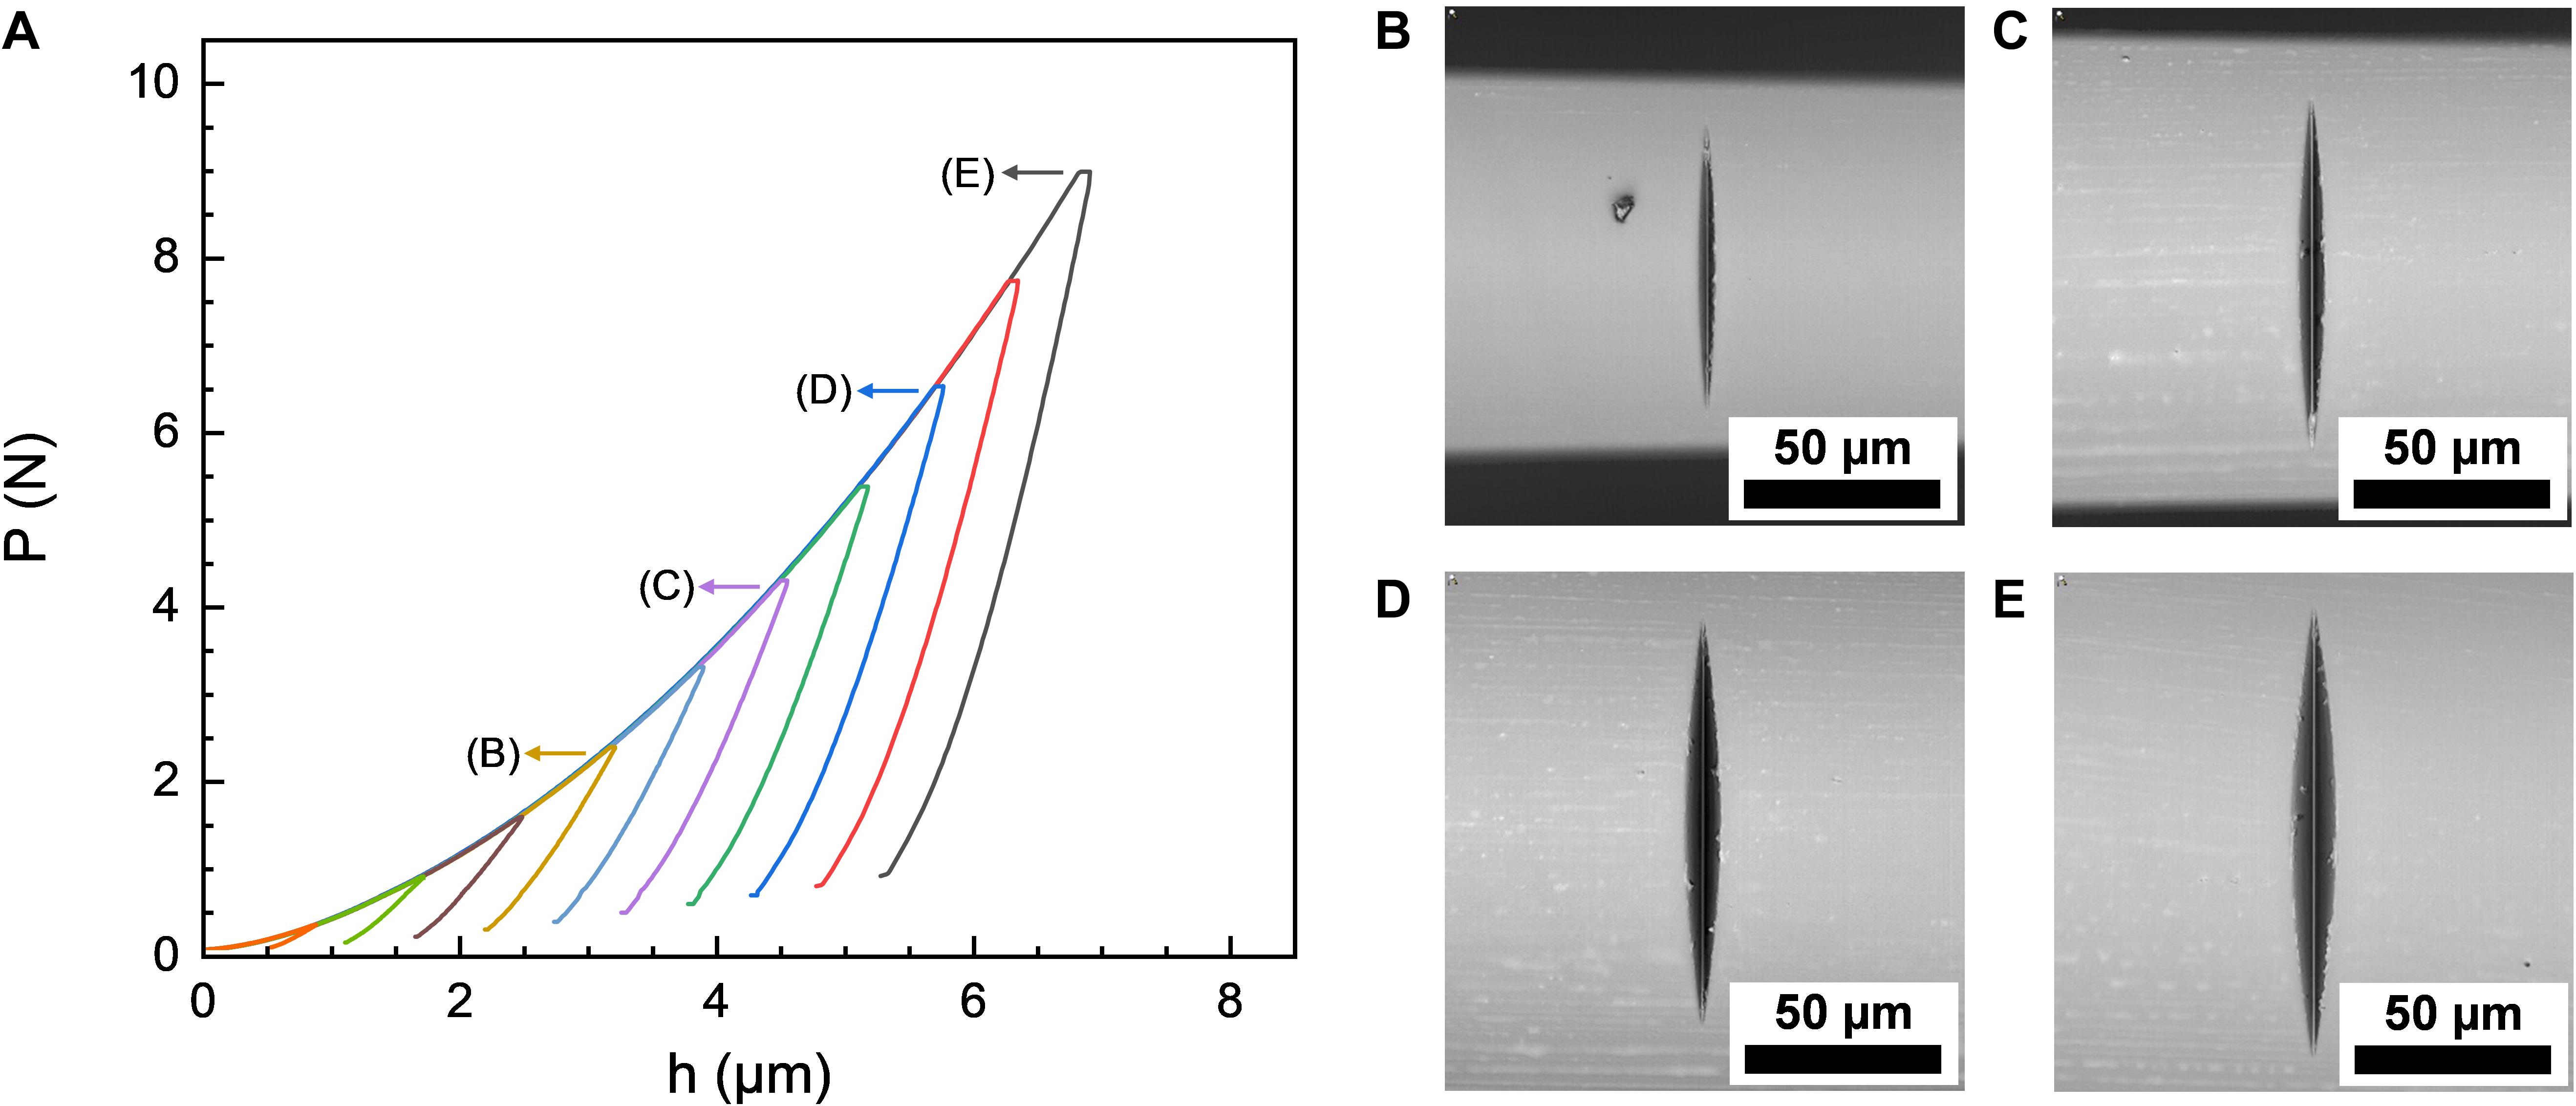
Figure 4. (A) Representative load-displacement P-h curves recorded during wedge-indentation on a 440 μm silica glass fiber using a wedge with an opening angle of 90° and an effective length of 215 μm. Optical micrographs of the corresponding residual imprints (after unloading) are shown for indentations with maximum normal loads of (B) 2.34 N, (C) 4.26 N, (D) 6.52 N, and (E) 8.98 N.
In Figure 5, post mortem Raman mapping data are presented for the imprint shown in Figure 4E, with exemplary individual scans in Figure 5A collected at the rim (red curve) and at a distance of 15 μm from the center of the indent (blue curve). For a qualitative assessment of spatial variations in the indentation-induced structural modifications, individual Raman spectra were evaluated in terms of the spectral center of gravity (COG). For this, each Raman spectrum was integrated over the spectral range of 200 to 700 cm–1 after baseline subtraction (Figure 5A, blue curve, and shaded area) following the protocol of Deschamps et al. (2013). Positive shifts in the COG of the silica Raman spectrum were previously assigned to congruent densification of the glass network during sharp contact loading (Bruns et al., 2020; Gerbig and Michaels, 2020). In the present case, the values of COG cover the range of 433 to 477 cm–1 (Figure 5B). The highest degree of densification is found in the flanks of the residual wedge imprint, gradually decreasing toward the value of bulk silica glass with increasing distance from the wedge apex. While we do not intend to go into detail here about the nature of structural densification in terms of the underlying molecular reactions, we note that wedge-indentation provides a homogeneous stress field, and resulting Raman map in the direction of the wedge over a length of several tens of μm. In comparison, the widely employed Vickers or Berkovich indentation studies (Winterstein-Beckmann et al., 2014a, b) produce significantly more complex stress fields and low spatial accuracy in the Raman spectroscopic evaluation of residual imprints (Bruns et al., 2020).
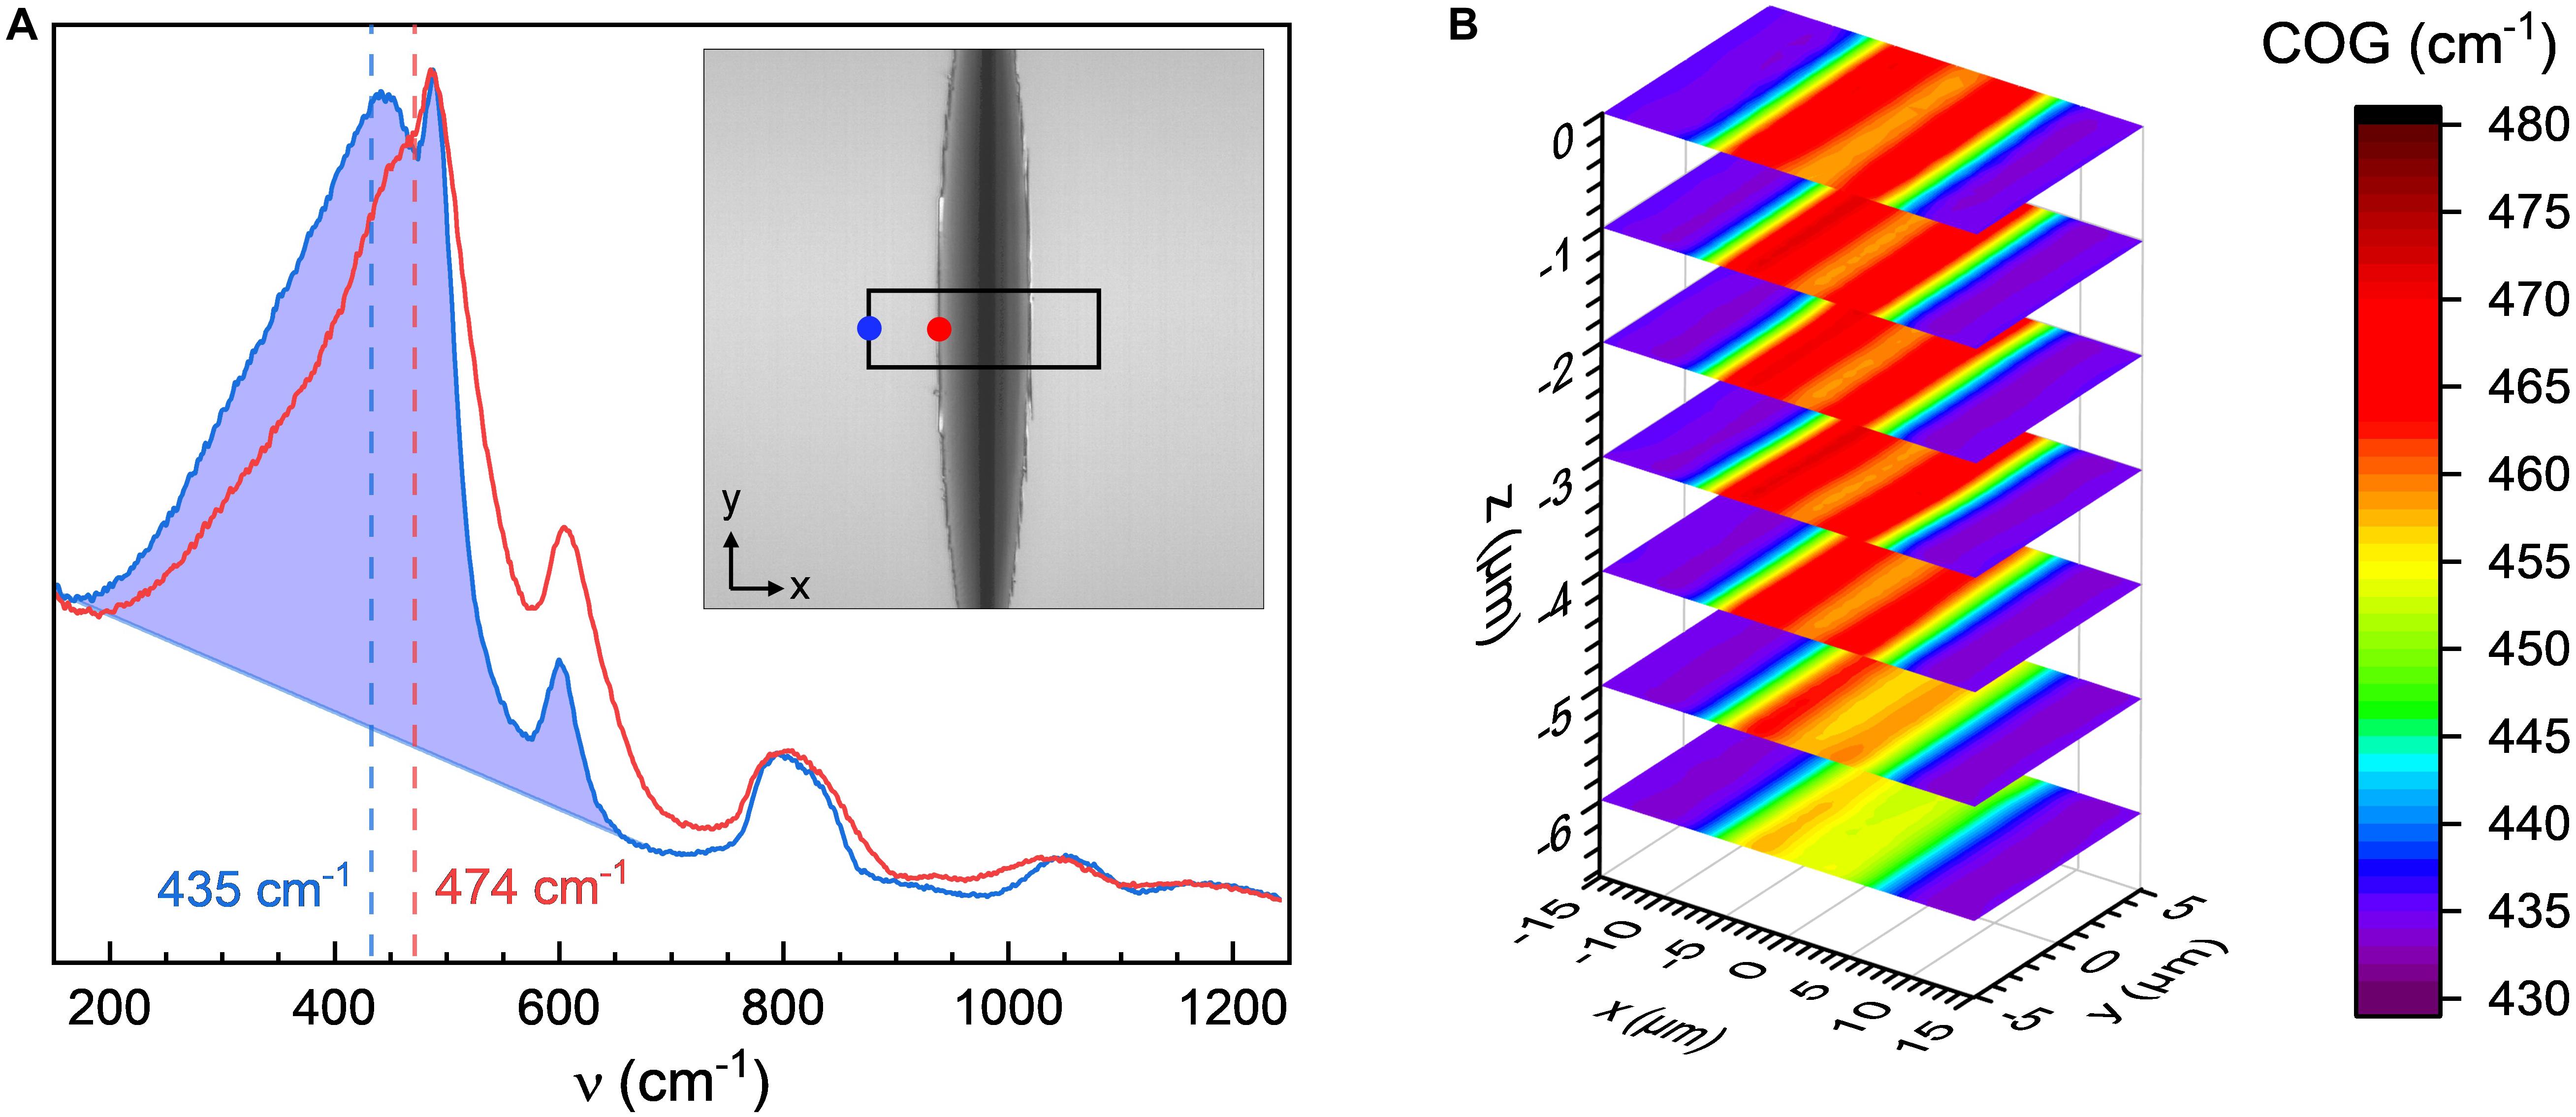
Figure 5. Raman spectroscopic analysis of a residual imprint on a 440 μm silica glass fiber, produced under a normal load of 8.98 N with a wedge with an opening angle of 90° and an effective length of 215 μm. (A) Individual Raman spectra recorded at the rim (red curve; inset: red dot) and at a distance of 15 μm from the center of the imprint (blue curve; inset: blue dot), respectively. The shaded section on the blue curve shows an example of the determination of the spectral center of gravity (COG); COGs are marked with dashed lines. (B) Three-dimensional representation of the COG mapped across an area of 30 μm × 10 μm from the fiber surface (z = 0) and down to a depth of 6 μm.
It is well-established from experiments (Yoshida et al., 2010; Gross, 2012; Mound and Pharr, 2019) and finite element simulation (Bruns et al., 2017, 2020) that sharper tips (pyramidal indenters with lower center-axis-to-face angle) produce higher local stress, thereby reducing the load threshold for indentation cracking in vitreous silica. In order to assess the influence of the opening angle of a wedge-shaped tip on the indentation response of curved glass surfaces, a second wedge indenter with θ = 60° and L = 180 μm was employed for comparison to the 90° wedge. Indents were created with maximum normal loads of up to 1.67 N on the same set of silica glass fibers as with the 90° wedge. While crack-free imprints were received from indentations with Pmax = 8.98 N on a 440 μm silica glass fiber when θ = 90° (Figure 4E), on the same fiber, indentation-induced cracking was noticed already at loads ranging from 25 to 813 mN when using the wedge with θ = 60° (Supplementary Figure S1). Crack initiation was detected not only from post mortem optical inspection, but also reflected in the occurrence of sudden displacement bursts or “pop-ins” in the P-h curves recorded in situ during nanoindentation testing. This phenomenon is shown in Figure 6 on the examples of two individual indentation experiments on a 220 μm silica glass fiber using a wedge-shaped tip with θ = 60°, i.e., for a crack-free indent (Figure 6A, blue curve) and for an indent where pronounced chipping was noticed (Figure 6A, green curve). Optical micrographs of the corresponding residual imprints are provided in Figures 6B,C, respectively. In the absence of cracking, a smooth, parabolic P-h curve was recorded during progressive increase of normal load up to Pmax = 490 mN (Figure 6A, blue curve). Cracking materialized as an abrupt increase of the indenter displacement at almost constant load (in the shown example, this occurred at P ∼ 405 mN, Figure 6A, and green curve). Furthermore, a large number of small serrations was observed in the P-h curve upon unloading (Figure 6A, green curve, and inset).
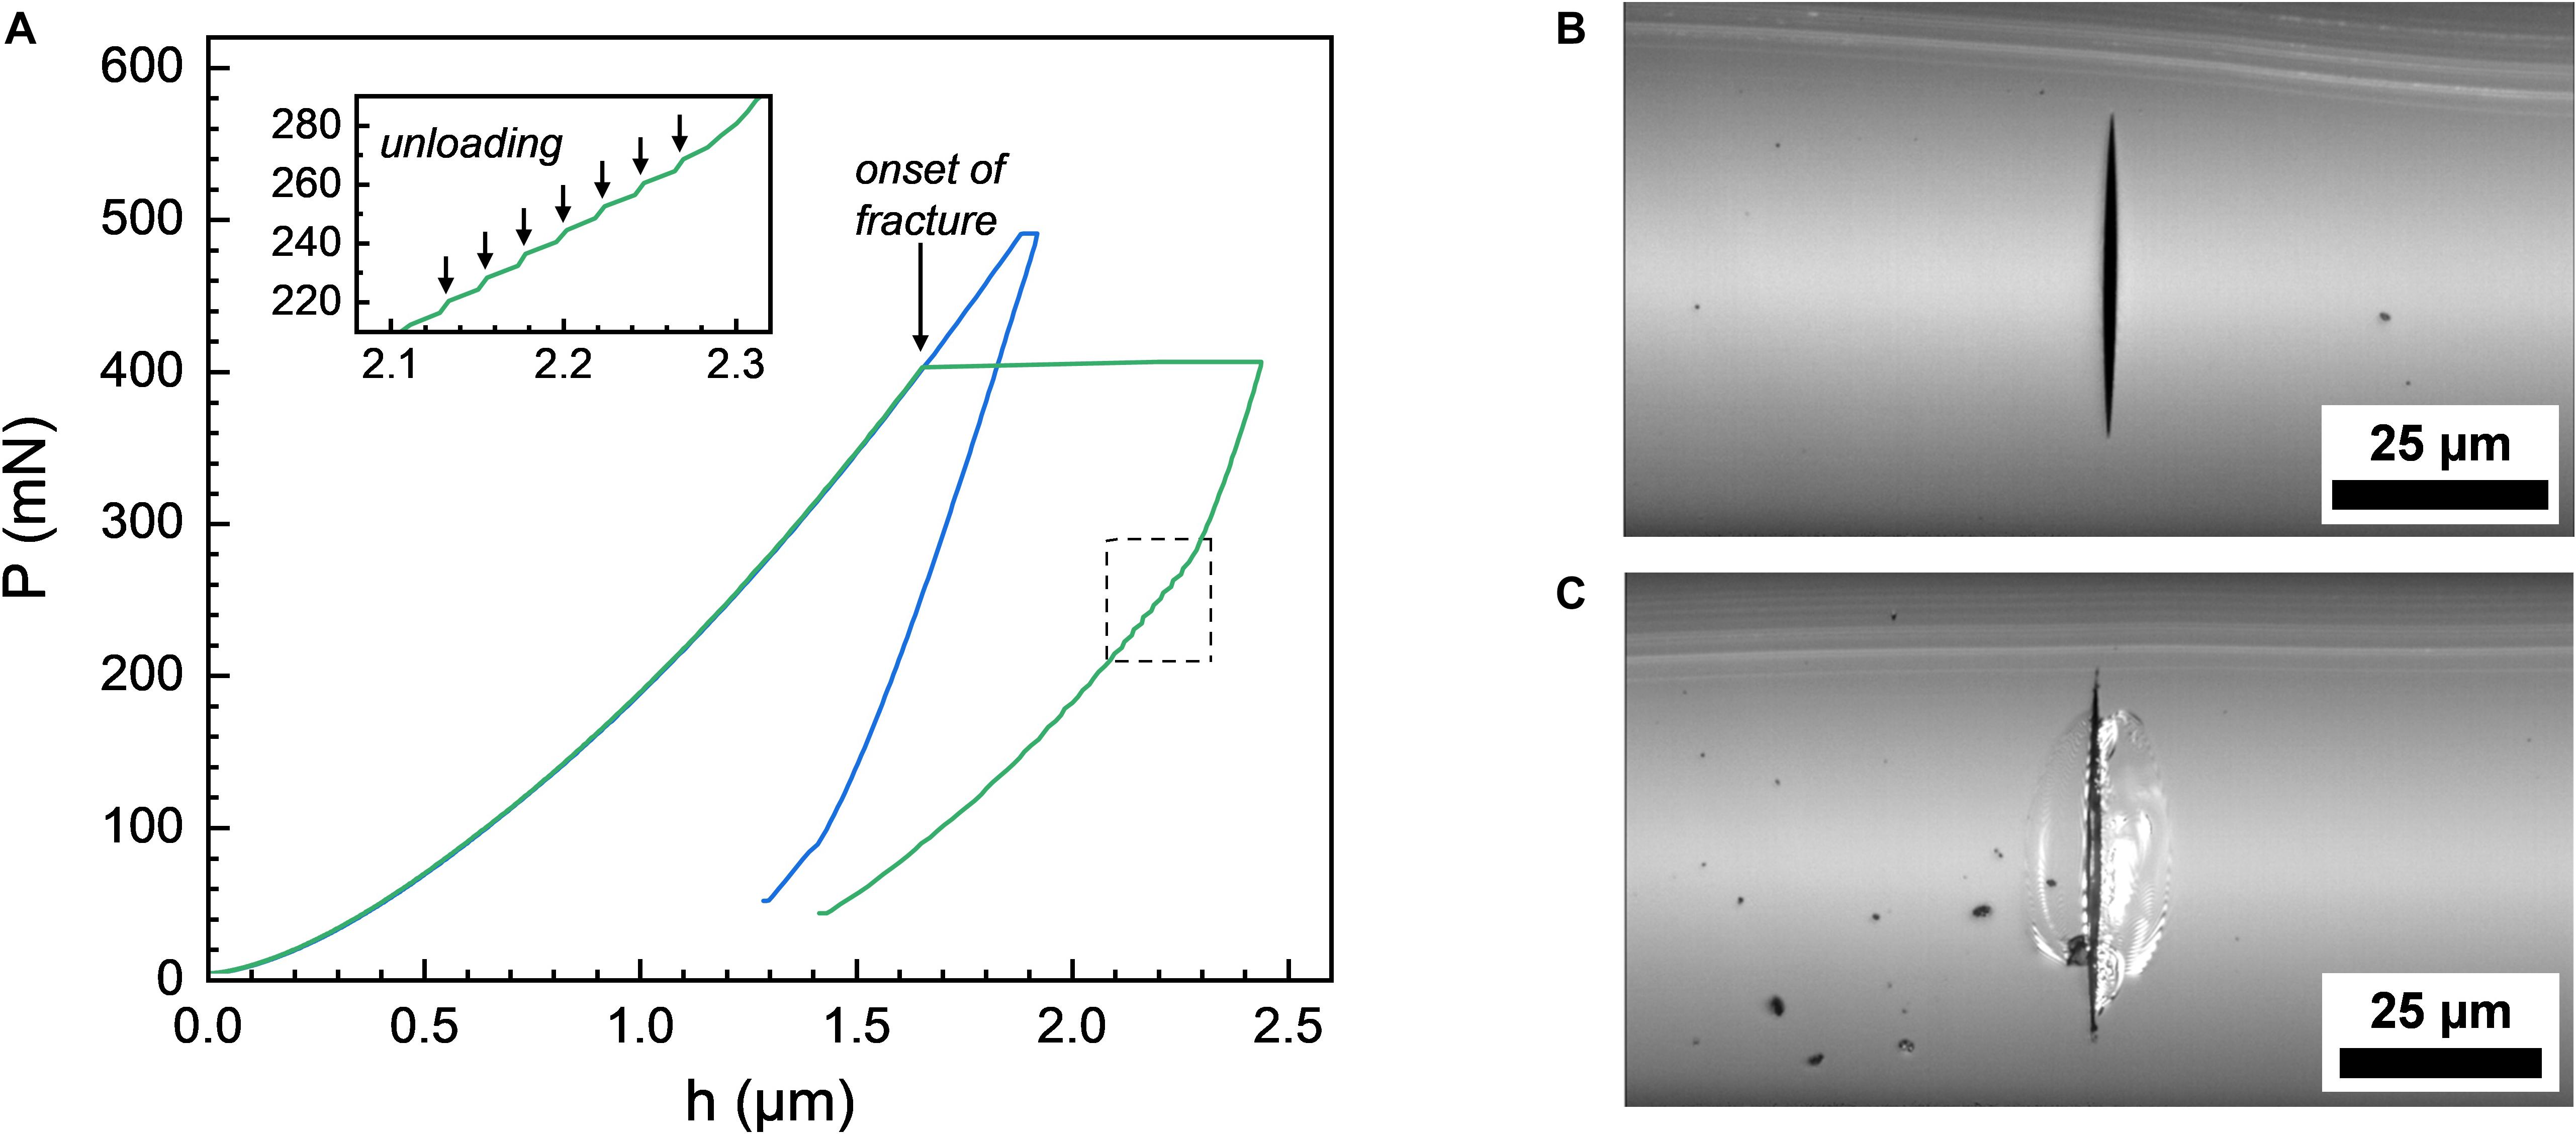
Figure 6. (A) Representative load-displacement P-h curves as recorded from nanoindentation experiments on a 220 μm silica glass fiber using a wedge-shaped tip with an opening angle of 60° and an effective length of 180 μm. The sudden displacement burst at around 405 mN indicates the onset of fracture (green curve). In this case, multiple serrations occur upon unloading (green curve, inset). Corresponding optical micrographs of residual imprints are provided in (B) for the crack-free indent with a maximum load of 490 mN (blue curve), and (C) for the cracked specimen with a maximum load 405 mN (green curve).
Following these observations, series of up to 25 indentations were created on silica glass fibers with d = 440 μm, 220 μm, and 125 μm, respectively, using the sharper wedge with θ = 60°. The corresponding P-h curves obtained on the 220 μm silica glass fiber are shown in Figure 7A (experimental data recorded for the 440 and 125 μm silica glass fibers are provided as supplementary information in Supplementary Figures S1, S2, respectively). Even under identical experimental (ambient) conditions, there is a strong variability in the loads at which the first pop-in occurred, denoted Ppop–in, as well as in the magnitude of the displacement bursts. For example, on the 220 μm fiber, the first pop-in was observed within a load range of 13–784 mN (Figure 7A). On first view, the magnitude of the displacement bursts seemed to scale with Ppop–in (Figure 7A), where larger pop-ins were found for higher values of Ppop–in. The latter suggests a relation between Ppop–in and the size of the deformed volume. In order to emphasize this argument, the experimental values of P were converted into a representative mean indentation stress σr:
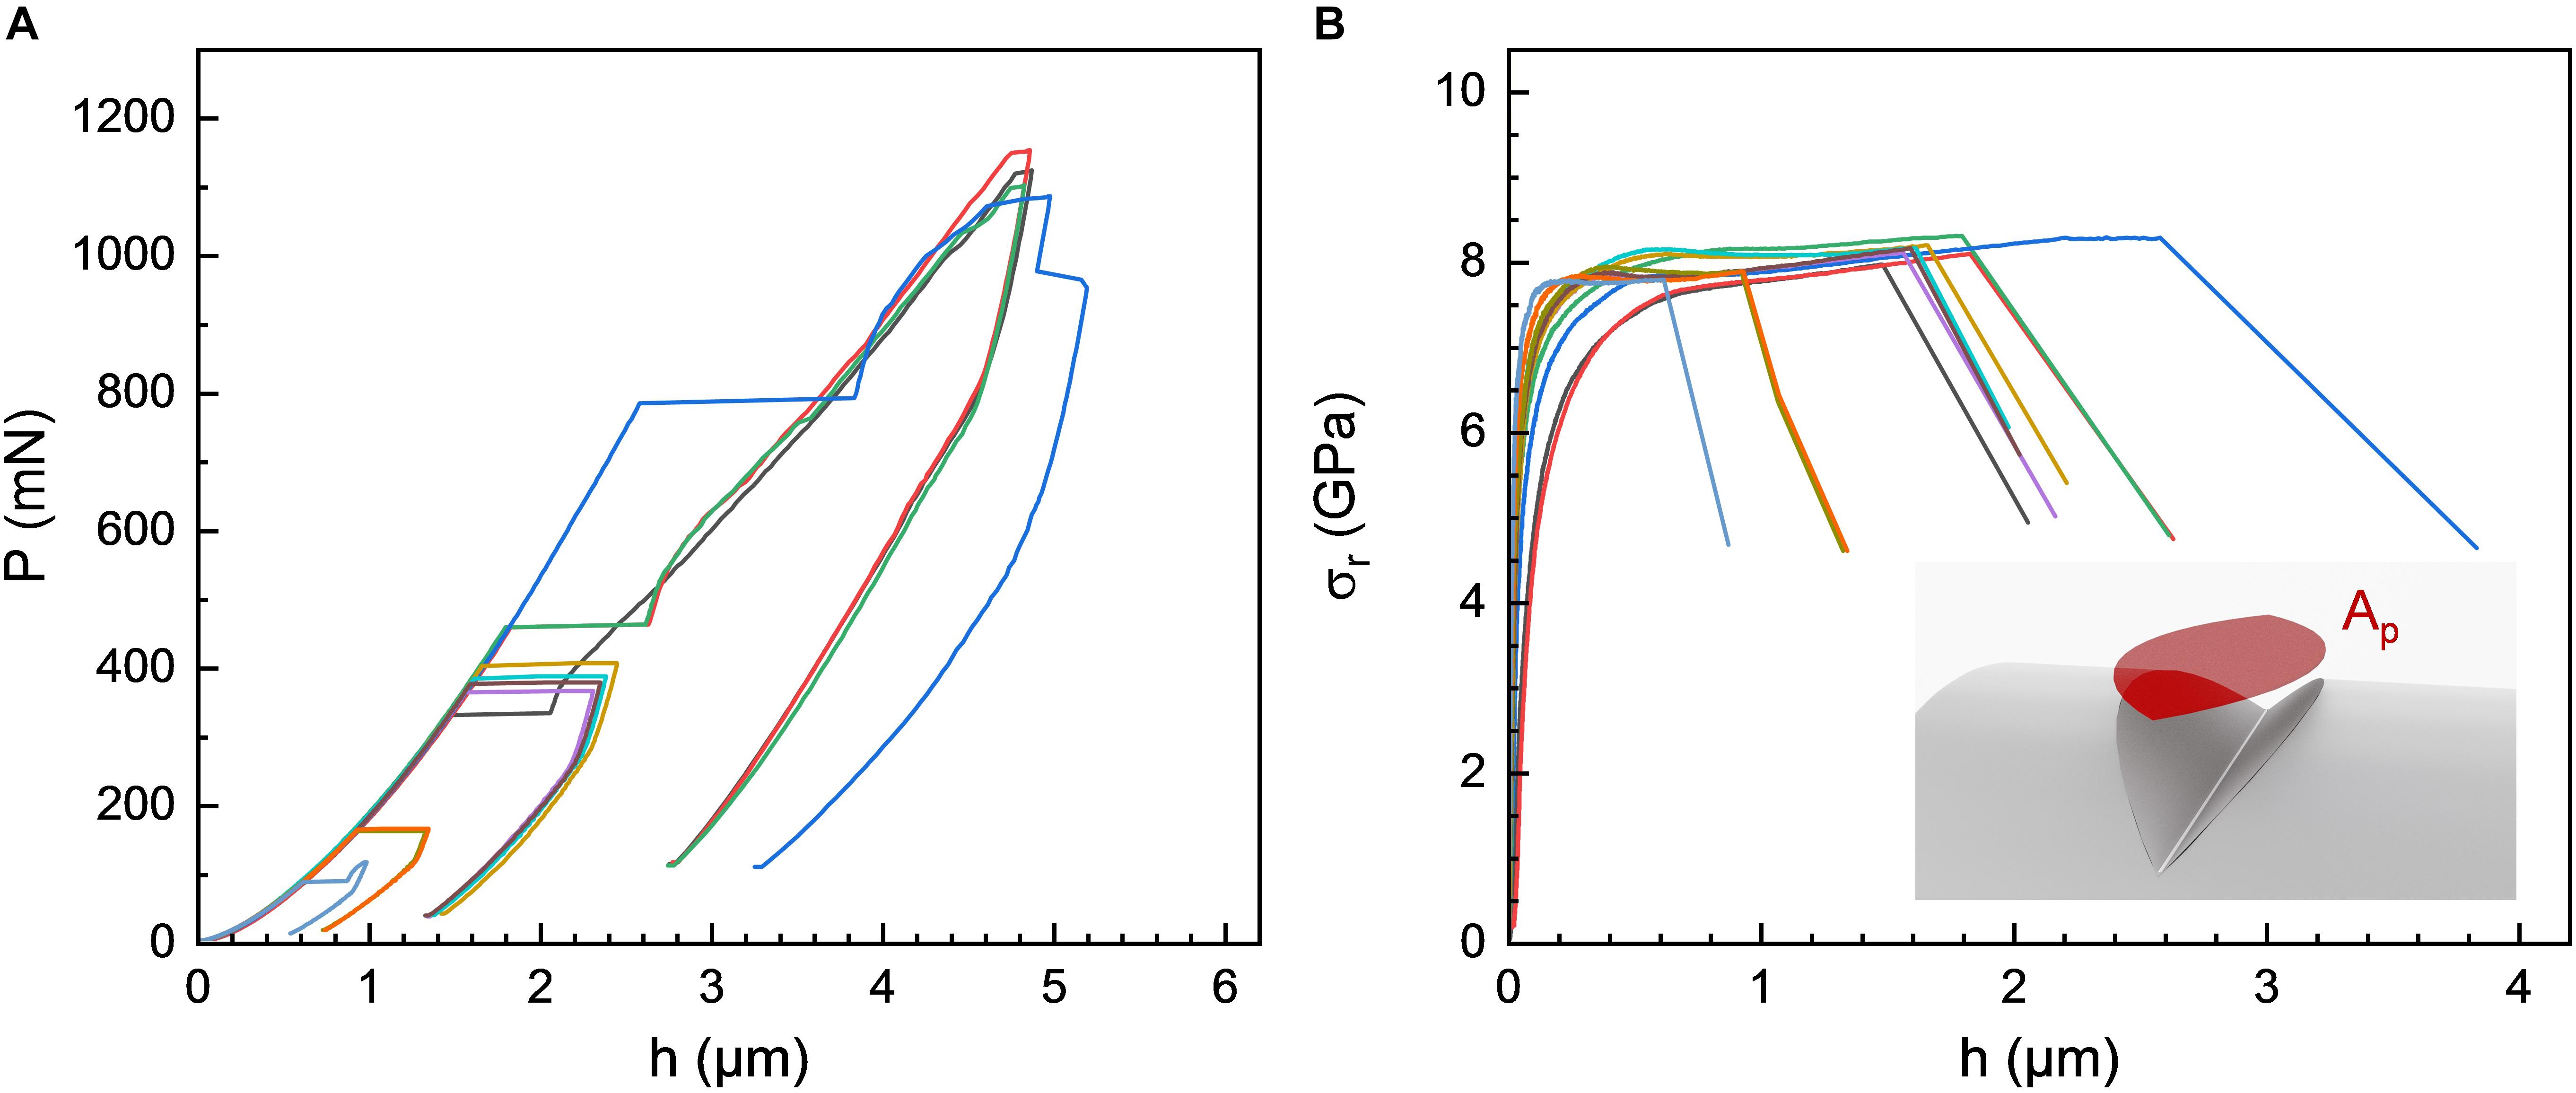
Figure 7. (A) Examples of load-displacement P-h curves recorded from nanoindentation experiments on a 220 μm silica glass fiber using a wedge-shaped tip with an opening angle of 60° and an effective length of 180 μm. (B) Corresponding depth profiles of the representative mean indentation stresses σr. In (B), data are presented up to the occurrence of the first pop-in event.
Neglecting the effects of sink-in and pile-up, Ap represents the projected contact area of the wedge indenter (Figure 7B and Supplementary Figure S4A),
This approach resolves the apparent scatter in the Ppop–in data: when normalized to the projected contact area, the first pop-in event is observed within a relatively narrow range of representative stress, i.e., within 7–8 GPa (Figure 7B). Further evaluation will require accurate knowledge of the true contact area. In the absence of such knowledge, the above approach is employed for approximation. For low fiber curvature or low indentation depth, Ap is very close to the enveloping cylinder section As (i.e., the cylinder surface section opened by the wedge, see Supplementary Figure S4). The lateral contact area A relative to Ap is constant for any given wedge opening angle, e.g., A/Ap = 2 for θ = 60°.
Discussion
Evaluation of the deformation behavior and fracture processes in glasses by (nano) indentation testing typically relies on rigid, ideally sharp pyramidal Vickers or Berkovich tips penetrating a co-planar, and optically polished glass surface (Taylor, 1949; Rouxel, 2015; Sawamura and Wondraczek, 2018; Cook, 2019). In practice, however, indentation experiments are often performed on rough and slightly tilted surfaces (Xu and Li, 2007). Surface asperity usually leads to low data reproducibility (Kim et al., 2006). A tilted surface would cause a systematic deflection of the load-displacement curves recorded in situ during indentation (Oliver and Pharr, 2004; Wang and Liu, 2019); its effects can be analyzed post mortem on the shape of the residual imprints (Kashani and Madhavan, 2011). Accurate knowledge of the tilt angle allows for data correction in terms of the asymmetric contact between the indenter tip and the tested material (Kashani and Madhavan, 2011; Wang and Liu, 2019). On the other hand, such routines are not applicable to curved glass fiber surfaces, on which the “local tilt angle” continuously changes throughout the indentation experiment. It depends on fiber surface curvature, tip geometry, initial offset between tip position and fiber apex, and indenter displacement. For example, when the indenter tip is aligned optically, with a numerical aperture of 0.25 at an observation wavelength of ∼500 nm, an accuracy of ∼2 μm is achieved in tip positioning. For a fiber with a diameter of 125 μm, such an offset between the tip position and the fiber apex would already correspond to a local tilt angle of ∼3° at the initial point of contact (or ∼10° for a moderate offset of about 7 μm as illustrated in Figure 3A). Wedge-indentation overcomes this issue. Potential misalignments of the wedge indenter with respect to the fiber apex are negligible for as long as a contact between the corners of the wedge indenter and the glass surface is avoided (that is, when the contact length during indentation remains smaller than the effective length of the wedge). Highly symmetric indents were consistently generated on the surface of silica glass fibers of varying diameters throughout this study (Figures 3B, 4E,F). On a side note, crack-free wedge imprints can be used as well-defined, highly reproducible defects for further studies of crack initiation, crack propagation and fracture toughness. Such artificial defects (mimicking naturally occurring surface flaws) are often generated with sharp pyramidal Vickers or Berkovich tips (Dabbs and Lawn, 1985; Donaghy and Dabbs, 1988; Jakus et al., 1988; Lin and Matthewson, 1996; do Nascimento and Lepienski, 2006; Cui et al., 2019). In view of precise tip alignment (Dabbs and Lawn, 1985; do Nascimento and Lepienski, 2006), using wedge-shaped tips appears to be more suitable for such experiments.
A primary feature of wedge-indentation is the unidirectional stress field produced by a wedge indenter and the accompanied homogeneous stress and strain distribution parallel to the wedge axis (Figure 5B). In previous experiments, the structural response of vitreous silica and other glasses to local mechanical contact was almost exclusively studied by post mortem Raman spectroscopic investigation of residual Vickers, Berkovich or cube-corner hardness imprints (Perriot et al., 2006; Winterstein-Beckmann et al., 2014a, b; Bruns et al., 2020). However, such analyses are strongly complicated by local stress amplification near the sharp edges of the pyramidal indenters (Perriot et al., 2006). Even more critical, the limited spatial resolution of the Raman probe leads to signal integration over regions with large property gradients (Bruns et al., 2020). For this reason, indentations with loads well beyond the onset of crack initiation are normally performed to create sufficiently large imprints and minimize the degree of structural averaging (Malchow et al., 2015; Bruns et al., 2020; Gerbig and Michaels, 2020). The presence of cracks is often supposed to be of minor importance for the structural analysis (Kassir-Bodon et al., 2012), but interactions with the Raman probe cannot safely be excluded (Bruns et al., 2020; Gerbig and Michaels, 2020). In order to obtain meaningful, unambiguous vibrational spectroscopic data on the indentation-induced structural changes in glasses, the availability of crack-free, and high-load indentations would be favorable. For example, this was partially realized by operating the (nano) indenter under inert atmospheres (Gross and Tomozawa, 2008). Wedge-indentation provided another option on the same line. Using a wedge-shaped tip with θ = 90° and L = 215 μm, we were able to generate reproducible, highly symmetric indents over a wide range of loads up to Pmax = 8.98 N (Figures 4B–E). Remarkably, the indentations with the highest loads of Pmax = 8.98 N remained crack-free (Figure 4E), even after storing the indented silica glass fibers for a period of 6 months in laboratory air under ambient conditions (supplementary information in Supplementary Figure S3). Aside post mortem structural analysis by vibrational spectroscopy, this feature has been motivating the use of wedge-indentation also for in situ analysis of the indentation-induced structural modifications in vitreous silica by small-angle X-ray scattering (Fuhrmann et al., 2020).
It remains to be explored if the unidirectional stress field produced by a wedge-shaped tip may also facilitate the in-depth analysis of the mechanical properties of anisotropic glasses (Endo et al., 2015). Although glasses are usually referred to as isotropic materials, structural anisotropy can be induced by frozen-in strain, e.g., during fiber drawing (Brückner et al., 1980; Stockhorst and Brückner, 1986; Inaba et al., 2015). The accessible degree of structural anisotropy depends on the molecular structure of the glass network and its propensity to self-organize into a preferential direction when subjected to large stress at temperatures above the glass transition (Inaba et al., 2015; Yang et al., 2017; Inaba et al., 2020). As a hypothesis, glasses with pronounced structural anisotropy respond differently to the unidirectional stress field produced by a wedge indenter as compared to isotropic materials. We may then speculate that variations in the orientation of the wedge indenter with respect to the fiber axis (as exemplarily illustrated in Figures 3B,C) can reveal potential differences in the mechanical behavior of anisotropic glasses.
Using a sharper wedge, surface cracks can be generated (Figure 6C). Such cracks are readily visible in situ as sudden displacement bursts (pop-ins) in the load-displacement curve (Figures 6A, 7A). At first glance, these discontinuities display some similarities to fluctuations in the load-displacement curves which were observed in scratch-induced micro-abrasion on the surface of vitreous silica (Moayedi and Wondraczek, 2017; Sawamura et al., 2018; Sawamura et al., 2019), where material removal was supposed to occur abruptly via chipping (Lee et al., 2018). Indeed, in post mortem optical inspection, chipping also dominates the crack pattern on silica glass fibers indented by a wedge-shaped tip with an opening angle of 60° (Figure 6C). Once chipping occurs, there is a rapid loss of contact between the wedge indenter and the surrounding material, which is compensated by an abrupt increase in the indenter displacement (Figures 6A, 7A). This assumes that the derived crack pattern indeed corresponds to the in situ observations. The fracture process continues during unloading (Figure 6A, inset) and (potentially) sample storage.
A statistical evaluation of the occurrence of the first pop-in is provided in Figure 8 in the form of a Weibull probability distribution of the representative stress at which the first pop-in was observed for variable fiber diameter. We obtain effective (overall) Weibull moduli m of 20, 27, and 53 for fiber diameters of 440, 220, and 125 μm, respectively, whereby all data seem to converge in a high-strength mode with mh ∼ 50, and a low-strength mode with significantly lower ml (broader distribution of chipping events in terms of σr). The latter regime is more pronounced for higher fiber thickness. The obtained values compare to an upper limit in the order of m ∼ 102 for tensile testing of “perfect” (flawless) furnace-drawn silica fiber (d = 110 μm) with a protective polymer coating and a strength in the range of 5.6 GPa (Kurkjian and Paek, 1983), where the scatter in strength data was related to fluctuations in fiber diameter which occurred in the range of 0.4% (<0.5 μm). For higher diameter fluctuation (∼2.6 μm), a modulus of m ∼ 25 was found (Kurkjian and Paek, 1983). As for the present case, although fluctuations in the local fiber diameter between individual indentation sites will affect the estimated values of σr, their presence may not fully explain the actual magnitude of m. Assuming that the absence of a polymer coating has a minor effect for small-volume testing such as applied in the present study, we instead relate the present magnitude of m to the remaining variance in wedge alignment and surface detection, leading to over- or underestimation of the projected contact area. For the Weibull scale (σr at a failure probability of ∼63%), we obtain 7.8, 8.0, and 8.2 GPa for fiber diameters of 440, 220, and 125 μm, respectively. As already noted, these absolute values are strongly dependent on the assumptions made for the contact area.
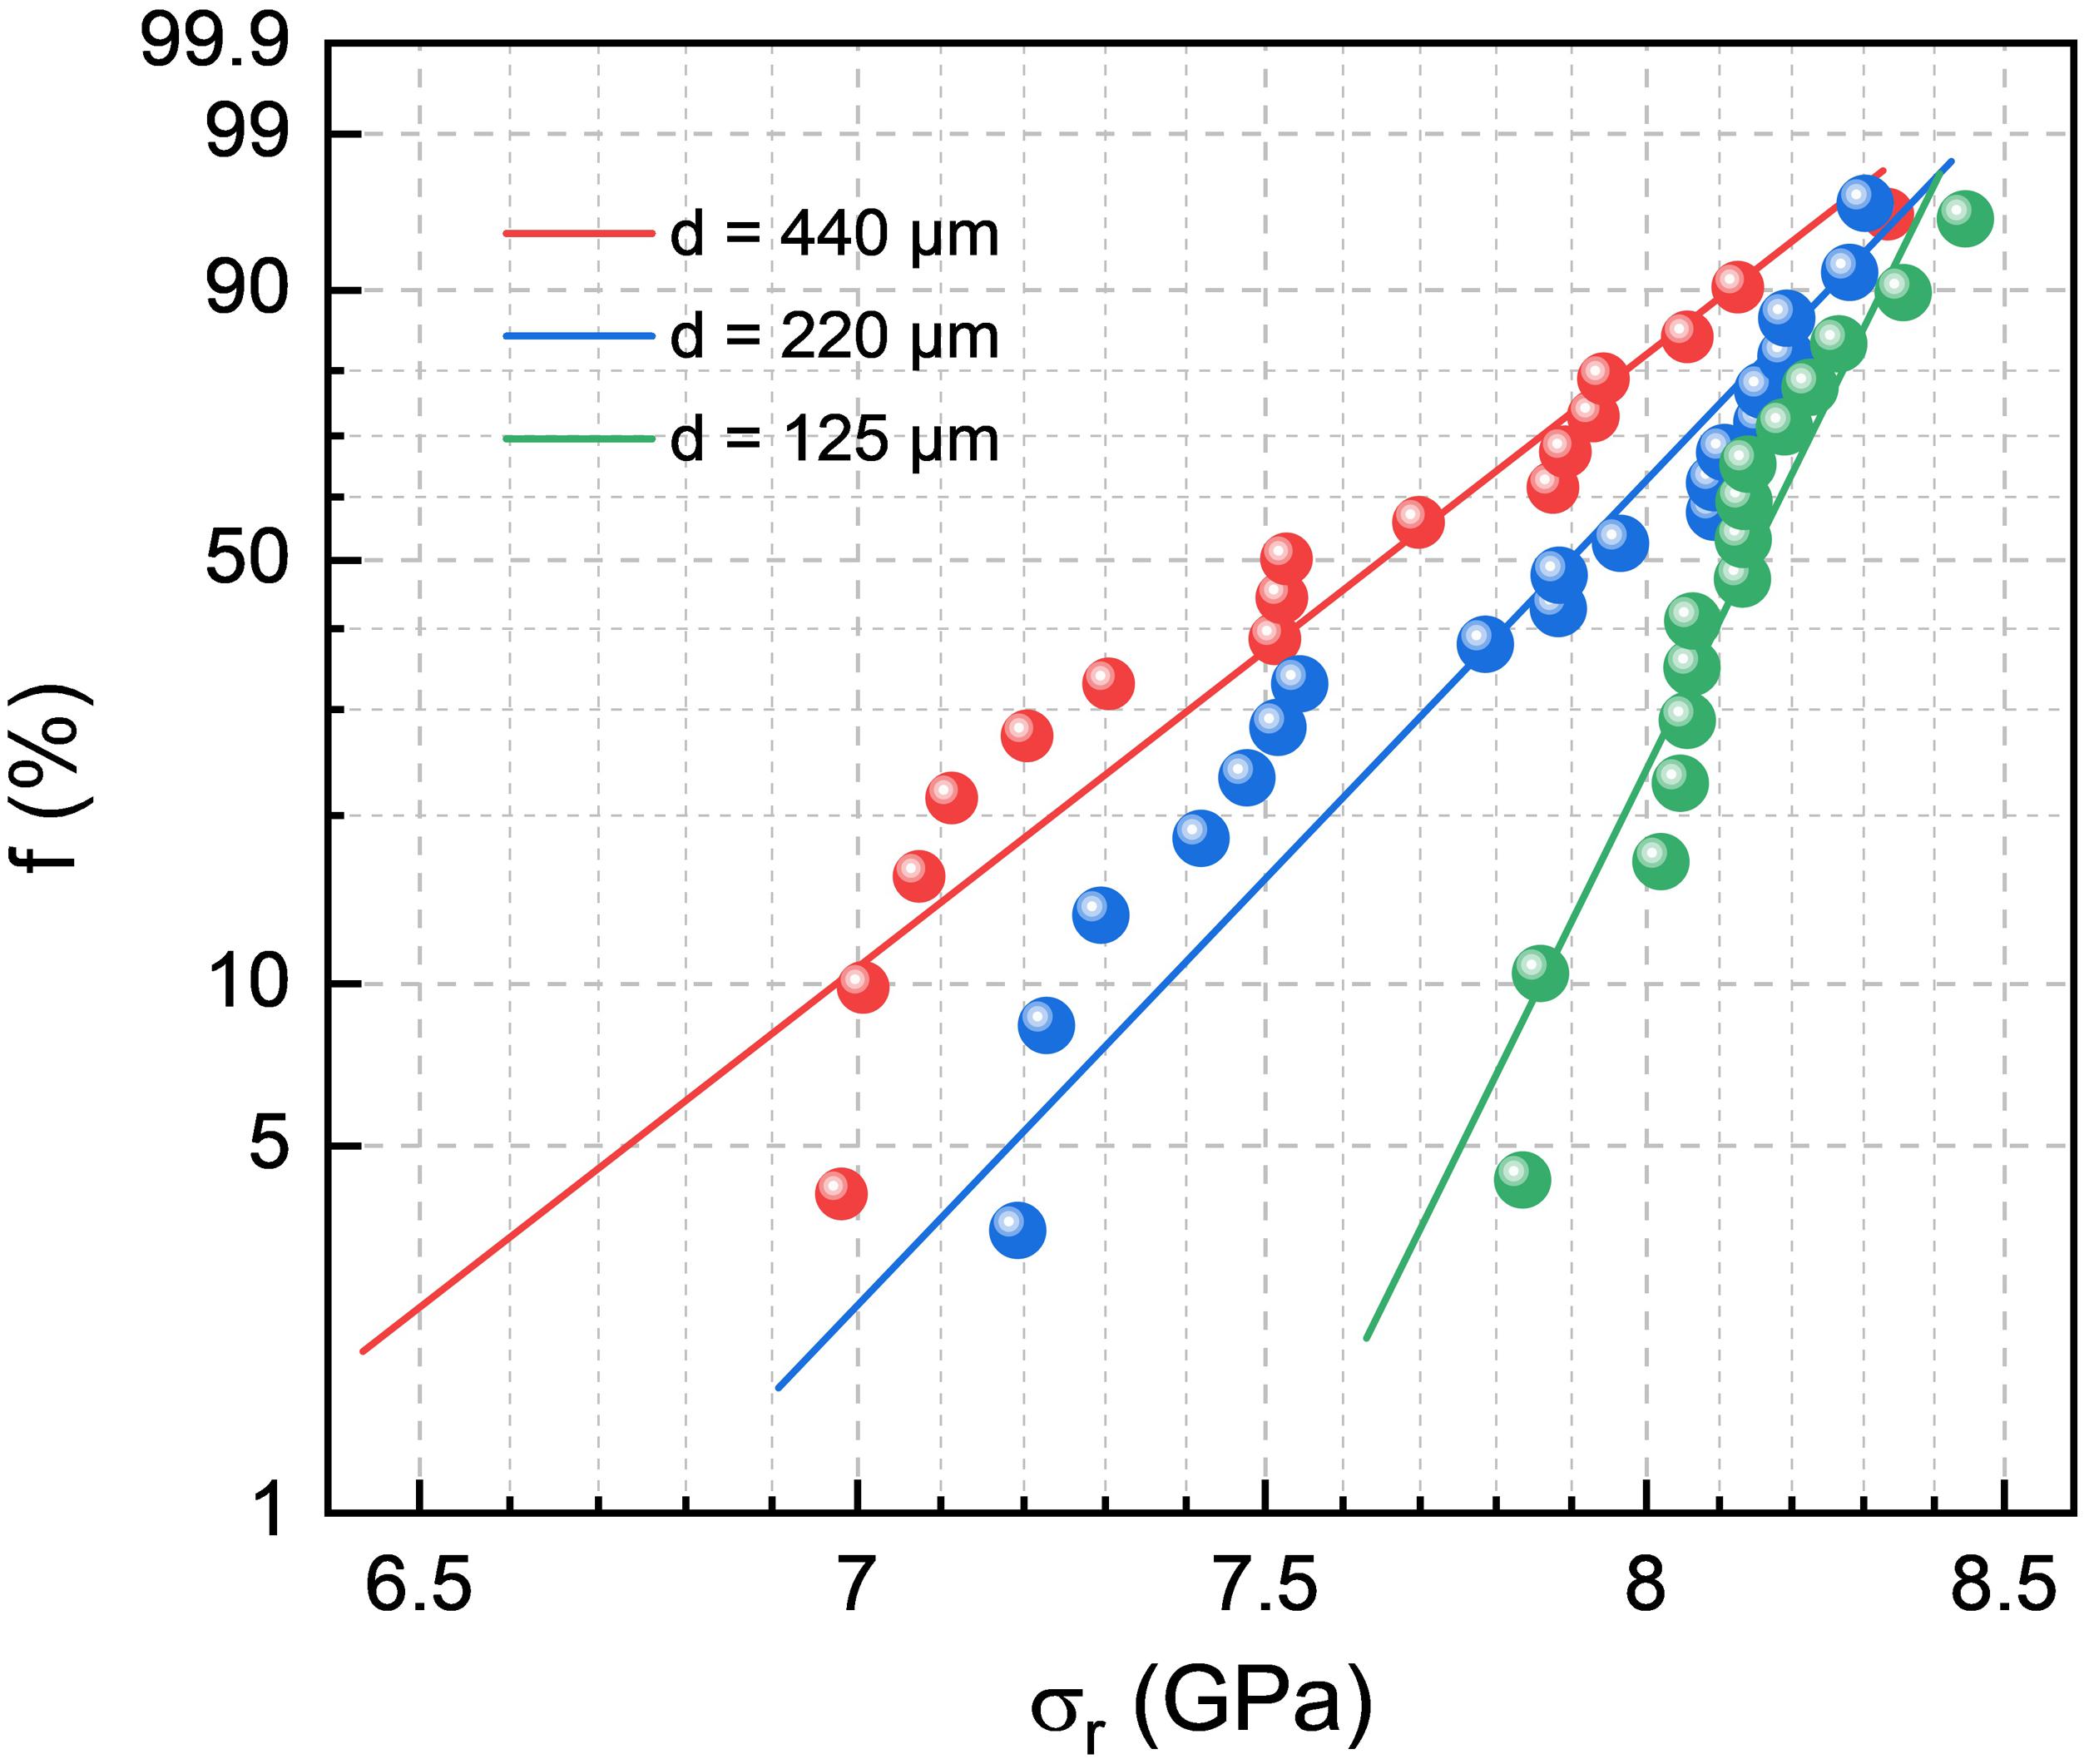
Figure 8. Statistical analysis of the first pop-in for silica glass fibers with varying diameter d. The representative mean indentation stress σr associated with the occurrence of the first pop-in was taken from Figure 7B and Supplementary Figures S1, S2. Weibull probability data f were determined using median rank approximation (Moayedi and Wondraczek, 2017). Nanoindentation testing was performed using a wedge-shaped tip with an opening angle of 60° and an effective length of 180 μm.
Conclusion
In summary, we used sharp wedge-shaped diamond tips with opening angles of 60–90° for testing the surface mechanical behavior of vitreous silica fiber with diameters of 125 to 440 μm. We chose a wedge length, which avoided corner surface contact, thus overcoming some of the limitations of sharp pyramidal indentation. Using a higher opening angle enabled the generation of highly reproducible crack-free imprints with a depth of up to 7 μm and a width of several tens of μm for loads reaching 8.98 N. The residual imprints can be used for accurate post mortem inspection of permanent deformation-induced material modification, e.g., by vibrational spectroscopic methods. With shaper wedge tips, chipping occurred for normal loads in the range of 102 mN. Fracture events were readily visible as sudden displacement bursts in situ during loading. Normalization to the projected contact area enabled a statistical evaluation of the representative stress which led to the first such pop-in. We obtained Weibull moduli depending on fiber diameter, increasing from ∼20 (d = 440 μm) to ∼50 (d = 125 μm), with representative stresses in the range of 8 GPa. The observed magnitude of m is only partially related to fluctuations in fiber diameter. Also the remaining variations in wedge alignment relative to the fiber axis and the accuracy of instrumented surface detection are important factors.
Data Availability Statement
The datasets generated for this study are available on request to the corresponding author.
Author Contributions
LW conceived of this study. RS prepared the samples and performed the optical characterization and Raman spectroscopic analysis. RL and RS designed and conducted the nanoindentation experiments. All authors jointly evaluated the data and wrote the manuscript.
Funding
Financial support by the German Science Foundation through the priority program PP 1594 (Grant No. WO1220/9-2) is gratefully acknowledged. Parts of the study received further support from the German Federal Ministry of Education and Research under the Entrepreneurial Regions research and innovation program.
Conflict of Interest
The authors declare that the research was conducted in the absence of any commercial or financial relationships that could be construed as a potential conflict of interest.
Acknowledgments
The authors gratefully acknowledge colleagues at the Leibniz IPHT, Jena, for providing the silica glass fibers used for this study. The authors would further like to thank Zhiwen Pan and Omar Benzine from the Otto Schott Institute of Materials Research, Friedrich Schiller University Jena, for their support in the Raman spectroscopic analysis.
Supplementary Material
The Supplementary Material for this article can be found online at: https://www.frontiersin.org/articles/10.3389/fmats.2020.00126/full#supplementary-material
FIGURE S1 | (A) Selected load-displacement P-h curves as recorded from nanoindentation experiments on a 440 μm silica glass fiber using a wedge-shaped tip with an opening angle of 60° and an effective length of 180 μm. (B) Corresponding depth profiles of the representative stress σr. Data in (B) are limited to the first pop-in event, as the incipient fracture violates the assumptions made for the calculation of the projected area by means of Equation (5).
FIGURE S2 | (A) Selected load-displacement P-h curves as recorded from nanoindentation experiments on a 125 μm silica glass fiber using a wedge-shaped tip with an opening angle of 60° and an effective length of 180 μm. (B) Corresponding depth profiles of the representative stress σr. Data in (B) are limited to the first pop-in event, as the incipient fracture violates the assumptions made for the calculation of the projected area by means of Equation (5).
FIGURE S3 | Optical micrograph of a residual imprint on a 440 μm silica glass fiber afterstorage for a period of six months in laboratory air under ambient conditions. The imprint was createdwith a maximum normal load of 8.98 N usinga wedge-shaped tip with an opening angle of 90° and an effective length of 215 μm.
FIGURE S4 | (A) Schematic visualization of thelateral contact area A, the enveloping cylinder surface section As and the projected contact area Ap during indentation of glass fibers with a wedge-shaped tip. (B) Calculated nominal areas A, As and Ap for indentation with a 60° wedge on a 125 μm fiber as a function of indenter displacement h perpendicular to the fiber axis.
References
Benzine, O., Bruns, S., Pan, Z. W., Durst, K., and Wondraczek, L. (2018). Local deformation of glasses is mediated by rigidity fluctuation on nanometer scale. Adv. Sci. 5:1800916. doi: 10.1002/advs.201800916
Brambilla, G., and Payne, D. N. (2009). The ultimate strength of glass silica nanowires. Nano Lett. 9, 831–835. doi: 10.1021/nl803581r
Brückner, R., Sammet, M., and Stockhorst, H. (1980). Evidence of structural anisotropies in silicate glass fibres by ESR. J. Non-Crystall. Solids 40, 273–289. doi: 10.1016/0022-3093(80)90106-4
Bruns, S., Johanns, K. E., Rehman, H. U., Pharr, G. M., and Durst, K. (2017). Constitutive modeling of indentation cracking in fused silica. J. Am. Ceram. Soc. 100, 1928–1940. doi: 10.1111/jace.14734
Bruns, S., Uesbeck, T., Fuhrmann, S., Aymerich, M. T., Wondraczek, L., de Ligny, D., et al. (2020). Indentation densification of fused silica assessed by raman spectroscopy and constitutive finite element analysis. J. Am. Ceram. Soc. 103, 3076–3088. doi: 10.1111/jace.17024
Cook, R. F. (2019). Fracture sequences during elastic-plastic indentation of brittle materials. J. Mater. Res. 34, 1633–1644. doi: 10.1557/jmr.2019.112
Cook, R. F. (2020). A critical evaluation of indentation crack lengths in air. J. Am. Ceram. Soc. 103, 2278–2295. doi: 10.1111/jace.16925
Cui, Y. X., Chen, Y. X., and He, J. J. (2019). Equivalent initial flaw size model for fracture strength prediction of optical fibers with indentation flaws. Eng. Fract. Mech. 215, 36–48. doi: 10.1016/j.engfracmech.2019.04.021
Dabbs, T. P., and Lawn, B. R. (1985). Strength and fatigue properties of optical-glass fibers containing microindentation flaws. J. Am. Ceram. Soc. 68, 563–569. doi: 10.1111/j.1151-2916.1985.tb16156.x
Deschamps, T., Kassir-Bodon, A., Sonneville, C., Margueritat, J., Martinet, C., de Ligny, D., et al. (2013). Permanent densification of compressed silica glass: a Raman-density calibration curve. J. Phys. Condens. Matter 25:025402. doi: 10.1088/0953-8984/25/2/025402
do Nascimento, E. M., and Lepienski, C. M. (2006). Mechanical properties of optical glass fibers damaged by nanoindentation and water ageing. J. Non-Cryst. Solids 352, 3556–3560. doi: 10.1016/j.jnoncrysol.2006.02.114
Donaghy, F. A., and Dabbs, T. P. (1988). Subthreshold flaws and their failure prediction in long-distance optical fiber cables. J. Lightw. Technol. 6, 226–232. doi: 10.1109/50.3993
Endo, J., Inaba, S., and Ito, S. (2015). Mechanical properties of anisotropic metaphosphate glass. J. Am. Ceram. Soc. 98, 2767–2771. doi: 10.1111/jace.13682
Frankberg, E. J., Kalikka, J., Ferré, F. G., Joly-Pottuz, L., Salminen, T., Hintikka, J., et al. (2019). Highly ductile amorphous oxide at room temperature and high strain rate. Science 366, 864–869. doi: 10.1126/science.aav1254
Fuhrmann, S., de Macedo, G. N. B. M., Limbach, R., Krywka, C., Bruns, S., Durst, K., et al. (2020). Indentation-induced structural changes in vitreous silica probed by in-situ small-angle X-ray scattering. Front. Mater. 7, (in press). doi: 10.3389/fmats.2020.00173
Gerbig, Y. B., and Michaels, C. A. (2020). In-situ raman spectroscopic measurements of the deformation region in indented glasses. J. Non-Cryst. Solids 530:119828. doi: 10.1016/j.jnoncrysol.2019.119828
Gross, T. M. (2012). Deformation and cracking behavior of glasses indented with diamond tips of various sharpness. J. Non-Cryst. Solids 358, 3445–3452. doi: 10.1016/j.jnoncrysol.2012.01.052
Gross, T. M., and Tomozawa, M. (2008). Crack-free high load Vickers indentation of silica glass. J. Non-Cryst. Solids 354, 5567–5569. doi: 10.1016/j.jnoncrysol.2008.09.015
Inaba, S., Benino, Y., Kohara, S., Hosono, H., and Ito, S. (2020). Anisotropic structure of alkali metaphosphate glasses. J. Am. Ceram. Soc. 103, 3631–3641. doi: 10.1111/jace.17065
Inaba, S., Hosono, H., and Ito, S. (2015). Entropic shrinkage of an oxide glass. Nat. Mater. 14, 312–317. doi: 10.1038/NMAT4151
Jakus, K., Ritter, J. E., Choi, S. R., Lardner, T., and Lawn, B. R. (1988). Failure of fused-silica fibers with subthreshold flaws. J. Non-Cryst. Solids 102, 82–87. doi: 10.1016/0022-3093(88)90115-9
Kashani, M. S., and Madhavan, V. (2011). Analysis and correction of the effect of sample tilt on results of nanoindentation. Acta Mater. 59, 883–895. doi: 10.1016/j.actamat.2010.09.051
Kassir-Bodon, A., Deschamps, T., Martinet, C., Champagnon, B., Teisseire, J., and Kermouche, G. (2012). Raman mapping of the indentation-induced densification of a soda-lime-silicate glass. Int. J. Appl. Glass Sci. 3, 29–35. doi: 10.1111/j.2041-1294.2012.00078.x
Kim, J. Y., Lee, J. J., Lee, Y. H., Jang, J. I., and Kwon, D. (2006). Surface roughness effect in instrumented indentation: a simple contact depth model and its verification. J. Mater. Res. 21, 2975–2978. doi: 10.1557/Jmr.2006.0370
Kurkjian, C. R., Gupta, P. K., and Brow, R. K. (2010). The strength of silicate glasses: what do we know, what do we need to know? Int. J. Appl. Glass Sci. 1, 27–37. doi: 10.1111/J.2041-1294.2010.00005.X
Kurkjian, C. R., Gupta, P. K., Brow, R. K., and Lower, N. (2003). The intrinsic strength and fatigue of oxide glasses. J. Non-Cryst. Solids 316, 114–124. doi: 10.1016/S0022-3093(02)01943-9
Kurkjian, C. R., and Paek, U. C. (1983). Single-valued strength of perfect silica fibers. Appl. Phys. Lett. 42, 251–253. doi: 10.1063/1.93905
Lee, K., Marimuthu, K. P., Kim, C. L., and Lee, H. (2018). Scratch-tip-size effect and change of friction coefficient in nano/micro scratch tests using XFEM. Tribol. Int. 120, 398–410. doi: 10.1016/j.triboint.2018.01.003
Li, C. S., Zhang, L. C., Sun, L., Yang, S. M., Wu, C. H., Long, X. Y., et al. (2019). A quantitative analysis of the indentation fracture of fused silica. J. Am. Ceram. Soc. 102, 7264–7277. doi: 10.1111/jace.16645
Limbach, R., Winterstein-Beckmann, A., Dellith, J., Möncke, D., and Wondraczek, L. (2015). Plasticity, crack initiation and defect resistance in alkali-borosilicate glasses: from normal to anomalous behavior. J. Non-Cryst. Solids 41, 15–27. doi: 10.1016/j.jnoncrysol.2015.02.019
Lin, B., and Matthewson, M. J. (1996). Inert strength of subthreshold and post-threshold Vickers indentations on fused silica optical fibres. Philos. Mag. A 74, 1235–1244. doi: 10.1080/01418619608239723
Lonnroth, N., Muhlstein, C. L., Pantano, C., and Yue, Y. Z. (2008). Nanoindentation of glass wool fibers. J. Non-Cryst. Solids 354, 3887–3895. doi: 10.1016/j.jnoncrysol.2008.04.014
Malchow, P., Johanns, K. E., Möncke, D., Korte-Kerzel, S., Wondraczek, L., and Durst, K. (2015). Composition and cooling-rate dependence of plastic deformation, densification, and cracking in sodium borosilicate glasses during pyramidal indentation. J. Non-Cryst. Solids 419, 97–109. doi: 10.1016/j.jnoncrysol.2015.03.020
McAllister, Q. P., Gillespie, J. W., and VanLandingham, M. R. (2012). Nonlinear indentation of fibers. J. Mater. Res. 27, 197–213. doi: 10.1557/jmr.2011.336
Moayedi, E., and Wondraczek, L. (2017). Quantitative analysis of scratch-induced microabrasion on silica glass. J. Non-Cryst. Solids 470, 138–144. doi: 10.1016/j.jnoncrysol.2017.05.003
Mound, B. A., and Pharr, G. M. (2019). Nanoindentation of fused quartz at loads near the cracking threshold. Exp. Mech. 59, 369–380. doi: 10.1007/s11340-018-00446-3
Oliver, W. C., and Pharr, G. M. (1992). An improved technique for determining hardness and elastic modulus using load and displacement sensing indentation experiments. J. Mater. Res. 7, 1564–1583. doi: 10.1557/Jmr.1992.1564
Oliver, W. C., and Pharr, G. M. (2004). Measurement of hardness and elastic modulus by instrumented indentation: advances in understanding and refinements to methodology. J. Mater. Res. 19, 3–20. doi: 10.1557/Jmr.2004.19.1.3
Perriot, A., Vandembroucq, D., Barthel, E., Martinez, V., Grosvalet, L., Martinet, C., et al. (2006). Raman microspectroscopic characterization of amorphous silica plastic behavior. J. Am. Ceram. Soc. 89, 596–601. doi: 10.1111/j.1551-2916.2005.00747.x
Phani, P. S., and Oliver, W. C. (2019). A critical assessment of the effect of indentation spacing on the measurement of hardness and modulus using instrumented indentation testing. Mater. Des. 164, 107563. doi: 10.1016/j.matdes.2018.107563
Pharr, G. M., Oliver, W. C., and Brotzen, F. R. (1992). On the generality of the relationship among contact stiffness, contact area, and elastic modulus during indentation. J. Mater. Res. 7, 613–617. doi: 10.1557/Jmr.1992.0613
Rouxel, T. (2015). Driving force for indentation cracking in glass: composition, pressure and temperature dependence. Philos. Trans. R. Soc. A 373:20140140. doi: 10.1098/rsta.2014.0140
Rouxel, T., and Yoshida, S. (2017). The fracture toughness of inorganic glasses. J. Am. Ceram. Soc. 100, 4374–4396. doi: 10.1111/jace.15108
Sawamura, S., Limbach, R., Behrens, H., and Wondraczek, L. (2018). Lateral deformation and defect resistance of compacted silica glass: quantification of the scratching hardness of brittle glasses. J. Non-Cryst. Solids 481, 503–511. doi: 10.1016/j.jnoncrysol.2017.11.035
Sawamura, S., Limbach, R., Wilhelmy, S., Koike, A., and Wondraczek, L. (2019). Scratch-induced yielding and ductile fracture in silicate glasses probed by nanoindentation. J. Am. Ceram. Soc. 102, 7299–7311. doi: 10.1111/jace.16679
Sawamura, S., and Wondraczek, L. (2018). Scratch hardness of glass. Phys. Rev. Mater. 2:092601. doi: 10.1103/PhysRevMaterials.2.092601
Stockhorst, H., and Brückner, R. (1986). Structure sensitive measurements on phosphate glass fibers. J. Non-Cryst. Solids 85, 105–126. doi: 10.1016/0022-3093(86)90083-9
Varshneya, A. K. (2018). Stronger glass products: lessons learned and yet to be learned. Int. J. Appl. Glass Sci. 9, 140–155. doi: 10.1111/ijag.12341
Wang, L., and Liu, X. P. (2019). Correlation analysis of surface tilt effect on its mechanical properties by nano-indentation. Int. J. Precis. Eng. Manuf. 20, 327–335. doi: 10.1007/s12541-019-00061-9
Winterstein-Beckmann, A., Möncke, D., Palles, D., Kamitsos, E. I., and Wondraczek, L. (2014a). Raman spectroscopic study of structural changes induced by micro-indentation in low alkali borosilicate glasses. J. Non-Cryst. Solids 401, 110–114. doi: 10.1016/j.jnoncrysol.2013.12.038
Winterstein-Beckmann, A., Möncke, D., Palles, D., Kamitsos, E. I., and Wondraczek, L. (2014b). A raman-spectroscopic study of indentation-induced structural changes in technical alkali-borosilicate glasses with varying silicate network connectivity. J. Non-Cryst. Solids 405, 196–206. doi: 10.1016/j.jnoncrysol.2014.09.020
Wondraczek, L. (2019). Overcoming glass brittleness. Science 366, 804–805. doi: 10.1126/science.aaz2127
Wondraczek, L., Mauro, J. C., Eckert, J., Kühn, U., Horbach, J., Deubener, J., et al. (2011). Towards ultrastrong glasses. Adv. Mater. 23, 4578–4586. doi: 10.1002/Adma.201102795
Xu, Z. H., and Li, X. (2007). Effect of sample tilt on nanoindentation behaviour of materials. Philos. Mag. 87, 2299–2312. doi: 10.1080/14786430601175516
Yang, X., Scannell, G., Jain, C., Rodrigues, B. P., Schmidt, M. A., and Wondraczek, L. (2017). Permanent structural anisotropy in a hybrid fiber optical waveguide. Appl. Phys. Lett. 111:201901. doi: 10.1063/1.4999048
Yoshida, S. (2019). Indentation deformation and cracking in oxide glass –toward understanding of crack nucleation. J. Non-Cryst. Solids X 1:100009. doi: 10.1016/j.nocx.2019.100009
Keywords: silica glass, glass fiber, mechanical properties, nanoindentation, wedge-indentation, plasticity, fracture, hardness
Citation: Sajzew R, Limbach R and Wondraczek L (2020) Deformation and Fracture of Silica Glass Fiber Under Sharp Wedge-Indentation. Front. Mater. 7:126. doi: 10.3389/fmats.2020.00126
Received: 10 March 2020; Accepted: 17 April 2020;
Published: 29 May 2020.
Edited by:
Praveen Sekhar, Washington State University, United StatesCopyright © 2020 Sajzew, Limbach and Wondraczek. This is an open-access article distributed under the terms of the Creative Commons Attribution License (CC BY). The use, distribution or reproduction in other forums is permitted, provided the original author(s) and the copyright owner(s) are credited and that the original publication in this journal is cited, in accordance with accepted academic practice. No use, distribution or reproduction is permitted which does not comply with these terms.
*Correspondence: Lothar Wondraczek, bG90aGFyLndvbmRyYWN6ZWtAdW5pLWplbmEuZGU=