 Fengcang Ma
 Gaojie Zhang
 Ping Liu*
95% of researchers rate our articles as excellent or good
Learn more about the work of our research integrity team to safeguard the quality of each article we publish.
Find out more
ORIGINAL RESEARCH article
Front. Mater. , 03 April 2020
Sec. Biomaterials
Volume 7 - 2020 | https://doi.org/10.3389/fmats.2020.00077
This article is part of the Research Topic Structure and Mechanical Properties of Titanium Alloys and Titanium Matrix Composites (TMCs) View all 8 articles
Microstructure and properties of a metastable β-type Ti-35Nb-2Ta-3Zr alloy after cold rolling plus annealing at various temperatures were investigated systematically. The X-ray diffraction results show that the sample annealed at 923 K is mainly composed of the β phase (92.3%). However, the samples annealed at 723, 823, and 1023 K contain a large amount of α″ phase of 39.6, 36.5, and 39.4%, respectively. The elastic modulus of the sample annealed at 923 K is about 50.1 GPa. However, these of the samples annealed at 723, 823, and 1023 K are 73.7, 56.1, and 70.2 GPa. Furthermore, the sample annealed at 923 K presents the best elasticity and the highest recovery strain (∼66.87%). The corrosion rate of the sample annealed at 923 K (∼2.403 μm⋅a–1) is the lowest among all the samples, which may be attributed to its minimum content of α″ phase.
In recent years, due to the low elastic modulus, superelasticity, non-toxicity and corrosion resistance, the metastable β Ti-Nb based alloys have received much attention in the field of biomedical materials (Cai et al., 2013; Zhang et al., 2013; Yang et al., 2014). Ti-6A1-4V and Ti-Ni based alloys have been extensively used in the field of biomedical implants (Miyazaki et al., 2006). Nevertheless, Young’s modulus of human bone (10∼30 GPa) is obviously lower than those of Ti-6Al-4V alloy (about 108 GPa), stainless steels (210 GPa) and CoCrMo alloy (240 GPa) (Ehtemam-Haghighi et al., 2016a). If the implanted material has a much higher elastic modulus than the bones of humanity, it will produce a stress shielding effect (Niinomi, 2008). And that can easily lead to bone resorption around the implant, loosening, rupturing of the implant, eventually resulting in failure of implantation (Miyazaki et al., 2006; Ho et al., 2009; Chaves et al., 2015; Nazari et al., 2015). Toxic elements (Ni, V, and Al) will lead to rickets or Alzheimer’s disease, etc., so these harmful elements should be avoided in biomedical materials (Liqiang et al., 2009; Kafkas and Ebel, 2014). Besides low elastic modulus, the implant material is expected to have excellent elasticity, so the implant can better prop up others (Wang et al., 2016). Finally, the implant material is expected to exhibit better corrosion resistance. So, the low modulus metastable β Ti-Nb based alloys have been focused since the 2000s (Liang et al., 2016; Wang et al., 2017).
In general, crystal structures of titanium alloys are divided into α-type (α + β)-type and β-type. Due to its body-centered cubic crystal structure (bcc), the elastic modulus of the β-titanium alloy is lower than that of α-type alloy with hexagonal close-packed structure and (α + β) alloy. An attempt has been made to obtain the metastable β titanium alloy, which is expected to reduce the stress shielding and thus promote bone reconstruction (Hao et al., 2012; Milošev et al., 2013). It is well known that Al, N, O, and Sn are α-stabilizer elements, while Nb, Mo, Ta, and Zr are β-stabilizers. In recent years, the main research of the new β-titanium alloys are Ti-35.3Nb-5.1Ta-7.1Zr (Niinomi et al., 2012), Ti-15Mo (Min et al., 2010), Ti-20Zr-10Nb (Cui et al., 2010), Ti-25Ta-25Nb alloy and so on (Bertrand et al., 2010; Fu et al., 2017).
It is well known that cold-rolling work, such as 40–90%, inhibits the martensitic transformation by the introduction of defects, which are essentially dislocations. Following cold work, the annealing treatment, as defined by temperature and time induces different features of the martensitic transformation related to the recovery and recrystallization processes (Khelfaoui and Guénin, 2003). After cold rolling with a large amount of deformation, the grain anisotropy of the alloy decreases, and the grain orientation tends to be uniform, which is favorable for plastic deformation. After cold rolling, the grains exhibit fibrous structure and contain a large number of dislocations and defects, and then annealing at a suitable temperature can cause the grains to recover and recrystallize. The microstructure changes from fibrous structure to fine equiaxed grains and the strength and plasticity are improved. Zr is considered as an ideal alloy element to improve the elastic recovery strain because it maintains the martensite transformation temperature (Ms) while increasing the phase transformation strain (Miyazaki et al., 2006).
In this work, a metastable β Ti-35Nb-2Ta-3Zr alloy was designed by employing a molecular orbital method. Two parameters define it. One is the bond order (hereafter referred to as Bo) which is a measure of the covalent bond strength. The other is the metal d-orbital energy level (Md). The and values of the selected elements in the project are 2.867 and 2.452, respectively. Phase stability index diagram based on and parameters were drawn by Kuroda (Kuroda et al., 1998). The two parameters of Ti-35Nb-2Ta-3Zr alloy are located in the metastable β-phase region of the phase stability index diagram. The effects of annealing on its microstructure, mechanical and chemical properties were systematically studied, and an optimum annealing treatment was suggested based on the above performances of this alloy.
Using Ti (purity 99.99%), Nb (99.95%), Ta (99.95%), and Zr (99.95%) as raw materials, the vacuum arc furnace was used to smelt Ti-35Nb-2Ta-3Zr alloy (mass fraction). They were melted four times in a high purity argon atmosphere and then placed in the air-insulated tube furnace at a temperature of 1253 K for 2 h in order to ensure compositional uniformity of the alloy. The ingots were rolled into sheets with a thickness of 1 mm using a cold rolling machine and the amount of cold deformation was 90%. Finally, the specimens were annealed in the tube furnace in a high purity argon atmosphere. Four temperatures annealing were performed at 723, 823, 923, and 1023 K holding for 10 min, respectively, and then followed by air cooling to 298 K.
The specimens of 1 cm × 1 cm were polished with SiC waterproof emery papers with a grit number of up to 2000 for XRD measurement. The specimens were identified by irradiation with Cu Kα at the 40 kV tube voltage and the 200 mA tube current using X-ray diffraction (XRD Bruker D8-ADVANCE) at a diffraction angle (2θ) range of 30–80°. Before the observation, the alloy was polished and etched. It was etched with a solution of fluorinated acid (HF) and deionized water (H2O) = 1/10 (volume) for 10 s. Then, the microstructure of the alloy was observed by a polarizing microscope (PM). Martensitic morphology of the alloy was observed by transmission electron microscopy (TEM) (model: JEOL JEM-2000EXII). The loading and unloading indentation curves of the alloy were measured by the universal hardness tester (Zwick/Roell 2.5 kN) with a rectangular pyramid indenter to obtain the elastic recovery of the alloy. Tensile strength was measured by the tensile tests (UTM4304), where the tensile samples were deformed at a rate of about 5 × 10⁻³ s–1. And four samples (the dimensions in Figure 1) were tested for each annealing temperature. The microstructures of the fracture were investigated by a SEM (JSM-6510LA). The elastic modulus of the alloy was measured by the nano-indentation test with the diamond Berkovich indenter (NANO Indenter G200). During the whole indentation process, the indenter was controlled by the displacement, and the maximum depth of indentation was 7000 nm.
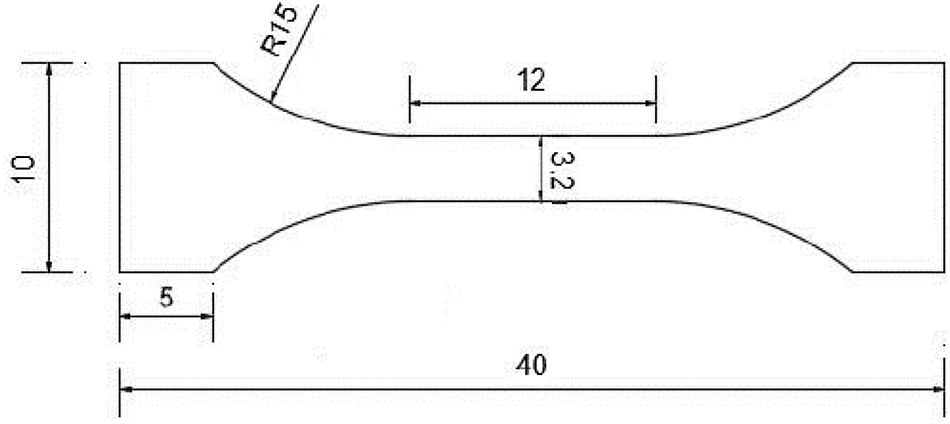
Figure 1. The dimensions are used for tensile testing (mm).
Prepare three specimens with a square surface area of 1 cm2 for each condition. The polarization curves of the samples were measured by an electrochemical workstation (CHI600E) at a scan rate of 10 mV/s to obtain the open circuit potential, corrosion potential (Ecorr) and corrosion current density (Icorr). The polarization curve of the alloy was measured in simulated body fluid (SBF). The SBF containing 0.1375 mol of NaCl, 0.0042 mol of NaHCO3, 0.0030 mol of KCl, 0.0010 mol of K2HPO4⋅3H2O, 0.0015 mol of MgCl⋅6H2O, 39 ml of 1 mol/L HCl, 0.0026 mol of CaCl2, 0.0005 mol of Na2SO4, 0.0505 mol of Tris per liter of deionized water was prepared, then add about 5 ml of 1 mol/L HCl step by step at 36.5 ± 1°C until the values of pH reached 7.40 ± 0.02.
Figure 2A shows the XRD patterns of Ti-35Nb-2Ta-3Zr samples after annealing at different temperatures. It can be observed that the microstructure of this alloy has only β phase and α″ phase at different annealing temperatures, but the contents of the two phases are significantly different. Based on the integration area, the volume fraction (Vf) of the β phase and α″ phase can be calculated with the following formulas (Yang et al., 2009):

Figure 2. (A) XRD patterns of Ti-35Nb-2Ta-3Zr annealed specimens: 723, 823, 923, and 1023 K; (B) volume fraction (Vf) of α″ and β phase after annealing at different temperatures.
Where Vf(β) and Vf(α ?) represent the volume fractions, and Aβ and Aα '' are the integration areas corresponding to β and α″ phase, respectively. The Gaussian function is used to measure their integrated areas. According to the XRD patterns, the volume fractions of β and α″ phase in the alloy are shown in Figure 2B.
αThe alloy contains the least β phase (Vf = 60.4%) and the most α″ phase (Vf = 39.6%) at 723 K. The reason for this phenomenon may be that a large amount of α″ phase is formed during cold rolling due to stress-induced martensitic transformation (β to α″) (Guo et al., 2011). As the annealing temperature increases, the content of α″ phase decreases but the content of β phase increases, which can be observed from the changes in the intensity of the peak of the corresponding phase in the XRD profile of the alloy. The content of α″ martensite decreases sharply, which means that the reverse martensitic transformation occurs during the annealing process (Cai et al., 2012). When the annealing temperature rises to 923 K, the alloy contains the most β phase (Vf = 92.3%) and the least α″ phase (Vf = 7.7%). This means the reverse martensitic transformation during the annealing process is almost completed. The content (Vf = 39.4%) of α″ phase increases, while the β phase content (Vf = 60.6%) decreases after increasing the temperature to 1023 K. The β phase in metastable alloys is metastable in thermodynamics. High annealing temperature and air cooling caused slow cooling rates. This may result in a partial metastable β phase transformation to a stable martensitic phase, thereby reducing the amount of β phase in the sample with an annealing temperature of 1023 K. It can also be seen from the intensity of the three diffraction peaks of β phase that when the temperature rises from 723 K to 923 K, the intensities of the three diffraction peaks of β phase become stronger, which means that the content of β phase is increasing and then temperature increases to 1023 K, the intensities of the diffraction peaks of the two main peaks of β (110) and β (200) decrease gradually indicating that the content of β phase is reduced. It can be forecasted that the appropriate annealing temperature should be used to obtain much β phase.
Figure 3 shows the microstructures of the samples at the different annealing temperatures were observed by a polarizing microscope. When the annealing temperature is 723 K, there is a large amount of α″ martensite in the microstructure (Figure 3a), which is consistent with the result in volume fraction (Vf) of α″ and β phase in Figure 2B. As shown in Figure 3b, the recrystallization of the alloy below 823 K has occurred already, but there is still α″ martensite here. At 923 K the alloy has undergone recrystallization completely (Figure 3c). As the temperature continues to rise, the grains of the alloy grows up as shown in Figure 3d. Due to annealing, the microstructure of the alloy is almost similar. As the annealing temperature increases, recovery and recrystallization occur in the alloy, so that the grain morphology changes from fibrous to equiaxed crystal.
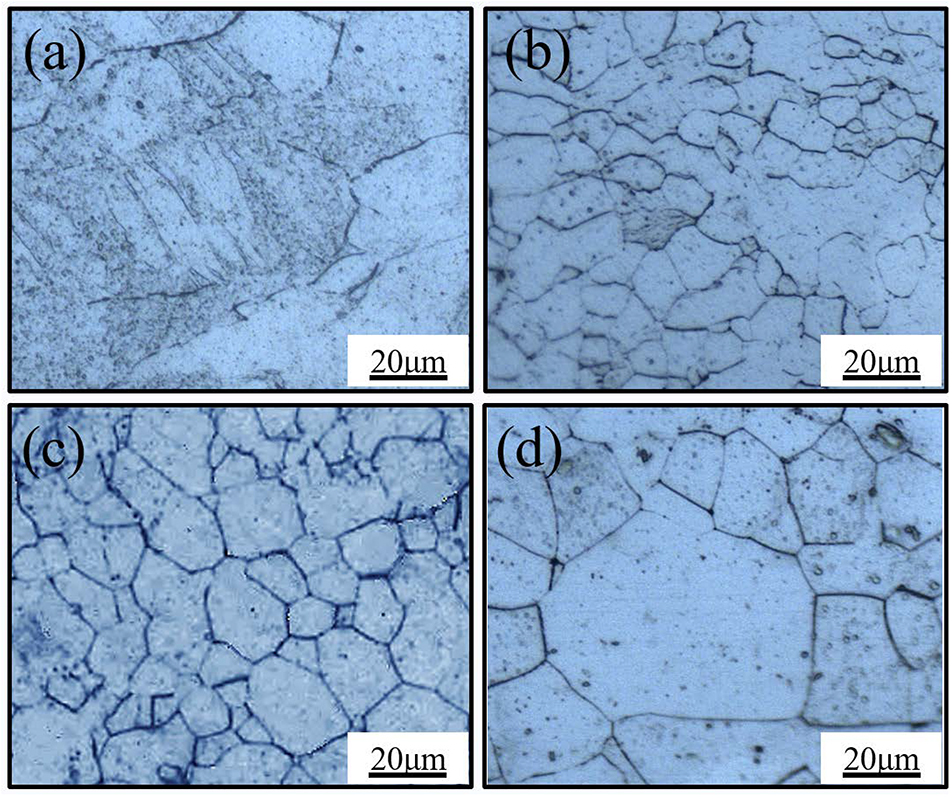
Figure 3. Microstructures of Ti-35Nb-2Ta-3Zr annealed specimens: 723 K (a), 823 K (b), 923 K (c), and 1023 K (d).
Furthermore, the α″ martensitic phase is observed in the first two the annealed samples, but the amount of α″ martensitic phase is almost invisible at 923 K (Figure 3c). It should be noted that the results of the microstructure are consistent with the XRD in Figure 2A. In addition, Figures 3c,d show that the recrystallized grains of the specimens are polygonal, but the grain size is different. Compared to the annealed sample at 1023 K, the annealed sample has a smaller and more uniform grain size at 923 K. The stress-induced martensitic transformation after cold rolling and the reversed martensitic transformation during the annealing process lead to significant grain refinement, which can reduce the Ms (Cai et al., 2012).
Figure 4a shows that a large number of dislocations and acicular α″ martensite are gathered in the transmission diagram of the 723 K annealed sample during the cold rolling. Wang et al. (2008) held the same points that when the alloy was rolled by 20% in thickness, stress-induced α” martensite was visible. The existence of α” martensite can be observed both in XRD measurement and in TEM images. The occurrence of dislocations is mainly due to the severe plastic deformation of the samples. Larger deformations lead to lattice distortion, leading to a great number of dislocations and martensitic transformation (Chen et al., 2017). But lath martensite and fine grains are not found in the sample at 723 K. Seen Figure 4b, equiaxed fine-grain caused by the annealing process was apparent, as the PM micrograph shows in Figure 3b. Figure 4c shows the lath martensite in the transmission image of the annealed samples at 923 K and fine equiaxed grains recrystallize on the lath martensite. This is consistent with the results of the XRD and polarizing microscope. Also, acicular α″ martensite was visible in the annealed at 1023 K sample, which appeared along with different directions (Figure 4d).
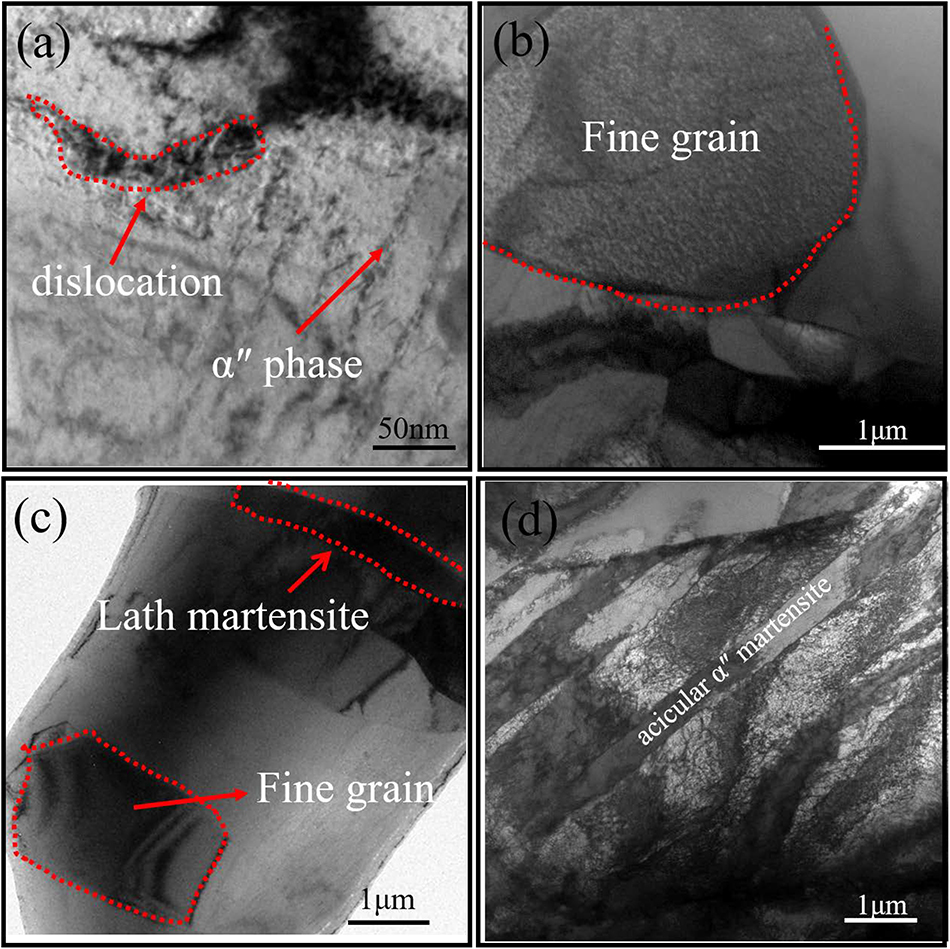
Figure 4. Transmission electron microscopy images of Ti-35Nb-2Ta-3Zr annealed specimens: 723 K (a); 823 K (b); 923 K (c), and 1023 K (d).
Figure 5 shows the tensile stress-strain curve of Ti-35Nb-2Ta-3Zr alloy annealed at different temperatures at room temperature (298 K). The tensile strength of the alloy annealed at 723 K is very high (864 ± 10 MPa), but the plastic deformation after yielding is very low. Even there is almost no plasticity stage for the alloy annealed at 723K. The main reason for the high strength and low plasticity of the alloy is that the defects caused by cold rolling, such as dislocations, are still present in the samples due to the low annealing temperature (Figure 4a). The reason for the high strength and low plasticity of the alloy is the presence of a high concentration of α″ phase in the microstructure of the alloy, as can be seen in Figure 2. Because α″ phase of the orthorhombic structure contains fewer slip systems than the β phase of the bcc crystal, the plastic deformation of the alloy with α″ phase matrix requires higher stress than the alloy with β phase (Ren et al., 2013). And the two-stage yielding does not appear in the annealed samples at 723 K and 1023 K. However, the two-stage yielding phenomenon occurred in the annealed samples at 823 and 923 K. A similar is phenomenon also observed in the β-type Ti-19Zr-10Nb-1Fe (at%) and Ti-36Nb-5Zr alloys, which is the signature of superelasticity in β-type Ti alloys (Xiong et al., 2017; Meng et al., 2014). The first yielding indicated the process of stress-induced martensite transformation and the second yielding for the permanent plastic deformation (Kim et al., 2006). With the increasing of annealing temperature, the tensile strength of 923 and 1023 K annealed samples decreased sharply, and the elongation increased significantly. This is mainly because the content of dislocations decreases drastically with the increase of temperature. Although the alloy has a lower strength (456 ± 9 Mpa) when annealed at 923 K, its elongation is high (25.5 ± 1.6%).
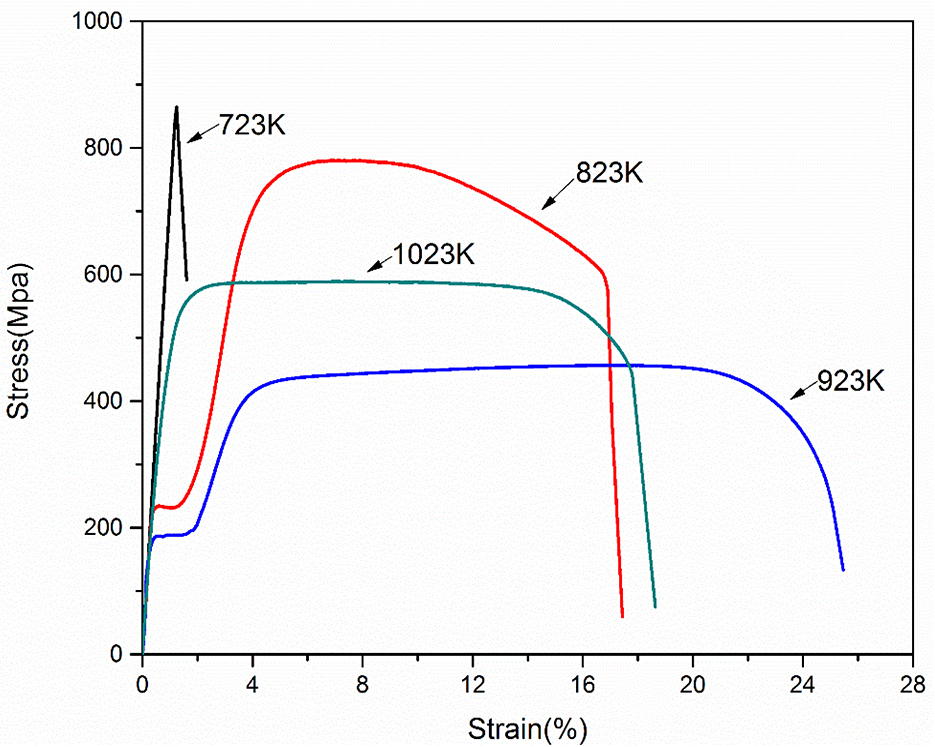
Figure 5. Tensile stress-strain curves of Ti-35Nb-2Ta-3Zr annealed specimens at temperatures from 723 K to 1023 K.
Figure 6 shows the surface morphology of the tensile fracture of the alloys at different annealing temperatures by SEM. The fracture appearances of the four types of samples are generally shown as dimples, indicating ductile fracture except for the sample with an annealing temperature of 923 K (Mo et al., 2015; Mo et al., 2013). The dimple size, distribution, and depth of each sample are different. Figure 6a shows the dimple size of the annealed samples at 723 K is particularly large and inhomogeneous. Figure 6b shows that the dimples have a certain direction and orientation along the shear direction (Freels et al., 2011). The dimple size of the annealed samples at 923 K is the smallest and the most uniform compared to the other three samples, shown in Figure 6c. This leads to better ductility of the alloy (Ehtemam-Haghighi et al., 2016b), which is consistent with the higher ductility of the alloy when the β phase concentration is higher in the 923 K annealed sample. When the alloy contains a large amount of β phases, the alloy has good ductility. While the alloy contains a large amount of α″ phases, it exhibits high strength but poor plasticity. The sample annealed at 923 K contains the most β phases, so the plasticity is best due to the small and homogenized dimple.
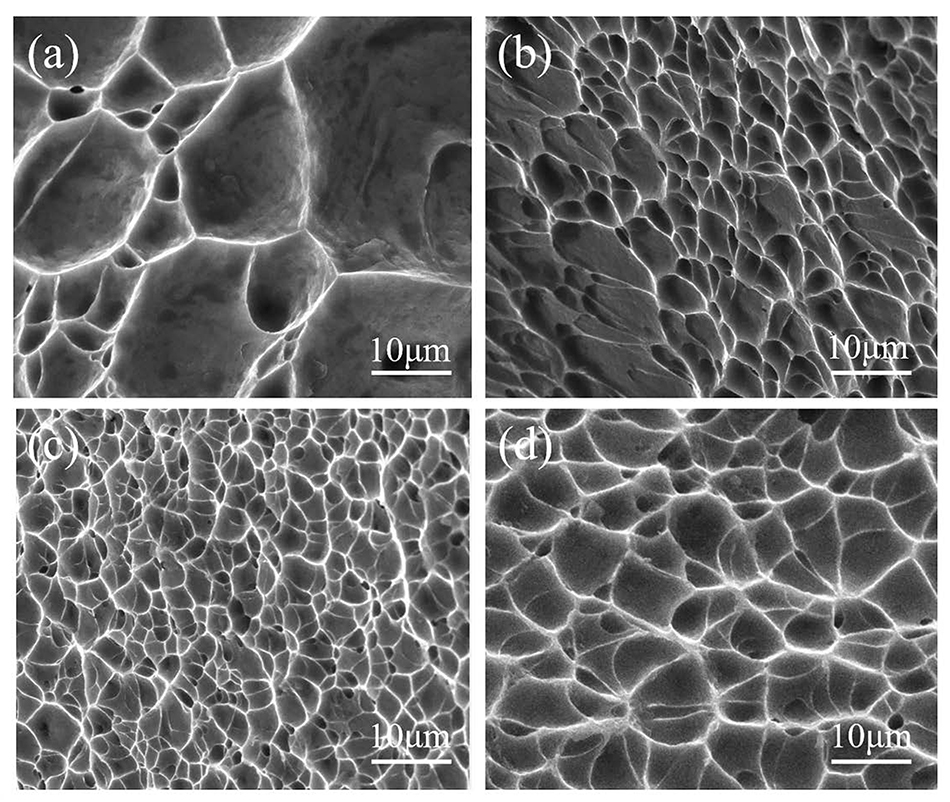
Figure 6. Fractographs of different tensile fracture surfaces: 723 K (a), 823 K (b), 923 K (c), and 1023 K (d).
Figure 7A shows the loading and unloading curves of four annealing samples under continuous loads of 2–10 N, respectively. Four consecutive loading and unloading curves are represented by load-displacement curves, and each sample is subjected to load-displacement experiments four times to calculate the average value. The sample showed typical superelasticity during the loading and unloading cycle, in which stress-induced martensite transformation (β-α”) appeared during loading, and stress-induced martensite reverse transformation (α”-β) appeared during unloading (Xiong et al., 2017).
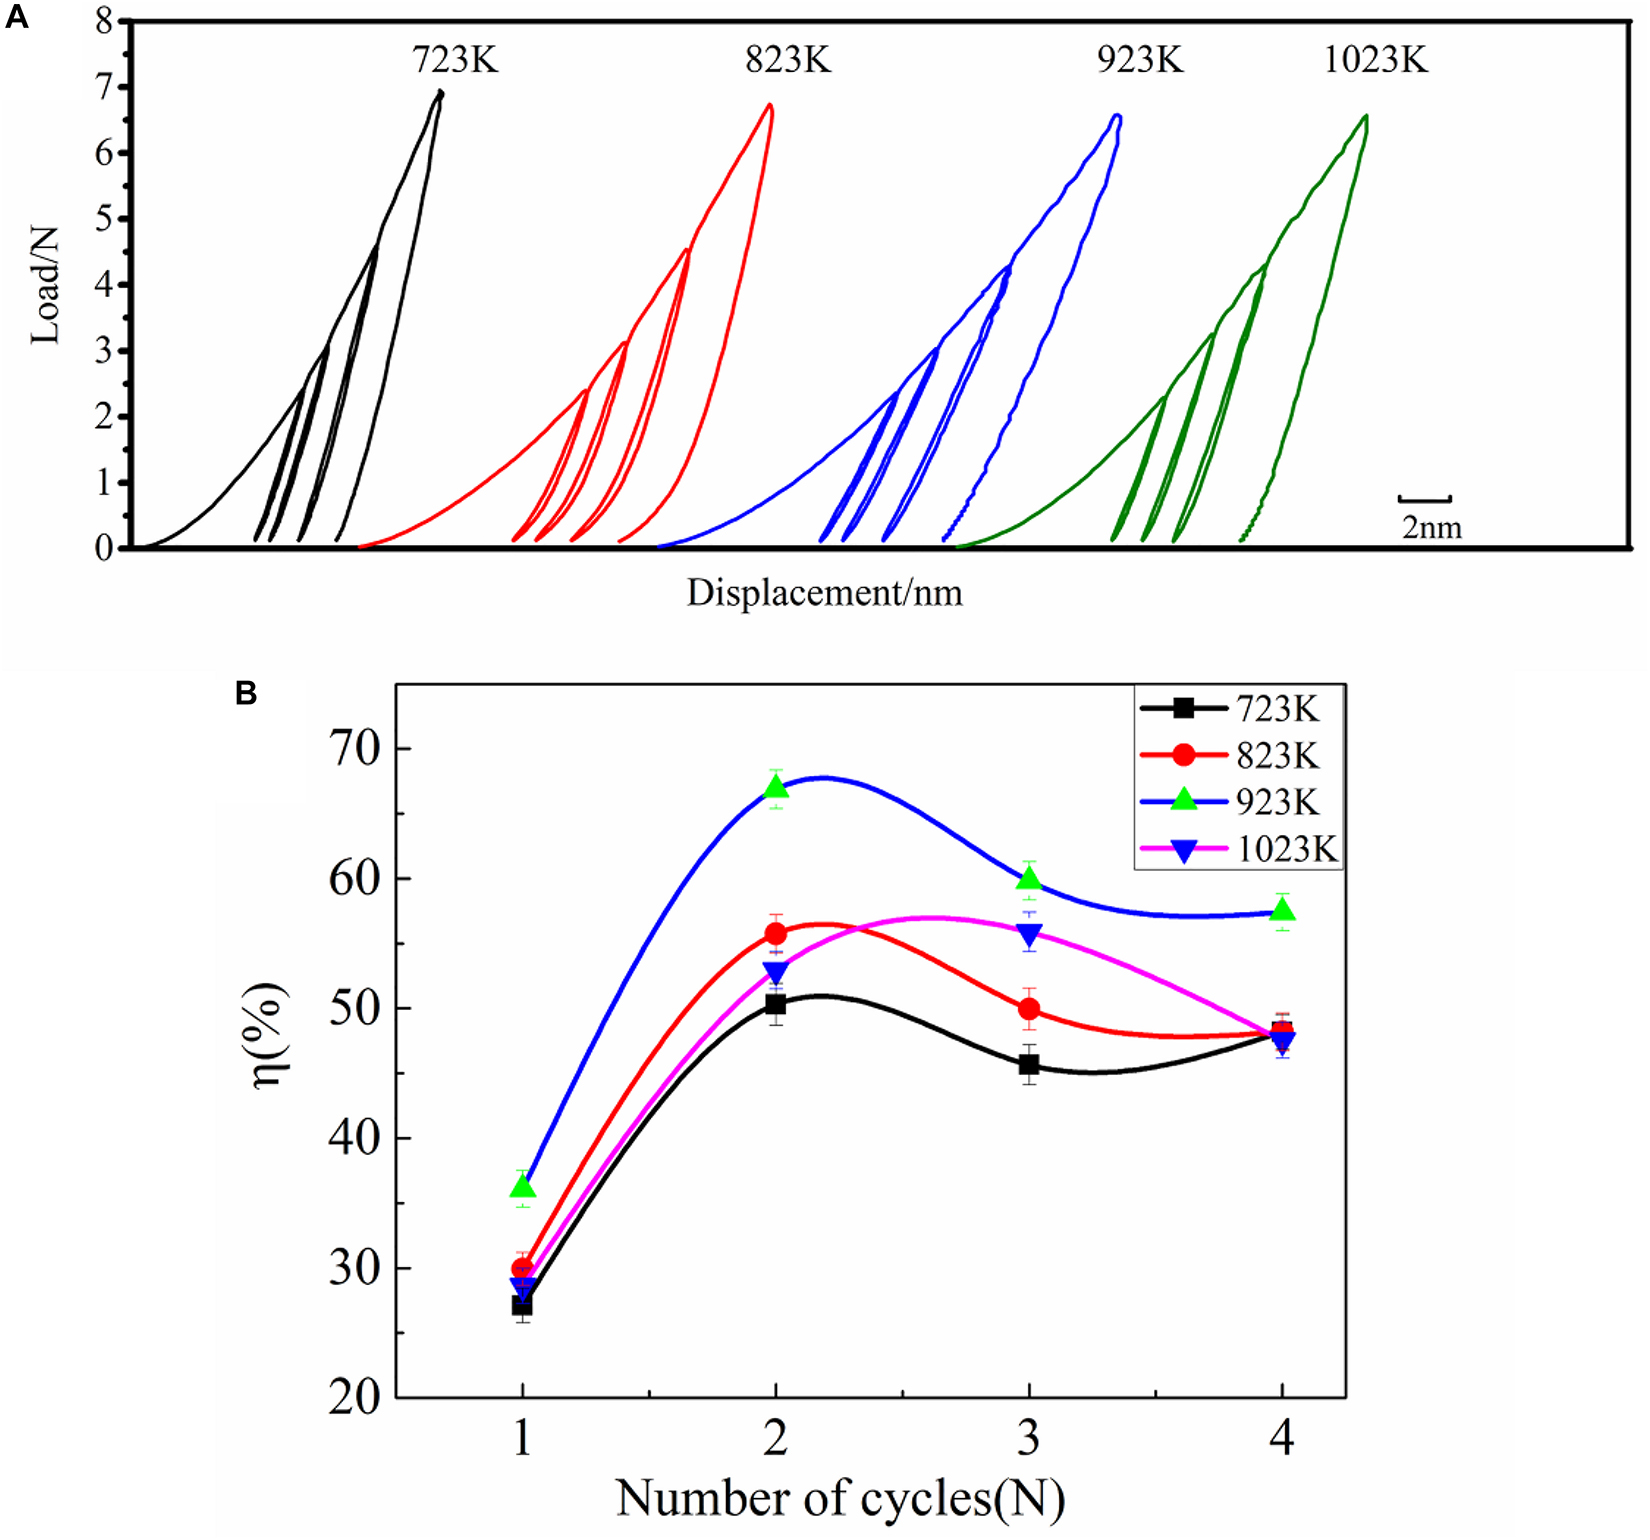
Figure 7. (A) Representative load-displacement curves of four continuous loading and unloading of 723,823, 923, and 1023 K. (B) The elastic recovery rate of four continuous loading and unloading at 723, 823, 923, and 1023 K.
As reported in Cao et al. (2008) and Gall et al. (2001), the total deformation energy Wt is represented by the area under the loading curve but the elastic deformation energy Wrc is represented by the area under the unloading curve. The following formulas are used in these calculations:
Where L1 and L2 represent the applied load, D represents the depth of penetration, and Dmax represents the maximum depth corresponds to the maximum load. Wt is the value of integrating load over displacement along the loading curve. Where Dr represents this residual depth at which the load falls to zero. Wrc is the value of integrating load over displacement along the unloading curve. The ratio of Wrc to Wt represents the energy recovery η, which is an indicator used to characterize the degree of elastic recovery of the sample.
Figure 7B shows the elastic recovery rates η of the different annealing samples after four loading and unloading indentation tests. Regardless of loading, the annealing samples at 923 K showed a higher η value than the other three samples, which means that the recovery rate of this sample is the highest and the best super-elasticity. In particular, the recovery rate of the second loading and unloading is the largest at 66.87%, the recovery rates of the other three samples are between 50 and 55%.
Figure 8 shows the elastic modulus of the alloy after the annealing at different temperatures. The elastic modulus of the alloy was measured by nano-indentation, and the measurement was carried out continuously at different positions of each sample 12 times, and then the average value was obtained. The elastic modulus exhibits the lowest value (50.1 Gpa) for the sample at the annealing temperature of 923 K (Figure 8). Figure 8 shows the most abundant β phase and the least α″ phase (Figure 2) exhibits the lowest elastic modulus after annealing temperature at 923 K. Elastic modulus of typical biomaterial alloy were tested by nano-indentation (Table 1). Compared with cp-Ti, elastic modulus reduced by about 70 Gpa, which is closer to the elastic modulus of human bones (28.8–40 Gpa). As the annealing temperature rises, elastic modulus drops first and then increases and significant differences can be seen at different annealing temperatures (the biggest difference is about 23.6 Gpa). During the annealing process, the decrease in elastic modulus is mainly due to the conversion of the α″ phase to the β phase.
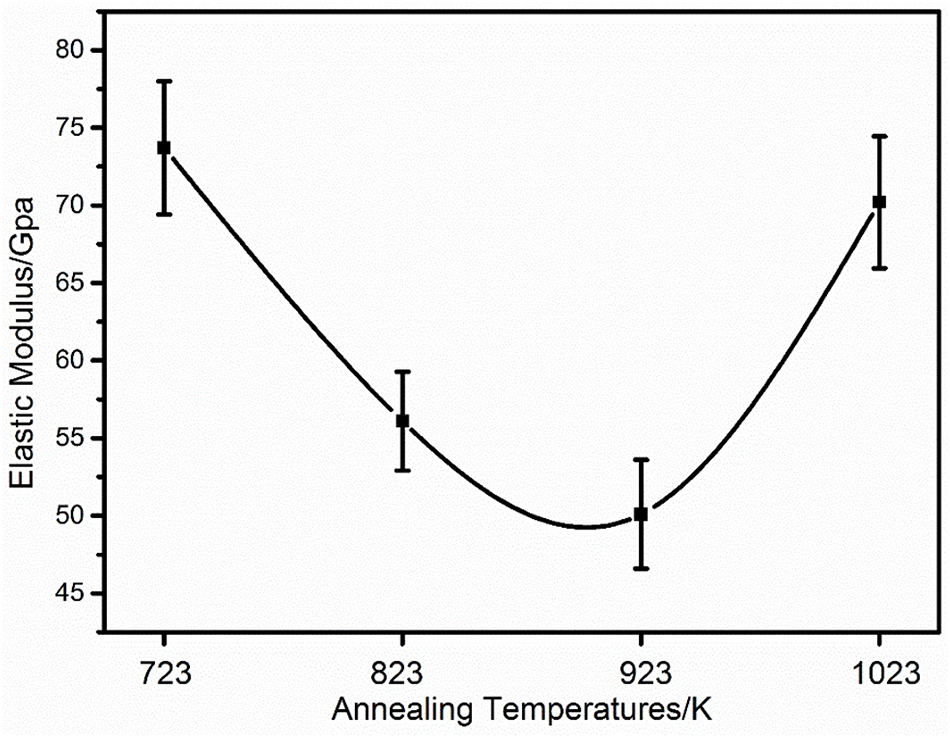
Figure 8. Elastic modulus of the samples at different annealing temperatures.
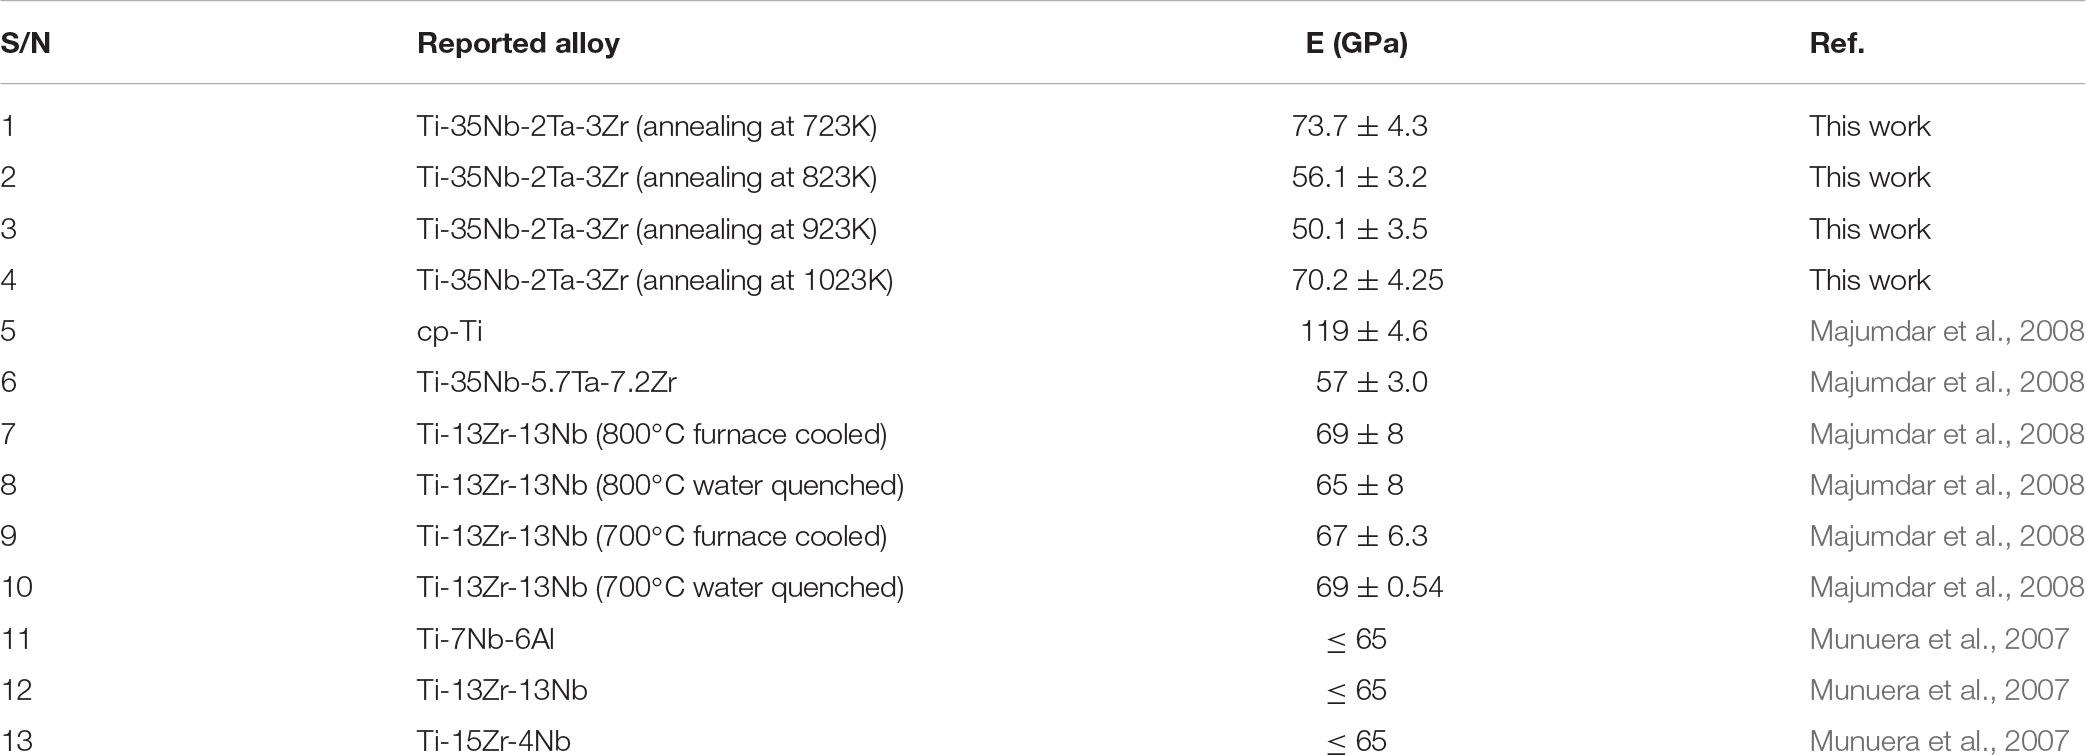
Table 1. Elastic modulus of typical biomaterial alloy tested by nano-indentation.
Majumdar et al. (2008) have reported that the elastic modulus of β Ti-35Nb-5.7Ta-7.2Zr (TNTZ) tested by nano-indentation after annealing was found to be half of the pure titanium. Also, Haghighi et al. (2015) have found that the least amount of α″ phase and dominant β phase in the Ti-10Fe-10Ta system exhibits the lowest elastic modulus and highest plasticity. These results are consistent with the test results of this work. However, Ho et al. (1999) reported that the modulus of Ti-7.5Mo (retained the α″-martensitic (orthorhombic) phase became the only dominant phase) is even lower than the modulus of Ti-15Mo (retained the β phase became the only dominant phase), which is inconsistent with to our findings. It is probably attributed to the various alloy system.
All samples were soaked in physiological electrolytes for 1 h before measurement, which resulted in more positive values of open circuit potential (OCP) and steady-state conditions. OCP curves and potentiodynamic polarization curves of the alloy are shown in Figure 9.
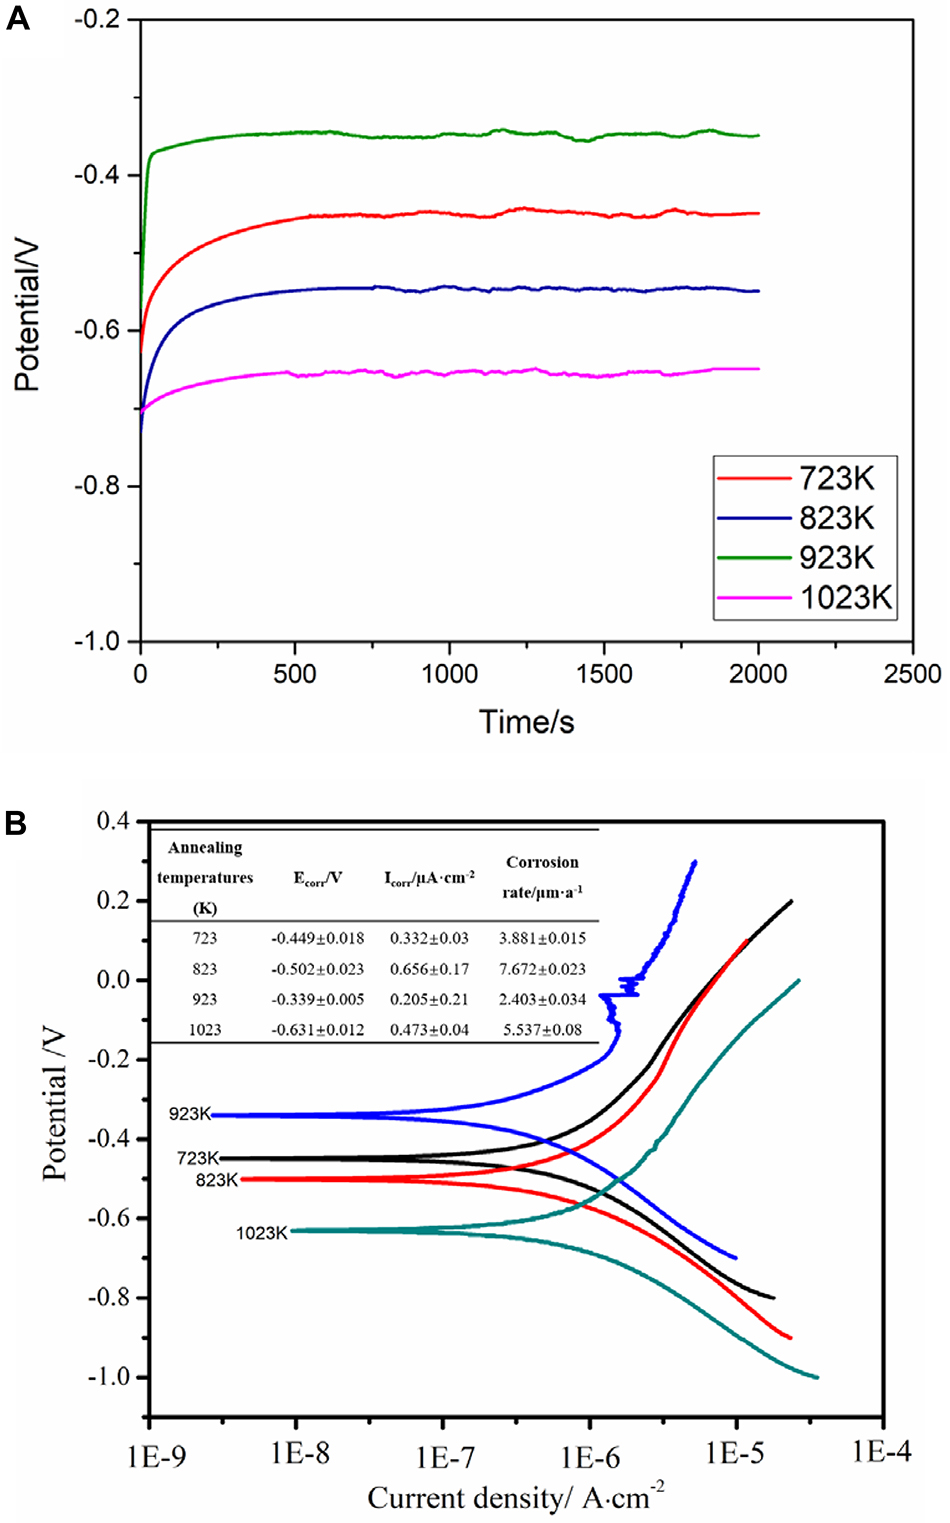
Figure 9. (A) Open circuit potential curves and (B) potentiodynamic polarization curves of the samples at different annealing temperatures.
According to the polarization curves shown in Figure 9B, the corrosion potential (Ecorr), corrosion current density (Icorr) and corrosion rate each curve were determined by the Tafel extrapolation method, as shown in Figure 9B. It is generally known that Ti and its alloys have good corrosion resistance owing to the spontaneous formation of a passivation oxide layer on their surface upon contact with oxygen (Martins et al., 2008). During the polarization test, the passivation film is being formed when the current density is almost constant with the increase of the potential. The sample annealed at 923 K formed passivation film at a potential of -0.20 V, with almost no change in current density. When the polarization arrived at -0.03 V potential, the current density gradually increased. The passivation film gradually repaired until the potential was about -0.02 V, and the second passivation occurred. However, the other three samples had been not passivated. The corrosion current density and corrosion rate of the sample annealed at 923 K (about 0.205 μA⋅cm–2 and 2.403 μm⋅a–1) are the smallest compared with the other three samples. The smaller the current density, the harder the alloy is to corrode. Therefore, compared with Ti-6Al-4V with the corrosion current density 0.326 μA/cm2 (Gabriel et al., 2012), Ti-35Nb-2Ta-3Zr has better corrosivity. Atapour et al. (2011) reported that the corrosion rate of the alloy is related to the number of phases contained in the alloy, and the corrosion of the single-phase is less likely to occur. The XRD and polarizing microscope from this experiment also shows that the annealed samples of 923 K are almost entirely composed of the β phase so that corrosion resistance. And it is also pointed out that when an activation-passivation metal is exposed to the corrosive environment, the metal can be self-passivated if its critical current density is less than 100 μA⋅cm–2 (Zheng et al., 2006). The corrosion current densities of these four temperatures annealed alloys are all below 100 μA⋅cm–2. However, the current density of the annealed samples at 923 K is much lower than this value. For the above reasons, the sample annealed at 923 K has better corrosion resistance than the other three samples.
The effects of annealing temperature on the microstructures, mechanical properties and chemical properties of metastable β-type Ti-35Nb-2Ta-3Zr alloy were investigated. Some important conclusions are summarized as follows:
(1) The results of XRD and polarization microscopy show that the sample annealed at 923 K is mainly composed of β phase (∼92.3%), while the samples annealed at 723 K, 823 K and 1023 K contain a large amount of α″ phase besides β phase (∼60%).
(2) The tensile tests show that the two-stage yielding phenomenon has been found in the curves of the specimen annealed at 923 K, and the dimple size is the smallest and the most uniform compared to the other three samples. In the loading and unloading indentation tests, the sample annealed at 923 K shows the highest recovery rate than the other three samples. In particular, the recovery rate of the second loading and unloading is the largest at 66.87%, the recovery rates of the other three samples are between 50 and 55%. Through nano-indentation tests, the elastic modulus of the sample annealed at 923 K is the lowest about 50.1 ± 3.5 GPa due to the high content of the β phase. The elastic modulus of the samples annealed at 723, 823, and 1023 K are 73.7 ± 4.3 GPa, 56.1 ± 3.2 GPa, and 70.2 ± 4.25 GPa, respectively.
(3) The corrosion current density and corrosion rate of the sample annealed at 923 K are the lowest compared with the other three samples, 0.205 μA⋅cm–2, and 2.403 μm⋅a–1, respectively, and the passivation phenomenon is observed by electrochemical corrosion test, which indicates that the alloy after annealed at 923 K is the most corrosion-resistant.
The datasets generated for this study are available on request to the corresponding author.
GZ and JC did all the experiments, analyzed the experimental statistics, and wrote the manuscript. FM designed the research idea. PL, XL, and WL advised the research work.
The authors acknowledge financial support provided by the National Natural Science Foundation of China (Grant No. 51771119), Natural Science Foundation of Shanghai (Grant No. 17ZR1419600), and Scientific and Technological Key Project of Shanghai (Grant Nos. 11441900500 and 11441900501).
The authors declare that the research was conducted in the absence of any commercial or financial relationships that could be construed as a potential conflict of interest.
Atapour, M., Pilchak, A. L., Frankel, G. S., and Williams, J. C. (2011). Corrosion behavior of β titanium alloys for biomedical applications. Mater. Sci. Eng. C 31, 885–891. doi: 10.1016/j.msec.2011.02.005
Bertrand, E., Gloriant, T., Gordin, D. M., Vasilescu, E., Drob, P., Vasilescu, C., et al. (2010). Synthesis and characterisation of a new superelastic Ti–25Ta–25Nb biomedical alloy. J. Mech. Behav. Biomed. Mater. 3, 559–564. doi: 10.1016/j.jmbbm.2010.06.007
Cai, M. H., Lee, C. Y., and Lee, Y. K. (2012). Effect of grain size on tensile properties of fine-grained metastable β titanium alloys fabricated by stress-induced martensite and its reverse transformations. Scr. Mater. 66, 606–609. doi: 10.1016/j.scriptamat.2012.01.015
Cai, S., Daymond, M. R., Ren, Y., Bailey, D. M., and Kay, L. E. (2013). Influence of short time anneal on recoverable strain of beta III titanium alloy. Mater. Sci. Eng. A 562, 172–179. doi: 10.1016/j.msea.2012.11.005
Cao, X., Cao, X., and Zhang, Q. (2008). Nanoscale indentation behavior of pseudo-elastic Ti–Ni thin films. J. Alloys Compd. 465, 491–496. doi: 10.1016/j.jallcom.2007.10.118
Chaves, J. M., Florêncio, O., Silva, P. S. Jr., Marques, P. W. B., and Afonso, C. R. M. (2015). Influence of phase transformations on dynamical elastic modulus and anelasticity of beta Ti–Nb–Fe alloys for biomedical applications. J. Mech. Behav. Biomed. Mater. 46, 184–196. doi: 10.1016/j.jmbbm.2015.02.030
Chen, J., Ma, F., Liu, P., Liu, X., Li, W., Chen, X., et al. (2017). Effects of different processing conditions on super-elasticity and low modulus properties of metastable β-type Ti-35Nb-2Ta-3Zr alloy. Vacuum 146, 164–169. doi: 10.1016/j.vacuum.2017.09.047
Cui, Y., Li, Y., Luo, K., and Xu, H. (2010). Microstructure and shape memory effect of Ti–20Zr–10Nb alloy. Mater. Sci. Eng. A 527, 652–656. doi: 10.1016/j.msea.2009.08.063
Ehtemam-Haghighi, S., Cao, G., and Zhang, L. C. (2016a). Nanoindentation study of mechanical properties of ti based alloys with fe and ta additions. J. Alloys Compd. 692, 892–897. doi: 10.1016/j.jallcom.2016.09.123
Ehtemam-Haghighi, S., Liu, Y., Cao, G., and Zhang, L. C. (2016b). Phase transition, microstructural evolution and mechanical properties of Ti-Nb-Fe alloys induced by Fe addition. Mater. Des. 97, 279–286. doi: 10.1016/j.matdes.2016.02.094
Freels, M., Wang, G. Y., Zhang, W., Liaw, P. K., and Inoue, A. (2011). Cyclic compression behavior of a Cu–Zr–Al–Ag bulk metallic glass. Intermetallics 19, 1174–1183. doi: 10.1016/j.intermet.2011.03.023
Fu, J., Kim, H. Y., and Miyazaki, S. (2017). Effect of annealing temperature on microstructure and superelastic properties of a Ti-18Zr-4.5 Nb-3Sn-2Mo alloy. J. Mech. Behav. Biomed. Mater. 65, 716–723. doi: 10.1016/j.jmbbm.2016.09.036
Gabriel, S. B., Panaino, J. V. P., Santos, I. D., Araujo, L. S., Mei, P. R., de Almeida, L. H., et al. (2012). Characterization of a new beta titanium alloy, Ti–12Mo–3Nb for biomedical applications. J. Alloys Compd. 536, S208–S210. doi: 10.1016/j.ajodo.2009.01.032
Gall, K., Juntunen, K., Maier, H. J., Sehitoglu, H., and Chumlyakov, Y. I. (2001). Instrumented micro-indentation of NiTi shape-memory alloys. Acta Mater. 49, 3205–3217. doi: 10.1016/s1359-6454(01)00223-3
Guo, D. Z., Lin, X., Zhao, Y. Q., and Cao, Y. Q. (2011). Application of nanoindentation in the research of materials. Mater. Rev. 25, 10–14.
Haghighi, S. E., Lu, H. B., Jian, G. Y., Cao, G. H., Habibi, D., and Zhang, L. C. (2015). Effect of α ?martensite on the microstructure and mechanical properties of beta-type Ti–Fe–Ta alloys. Mater. Des. 76, 47–54. doi: 10.1016/j.matdes.2015.03.028
Hao, Y. L., Zhang, Z. B., Li, S. J., and Yang, R. (2012). Microstructure and mechanical behavior of a Ti–24Nb–4Zr–8Sn alloy processed by warm swaging and warm rolling. Acta Mater. 60, 2169–2177. doi: 10.1016/j.actamat.2012.01.003
Ho, W. F., Ju, C. P., and Lin, J. C. (1999). Structure and properties of cast binary Ti–Mo alloys. Biomaterials 20, 2115–2122. doi: 10.1016/s0142-9612(99)00114-3
Ho, W. F., Pan, C. H., Wu, S. C., and Hsu, H. C. (2009). Mechanical properties and deformation behavior of ti–5cr–xfe alloys. J. Alloys Compd. 472, 546–550. doi: 10.1016/j.jallcom.2008.05.015
Kafkas, F., and Ebel, T. (2014). Metallurgical and mechanical properties of Ti–24Nb–4Zr–8Sn alloy fabricated by metal injection molding. J. Alloys Compd. 617, 359–366. doi: 10.1016/j.jallcom.2014.07.168
Khelfaoui, F., and Guénin, G. (2003). Influence of the recovery and recrystallization processes on the martensitic transformation of cold worked equiatomic Ti-Ni alloy. Mater. Sci. Eng. A 355, 292–298. doi: 10.1016/S0921-5093(03)00068-6
Kim, J. I., Kim, H. Y., Inamura, T., Hosoda, H., and Miyazaki, S. (2006). Effect of annealing temperature on microstructure and shape memory characteristics of Ti–22Nb–6Zr (at%) biomedical alloy. Mater. Trans. 47, 505–512. doi: 10.2320/matertrans.47.505
Kuroda, D., Niinomi, M., and Morinaga, M. (1998). Design and mechanical properties of new βtype titanium alloys for implant materials[J]. Mater. Sci. Eng. A 243, 244–249. doi: 10.1016/s0921-5093(97)00808-3
Liang, S. X., Feng, X. J., Yin, L. X., Liu, X. Y., Ma, M. Z., and Liu, R. P. (2016). Development of a new β Ti alloy with low modulus and favorable plasticity for implant material. Mater. Sci. Eng. C 61, 338–343. doi: 10.1016/j.msec.2015.12.076
Liqiang, W., Guanjun, Y., Huabin, Y., Jimin, C., Weijie, L., and Di, Z. (2009). Microstructure and mechanical properties of TiNbZr alloy during cold drawing. Rare Metal Mater. Eng. 38, 579–582. doi: 10.1016/s1875-5372(10)60029-x
Majumdar, P., Singh, S. B., and Chakraborty, M. (2008). Elastic modulus of biomedical titanium alloys by nano-indentation and ultrasonic techniques—A comparative study. Mater. Sci. Eng. A 489, 419–425. doi: 10.1016/j.msea.2007.12.029
Martins, D. Q., Osório, W. R., Souza, M. E., Caram, R., and Garcia, A. (2008). Effects of Zr content on microstructure and corrosion resistance of Ti–30Nb–Zr casting alloys for biomedical applications. Electrochim. Acta 53, 2809–2817. doi: 10.1016/j.electacta.2007.10.060
Meng, Q., Guo, S., Liu, Q., Hu, L., and Zhao, X. (2014). A β-type TiNbZr alloy with low modulus and high strength for biomedical applications. Prog. Nat. Sci. Mater. Int. 24, 157–162. doi: 10.1016/j.pnsc.2014.03.007
Milošev, I., Žerjav, G., Moreno, J. M. C., and Popa, M. (2013). Electrochemical properties, chemical composition and thickness of passive film formed on novel Ti–20Nb–10Zr–5Ta alloy. Electrochim. Acta 99, 176–189. doi: 10.1016/j.electacta.2013.03.086
Min, X. H., Emura, S., Sekido, N., Nishimura, T., Tsuchiya, K., and Tsuzaki, K. (2010). Effects of Fe addition on tensile deformation mode and crevice corrosion resistance in Ti–15Mo alloy. Mater. Sci. Eng. A 527, 2693–2701. doi: 10.1016/j.msea.2009.12.050
Miyazaki, S., Kim, H. Y., and Hosoda, H. (2006). Development and characterization of ni-free ti-base shape memory and superelastic alloys. Mater. Sci. Eng. A 438-440, 18–24. doi: 10.1016/j.msea.2006.02.054
Mo, W., Hu, X., Lu, S., Li, D., and Li, Y. (2015). Effects of boron on the microstructure, ductility-dip-cracking, and tensile properties for NiCrFe-7 weld metal. J. Mater. Sci. Technol. 31, 1258–1267. doi: 10.1016/j.jmst.2015.08.001
Mo, W., Lu, S., Li, D., and Li, Y. (2013). Effects of filler metal composition on the microstructure and mechanical properties for ER NiCrFe-7 multi-pass weldments. Mater. Sci. Eng. A 582, 326–337. doi: 10.1016/j.msea.2013.06.038
Munuera, C., Matzelle, T. R., Kruse, N., López, M. F., Gutiérrez, A., Jiménez, J. A., et al. (2007). Surface elastic properties of Ti alloys modified for medical implants: a force spectroscopy study. Acta Biomater. 3, 113–119. doi: 10.1016/j.actbio.2006.08.009
Nazari, K. A., Nouri, A., and Hilditch, T. (2015). Mechanical properties and microstructure of powder metallurgy Ti–xNb–yMo alloys for implant materials. Mater. Des. 88, 1164–1174. doi: 10.1016/j.matdes.2015.09.106
Niinomi, M. (2008). Mechanical biocompatibilities of titanium alloys for biomedical applications. J. Mech. Behav. Biomed. Mater. 1, 30–42. doi: 10.1016/j.jmbbm.2007.07.001
Niinomi, M., Nakai, M., and Hieda, J. (2012). Development of new metallic alloys for biomedical applications. Acta Biomater. 8, 3888–3903. doi: 10.1016/j.actbio.2012.06.037
Ren, Y., Wang, F., Wang, S., Tan, C., Yu, X., Jiang, J., et al. (2013). Mechanical response and effects of β-to-α” phase transformation on the strengthening of Ti–10 V–2 Fe–3 Al during one-dimensional shock loading. Mater. Sci. Eng. A 562, 137–143. doi: 10.1016/j.msea.2012.10.098
Wang, L., Lu, W., Qin, J., Zhang, F., and Zhang, D. (2008). Microstructure and mechanical properties of cold-rolled TiNbTaZr biomedical beta titanium alloy. Mater. Sci. Eng. A Struct. Mater. Propert. Microstruct. Process. 490, 421–426. doi: 10.1016/j.msea.2008.03.003
Wang, L., Xie, L., Lv, Y., Zhang, L. C., Chen, L., Meng, Q., et al. (2017). Microstructure evolution and superelastic behavior in Ti-35Nb-2Ta-3Zr alloy processed by friction stir processing. Acta Mater. 131, 499–510. doi: 10.1016/j.actamat.2017.03.079
Wang, W., Zhang, H., and Qi, M. (2016). Finite analysis of the compression in deployment and pulsating service behavior of the big band and z-shaped self-expanding stent. J. Funct. Mater. 2016, 4023–4027.
Xiong, C., Xue, P., Sun, B., and Li, Y. (2017). Effect of annealing temperature on the microstructure and superelasticity of Ti-19Zr-10Nb-1Fe alloy. Mater. Sci. Eng. A 688, 464–469. doi: 10.1016/j.msec.2015.02.004
Yang, H. W., Wen, J., Quan, M. X., and Wang, J. Q. (2009). Evaluation of the volume fraction of nanocrystals devitrified in Al-based amorphous alloys. J. Non Cryst. Solids 355, 235–238. doi: 10.1016/j.jnoncrysol.2008.12.001
Yang, Y., Castany, P., Cornen, M., Thibon, I., Prima, F., and Gloriant, T. (2014). Texture investigation of the superelastic ti–24nb–4zr–8sn alloy. J. Alloys Compd. 591, 85–90. doi: 10.1016/j.jallcom.2013.12.207
Zhang, J., Sun, F., Hao, Y., Gozdecki, N., Lebrun, E., Vermaut, P., et al. (2013). Influence of equiatomic zr/nb substitution on superelastic behavior of ti–nb–zr alloy. Mater. Sci. Eng. A 563, 78–85. doi: 10.1016/j.msea.2012.11.045
Keywords: metastable β titanium alloy, super-elasticity, low modulus, corrosion resistance, microstructure
Citation: Ma F, Zhang G, Liu P, Chen J, Liu X and Li W (2020) Effect of Various Annealing Temperature on Microstructure and Properties of Metastable β-Type Ti-35Nb-2Ta-3Zr Alloy for Biomedical Applications. Front. Mater. 7:77. doi: 10.3389/fmats.2020.00077
Received: 29 November 2019; Accepted: 16 March 2020;
Published: 03 April 2020.
Edited by:
Weijie Lu, Shanghai Jiao Tong University, ChinaReviewed by:
Qi Chao, Deakin University, AustraliaCopyright © 2020 Ma, Zhang, Liu, Chen, Liu and Li. This is an open-access article distributed under the terms of the Creative Commons Attribution License (CC BY). The use, distribution or reproduction in other forums is permitted, provided the original author(s) and the copyright owner(s) are credited and that the original publication in this journal is cited, in accordance with accepted academic practice. No use, distribution or reproduction is permitted which does not comply with these terms.
*Correspondence: Fengcang Ma, bWFmZW5nY2FuZ0AxNjMuY29t; Ping Liu, bGl1cGluZ0B1c3N0LmVkdS5jbg==
Disclaimer: All claims expressed in this article are solely those of the authors and do not necessarily represent those of their affiliated organizations, or those of the publisher, the editors and the reviewers. Any product that may be evaluated in this article or claim that may be made by its manufacturer is not guaranteed or endorsed by the publisher.
Research integrity at Frontiers
Learn more about the work of our research integrity team to safeguard the quality of each article we publish.