 Ruth F. Rowlands1
 Anita Zeidler
 Henry E. Fischer
 Philip S. Salmon
- 1Department of Physics, University of Bath, Bath, United Kingdom
- 2Science and Technology Division, Corning Incorporated, Corning, NY, United States
- 3Diffraction Group, Institut Laue Langevin, Grenoble, France
The method of neutron diffraction with isotope substitution was used to measure the full set of partial pair-correlation functions for each of the network-forming glasses GeSe3 and GeSe4, which lie at the boundaries of the so-called intermediate phase in the Ge-Se system. The results show the formation of chemically ordered networks, where selenium chains are cross-linked by Ge(Se4)1/2 tetrahedra, in contrast to glassy GeSe2 where the chemical order is broken. In all of these materials, the Ge-centered structural motifs are distributed unevenly on an intermediate length scale, as indicated by the appearance of a first sharp diffraction peak in the Bhatia-Thornton concentration-concentration partial structure factor. The new experimental work provides benchmark results for guiding in the development of realistic structural models, which can be used to explore the network rigidity and other structure-related properties of the glass. In this context, there are discrepancies between experiment and the predictions of first-principles molecular dynamics simulations that are particularly marked in respect of the Ge-Ge correlation functions, which are sensitive to the connectivity of the Ge-centered structural motifs.
1. Introduction
The GexSe1−x (0 ≤ x ≤ 1) system is a prototype for understanding the atomic-scale organization in covalently-bonded network glass-forming materials (Tronc et al., 1973; Bresser et al., 1986; Sugai, 1987; Penfold and Salmon, 1991; Zhou et al., 1991; Salmon and Liu, 1994; Feng et al., 1997; Wang et al., 1998; Petri et al., 1999a,b, 2000; Bureau et al., 2003; Salmon and Petri, 2003; Salmon, 2007a; Sartbaeva et al., 2007; Shatnawi et al., 2008; Inam et al., 2009; Lucas et al., 2009; Gjersing et al., 2010a,b; Bauchy et al., 2011; Hosokawa et al., 2011; Micoulaut et al., 2013; Salmon and Zeidler, 2015; Kaseman et al., 2016; Zeidler et al., 2017; Whittaker et al., 2018), where the network-forming motifs provide some of the essential building-blocks for technologically relevant chalcogenide glasses (Hilton, 1966; Seddon and Laine, 1997; Zakery and Elliott, 2003, 2007; Gopinath et al., 2004; Lezal et al., 2004; Kohoutek et al., 2008; Troles et al., 2009; Eggleton et al., 2011). According to mean-field constraint-counting theory, the glass network will undergo the transition with increasing x from an under-constrained elastically floppy phase to an over-constrained stressed-rigid phase at x = 0.2, where the mean number of Lagrangian bonding constraints per atom = 3, the number of degrees of freedom per atom in three dimensions (Phillips, 1979; Thorpe, 1983). At the x = 0.2 composition the mean nearest-neighbor coordination number = 2.4. In comparison, spectroscopic and calorimetric measurements on the GexSe1−x system suggest that the floppy and stressed-rigid phases are separated by an ‘intermediate phase’ that extends over the finite composition range 0.20 ≤ x ≤ 0.26 (Boolchand et al., 2001a,b; Bhosle et al., 2011, 2012). For this range, it is argued that the system lowers its free energy on glass formation by self-organizing to incorporate structural configurations that minimize the occurrence of either over or under constrained regions, to give a glass network that is isostatically rigid and stress-free (Thorpe et al., 2000). Here, self-organization is facilitated by structural variability, i.e., an ability of the system to accommodate different atomic conformations (Sartbaeva et al., 2007; Massobrio et al., 2009). The intermediate phase should therefore have a structural origin, but its signature has not been identified from diffraction or extended X-ray absorption fine structure (EXAFS) spectroscopy experiments (Shatnawi et al., 2008; Zeidler et al., 2017), or from molecular dynamics simulations (Micoulaut et al., 2013). From a dynamical perspective in the GexSe1−x system, intermediate phase compositions correspond to a maximum in the viscosity at the liquidus temperature, and to a minimum in the fragility index (Zeidler et al., 2017).
In this paper we take advantage of recent advances in neutron diffraction instrumentation to investigate the structure of two glasses that delimit the intermediate phase. Specifically, neutron diffraction with isotope substitution (NDIS) (Fischer et al., 2006; Salmon and Zeidler, 2013) is combined with singular valued decomposition (SVD) (Ludwig et al., 1987; Zeidler et al., 2010) to measure the full set of partial structure factors for glassy GeSe3 (x = 0.25) and GeSe4 (x = 0.20). These structure factors represent the maximal information that can be extracted from experiment at the pair-correlation function level. The results are compared to those obtained from high resolution 77Se magic angle spinning (MAS) nuclear magnetic resonance (NMR) (Gjersing et al., 2010b) or two-dimensional 77Se NMR (Kaseman et al., 2016) spectroscopy. The results are also compared to those obtained from recent density-functional-theory based first-principles molecular dynamics (FPMD) simulations (Kibalchenko et al., 2011; Bouzid and Massobrio, 2012; Micoulaut et al., 2013; Wezka et al., 2014; Bouzid et al., 2015; Chaker et al., 2018). This simulation approach is favored when modeling the structure of materials in the GexSe1−x system on account of the similarity between the electronegativity values for Ge and Se, although there are issues regarding the sensitivity of FPMD models to the size of the simulated system, and to the protocol used to prepare a glass from the liquid state (Bouzid et al., 2015; Le Roux et al., 2016).
The paper is organized as follows. The essential theory for the NDIS experiments is given in section 2. The experimental methods are then described in section 3, where the choice of neutron diffractometer enabled the diffraction patterns to be measured with excellent count-rate stability over a wide range of scattering vectors. The results are presented in section 4 at both the first-difference function and partial structure factor levels in order to check for self-consistency in the measured parameters. The results are discussed in section 5 by reference to those obtained from other experiments and FPMD simulations, where issues include the nature and connectivity of the structural motifs, and whether there is a structural signature of the intermediate phase (Shatnawi et al., 2008; Zeidler et al., 2017). Conclusions are drawn in section 6.
2. Theory
In a neutron diffraction experiment on glassy GeSe3 or GeSe4, the total structure factor (Fischer et al., 2006)
is measured, where α and β denote the chemical species, cα and bα represent the atomic fraction and coherent neutron scattering length of chemical species α, respectively, Sαβ(k) is a Faber-Ziman (Faber and Ziman, 1965) partial structure factor, and k is the modulus of the scattering vector. Consider the case of four samples that are identical in every respect, except for their isotopic compositions. Let the Ge-Se isotope combinations be represented by nat-nat, nat-mix, 70-nat, and 73–76, where nat denotes the natural isotopic abundance and mix denotes a mixture of Se isotopes, with enrichments (see section 3.1) that give coherent scattering lengths of bnatGe = 8.185(20), b70Ge = 9.93(10), b73Ge = 5.16(4), bnatSe = 7.970(9), bmixSe = 10.10(5), and b76Se = 12.19(10) fm (Sears, 1992). Then, if the total structure factors are denoted by , respectively, it follows that
In the case of GeSe3 the weighting factor matrix is given by
(1 barn = 10−28 m2), and in the case of GeSe4 the weighting factor matrix is given by
The partial structure factors Sαβ(k) are related to the partial pair-distribution functions gαβ(r) via the Fourier transform relation
where ρ is the atomic number density and r is a distance in real space. The mean coordination number of atoms of type β, contained in a volume defined by two concentric spheres of radii r1 and r2 centered on an atom of type α, is given by
It is possible to eliminate one of the partial structure factors by combining two total structure factors. For example, SSeSe(k) can be eliminated by forming a first-difference function such as
Similarly, SGeSe(k) can be eliminated by forming a first-difference function such as
The corresponding real-space functions, denoted by ΔGGe(r) and ΔG(r), are obtained from Equations (7) and (8), respectively, by replacing each Sαβ(k) by the corresponding gαβ(r) function. The weighting factors for the Ge-Ge and Ge-Se partial structure factors in Equation (7) are 0.054(1) and 0.196(3) barn for GeSe3 vs. 0.0349(8) and 0.167(3) barn for GeSe4, respectively. The weighting factors for the Ge-Ge and Se-Se partial structure factors in Equation (8) are −0.0323(6) and 0.552(12) barn for GeSe3 vs. −0.0207(4) and 0.628(14) barn for GeSe4, respectively. The first-difference functions are obtained from pairs of measured F(k) functions, whereas the partial structure factors are obtained by combining all of the measured F(k) functions. Self-consistent results are expected if systematic errors are small (Salmon and Petri, 2003).
It is also informative to decompose a total structure factor into its contributions from the Bhatia-Thornton (Bhatia and Thornton, 1970) number-number, concentration-concentration, and number-concentration partial structure factors denoted by SNN(k), SCC(k) and SNC(k), respectively, where
and 〈b〉 = cGebGe + cSebSe is the mean coherent scattering length. Equation (2) can then be re-written as
where in the case of GeSe3 the weighting factor matrix is given by
and in the case of GeSe4 the weighting factor matrix is given by
The corresponding partial pair-distribution functions are denoted by gIJ(r) (I, J = N, C), and are related to the gαβ(r) functions via the relations
Equation (9) shows that SNN(k) would be measured directly in a diffraction experiment if bGe = bSe, which is almost the case for the natGenatSe3 and natGenatSe4 samples because Ge and Se of natural isotopic abundance have very similar neutron scattering lengths. It follows that gNN(r) will describe the sites of the scattering nuclei but cannot distinguish between the chemical species that occupy those sites, i.e., it gives information on the topological ordering. The mean coordination number is given by
where the mean coordination number of Ge atoms and the mean coordination number of Se atoms . According to the “8-N" rule, in which = 4 and = 2, it follows that = 2.5 for GeSe3 and = 2.4 for GeSe4. In comparison, SCC(k) will give information on the chemical ordering and, according to Equation (14), there will be a positive peak or negative trough in gCC(r) if there is a preference at a given distance for like or unlike chemical species, respectively. Finally, gNC(r) will describe the cross-correlation between sites and their occupancy by a given chemical species. A full description of the Bhatia-Thornton formalism as applied to binary network glass-forming systems is given elsewhere (Salmon, 1992, 2007b).
Equations (2) and (10) can be solved to give the full set of Sαβ(k) or SIJ(k) functions by using the SVD method, which is described by Ludwig et al. (1987) and Zeidler et al. (2010). In the case of Equation (2), the two-norm condition number for the normalized weighting factor matrix is = 144 for GeSe3 vs. = 236 for GeSe4, respectively, i.e., the weighting factor matrix for GeSe3 is better conditioned (Zeidler et al., 2010). In the case of Equation (10), = 63 for GeSe3 vs. = 76 for GeSe4, respectively, i.e., the weighting factor matrices for the SIJ(k) functions are better conditioned than those for the Sαβ(k) functions.
We note that if Equation (2) is re-written to include only the total structure factors for the nat-mix, 70-nat and 73-76 samples, then the two-norm condition number for the normalized weighting factor matrix becomes = 133 for GeSe3 vs. = 221 for GeSe4. The resultant Sαβ(k) functions are in agreement with those obtained by using all four of the total structure factors and the SVD method (Rowlands, 2015). Inclusion of the total structure factor for the nat-nat sample does not improve the conditioning of the weighting factor matrix because does not contain information on the chemical ordering in the glass: As bnatGe ≃ bnatSe it follows from Equation (9) that .
In practice, a diffractometer can measure over only a finite scattering vector range up to a maximum value kmax, which is equivalent to the multiplication of the ideal diffraction pattern by a window function M(k) where M(k ≤ kmax) = 1 and M(k > kmax) = 0. The Fourier transform of this window function is given by
where sinc(y) ≡ sin(y) / y. To help in identifying those features in a measured gαβ(r) function that are an artifact of M(r), it is convenient to consider the density function
where dαβ(r) ≡ 4π ρr [gαβ(r) − 1] and ⊗ denotes the one-dimensional convolution operator. A least-squares fit to can then be made by using a sum of Gaussian functions, representing the peaks in dαβ(r), convolved with M(r) (Martin et al., 2003; Salmon and Petri, 2003). A similar procedure can also be adopted for the first-difference density functions and ΔD′(r) ≡ 4π ρr [ΔG(r) / |ΔG(r → 0)|] ⊗ M(r). Other window functions can be used to reduce the severity of Fourier transform artifacts.
3. Experimental
3.1. Synthesis and Characterization of Glassy GeSe3 and GeSe4
The Ge isotopes used for the sample preparation were processed in order to remove oxide impurities. Finely powdered isotope was loaded into a glass crucible, with a fritted glass bottom of 3 μm pore size, and placed within a reduction furnace. The furnace was flushed with Ar gas to remove air, and the gas flow was switched to hydrogen. Next, the furnace temperature was increased to 873 K at a rate of 4 K min−1, left for 48 h, and reduced to ambient at a rate of 1 K min−1. The gas flow was then switched back to Ar. This procedure gave a yield of ~83% and delivered Ge powder that had changed in appearance from black to metallic grey. Infra-red transmission spectroscopy experiments on the powder showed no indication of the Ge-O absorption band at ~879 cm−1 (Madon et al., 1991; Micoulaut et al., 2006), consistent with test experiments in which the reduction procedure was used to remove the oxygen from crystalline GeO2, or the oxygen impurities from crystalline Ge.
Two diffraction experiments were performed, the first on glassy GeSe4 and the second on glassy GeSe3. Each GeSe4 sample was prepared by loading elemental natGe (99.999%, Alfa Aesar), 70Ge (95.30% 70Ge, 4.10% 72Ge, 0.51 % 76Ge, 0.05% 74Ge and 0.04% 73Ge, Isoflex USA), or 73Ge (95.60% 73Ge, 2.34% 72Ge, 2.03% 74Ge, 0.025% 70Ge and 0.005% 76Ge, Isoflex USA) together with natSe (99.999+%, Sigma Aldrich), 76Se (99.8 % 76Se and 0.20 % 77Se, Isoflex USA), or mixSe (a 49.5:50.5 mixture by mass of natSe and 76Se) in the required mass ratio into a silica ampoule within a high-purity argon-filled glove box. The ampoule, of 5 mm inner diameter and 1 mm wall thickness, had previously been etched using a 48 wt% solution of hydrofluoric acid, rinsed using water then acetone, and baked dry under vacuum at 1073 K for 2 h. Once loaded, the ampoule was isolated using a Young's tap, and transferred to a vacuum line where it was sealed under a pressure of 10−5 Torr. The sealed ampoule was placed in a furnace that was rocked at a rate of 0.57 rpm with a maximum rocking angle of 30° to the horizontal. The furnace was heated at a rate of 1 K min−1 from ambient to a temperature T = 1,248 K, dwelling for 4 h each at T = 494 K, T = 958 K, and T = 1,211 K, near to the melting and boiling points of Se and the melting point of Ge, respectively. The highest temperature was maintained for 48 h before the rocking motion was stopped, the furnace was placed vertically and left for 4 h, and the furnace was then cooled at a rate of 1 K min−1 to T = 928 K (~100 K above the melting point of GeSe4) where the sample was left to equilibrate for 4 h. The ampoule was then dropped into an ice/water mixture. The glassy samples separated cleanly from the their silica ampoules, which were broken open in a high-purity argon-filled glove box. The GeSe3 samples were prepared from the GeSe4 samples by adding elemental Ge of matched isotopic abundance, quenching from 1,027 K, and otherwise following the same method. The mass of the prepared samples was ~1.5–2.2 g, and the precise sample stoichiometry, as determined by mass, was 0.2496(3) Ge: 0.7504(3) Se for GeSe3 vs. 0.1998(3) Ge: 0.8002(3) Se for GeSe4.
The measured infrared transmission spectra for the GeSe3 and GeSe4 glasses showed no indication of Ge-O or Se-O impurity bands, e.g., in the region around 735–781 cm−1 (Savage and Nielsen, 1965). A similarly prepared sample of GeSe4 glass, but with only 12 h of rocking, was characterized using energy dispersive X-ray spectroscopy and Raman spectroscopy, and was found to be homogeneous on a sub-micron to centimeter length scale (Lucas et al., 2019). The mass density, as measured using a helium pycnometer, was 4.309(3) g cm−3 or 4.334(4) g cm−3 for the GeSe3 and GeSe4 glasses, respectively, corresponding to an atomic number density of ρ = 0.03353(2) Å−3 or ρ = 0.03359(3) Å−3, respectively. A single glass transition temperature of Tg = 523(3) K for GeSe3 or Tg = 463(3) K for GeSe4 was measured by using modulated differential scanning calorimetry with a scan rate of 3 K min−1 and modulation of 1 K per 100 s.
3.2. Neutron Diffraction Experiments
The diffraction experiments were performed using the D4c instrument at the Institut Laue-Langevin (Fischer et al., 2002). The Cu(220) reflections from a monochromator gave an incident neutron wavelength λ = 0.4990(1) Å, and the λ/2 reflections were suppressed by using a Rh filter. The monochromator crystals were orientated to focus the neutron beam in both the horizontal and vertical directions, thus maximizing the flux of neutrons at the sample position. The same cylindrical vanadium container, of inner diameter 4.8 mm and wall thickness 0.1 mm, was used for each set of experiments to ensure a reproducible scattering geometry. The samples were loaded into the container within a high-purity argon-filled glove box. Diffraction patterns were measured at room temperature (≃298 K) for each of the samples in its container, the empty container, the empty instrument, and a cylindrical vanadium rod of diameter 6.08 mm for normalization purposes. The diffraction pattern was also measured for a slab of neutron absorbing 10B4C of dimensions similar to the sample in order to estimate the effect of the sample's attenuation on the background count-rate at small scattering angles (Bertagnolli et al., 1976). The relative counting times for the sample-in-container and empty container measurements were optimized in order to minimize the statistical error on the container-corrected intensity (Salmon et al., 2016). The counting times for each of the sample-in-container measurements was ~18 h for the GeSe3 experiment vs. ~22 h for the GeSe4 experiment. The count-rate stability was checked by saving the measured intensity for a given setup at regular intervals, and a comparison between these intensities showed no deviation within the statistical error. The count-rate stability of the D4c instrument is measured to be ±0.012(8)% (Zeidler et al., 2012).
The total structure factors were obtained by following the data analysis procedure described by Salmon et al. (1998), and self-consistency checks were made to assess the reliability of the measured functions. For instance, it is necessary that (i) the measured intensities are greater than or equal to zero which leads to the condition ; (ii) each of the Faber-Ziman partial structure factors satisfies the sum-rule relation as found by taking the low-r limit of Equation (5); (iii) the measured gαβ(r) functions oscillate about zero at r-values smaller than the distance of closest approach between two atoms; and (iv) when these oscillations in gαβ(r) are set to zero, the back Fourier transform should be in good overall agreement with the original partial structure factor.
4. Results
There is significant contrast between the total structure factors F(k) measured for the different isotopically enriched samples of glassy GeSe3 or GeSe4 (Figure 1). A so-called first sharp diffraction peak is observable at kFSDP = 1.06(1) Å−1 for GeSe3 vs. kFSDP = 1.12(2) Å−1 for GeSe4, and is a signature of ordering on an intermediate length scale (Salmon, 1994). As shown in Figure 2, the FSDP appears as a peak in ΔFGe(k), for which the Ge-Ge and Ge-Se partial structure factors receive positive weighting factors [Equation (7)], and as a trough in ΔF(k), for which the Ge-Ge and Se-Se partial structure factors receive negative and positive weighting factors, respectively [Equation (8)]. These observations are consistent with the FSDP having contributions from both SGeGe(k) and SGeSe(k).
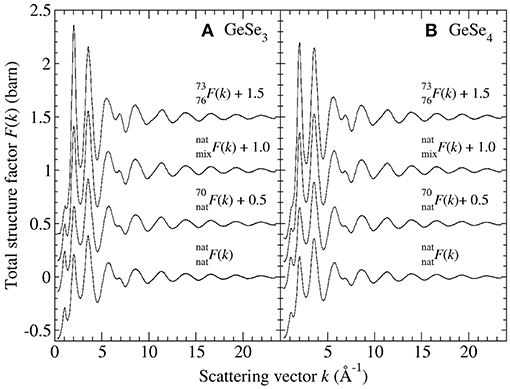
Figure 1. The total structure factors F(k) for glassy (A) GeSe3 and (B) GeSe4. The solid curves with vertical error bars represent the measured functions, where the size of an error bar is smaller than the curve thickness at most k values.
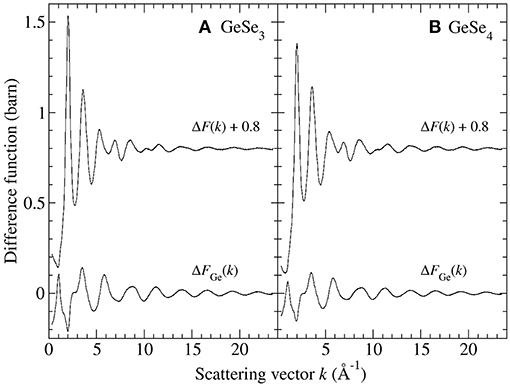
Figure 2. The first-difference functions ΔFGe(k) and ΔF(k) for glassy (A) GeSe3 and (B) GeSe4. The solid curves with vertical error bars represent the measured functions, where the size of an error bar is smaller than the curve thickness at most k values.
Figure 3 shows the and ΔD′(r) functions for glassy GeSe3 and GeSe4, obtained by Fourier transforming the spline-fitted reciprocal-space functions shown in Figure 2 with kmax = 23.5 Å−1. The first peaks in and ΔD′(r) were assumed to have contributions solely from Ge-Se and Se-Se nearest-neighbors, respectively, i.e., homonuclear Ge-Ge bonds were assumed to be rare. The first peak in each function was then fitted to a single Gaussian function convoluted with the modification function M(r). In the case of GeSe3, the fits gave a Ge-Se nearest-neighbor distance = 2.37(2) Å with = 4.02(2) and a Se-Se nearest-neighbor distance = 2.35(2) Å with = 0.72(2), corresponding to a goodness-of-fit parameter Rχ (Wright, 1993) of 0.055 or 0.048, respectively, for a fitted range of 1.5–3.0 Å. In the case of GeSe4, the fits gave = 2.37(2) Å with = 4.02(5) and = 2.35(2) Å with = 1.01(2), corresponding to an Rχ value of 0.022 or 0.044, respectively, for a fitted range of 1.5–3.0 Å.
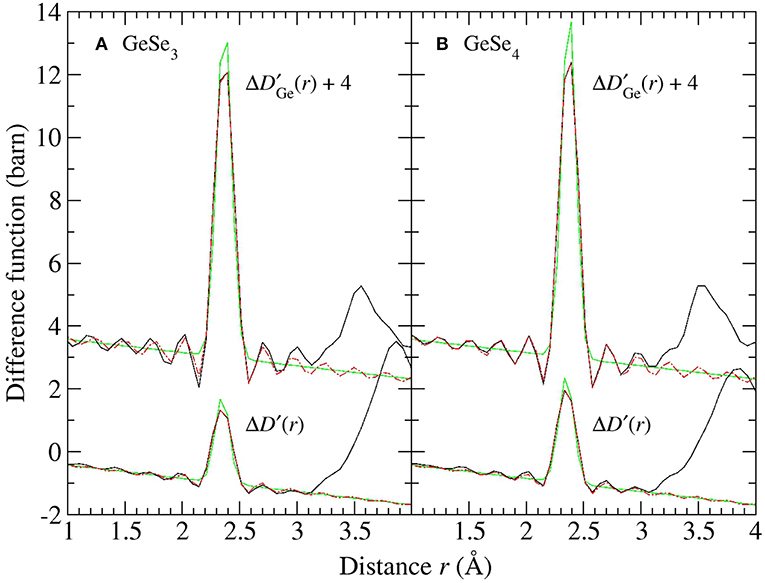
Figure 3. The first-difference density functions and ΔD′(r) for glassy (A) GeSe3 and (B) GeSe4 where the solid (black) curves were obtained by spline-fitting and Fourier transforming the ΔFGe(k) and ΔF(k) functions shown in Figure 2. In each case, the chained (red) curve shows a fit of the first peak in the measured function to a single Gaussian function [light solid (green) curve] convoluted with M(r).
Figure 4 shows the full set of partial structure factors Sαβ(k) for glassy GeSe3, as extracted from the total structure factors shown in Figure 1A by using the SVD method. The results show that SGeGe(k) has the most prominent FSDP at kFSDP = 1.01(1) Å−1, and that SGeSe(k) also has a small FSDP at kFSDP = 1.11(1) Å−1. The density functions of Figure 5A were obtained by Fourier transforming the spline fitted Sαβ(k) functions of Figure 4 with kmax = 23.5 Å−1, where a Lorch window function (Lorch, 1969; Salmon, 2006) was also applied to SGeGe(k) in order to reduce Fourier transform artifacts. The first peak in and was fitted to a single Gaussian function convoluted with M(r). The fits gave = 2.37(2) Å with = 4.00(2) and = 2.35(2) Å with = 0.70(2), corresponding to an Rχ value of 0.048 or 0.047, respectively, for a fitted range of 1.5–3.0 Å. These values are consistent with those obtained from the first-difference functions, and point to a network structure that is built from Ge(Se4)1/2 tetrahedra and Sen chains (n is an integer ≥2) where the homonuclear Se-Se bond distance is 2.35(2) Å. The peak in at 2.70(2) Å has a position that is larger than expected for homonuclear Ge-Ge bond distances of 2.33–2.42 Å (Salmon, 2007a), and it was therefore discounted as a real feature. In the structure of high-temperature crystalline GeSe2, the Ge-Ge distances for edge-sharing (ES) and corner-sharing (CS) Ge(Se4)1/2 tetrahedra are 3.05 and 3.51–3.60 Å, respectively (Dittmar and Schäfer, 1976). The peaks in at 3.04(3) and 3.58(2) Å were therefore assigned to the Ge-Ge distances for ES and CS Ge(Se4)1/2 tetrahedra, respectively.
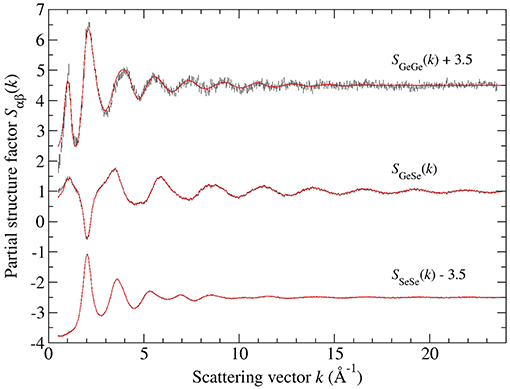
Figure 4. The Faber-Ziman partial structure factors Sαβ(k) for glassy GeSe3, obtained from the measured total structure factors of Figure 1A by using the SVD method. The vertical error bars represent the measured data points with statistical errors. The solid (red) curves are the back Fourier transforms of the corresponding partial pair-distribution functions gαβ(r) given by the solid curves in Figure 7.
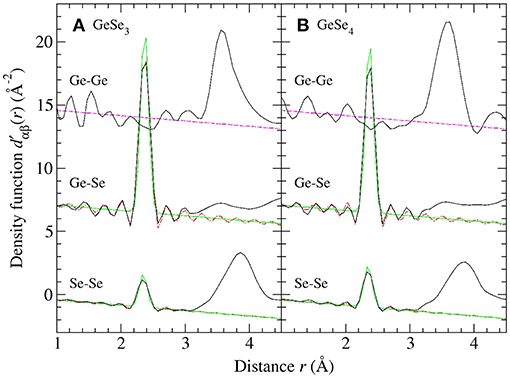
Figure 5. The density functions for glassy (A) GeSe3 and (B) GeSe4 where the solid (black) curves were obtained by Fourier transforming the spline-fitted Sαβ (k) functions shown in Figures 4, 6, respectively. For , the broken (magenta) line gives the locus of points for which . For and , the chained (red) curve shows a fit of the first peak to a single Gaussian function [light solid (green) curve] convoluted with M(r). The Ge-Se and Ge-Ge data sets have been shifted vertically for clarity of presentation.
Figure 6 shows the full set of partial structure factors Sαβ(k) for glassy GeSe4, as extracted from the total structure factors shown in Figure 1B by using the SVD method. The results show that SGeGe(k) has the most prominent FSDP at kFSDP = 0.97(2) Å−1, and that SGeSe(k) also has a small FSDP at kFSDP = 1.08(2) Å−1. The density functions of Figure 5B were obtained by Fourier transforming the spline fitted Sαβ(k) functions of Figure 6 with kmax = 23.5 Å−1, where a cosine window function was also applied to SGeGe(k) over the range 21.45 ≤ k (Å−1) ≤ 23.5 in order to reduce Fourier transform artifacts. The first peak in and was fitted to a single Gaussian function convoluted with M(r). The fits gave = 2.37(2) Å with = 4.04(5) and = 2.35(2) Å with = 1.00(2), corresponding to an Rχ value of 0.055 or 0.052, respectively, for a fitted range of 1.5–3.0 Å. These values are consistent with those obtained from the first-difference functions, and point to a network structure that is built from Ge(Se4)1/2 tetrahedra and Sen chains. The function shows no evidence of homonuclear Ge-Ge bonds, and does not display a peak at ≃3.04 Å that can be assigned to ES Ge(Se4)1/2 tetrahedra. The first peak at 3.59(1) Å is, however, broader than the corresponding feature for GeSe3, with a low-r cutoff of 3.07(3) Å that is typical of ES tetrahedral distances.
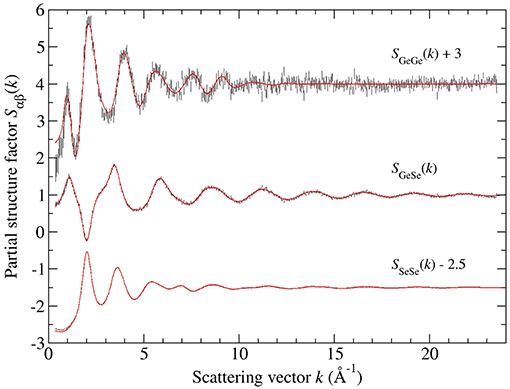
Figure 6. The Faber-Ziman partial structure factors Sαβ(k) for glassy GeSe4, obtained from the measured total structure factors of Figure 1B by using the SVD method. The vertical error bars represent the measured data points with statistical errors. The solid (red) curves are the back Fourier transforms of the corresponding partial pair-distribution functions gαβ(r) given by the solid curves in Figure 8.
The final Ge-Se and Se-Se dαβ(r) functions were obtained by merging smoothly the Gaussian representation of dGeSe(r) or dSeSe(r) in the first-peak region, where the effect of M(r) on and is measurable, with the functions at higher-r values. The function at these higher-r values was smoothed by the application of a Lorch window function. In comparison, dGeGe(r) was set equal to the measured function at all r values. In each case, the unphysical oscillations at r values less than the distance of closest approach between the centers of two atoms were set to dαβ(r) = −4π ρr. The final dαβ(r) functions were then converted to the gαβ(r) functions shown in Figures 7, 8 for glassy GeSe3 and GeSe4, respectively. The back Fourier transforms of these gαβ(r) functions are compared to the measured partial structure factors for glassy GeSe3 and GeSe4 in Figures 4, 6, respectively.
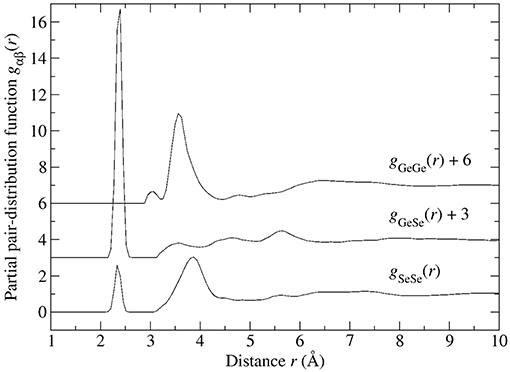
Figure 7. The partial pair-distribution functions gαβ(r) for glassy GeSe3 after the effect of M(r) has been removed.
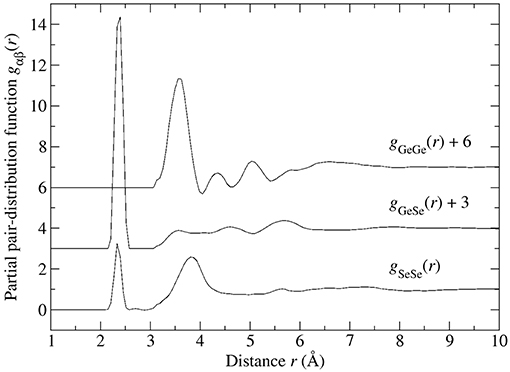
Figure 8. The partial pair-distribution functions gαβ(r) for glassy GeSe4 after the effect of M(r) has been removed.
The Bhatia-Thornton partial structure factors SIJ(k) and corresponding partial pair-distribution functions gIJ(r) are shown in Figures 9, 10, respectively. As discussed in section 2, the weighting factor matrix used to obtain the SIJ(k) functions is better conditioned than the matrix used to obtain the Sαβ(k) functions, which accounts for the reduction in size of the error bars for SCC(k) as compared to SGeGe(k). For each material, the inequality relation is fulfilled within the statistical error at all k values (section 3.2). Each set of partial structure factors shows an FSDP in the range 1.01(2)–1.05(2) Å−1 for GeSe3 vs. 0.91(2)–1.11(2) Å−1 for GeSe4, and a principal peak or trough in the range 2.01(2)–2.04(2) Å−1 for GeSe3 vs. 1.99(2)–2.03(2) Å−1 for GeSe4.
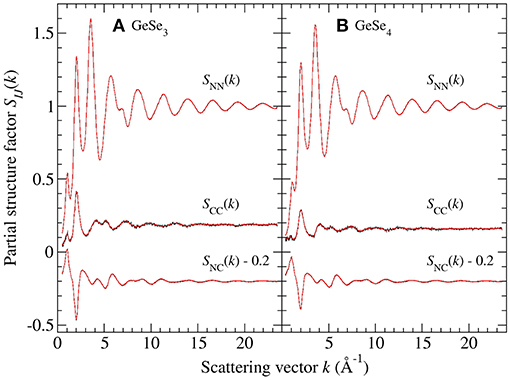
Figure 9. The Bhatia-Thornton partial structure factors SIJ(k) for glassy (A) GeSe3 and (B) GeSe4, obtained from the measured total structure factors of Figure 1 by using the SVD method. The vertical error bars represent the measured data points with statistical errors. The solid (red) curves are spline fits used to obtain the partial pair-distribution functions gIJ(r) shown in Figure 10.
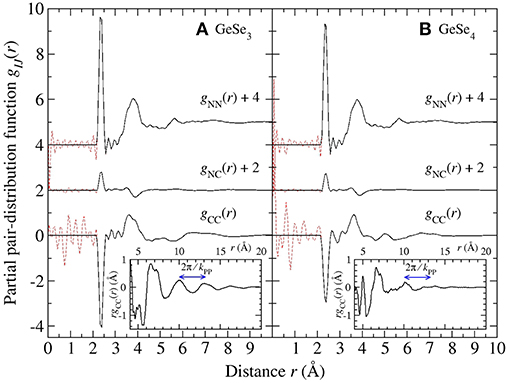
Figure 10. The Bhatia-Thornton partial pair-distribution functions gIJ(r) for glassy (A) GeSe3 and (B) GeSe4. The solid black curves were obtained by Fourier transforming the spline fitted partial structure factors shown in Figure 9 and setting the unphysical oscillations at r values smaller than the distance of closest approach between the centers of two atoms [broken (red) curves] to the gIJ(r → 0) limit. The insets show the larger-r features in rgCC(r), and the arrowed lines indicate the periodicity expected from the position of the principal peak in SCC(k) at kPP ≃2.03 Å−1.
As in the case of glassy GeSe2, the FSDP in SCC(k) for glassy GeSe3 and GeSe4 indicates the presence of concentration fluctuations on an intermediate length scale (Penfold and Salmon, 1991; Salmon, 1992). This feature arises from the Ge-Ge and Ge-Se pair-correlation functions, in keeping with the relation
and the measured Sαβ(k) functions shown in Figures 4, 6. From the properties of Fourier transforms, a sharp peak in SCC(k) at ki is associated with real-space ordering of periodicity 2π/ki that decays with a correlation length of 2π/Δki, where Δki is the peak width (Salmon, 1994). The most prominent feature in SCC(k) is the principal peak at kPP ≃2.03 Å−1 with a height that decreases in the order from GeSe2 to GeSe3 to GeSe4. The Fourier transform of SCC(k) shows oscillations of periodicity 2π/kPP that are readily discernable for GeSe2 (Salmon, 2006) and GeSe3 (inset to Figure 10A). Similarly, the small FSDP in SCC(k) at kFSDP will originate from a real-space length scale that is commensurate with 2π/kFSDP, i.e., the Ge atoms in the network structures are not distributed uniformly on an intermediate length scale. In the context of FPMD simulations, the appearance of this FSDP is significant because its reproduction has necessitated the use of exchange and correlation energy functionals that enhance charge transfer between the Ge and Se atoms (Massobrio et al., 1999, 2000, 2010; Micoulaut et al., 2009, 2013).
5. Discussion
5.1. Network Structure
The measured Ge-Se coordination numbers for glassy GeSe2 (Petri et al., 2000; Salmon and Petri, 2003), GeSe3 and GeSe4 indicate the formation of Ge(Se4)1/2 tetrahedra (Table 1). The Ge-Se:Se-Se distance ratio, obtained from the nearest-neighbor Ge-Se and next-nearest-neighbor Se-Se peak positions, is 0.607(6), 0.616(6), or 0.619(6) for GeSe2, GeSe3, and GeSe4, respectively, and the intra-tetrahedral Se-Ge-Se bond angle obtained from these peak positions is 111(1)°, 109(1)°, or 108(1)°, respectively. In comparison, for a regular tetrahedron, the Ge-Se:Se-Se distance ratio is = 0.612, and the intra-tetrahedral Se-Ge-Se bond angle is 109.47°. The Ge-Se-Se bond angle, estimated from the first and second peak positions in gGeSe(r), is 98(2)° for both GeSe3 and GeSe4.
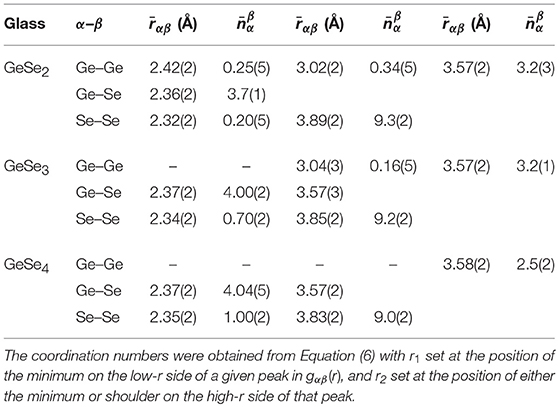
Table 1. The positions and coordination numbers found from the first few peaks in the partial pair-distribution functions gαβ(r) measured by NDIS in the work of Petri et al. (2000) and Salmon and Petri (2003) for glassy GeSe2, and in the present work for glassy GeSe3 and GeSe4.
For all of the glasses, the peak in gSeSe(r) at 2.34 Å originates from homonuclear Se-Se bonds, and the corresponding coordination number increases with the Se content of the glass. A comparison of the values with those found from 77Se NMR experiments (Gjersing et al., 2010b; Kaseman et al., 2016) is given in Table 2. Here, the NMR experiments provide the fractions of Se atoms in Se-Se-Se vs. Ge-Se-Se connections, and the corresponding Se-Se coordination numbers follow from and , where NSe, Se-Se-Se is the number of Se atoms bound to two other Se atoms in a Se-Se-Se connection, NSe, Ge-Se-Se is the number of Se atoms bound to one Ge atom and one Se atom in a Ge-Se-Se connection, and NSe is the total number of Se atoms in the glass.
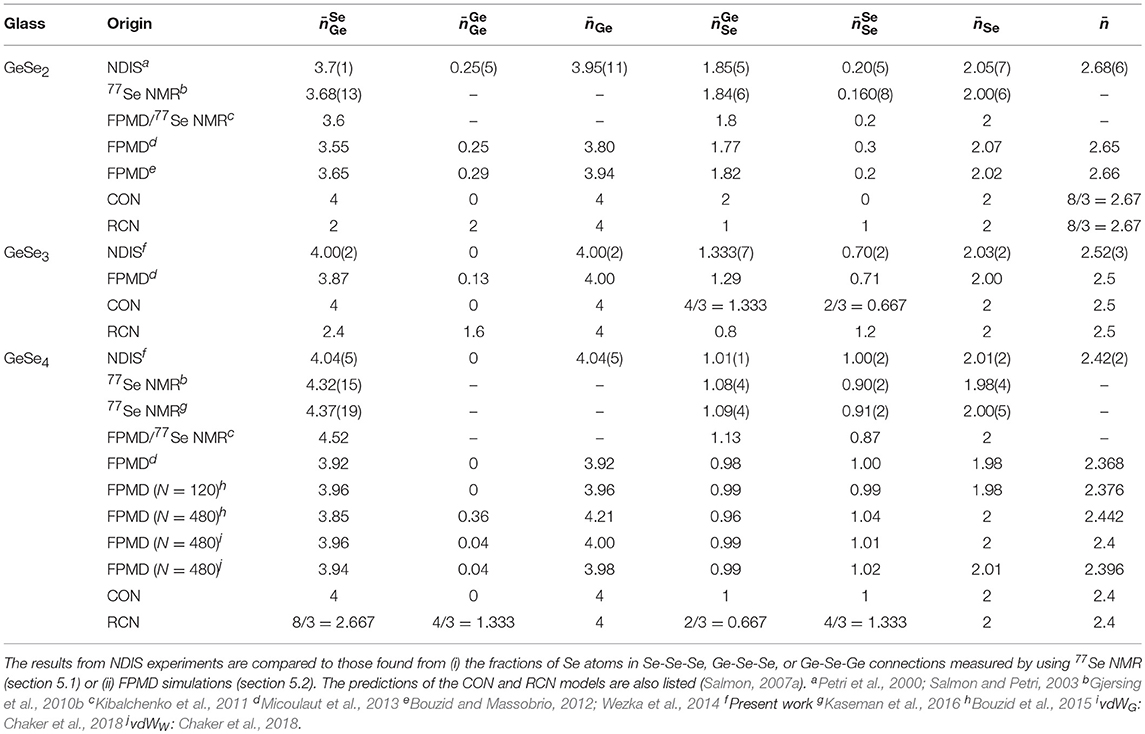
Table 2. The composition dependence of the nearest-neighbor coordination numbers.
For GeSe2, the peak in gGeGe(r) at =2.42(2) Å originates from homonuclear Ge-Ge bonds, but there is no evidence of these bonds in either GeSe3 or GeSe4. For GeSe2 and GeSe3, the peak in gGeGe(r) at 3.02–3.04 Å originates from ES Ge(Se4)1/2 tetrahedra, but this feature is absent for GeSe4. The associated inter-tetrahedral Ge-Se-Ge bond angle, estimated from the nearest-neighbor Ge-Se and ES Ge-Ge distances, is 80(1)°.
For all of the glasses, the peak in gGeGe(r) at 3.57 Å will have a contribution from CS Ge(Se4)1/2 tetrahedra (Petri et al., 2000; Salmon and Petri, 2003), and the associated inter-tetrahedral Ge-Se-Ge bond angle, estimated from the nearest-neighbor Ge-Se and CS Ge-Ge distances, is 98(2)°. In comparison, for the high-temperature crystalline phase of GeSe2 (Dittmar and Schäfer, 1976), the Ge-Se-Ge bond angle is in the range of 80.2–80.6° for ES tetrahedra vs. 96.2–100.1° for CS tetrahedra.
For GeSe3 and GeSe4, there will be contributions to gGeGe(r) from the Ge-Ge distances within Ge-Sen-Ge connections. For instance, in the case of GeSe4 there are peaks at 4.34(2) Å and 5.06(2) Å that do not appear to be Fourier transform artifacts, with coordination numbers of = 0.33(2) and = 1.28(2), respectively. If these peaks originate from Ge-Se-Se-Ge connections, then the associated Ge-Ge distance will depend on the relative rotation of these Ge atoms about the Se-Se bond, i.e., on the dihedral angle ϕ between two planes that contain both of the Se atoms and either the first or the second Ge atom in a Ge-Se-Se-Ge connection. For a Ge-Se-Se bond angle of 98° and bond distances of = 2.37 Å and = 2.35 Å, a Ge-Ge distance of 4.34 Å is obtained for ϕ ≃84°, and a Ge-Ge distance of 5.06 Å is obtained for ϕ ≃120°.
For each glass, the NDIS experiments give = 4 and = 2 within the experimental error (Table 2), and the overall mean coordination numbers are in agreement with those obtained from the first peak in the gNN(r) functions of Figure 10 [see Equation (16)]. The NDIS results are therefore consistent with the expectations of the “8-N" rule (Zeidler et al., 2017). In comparison, the fraction of Se atoms in Ge-Se-Ge connections has been measured for several GexSe1−x glasses with x ≤ 1/3 by using 77Se NMR spectroscopy (Gjersing et al., 2010b; Kaseman et al., 2016). The Se-Ge coordination numbers for CS and ES connections are given by the expressions (CS) = (NSe, CS / NSe) × 2 and (ES) = (NSe, ES / NSe) × 2, respectively, where NSe, CS and NSe, ES are the numbers of Se atoms in CS and ES connections, respectively. The values extracted from the 77Se NMR results for glassy GeSe2 and GeSe4 are compared to the NDIS results in Table 2. Both techniques give a mean coordination number = 2, although there is a discrepancy for GeSe4 between the relative contributions to from vs. . A similar set of findings was obtained by re-interpreting the measured 77Se MAS NMR spectra for glassy GeSe2 and GeSe4 (Gjersing et al., 2010b) by using the isotropic chemical shifts calculated for the 77Se nucleus via density-functional-theory based NMR calculations for amorphous model structures generated by FPMD (Kibalchenko et al., 2011) (Table 2). The associated Ge-Se coordination numbers are given by , and are also shown in Table 2. For the case of GeSe4, the values extracted from the 77Se NMR results are larger than expected from the “8-N” rule.
Within the framework of the “8-N” rule, the chemically ordered network (CON) and random covalent network (RCN) models provide simple but contrasting viewpoints of the network structures (Salmon, 2007a). In the CON, Ge-Se bonds are favored. It follows that only Ge-Se and Se-Se bonds are allowed for compositions with x < 1/3 such that = 4, , and = 0, whereas only Ge-Se and Ge-Ge bonds are allowed for compositions with x > 1/3 such that = 2(1−x) / x, = 0, and = 2(3x−1) / x. By contrast, in the RCN there is a purely statistical distribution of bond types such that Se-Se bonds are allowed for x > 1/3 and Ge-Ge bonds are allowed for x < 1/3. In this case, the coordination numbers are given by , and . Table 2 shows that the coordination numbers from the NDIS method are consistent with the CON for GeSe3 and GeSe4, and that there is a breakdown of the chemical ordering for GeSe2.
The fraction of Ge atoms in ES tetrahedral motifs can be estimated by assuming that there are no extended chains of ES motifs. Then, each ES conformation will involve two ES Ge atoms, two ES Se atoms and four other Se atoms, i.e., each ES Ge atom will be associated with one other ES Ge atom. The corresponding Ge-Ge coordination number is given by , where NGe, ES is the number of Ge atoms in ES motifs and NGe is the total number of Ge atoms in the glass. In order to make a quantitative comparison with the results from 77Se MAS NMR experiments (Gjersing et al., 2010b), the fraction of Se atoms in ES Ge-Se-Ge connections needs to be estimated from the NDIS results. With the assumption that there are no extended chains of ES motifs, each pair of ES Ge atoms will be associated with two ES Se atoms, i.e., NGe, ES = NSe, ES such that . Hence, the measured NDIS values give NSe, ES / NSe = 0.17(3) for GeSe2 vs. NSe, ES / NSe = 0.05(2) for GeSe3. In comparison, the 77Se MAS NMR experiments give NSe, ES / NSe values of 0.23(3) and 0.10(3) for GeSe2 and GeSe3.78, respectively. For the case of GeSe4, there is no evidence of ES conformations from the NDIS experiments, although the low-r tail on the first peak in gGeGe(r) does cover part of the distance range expected for ES tetrahedra. In comparison, 77Se MAS NMR experiments give NSe, ES / NSe = 0.08(3) for GeSe4 (Gjersing et al., 2010b), and Raman spectroscopy experiments report the existence of ES tetrahedra over the entire composition range 0.1 ≤ x ≤ 0.33 (Sugai, 1987; Wang et al., 1998; Lucas et al., 2009; Gjersing et al., 2010b; Bhosle et al., 2012).
We note that the presence of ES conformations and the appearance of an FSDP in SCC(k) (Figure 9) are in contradiction with the chain-crossing model for GexSe1−x glasses with x <1/3 in which a uniform distribution of Ge-centered structural motifs is hypothesized (Tronc et al., 1973; Bureau et al., 2003).
5.2. Comparison With FPMD Models
In Figures 11–13, the measured Sαβ(k) and gαβ(r) functions are compared to those obtained from N = 120 atom FPMD simulations of GeSe2 (Bouzid and Massobrio, 2012; Micoulaut et al., 2013; Wezka et al., 2014), GeSe3 (Micoulaut et al., 2013), and GeSe4 (Micoulaut et al., 2013; Bouzid et al., 2015) and from N = 480 atom simulations of GeSe4 (Bouzid et al., 2015). In all of this FPMD work, the Becke-Lee-Yang-Parr (BLYP) exchange and correlation energy functional was employed (Becke, 1988; Lee et al., 1988), and steps were taken to ensure that the simulated systems were free from residual pressure (Bouzid and Massobrio, 2012). The simulated nearest-neighbor coordination numbers are compared to the measured values in Table 2.
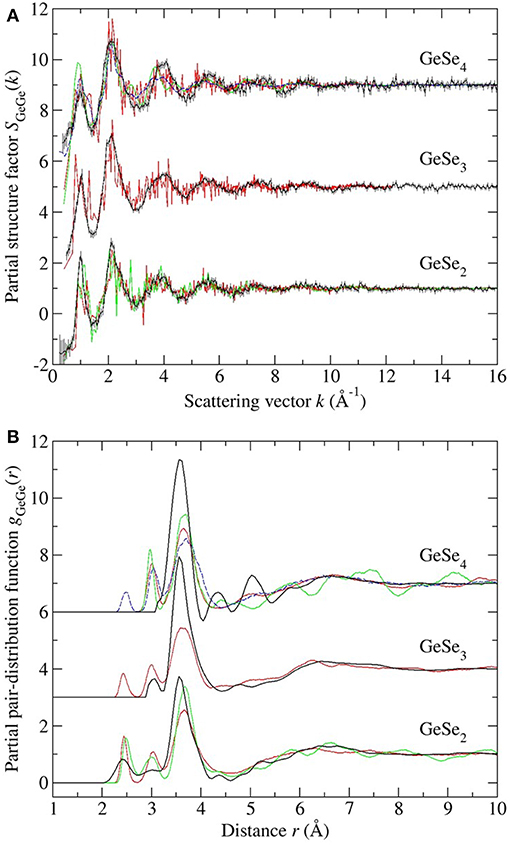
Figure 11. The measured vs. simulated (A) SGeGe(k) and (B) gGeGe(r) functions for glassy GeSe2, GeSe3 and GeSe4. The measured functions [dark (black) curves] are from the work of Petri et al. (2000) and Salmon and Petri (2003) in the case of GeSe2, or from the present work in the cases of GeSe3 and GeSe4. In (A) the vertical bars represents the statistical uncertainty on the measured data points. The FPMD results are from (i) Micoulaut et al. (2013) with N = 120 [solid (red) curves], (ii) Bouzid and Massobrio (2012) and Wezka et al. (2014) for GeSe2 with N = 120 [solid (green) curves], and (iii) Bouzid et al. (2015) for GeSe4 with either N = 120 [solid (green) curves] or N = 480 [broken (blue) curves]. The data sets for GeSe3 and GeSe4 are offset vertically for clarity of presentation.
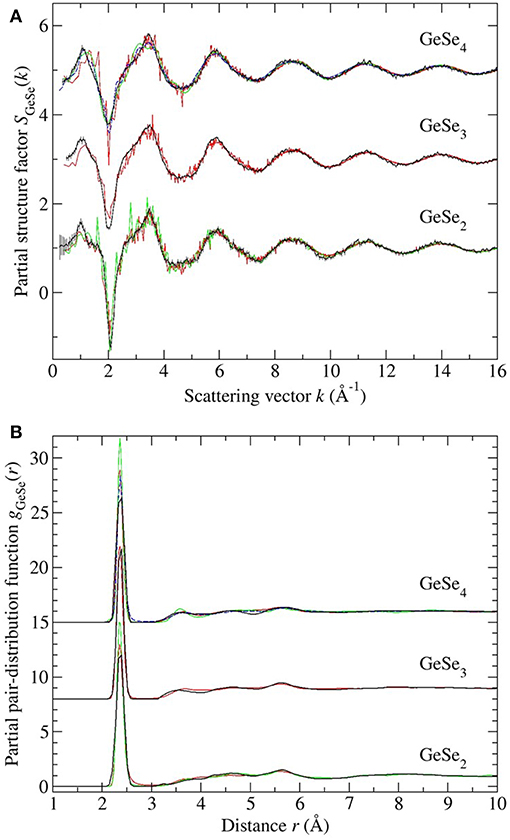
Figure 12. The measured vs. simulated (A) SGeSe(k) and (B) gGeSe(r) functions for glassy GeSe2, GeSe3, and GeSe4. The measured functions [dark (black) curves] are from the work of Petri et al. (2000) and Salmon and Petri (2003) in the case of GeSe2, or from the present work in the cases of GeSe3 and GeSe4. In (A) the vertical bars represent the statistical uncertainty on the measured data points. The FPMD results are from (i) Micoulaut et al. (2013) with N = 120 [solid (red) curves], (ii) Bouzid and Massobrio (2012) and Wezka et al. (2014) for GeSe2 with N = 120 [solid (green) curves], and (iii) Bouzid et al. (2015) for GeSe4 with either N = 120 [solid (green) curves] or N = 480 [broken (blue) curves]. The data sets for GeSe3 and GeSe4 are offset vertically for clarity of presentation.
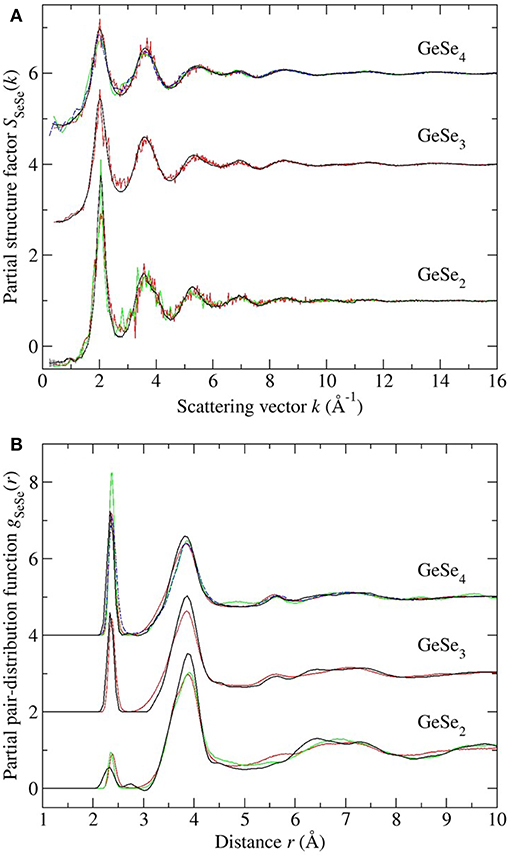
Figure 13. The measured vs. simulated (A) SSeSe(k) and (B) gSeSe(r) functions for glassy GeSe2, GeSe3, and GeSe4. The measured functions [dark (black) curves] are from the work of Petri et al. (2000) and Salmon and Petri (2003) in the case of GeSe2, or from the present work in the cases of GeSe3 and GeSe4. In (A) the vertical bars represent the statistical uncertainty on the measured data points. The FPMD results are from (i) Micoulaut et al. (2013) with N = 120 [solid (red) curves], (ii) Bouzid and Massobrio (2012) and Wezka et al. (2014) for GeSe2 with N = 120 [solid (green) curves], and (iii) Bouzid et al. (2015) for GeSe4 with either N = 120 [solid (green) curves] or N = 480 [broken (blue) curves]. The data sets for GeSe3 and GeSe4 are offset vertically for clarity of presentation.
Each model gives a good account of the measured Ge-Se and Se-Se correlation functions, but agreement with the measured Ge-Ge correlation functions is less impressive. In general, it is precisely the Ge-Ge correlations that show the greatest sensitivity to the details of the modeling procedure (Salmon and Zeidler, 2015), e.g., to the exchange and correlation energy functional used in the simulations (Massobrio et al., 1999, 2000, 2010; Micoulaut et al., 2009, 2013), to the effect on the structure of any residual pressure (Bouzid and Massobrio, 2012), and to the effect on the structure of both the system size and quench protocol that is employed, especially for small Ge content glasses (Bouzid et al., 2015; Le Roux et al., 2016).
In the case of GeSe2, the models reproduce all of the measured features in gGeGe(r), although the CS tetrahedral peak at 3.66 Å is shifted toward a larger-r value as compared to experiment. In the case of GeSe3, the model gives homonuclear Ge-Ge bonds in addition to ES and CS tetrahedral motifs, but homonuclear bonds were not found in the NDIS results, and the height of the CS peak in the simulated gGeGe(r) function is smaller than the measured value. In the case of GeSe4, homonuclear Ge-Ge bonds were found in one FPMD model but not in the others, connections that were not found by experiment. Each model features a clearly defined ES tetrahedral peak in gGeGe(r) at 3.0 Å that is absent in the measured function, although there is some overlap of the modeled ES peak with the low-r tail of the first peak in the measured gGeGe(r) function. The height of the CS peak in the simulated gGeGe(r) function is smaller than the measured value. These general findings from the NDIS experiments on GeSe3 and GeSe4 support those obtained from reverse Monte Carlo (RMC) models that were used to analyze the results obtained from anomalous X-ray scattering (AXS) experiments (Hosokawa et al., 2011).
The inclusion of dispersion or van der Waals (vdW) forces in FPMD simulations has recently been considered by Chaker et al. (2018) for the case of glassy GeSe4. Two different theoretical schemes were used for the description of these forces, one based on the work of Grimme (2006) (vdWG) and the other based on a Wannier function analysis (vdWW) (Silvestrelli, 2008). The results were compared to those obtained for the N = 480 atom FPMD model of Bouzid et al. (2015) in which dispersion forces were not included. The main effect of dispersion forces is to (i) increase the height of the CS tetrahedral peak in gGeGe(r) at 3.6 Å, making it comparable to the height found in the FPMD simulations of Micoulaut et al. (2013), and (ii) either leave constant or increase the height of the second peak in gSeSe(r) at 3.8 Å, depending on the theoretical scheme. The dispersion corrections lead to values that are in better accord with the “8-N” rule (Table 2).
5.3. Intermediate Phase
High-energy X-ray diffraction, neutron diffraction and EXAFS spectroscopy experiments have been performed to look for a structural signature of the intermediate phase in GexSe1−x glass (Shatnawi et al., 2008; Zeidler et al., 2017). The composition dependence of several parameters was investigated across the stiffness transition. These parameters included descriptors of the local structure such as (i) the first peak position and width in the total pair-distribution function, (ii) the mean coordination number , and (iii) the Debye-Waller factor describing the root-mean-square displacement (static or thermal) of atoms about their equilibrium positions. They also included descriptors of the non-local structure on length scales that are associated with the FSDP and principal peak in the measured total structure factors, where ordering associated with the principal peak can persist to a nanometer length scale (Salmon et al., 2005; Salmon, 2006). All of these parameters were found to evolve smoothly with the glass composition, i.e., a structural signature of the intermediate phase was not identified.
The present work provides benchmark results for guiding in the development of accurate models for the structures of glassy GeSe3 and GeSe4, which can be used to explore the network rigidity and other structure-related properties of the glass. The investigated glasses lie at the boundaries of the intermediate phase in the GexSe1−x system, which is reported for the composition range 0.20 ≤ x ≤ 0.26 (section 1). Often, models for the glass structure are provided by FPMD simulations, and the onset of a stressed-rigid phase has been attributed to a substantial change in the distribution of bond angles associated with Ge-centered tetrahedra, such that bond-angle constraints are broken for x > 0.25 (Micoulaut et al., 2013). However, as emphasized by the discussion of section 5.2, there is mismatch between the measured and FPMD results that is particularly noticeable in respect of the Ge-Ge correlation functions, which are sensitive to the connectivity of the Ge-centered structural motifs. In addition, different FPMD models can lead to different conclusions about the network structure. Thus, it will be interesting to see the predictions of FPMD models for intermediate phase glasses that are consistent with all of the measured partial pair-correlation functions.
6. Conclusions
Full sets of partial structure factors for glassy GeSe3 (x = 0.25) and GeSe4 (x = 0.20) were measured by using the NDIS method. These glass compositions lie at the boundaries of the intermediate phase in the GexSe1−x system. The results are consistent with chemically ordered network structures, in contrast to GeSe2 where the chemical ordering is broken by the formation of homonuclear Ge-Ge and Se-Se bonds (Petri et al., 2000; Salmon and Petri, 2003). For all of these compositions, the nearest-neighbor Ge and Se coordination numbers are given by = 4 and = 2 within the experimental error (Table 2), in accordance with the expectations of the “8-N" rule. In the case of GeSe4, larger values are deduced from 77Se MAS NMR experiments (Table 2), which suggests the need for a re-interpretation of the spectroscopy results. A distinct peak in gGeGe(r) at 3.03 Å that originates from ES tetrahedra was observed for both GeSe2 and GeSe3, but was not found for GeSe4. This finding appears to contradict the results obtained from both 77Se MAS NMR (Gjersing et al., 2010b) and Raman spectroscopy (Sugai, 1987; Wang et al., 1998; Lucas et al., 2009; Gjersing et al., 2010b; Bhosle et al., 2012) experiments, although the low-r tail on the first peak in the measured gGeGe(r) function does have a contribution in the distance range associated with ES tetrahedra. The appearance of an FSDP in SCC(k) indicates a non-uniform distribution of Ge-centered tetrahedra on an intermediate length scale, in contradiction to the chain-crossing model (Tronc et al., 1973; Bureau et al., 2003).
The new experimental work provides benchmark results for aiding in the development of realistic structural models for establishing the network rigidity and other structure-related properties of the glass. A comparison of the NDIS results for GeSe3 and GeSe4 with those from recent FPMD simulations shows mismatch that is particularly marked in respect of the Ge-Ge correlation functions, i.e., there is an ingredient missing from the FPMD simulations that may be related to the system size.
Data Availability
The data sets created during this research are openly available from the University of Bath Research Data Archive at https://doi.org/10.15125/BATH-00664 (Salmon and Zeidler, 2019). Raw neutron diffraction data sets for GeSe3 and GeSe4 are available at https://doi.ill.fr/10.5291/ILL-DATA.6-05-922 (Salmon et al., 2013).
Author Contributions
PSS and AZ designed the research. AZ prepared the samples. All authors contributed to the neutron diffraction experiments. RFR and AZ analyzed the data. PSS wrote the paper.
Funding
The Bath group received support from the EPSRC via Grant No. EP/J009741/1 and from the University of Bath for a PhD studentship (RFR). AZ and PSS are grateful to Corning Inc. for the award of Gordon S. Fulcher Distinguished Scholarships, during which this work was completed. AZ is supported by a Royal Society − EPSRC Dorothy Hodgkin Research Fellowship.
Conflict of Interest Statement
PSS and AZ were employed by Corning Inc. during the time this work was completed.
The remaining authors declare that the research was conducted in the absence of any commercial or financial relationships that could be construed as a potential conflict of interest.
Acknowledgments
We thank Annalisa Polidori (Bath) for help with the diffraction experiments, and Sabyasachi Sen (UC Davis) for pointing out (Kaseman et al., 2016).
References
Bauchy, M., Micoulaut, M., Celino, M., Le Roux, S., Boero, M., and Massobrio, C. (2011). Angular rigidity in tetrahedral network glasses with changing composition. Phys. Rev. B 84:054201. doi: 10.1103/PhysRevB.84.054201
Becke, A. D. (1988). Density-functional exchange-energy approximation with correct asymptotic behavior. Phys. Rev. A 38, 3098–3100. doi: 10.1103/PhysRevA.38.3098
Bertagnolli, H., Chieux, P., and Zeidler, M. D. (1976). A neutron-diffraction study of liquid acetonitrile I. CD3C14N. Mol. Phys. 32, 759–773. doi: 10.1080/00268977600102201
Bhatia, A. B., and Thornton, D. E. (1970). Structural aspects of the electrical resistivity of binary alloys. Phys. Rev. B 2, 3004–3012. doi: 10.1103/PhysRevB.2.3004
Bhosle, S., Gunasekera, K., Boolchand, P., and Micoulaut, M. (2012). Melt homogenization and self-organization in chalcogenides - part II. Int. J. Appl. Glass Sci. 3, 205–220. doi: 10.1111/j.2041-1294.2012.00092.x
Bhosle, S., Gunasekera, K., Chen, P., Boolchand, P., Micoulaut, M., and Massobrio, C. (2011). Meeting experimental challenges to physics of network glasses: assessing the role of sample homogeneity. Solid State Commun. 151, 1851–1855. doi: 10.1016/j.ssc.2011.10.016
Boolchand, P., Feng, X., and Bresser, W. J. (2001a). Rigidity transitions in binary Ge-Se glasses and the intermediate phase. J. Non-Cryst. Solids 293–295, 348–356. doi: 10.1016/S0022-3093(01)00867-5
Boolchand, P., Georgiev, D. G., and Goodman, B. (2001b). Discovery of the intermediate phase in chalcogenide glasses. J. Optoelectron. Adv. Mater. 3, 703–720.
Bouzid, A., Le Roux, S., Ori, G., Boero, M., and Massobrio, C. (2015). Origin of structural analogies and differences between the atomic structures of GeSe4 and GeS4 glasses: A first principles study. J. Chem. Phys. 143:034504. doi: 10.1063/1.4926830
Bouzid, A., and Massobrio, C. (2012). Note: accounting for pressure effects on the calculated equilibrium structure of glassy GeSe2. J. Chem. Phys. 137:046101. doi: 10.1063/1.4739953
Bresser, W., Boolchand, P., and Suranyi, P. (1986). Rigidity percolation and molecular clustering in network glasses. Phys. Rev. Lett. 56, 2493–2496. doi: 10.1103/PhysRevLett.56.2493
Bureau, B., Troles, J., Floch, M. L., Guénot, P., Smektala, F., and Lucas, J. (2003). Germanium selenide glass structures studied by 77Se solid state NMR and mass spectroscopy. J. Non-Cryst. Solids 319, 145–153. doi: 10.1016/S0022-3093(02)01911-7
Chaker, Z., Ori, G., Tugène, C., Le Roux, S., Boero, M., Massobrio, C., et al. (2018). The role of dispersion forces on the atomic structure of glassy chalcogenides: the case of GeSe4 and GeS4. J. Non-Cryst. Solids 499, 167–172. doi: 10.1016/j.jnoncrysol.2018.07.012
Dittmar, G., and Schäfer, H. (1976). Die kristallstruktur von Germaniumdiselenid. Acta Crystallogr. B 32, 2726–2728. doi: 10.1107/S0567740876008704
Eggleton, B. J., Luther-Davies, B., and Richardson, K. (2011). Chalcogenide photonics. Nat. Photon. 5, 141–148. doi: 10.1038/nphoton.2011.309
Faber, T. E., and Ziman, J. M. (1965). A theory of the electrical properties of liquid metals. III. The resistivity of binary alloys. Philos. Mag. 11, 153–173. doi: 10.1080/14786436508211931
Feng, X., Bresser, W. J., and Boolchand, P. (1997). Direct evidence for stiffness threshold in chalcogenide glasses. Phys. Rev. Lett. 78, 4422–4425. doi: 10.1103/PhysRevLett.78.4422
Fischer, H. E., Barnes, A. C., and Salmon, P. S. (2006). Neutron and x-ray diffraction studies of liquids and glasses. Rep. Prog. Phys. 69, 233–299. doi: 10.1088/0034-4885/69/1/R05
Fischer, H. E., Cuello, G. J., Palleau, P., Feltin, D., Barnes, A. C., Badyal, Y. S., et al. (2002). D4c: A very high precision diffractometer for disordered materials. Appl. Phys. A 74, S160–S162. doi: 10.1007/s003390101087
Gjersing, E. L., Sen, S., and Youngman, R. E. (2010a). Mechanistic understanding of the effect of rigidity percolation on structural relaxation in supercooled germanium selenide liquids. Phys. Rev. B 82:014203. doi: 10.1103/PhysRevB.82.014203
Gjersing, E. L., Sen, S., and Youngman, R. E. (2010b). Structure, connectivity, and configurational entropy of GexSe100−x glasses: Results from 77Se MAS NMR spectroscopy. J. Phys. Chem. C 114, 8601–8608. doi: 10.1021/jp1014143
Gopinath, J. T., Soljačić, M., Ippen, E. P., Fuflyigin, V. N., King, W. A., and Shurgalin, M. (2004). Third order nonlinearities in Ge-As-Se-based glasses for telecommunications applications. J. Appl. Phys. 96, 6931–6933. doi: 10.1063/1.1805182
Grimme, S. (2006). Semiempirical GGA-type density functional constructed with a long-range dispersion correction. J. Comput. Chem. 27, 1787–1799. doi: 10.1002/jcc.20495
Hilton, A. R. (1966). Nonoxide chalcogenide glasses as infrared optical materials. Appl. Opt. 5, 1877–1882. doi: 10.1364/AO.5.001877
Hosokawa, S., Oh, I., Sakurai, M., Pilgrim, W.-C., Boudet, N., Bérar, J.-F., et al. (2011). Anomalous x-ray scattering study of GexSe1−x glassy alloys across the stiffness transition composition. Phys. Rev. B 84:014201. doi: 10.1103/PhysRevB.84.014201
Inam, F., Tafen, D. N., Chen, G., and Drabold, D. A. (2009). Competing stoichiometric phases and the intermediate phase in GexSe1−x glasses. Phys. Stat. Solid B 246, 1849–1853. doi: 10.1002/pssb.200982016
Kaseman, D. C., Oliveira, K. M., Palazzo, T., and Sen, S. (2016). Selenium chain length distribution in GexSe100−x glasses: insights from 77Se NMR spectroscopy and quantum chemical calculations. J. Phys. Chem. B 120, 4513–4521. doi: 10.1021/acs.jpcb.6b02747
Kibalchenko, M., Yates, J. R., Massobrio, C., and Pasquarello, A. (2011). Structural composition of first-neighbor shells in GeSe2 and GeSe4 glasses from a first-principles analysis of NMR chemical shifts. J. Phys. Chem. C 115, 7755–7759. doi: 10.1021/jp201345e
Kohoutek, T., Wagner, T., Orava, J., Krbal, M., Ilavsky, J., Vlcek, M., et al. (2008). Multilayer planar structures prepared from chalcogenide thin films of As-Se and Ge-Se systems and polymer thin films using thermal evaporation and spin-coating techniques. J. Non-Cryst. Solids 354, 529–532. doi: 10.1016/j.jnoncrysol.2007.07.057
Le Roux, S., Bouzid, A., Kim, K. Y., Han, S., Zeidler, A., Salmon, P. S., et al. (2016). Structure of amorphous GeSe9 by neutron diffraction and first-principles molecular dynamics: impact of trajectory sampling and size effects. J. Chem. Phys. 145:084502. doi: 10.1063/1.4961265
Lee, C., Yang, W., and Parr, R. G. (1988). Development of the Colle-Salvetti correlation-energy formula into a functional of the electron density. Phys. Rev. B 37, 785–789. doi: 10.1103/PhysRevB.37.785
Lezal, D., Pedlikova, J., and Zavadil, J. (2004). Chalcogenide glasses for optical and photonics applications. J. Optoelectron. Adv. Mater. 6, 133–137.
Lorch, E. (1969). Neutron diffraction by germania, silica and radiation-damaged silica glasses. J. Phys. C Solid State Phys. 2, 229–237. doi: 10.1088/0022-3719/2/2/305
Lucas, P., Coleman, G. J., Sen, S., Cui, S., Guimond, Y., Calvez, L., et al. (2019). Structural and chemical homogeneity of chalcogenide glass prepared by melt-rocking. J. Chem. Phys. 150:014505. doi: 10.1063/1.5054704
Lucas, P., King, E. A., Gulbiten, O., Yarger, J. L., Soignard, E., and Bureau, B. (2009). Bimodal phase percolation model for the structure of Ge-Se glasses and the existence of the intermediate phase. Phys. Rev. B 80:214114. doi: 10.1103/PhysRevB.80.214114
Ludwig, K. F. Jr., Warburton, W. K., Wilson, L., and Bienenstock, A. I. (1987). Liquid GeBr4. I. A test of the anomalous x-ray scattering method as applied to disordered materials. J. Chem. Phys. 87, 604–612. doi: 10.1063/1.453553
Madon, M., Gillet, P., Julien, C., and Price, G. D. (1991). A vibrational study of phase transitions among the GeO2 polymorphs. Phys. Chem. Miner. 18, 7–18. doi: 10.1007/BF00199038
Martin, R. A., Salmon, P. S., Fischer, H. E., and Cuello, G. J. (2003). Structure of dysprosium and holmium phosphate glasses by the method of isomorphic substitution in neutron diffraction. J. Phys. Condens. Matter 15, 8235–8252. doi: 10.1088/0953-8984/15/49/003
Massobrio, C., Celino, M., Salmon, P. S., Martin, R. A., Micoulaut, M., and Pasquarello, A. (2009). Atomic structure of the two intermediate phase glasses SiSe4 and GeSe4. Phys. Rev. B 79:174201. doi: 10.1103/PhysRevB.79.174201
Massobrio, C., Micoulaut, M., and Salmon, P. S. (2010). Impact of the exchange-correlation functional on the structure of glassy GeSe2. Solid State Sci. 12, 199–203. doi: 10.1016/j.solidstatesciences.2009.11.016
Massobrio, C., Pasquarello, A., and Car, R. (1999). Intermediate range order and bonding character in disordered network-forming systems. J. Am. Chem. Soc. 121, 2943–2944. doi: 10.1021/ja9808447
Massobrio, C., Pasquarello, A., and Car, R. (2000). Concentration fluctuations on intermediate range distances in liquid GeSe2: the critical role of ionicity. Comput. Mater. Sci. 17, 115–121. doi: 10.1016/S0927-0256(00)00007-0
Micoulaut, M., Cormier, L., and Henderson, G. S. (2006). The structure of amorphous, crystalline and liquid GeO2. J. Phys. Condens. Matter 18, R753–R784. doi: 10.1088/0953-8984/18/45/R01
Micoulaut, M., Kachmar, A., Bauchy, M., Le Roux, S., Massobrio, C., and Boero, M. (2013). Structure, topology, rings, and vibrational and electronic properties of GexSe1−x glasses across the rigidity transition: a numerical study. Phys. Rev. B 88:054203. doi: 10.1103/PhysRevB.88.054203
Micoulaut, M., Vuilleumier, R., and Massobrio, C. (2009). Improved modeling of liquid GeSe2: impact of the exchange-correlation functional. Phys. Rev. B 79:214205. doi: 10.1103/PhysRevB.79.214205
Penfold, I. T., and Salmon, P. S. (1991). Structure of covalently bonded glass-forming melts: a full partial-structure-factor analysis of liquid GeSe2. Phys. Rev. Lett. 67, 97–100. doi: 10.1103/PhysRevLett.67.97
Petri, I., Salmon, P. S., and Fischer, H. E. (1999a). Structure of the liquid semiconductor GeSe. J. Phys. Condens. Matter 11, 7051–7060. doi: 10.1088/0953-8984/11/37/302
Petri, I., Salmon, P. S., and Fischer, H. E. (2000). Defects in a disordered world: the structure of glassy GeSe2. Phys. Rev. Lett. 84, 2413–2416. doi: 10.1103/PhysRevLett.84.2413
Petri, I., Salmon, P. S., and Howells, W. S. (1999b). Change in the topology of the glass forming liquid GeSe2 with increasing temperature. J. Phys. Condens. Matter 11, 10219–10227. doi: 10.1088/0953-8984/11/50/314
Phillips, J. C. (1979). Topology of covalent non-crystalline solids I: short-range order in chalcogenide alloys. J. Non-Cryst. Solids 34, 153–181. doi: 10.1016/0022-3093(79)90033-4
Rowlands, R. F. (2015). The role of structural disorder in crystalline, glassy and liquid materials. (Ph.D. thesis), University of Bath, Bath, United Kingdom.
Salmon, P. S. (1992). The structure of molten and glassy 2:1 binary systems: an approach using the Bhatia-Thornton formalism. Proc. R. Soc. Lond. A 437, 591–606. doi: 10.1098/rspa.1992.0081
Salmon, P. S. (1994). Real space manifestation of the first sharp diffraction peak in the structure factor of liquid and glassy materials. Proc. R. Soc. Lond. A 445, 351–365. doi: 10.1098/rspa.1994.0065
Salmon, P. S. (2006). Decay of the pair correlations and small-angle scattering for binary liquids and glasses. J. Phys. Condens. Matter 18, 11443–11469. doi: 10.1088/0953-8984/18/50/004
Salmon, P. S. (2007a). Structure of liquids and glasses in the Ge-Se binary system. J. Non-Cryst. Solids 353, 2959–2974. doi: 10.1016/j.jnoncrysol.2007.05.152
Salmon, P. S. (2007b). The structure of tetrahedral network glass forming systems at intermediate and extended length scales. J. Phys. Condens. Matter 19:455208. doi: 10.1088/0953-8984/19/45/455208
Salmon, P. S., Fischer, H. E., Rowlands, R. F., and Zeidler, A. (2013). Structure of intermediate phase glasses. doi: 10.5291/ILL-DATA.6-05-922
Salmon, P. S., and Liu, J. (1994). The relation between the melt topology and glass-forming ability for liquid Ge-Se alloys. J. Phys. Condens. Matter 6, 1449–1460. doi: 10.1088/0953-8984/6/8/004
Salmon, P. S., Martin, R. A., Mason, P. E., and Cuello, G. J. (2005). Topological vs. chemical ordering in network glasses at intermediate and extended length scales. Nature 435, 75–78. doi: 10.1038/nature03475
Salmon, P. S., and Petri, I. (2003). Structure of glassy and liquid GeSe2. J. Phys. Condens. Matter 15, S1509–S1528. doi: 10.1088/0953-8984/15/16/301
Salmon, P. S., Xin, S., and Fischer, H. E. (1998). Structure of the glassy fast-ion conductor AgPS3 by neutron diffraction. Phys. Rev. B 58, 6115–6123. doi: 10.1103/PhysRevB.58.6115
Salmon, P. S., and Zeidler, A. (2013). Identifying and characterising the different structural length scales in liquids and glasses: an experimental approach. Phys. Chem. Chem. Phys. 15, 15286–15308. doi: 10.1039/c3cp51741a
Salmon, P. S., and Zeidler, A. (2015). “Chapter 1: The atomic-scale structure of network glass-forming materials,” in Molecular Dynamics Simulations of Disordered Materials, Springer Series in Materials Science 215, eds C. Massobrio, J. Du, M. Bernasconi, and P. S. Salmon (Cham: Springer), 1–31. doi: 10.1007/978-3-319-15675-0_1
Salmon, P. S., and Zeidler, A. (2019). Data sets for the Frontiers in Materials article entitled “Structure of Ge-Se glass and network rigidity: The deployment of neutron diffraction with isotope substitution”. doi: 10.15125/BATH-00664
Salmon, P. S., Zeidler, A., and Fischer, H. E. (2016). Optimizing the counting times for sample-in-container scattering experiments. J. Appl. Cryst. 49, 2249–2251. doi: 10.1107/S160057671601493X
Sartbaeva, A., Wells, S. A., Huerta, A., and Thorpe, M. F. (2007). Local structural variability and the intermediate phase window in network glasses. Phys. Rev. B 75:224204. doi: 10.1103/PhysRevB.75.224204
Savage, J. A., and Nielsen, S. (1965). Chalcogenide glasses transmitting in the infrared between 1 and 20 μ - a state of the art review. Infrared Phys. 5, 195–204. doi: 10.1016/0020-0891(65)90023-0
Sears, V. F. (1992). Neutron scattering lengths and cross sections. Neutron News 3, 26–37. doi: 10.1080/10448639208218770
Seddon, A. B., and Laine, M. J. (1997). Chalcogenide glasses for acousto-optic devices. II. As-Ge-Se systems. J. Non-Cryst. Solids 213–214, 168–173. doi: 10.1016/S0022-3093(96)00665-5
Shatnawi, M. T. M., Farrow, C. L., Chen, P., Boolchand, P., Sartbaeva, A., Thorpe, M. F., et al. (2008). Search for a structural response to the intermediate phase in GexSe1−x glasses. Phys. Rev. B 77:094134. doi: 10.1103/PhysRevB.77.094134
Silvestrelli, P. L. (2008). Van der Waals interactions in DFT made easy by Wannier functions. Phys. Rev. Lett. 100:053002. doi: 10.1103/PhysRevLett.100.053002
Sugai, S. (1987). Stochastic random network model in Ge and Si chalcogenide glasses. Phys. Rev. B 35, 1345–1361. doi: 10.1103/PhysRevB.35.1345
Thorpe, M. F. (1983). Continuous deformations in random networks. J. Non-Cryst. Solids 57, 355–370. doi: 10.1016/0022-3093(83)90424-6
Thorpe, M. F., Jacobs, D. J., Chubynsky, M. V., and Phillips, J. C. (2000). Self-organization in network glasses. J. Non-Cryst. Solids 266–269, 859–866. doi: 10.1016/S0022-3093(99)00856-X
Troles, J., Shiryaev, V., Churbanov, M., Houizot, P., Brilland, L., Desevedavy, F., et al. (2009). GeSe4 glass fibres with low optical losses in the mid-IR. Opt. Mater. 32, 212–215. doi: 10.1016/j.optmat.2009.07.024
Tronc, P., Bensoussan, M., Brenac, A., and Sebenne, C. (1973). Optical-absorption edge and Raman scattering in GexSe1−x glasses. Phys. Rev. B 8, 5947–5956. doi: 10.1103/PhysRevB.8.5947
Wang, Y., Matsuda, O., Inoue, K., Yamamuro, O., Matsuo, T., and Murase, K. (1998). A Raman scattering investigation of the structure of glassy and liquid GexSe1−x. J. Non-Cryst. Solids 232-234, 702–707. doi: 10.1016/S0022-3093(98)00553-5
Wezka, K., Bouzid, A., Pizzey, K. J., Salmon, P. S., Zeidler, A., Klotz, S., et al. (2014). Density-driven defect-mediated network collapse of GeSe2 glass. Phys. Rev. B 90:054206. doi: 10.1103/PhysRevB.90.054206
Whittaker, D. A. J., Giacomazzi, L., Adroja, D., Bennington, S. M., Pasquarello, A., and Salmon, P. S. (2018). Partial vibrational density of states for amorphous solids from inelastic neutron scattering. Phys. Rev. B 98:064205. doi: 10.1103/PhysRevB.98.064205
Wright, A. C. (1993). The comparison of molecular dynamics simulations with diffraction experiments. J. Non-Cryst. Solids 159, 264–268. doi: 10.1016/0022-3093(93)90232-M
Zakery, A., and Elliott, S. R. (2003). Optical properties and applications of chalcogenide glasses: a review. J. Non-Cryst. Solids 330, 1–12. doi: 10.1016/j.jnoncrysol.2003.08.064
Zakery, A., and Elliott, S. R. (2007). Optical Nonlinearities in Chalcogenide Glasses and Their Applications. Springer Series in Optical Sciences 135. Berlin: Springer. doi: 10.1007/978-3-540-71068-4
Zeidler, A., Salmon, P. S., Fischer, H. E., Neuefeind, J. C., Simonson, J. M., and Markland, T. E. (2012). Isotope effects in water as investigated by neutron diffraction and path integral molecular dynamics. J. Phys. Condens. Matter 24:284126. doi: 10.1088/0953-8984/24/28/284126
Zeidler, A., Salmon, P. S., Martin, R. A., Usuki, T., Mason, P. E., Cuello, G. J., et al. (2010). Structure of liquid and glassy ZnCl2. Phys. Rev. B 82:104208. doi: 10.1103/PhysRevB.82.104208
Zeidler, A., Salmon, P. S., Whittaker, D. A. J., Pizzey, K. J., and Hannon, A. C. (2017). Topological ordering and viscosity in the glass-forming Ge-Se system: the search for a structural or dynamical signature of the intermediate phase. Front. Mater. 4:32. doi: 10.3389/fmats.2017.00032
Keywords: chalcogenide glass, glass structure, neutron diffraction, rigidity percolation, intermediate phase
Citation: Rowlands RF, Zeidler A, Fischer HE and Salmon PS (2019) Structure of the Intermediate Phase Glasses GeSe3 and GeSe4: The Deployment of Neutron Diffraction With Isotope Substitution. Front. Mater. 6:133. doi: 10.3389/fmats.2019.00133
Received: 02 April 2019; Accepted: 20 May 2019;
Published: 13 June 2019.
Edited by:
Matthieu Micoulaut, Sorbonne Universités, FranceReviewed by:
Pál Jóvári, Wigner Research Centre for Physics, Hungarian Academy of Sciences, HungaryCristian Fernando Moukarzel, Centro de Investigacion y de Estudios Avanzados – Unidad Mérida, Mexico
Copyright © 2019 Rowlands, Zeidler, Fischer and Salmon. This is an open-access article distributed under the terms of the Creative Commons Attribution License (CC BY). The use, distribution or reproduction in other forums is permitted, provided the original author(s) and the copyright owner(s) are credited and that the original publication in this journal is cited, in accordance with accepted academic practice. No use, distribution or reproduction is permitted which does not comply with these terms.
*Correspondence: Philip S. Salmon, cC5zLnNhbG1vbkBiYXRoLmFjLnVr