 Lingqi Su
 Mathias Fraaß2
 Lothar Wondraczek
94% of researchers rate our articles as excellent or good
Learn more about the work of our research integrity team to safeguard the quality of each article we publish.
Find out more
ORIGINAL RESEARCH article
Front. Mater. , 07 May 2019
Sec. Ceramics and Glass
Volume 6 - 2019 | https://doi.org/10.3389/fmats.2019.00102
This article is part of the Research Topic Glasses for Energy Applications View all 9 articles
For decades, various technologies have been developed aiming to enhance the energy efficiency of buildings. As a recent example, fluidic windows have been reported which literally enable to wrap buildings into a liquid layer and to transform the building envelope into a thermally active system for energy harvesting, distribution and storage. Elaborating on this concept, we now consider the performance of insulation glass units (IGU) which implement glass-glass capillary panels for liquid circulation. Such devices contain a scalable heat pump that can reversely be operated in active cooling or heating modes. By bridging the insulation panel inside the window, also passive cooling functionality is achieved. Long-term computational performance analysis shows that adequate thermal comfort can be ensured with different window-to-floor size ratios, and for different internal heat gain, for example, caused by differences in room occupation. For a size ratio of 0.4, we demonstrate a competitive seasonal performance factor, i.e., ~6.5 for heating and ~10.9 for cooling. On-device photovoltaic power can cover more than four fifths or the annual electricity consumption of all auxiliary components. For the size ratio of 0.4 in a highly-occupied office room, the device specific primary energy consumption ensuring year-over thermal comfort is as low as ~2.9 kWh/(m2a).
Energy consumption and carbon emission in the building sector have been recognized globally as one of today's major challenges (IEA, 2013; United Nations, 2015). The building sector and human activities inside buildings are responsible for almost one third of the global final energy demand and, thus, a major fraction of the anthropogenic CO2 emissions (GEA, 2012). At the same time, up to three quarters of our lifetime are spent indoors (Klepeis et al., 2001). In Europe, heating and cooling in buildings accounted for nearly half of the final energy demand in 2015 (Fleiter et al., 2017). Due to population growth, a further increase in building-related energy demand of up to 50% by 2050 is predicted if not significant efforts are spent on new concepts and technologies for energy efficient buildings (IEA, 2013).
Thermo-active building systems (TABS) have been identified as a way to reduce the energy demand of buildings. Conventional TABS technology embeds fluid pipes into building components like walls, ceilings and floors, turning them into thermally active, organic components of the building envelope. Extensive investigations have been conducted on advanced TABS (Glück, 1982; Koschenz and Lehmann, 2000; Fraaß, 2001), typically aiming for new design and control concepts and improved thermal performance. Compared to the conventional all-air designs, TABS usually exhibit improved comfort levels, higher energy efficiency and reduced noise emission (Stetiu, 1999; Olesen, 2002).
Recently, we introduced fluidic windows for TABS (Heiz et al., 2016). In such devices, a transparent capillary panel fabricated by lamination of a structured glass sheet and a thin glass cover is used for liquid circulation as shown in Figure 1. At present, panel sizes of up to ~1.2 × 1.0 m have been reported for indoor (Heiz et al., 2018a) and outdoor application (Heiz et al., 2018b), as well as for implementing further functionality such as adaptive shading or solar-thermal harvesting (Heiz et al., 2017). As a key feature, these capillary panels achieve a thickness of <6 mm, which makes them compatible with standard window manufacture and enables their use as one or more panes within a multi-glazing insulation glass unit (IGU).
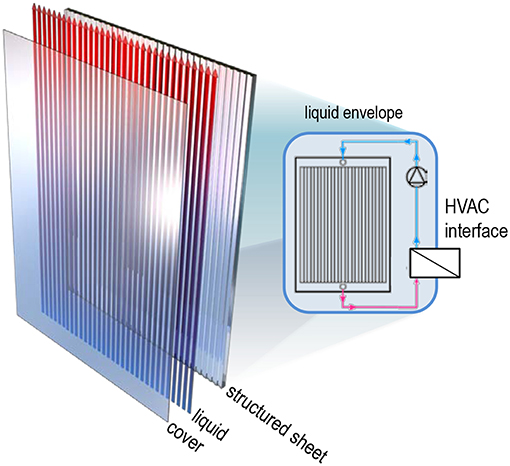
Figure 1. Design of a glass-glass capillary panel for fluidic windows such as reported by Heiz et al. (2016).
We now consider the use of such capillary glass panels in the broader context of a thermo-active building component, specifically for replacing regular, passive windows. By exchanging a regular glass sheet within triple glazed window, such panels can be used for room heating and cooling, Figure 2A, for air-to-glass heat exchanger for powering central heat pumps, Figure 2B, or for simultaneous indoor air-conditioning and outdoor heat exchange, Figure 2C. In all of these use cases, multiple individual windows can be combined through a primary hydraulic system (liquid envelope, Figure 1), and interface with the building's interior heating, ventilation, air conditioning (HVAC) and management system (secondary cycle).
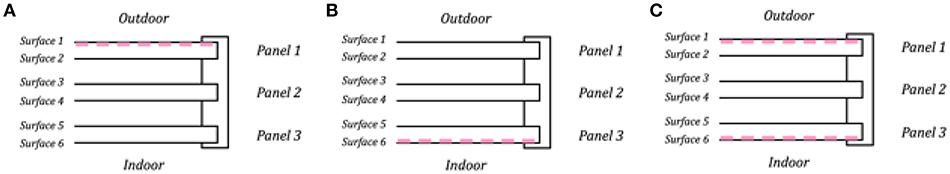
Figure 2. Use cases for placing one (A,B) or two (C) capillary panels as components of a regular triple-glazing IGU.
We now equip each window with a heat pump similar to that of a commodity refrigerator by using the capillary panels of the window as condenser and evaporator. Furthermore, electricity such as required by the auxiliary hydraulic pump is generated by a photovoltaic module, either remote or, as a concept, in semi-transparent form on the inside glass sheet (“panel 2” in Figure 2).
In the following, we will assume that the capillary structure has a neglectable impact on the optical indicators of the glass sheet so as to simplify the calculation. This assumption will be discussed in the following sections. Furthermore, the thickness of each capillary panel is 5.7 mm, resulting from the combination of capillary sheet, laminate interlayer and cover (Heiz et al., 2016). The further characteristics of the clear glass and the thermal insulation glass are taken from VDI (2012). For the optical properties of the semi-transparent photovoltaic glass, we use the measurements from Chae et al. (2014). The thermal conductivity of all glass panels is assumed to be 1 W/(m K). The space between two glass panels is 12 mm and filled with argon. Table 1 summarizes the physical indicators of the glass panels as used in the following.
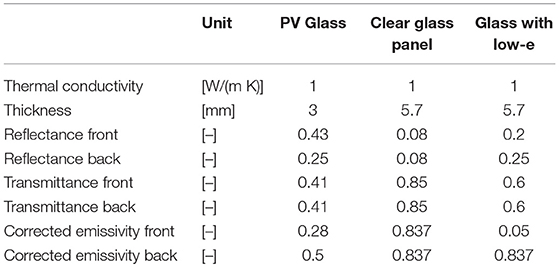
Table 1. Thermal conductivity, integrated reflectance, and transmittance over the solar range (wavelength 300–2,500 nm) of the PV glass (Chae et al., 2014), the clear and the low-e coated glass panel (VDI, 2012).
The present device is composed of three glass panels, illustrated in Figure 3. Panel 1 is a capillary glass panel placed to face outdoors. It is used as a heat exchanger for the heat pump cycle. Panel 3 is a capillary glass panel for indoor heating and cooling. Panel 2 is an insulation glass unit (IGU), optionally integrated with a semi-transparent photovoltaic (PV) module [for example, reaching efficiency figures in the range of 4–6% (Chae et al., 2014)]. Optionally, all surfaces can be coated with desired materials for performance enhancement, and/or the PV panel can be placed remotely. For example, surfaces 2 and 5 can be coated with a low-e thin film to reduce the radiative heat exchange between the glass panels.
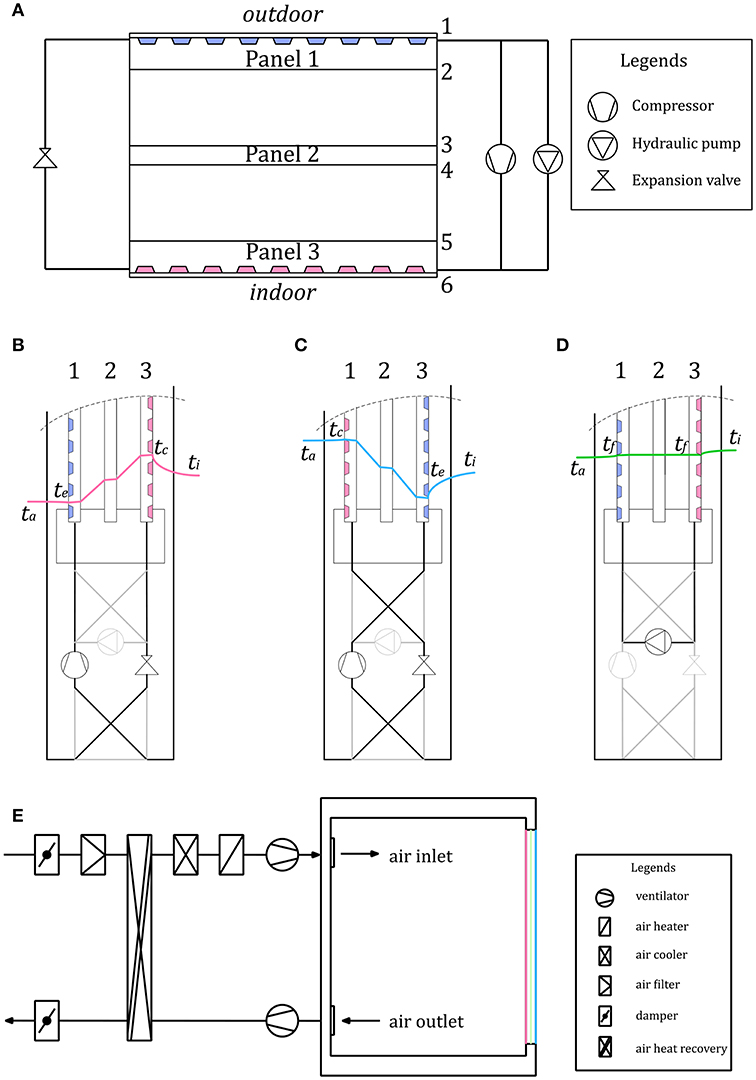
Figure 3. (A) Design concept for a window-integrated condenser-evaporator. (B–D) Seasonal modes of operation and corresponding temperature profiles. ta, ti, tc, te, and tf are the outdoor, indoor, condensing, evaporating and fluid temperature, respectively. (E) Interface of window-integrated condenser-evaporator with indoor ventilation system.
Figures 3B–D shows the different operation modes and the temperature profiles for this concept study. During winter season, the device operates in active heating mode. In this case, panel 1 becomes the evaporator and panel 3 becomes the condenser in the heat pump cycle. In summer, the device operates in active cooling mode. In this case, panel 1 becomes the condenser and panel 3 becomes the evaporator. During the trans-seasonal period, the device operates in passive cooling mode. Then, panel 1 and panel 3 are directly connected via the hydraulic pump. The short circuit between panel 1 and panel 3 over-bridges the thermal insulation within the device. This increases heat dissipation from the building's interior.
As a building component, the device is supposed to supplement the central ventilation system by covering part of heating or cooling loads. Figure 3E shows a room layout equipped with the present device and a typical ventilation system. In this set-up, the ventilation system has to cover only the air-exchange rate requirement. Thus, the ventilation system needs only a small heating and cooling equipment to avoid uncomfortable supply temperatures. Moreover, the whole system requires smaller air ducts and air handling units.
When using solar energy to power the auxiliary compressor and hydraulic pump, direct-current (DC) devices have to be chosen. Such DC fluid pumps and compressors are nowadays technically mature and widely available on the market.
As refrigerant in the heat pump cycle, we model with R1233zd (Mondéjar et al., 2015). This compound is presently seen as a replacement for classical refrigerants in HVAC technology, e.g., R245fa and R410a. Its global warming potential for a time horizon of 100 years (GWP100) is estimated to be only ~14 (Orkin et al., 2014), as compared to R245fa with GWP100 ~1030 (Yang and Yeh, 2016). Another advantage of R1233zd is its relatively low vapor pressure, which is around 215 kPa at 40°C (Honeywell, 2018). This is highly favorable for device operation at reduced internal pressure.
In order to calculate the direct solar transmittance of the IGU devices and the percentage of solar irradiation on the PV component, we follow the calculation procedures according to the international standard ISO 9050 (ISO, 2003) and the German standard VDI 6007 part 2 (VDI, 2012). In these, the backwards-radiation from the room's interior is neglected. Furthermore, we assume that the impact of the capillary fluid layer can be also neglected.
Both standards take multiple reflection into consideration. Instead of determining infinitely reflected fluxes, however, the total outgoing radiant energy flux from one surface to the other is calculated, as shown in Figure 4A. Thus, the effective reflectance of the device ρe, its effective transmittance τe and the absorptance of each glass panel τe,1, τe,2, τe,3 are determined. More details can be found in ISO (2003) and VDI (2012).
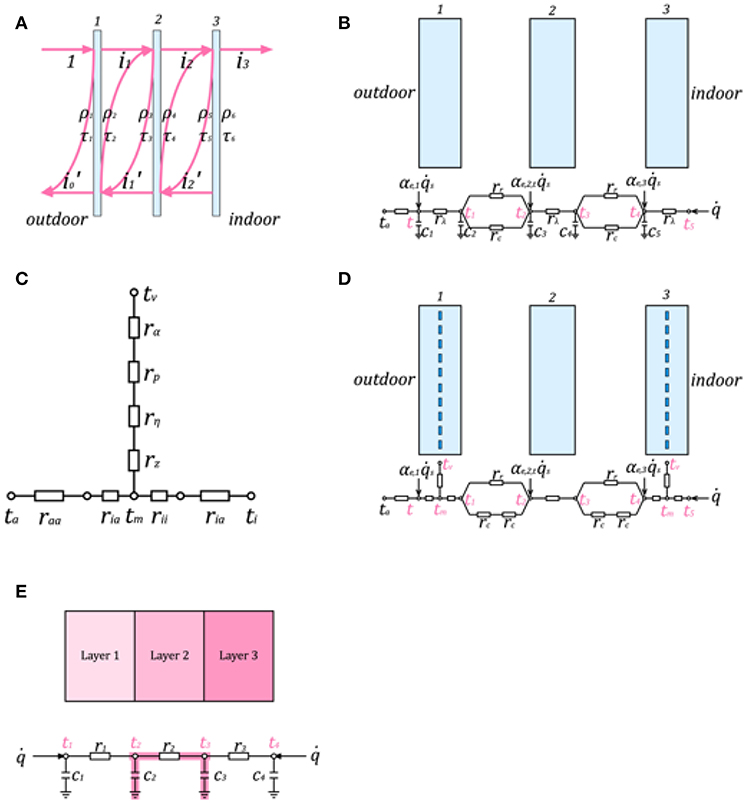
Figure 4. (A) Optical model of triple-glazing IGU according to ISO 9050 (ISO, 2003) and VDI 6007 part 2 (VDI, 2012). (B) Electrical analogy of the window thermal model (see text for details). (C) R-model for thermo-active building component. (D) R-network applied to a thermal window model according to design option C in Figure 2. (E) Beuken-Model for a 3-layer wall structure.
In order to adapt for the present design, small adjustments need to be made on the calculation procedure. For example, while for a regular glazing, the absorbed solar irradiation eventually turns into heat, when using a semi-transparent photovoltaic module on one of the glass panels, conversion is into heat and electrical energy. Thus, the effective thermal absorptance of panel 2 αe,2,t is
(αe,2 is the effective absorptance of panel 2 from the simplified optical model, η is the photovoltaic transfer efficiency and i is the percentage of solar irradiation which is absorbed by the photovoltaic module).
To simplify the modeling procedure for the heat pump, we only consider an ideal heat pump cycle with superheat. In the calculation, we assumed the superheat to be 5 K. The steady-state equations describing the heat pump's behavior are as follows (Baehr and Kabelac, 2006)
in which is the evaporating power, is the condensing power, W is the mechanical power input of the compressor, hi is the enthalpy of the point i, γ is the isentropic exponent, R is the ideal gas constant, pc is the condensing pressure, and pe is the evaporating pressure.
The electricity consumption of the condenser We is
in which ηc is the compressor efficiency. We assume the efficiency to be 0.5. For the thermodynamic properties of the refrigerant R1233zd, we use the manufacturer's data (Honeywell, 2018).
Figure 4B shows the equivalent resistance model of the thermal behavior. This model derives from the German standard VDI 6007 part 2 (VDI, 2012) and the European standard BS EN 673 (British Standard, 2011). It takes into account not only the thermal radiation between two glass surfaces, but also the convective heat transfer between the glass surfaces and the gas which is entrapped within the IGU cavity. The radiant heat exchange between two glass surfaces is in the form of doubly semi-infinite case. Then, the thermal resistance for the radiant heat exchange is
where εj is the emissivity of surface j, εj+1 is the emissivity of surface j+1, σ is the Stefan-Boltzmann-constant, Tj is the absolute temperature of surface j, Tj+1 is the absolute temperature of surface j+1.
For the convective heat transfer, we adopt the approximation of VDI (2012), and further present it in the form of an electrical resistance rc,
where g is the gravitational acceleration, ν is the kinematic viscosity, Pr, Ra and Nu is the Prandtl, Rayleigh and Nusselt numbers, s is the gas layer thickness, λ is the thermal conductivity of the gas.
To calculate the thermal response of the capillary glass, we select the equivalent R-model from Koschenz and Lehmann (2000) and Fraaß (2001). The equivalent electrical network is shown in Figure 4C. Figure 4D shows the thermal window model embedded with two thermo-active fluid layers.
We use the simplified method of Evans (1981) to estimate the photovoltaic electricity generation,
where η is the transfer efficiency, ηref is the reference efficiency, β is the linear temperature coefficient, tp is the actual photovoltaic module temperature, tp,ref is the reference photovoltaic module temperature, I is the solar irradiation intensity. We adopt 4.5% from Chae et al. (2014) for the reference efficiency. Moreover, we assume the linear temperature coefficient to be 0.004 K−1 and the reference temperature to be 25 °C, which are the typical values for crystalline silicon modules (Dubey et al., 2013).
Similar to the device model, we also use an electrical analogy to determine the thermal behavior of the walls, the floor and the ceiling. This RC-model is also known as the Beuken-Model (Beuken, 1936). It is based on the discretization of the one-dimensional heat equation with the method of lines. Each building component is divided into several layers. For each layer, an effective π-node electrical analogy is built, as shown in Figure 4E.
Table 2 shows the wall structures and their physical properties used here for the long-period calculations. They were adapted as typical wall layouts from VDI (2015).
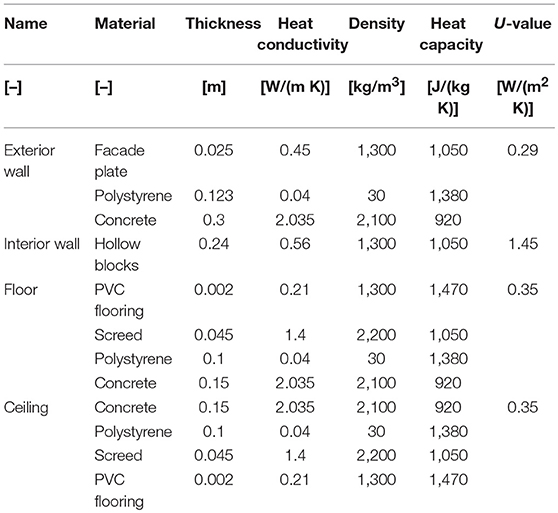
Table 2. Wall structures and physical properties of wall materials (VDI, 2015).
For the exterior surfaces, we employed the approximate solution from the international standard ISO 6946 (ISO, 2007). It separates the heat transfer into a convective and a radiative part. The heat transfer coefficient for convection αce and for radiation αre can be calculated as follows
where v is the wind speed, σ is the Stefan-Boltzmann-Constant and ta is the outdoor air temperature.
For the convective heat transfer coefficient of the interior surfaces, we also use the specification from the ISO 6946 (ISO, 2007),
We use the so-called gross method to calculate the radiative heat exchange within the room (Glück, 1982). Similar to our optical model, this method also calculates the total outgoing radiative heat energy flux instead of the infinitive reflection. However, view factors are necessary in the gross method. Thus, we adopted the analytical solution for view factors from Glück (1982). For the calculation, we assumed the emissivity of every wall surface in the room to be on the order of 0.9.
The electricity consumption of the hydraulic pump is estimated as
in which Δp is the pressure drop in the device, is the flow rate, η is the efficiency. We assume the efficiency of the pump to be 0.5. We found that the fluid flow in the device remains laminar even at high flow rate. It's assumed that the pressure drop in the each fluid distributor and collector is 5% of the pressure drop in the fluid channels. Therefore, the pressure drop in the device can be calculated as follows
in which Re is the Reynolds-number, l is the glazing length, d is the hydraulic diameter, ρ is the density of the refrigerant, w is the refrigerant velocity, φ is the correction coefficient for the rectangular channel. The capillary fluid channel is 3 mm wide and 1 mm thick, as specified in Heiz et al. (2016). For the capillary channel, the correction coefficient φ is 1.07 (Bohl and Elmendorf, 2005).
For the evaluation of the long-term system performance, we modeled a test office room integrated with the proposed devices and windows. The visualization of the office room is shown in Figure 5A. The test room is assumed to be located in Berlin and has one wall facing the building's exterior. For the window, we select the sub-design (3) in which surfaces “2” and “5” are low-e coated. The geometry and the wall structures of the test room are identical with the test room type S from the German standard VDI 6007 part 1, representing a room with high heat capacity (VDI, 2015). Compared to the standard, the thicknesses of all material layers were slightly adjusted so as to meet the recent U-value requirements in the German Energy Saving Ordinance (EnEV, 2015). The detailed wall structures and the thickness of each layer are listed in Table 2. We used the 2017 test reference year data for the location 52.5158° N 13.3787° O (Berlin Mitte, Germany) from the Deutscher Wetterdienst [German Meteorological Office (Deutscher Wetterdienst, 2017)].
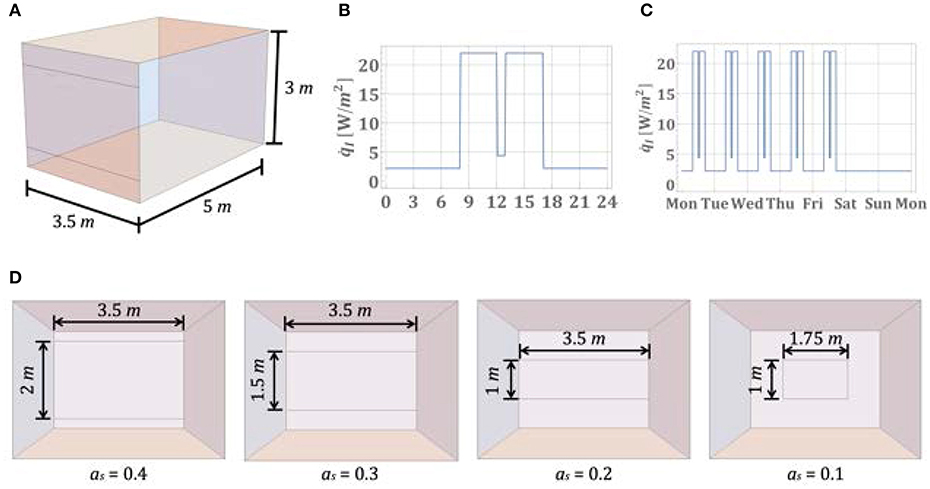
Figure 5. (A) Geometry of the test room with an area ratio of 0.4. (B,C) Time-dependent internal heat gain for simulating a highly-occupied office. (D) Different glazing geometries and size factors.
To investigate whether the device is capable to cover cooling loads in the summer even at high internal heat gains, and to cover heating loads in the winter even at low internal heat gains, two different values for the peak specific internal heat gain per floor area were used in this simulation study, i.e., 22 and 7 W/m2, respectively. These values are consistent with the specification for highly and lowly occupied offices in the German standard DIN V 18599 part 10 (DIN, 2011).
To simulate the situation in a real office, we assumed the internal heat gain to be time-dependent. The internal heat gain reaches the peak value from 8:00 to 12:00 and from 13:00 to 17:00 on working days. During the lunch break from 12:00 to 13:00 on working days, it reduces to 20% of the peak value. During non-working hours, it drops to 10% of the peak value. Figures 5B,C show the daily and the weekly internal heat gain profile of such a highly occupied office.
An important factor of system application in buildings is the ratio of the glazing area to the room floor area as. To cover the specific load per floor area of a room completely, the active device needs to provide a heating or cooling power . High values of as are recommended, because they result in higher efficiency due to lower temperature differences in the heat pump cycle, lower condensing temperature for heating, preventing discomfort during the winter, and higher evaporating temperature for cooling, avoiding discomfort as well as vapor condensation in summer. On the other hand, higher size ratio as will also increase the cooling load due to the higher solar heat gain. Therefore, it is important to evaluate the trade-off between window size and floor area. For this purpose, we chose different size ratios from 0.1 to 0.4, shown in Figure 5D.
For the control strategy, we select a sequence control in order to realize the different operation modes shown in Figures 3B–D. This means that for a certain criterion threshold, the next sequence will step-in, starting another operation mode between heating, active cooling and passive cooling. As such criteria, we use different threshold values for the room air temperature, shown in Figure 6. During the active heating period, the controlled variable is the room air temperature. We implement a simple proportional control to change the mass flow rate of the refrigerant, in order to control the room temperature remaining at the set-point of 21°C. For passive cooling, we change the volume flow rate of the refrigerant to control the room temperature remaining at the set-point of 22°C. During the active cooling period, the evaporating temperature cannot be lower than the dew point, otherwise condensation will occur on the device surface. Therefore, we change the refrigerant mass flow rate to keep the evaporating temperature fixed at 16°C. Additionally, if the device is in passive cooling mode and the inlet temperature of glass III is already higher than the room air temperature, the device will be switched into the active cooling mode.
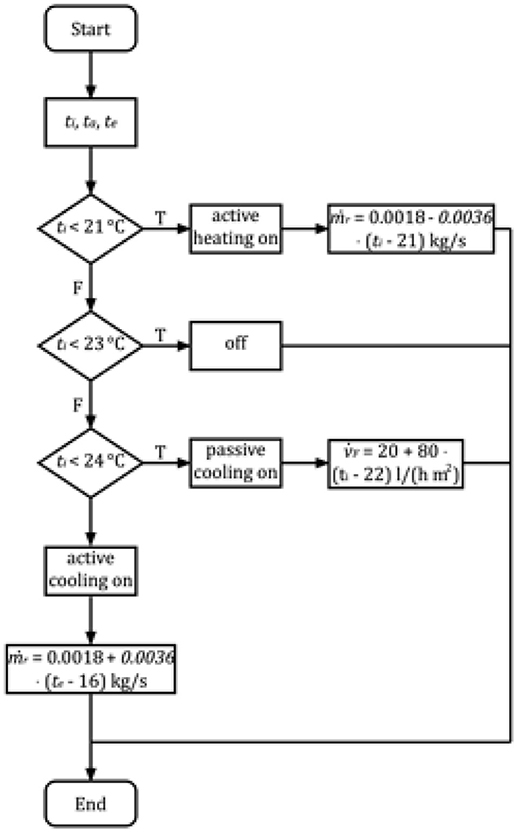
Figure 6. Flow diagram for the device control strategy in long-term performance analysis.
The test room is assumed to be equipped with a ventilation system to meet the requirements on the air exchange rate. The German standard DIN V 18599 part 10 recommends the specific minimum outdoor air flow per floor area for offices to be 4 m3/(h m2) (DIN, 2011). We use this value for the simulation study, which is consistent to an air exchange rate of 1.33 h−1 for the test room. Furthermore, as discussed in the previous section, in order to avoid discomfort, the outdoor air should be pre-cooled during summer and pre-heated during winter before being blown into the room. We assume that during the active heating period, the outdoor air is pre-heated to 16°C. During the active and passive cooling period, if the outdoor air temperature is higher than 26°C, it should be pre-cooled to 26°C. When the device is switched off, the outdoor air will not be precooled or preheated.
We initially estimated the impact of the refrigerant on the optical properties on the device using the transfer matrix method. We adopted the manufacturer's data for the refractive index for the glass panel from 365 nm to 1550 nm (SCHOTT North America Inc., 2014) and used it to fit the Sellmeier equation (Fox, 2010)
where λ is the wavelength in μm and B1, B2, C1, C2 are constants to be determined. From this, the refractive index can be interpolated for any wavelength. We also estimated the attenuation coefficient using the manufacturer's transmittance data for 5 mm glass panel. For the refrigerant, we took the estimated refractive index from ChemSpider (2010) and assumed that this value remains constant for wavelengths from 300 to 2,500 nm. Furthermore, we also assumed that the cover glass and the laminated glass are bonded with 0.1 mm EVA film, as specified in Sirtl and Kraus (2018). The refractive index of the EVA film can be found in Folienwerk Wolfen GmbH (2017). With the refractive indices, the reflectance and the transmittance of the two stacks can be determined, as shown in Figure 7A. Stack A represents the part of the glass panel without the refrigerant and Stack B represents the part of the glass panel with the refrigerant. The results are visualized in Figure 7B.
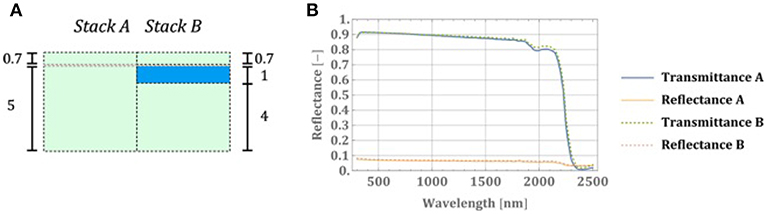
Figure 7. (A) Schematic for stacks A and B, representing the area without and with refrigerant channel. Transmittance and reflectance at normal incidence for stack A and B.
With the spectral reflectance curve, the integrated solar direct reflectance and transmittance can be calculated as follows (ISO, 2003)
where S(λ) is the relative spectral distribution of the solar radiation, R(λ) and T(λ) are the spectral reflectance and transmittance of the panel at normal incidence. For Stack A, the integrated solar direct reflectance and transmittance is 6.7% and 88.8%, respectively. For Stack B, the integrated solar direct reflectance and transmittance is 7.1 and 89.0%. The differences in reflectance and transmission are only 0.4 and 0.2%. It can be seen that the refrigerant does not have significant impact on the optical property of the panel.
We also computed the U-values Ug for three IGU sub-designs in accordance with option “C” of Figure 2. The difference between those three sub-designs is the position of one or more low-e coatings, i.e., no coating at all (1), a low-e coating on surface “2” (2), and two low-e layers, placed on surfaces “2” and “5” (3).
In addition to Ug, the steady-state calculation described in Section Computational methods and the physical indicators in Table 1 yield the performance indicators of total solar energy transmittance g (g-value), solar direct transmittance τ and percentage of solar irradiation i on the PV component. The results of the calculation are shown in Figure 8.
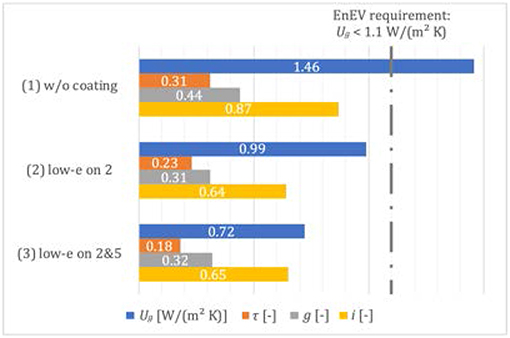
Figure 8. Steady-state calculation results of performance indicators for liquid-integrated triple IGU glazings.
The results of the U-value calculation in Figure 8 indicate that the U-value of the glazing is ~1.46 W/(m2 K) for a window without any coating (w/o coating). This value may not meet the requirements of recent energy saving legislations in residential and non-residential buildings. For example, effective from 2016, the EnEV (German Energy Saving Ordinance) requires the U-value for glazing to be lower than 1.1 W/(m2 K) (EnEV, 2015). This issue may be overcome temporally by using the present devices in the form of specialty windows or curtain wall components, or sustainably by implementing low-e coatings. E.g., already for the window with one low-e coating on surface “2”, Ug decreases to < 1 W/(m2 K). As a drawback, however, the coating also leads to lowers solar irradiance on the photovoltaic interlayer (i.e., reduced to ~64%), which may make the use of remote PV panels more attractive, despite of the additional need for cabling and further auxiliaries. Similar observations are made on option (3), whereby the Ug is further reduced to an attractive ~0.7 W/(m2 K). For the further performance indicators, there is only little difference among the three sub-designs.
Figure 9A shows the operative temperature over the whole year for different window sizes (expressed as the area ratio of window to floor). There is no significant difference in the operative temperatures for different size ratios during the summer and winter. The operative temperatures for the bigger size ratios are slightly higher during the trans-seasonal period, e.g., in April and in October. Figure 9B shows the evaluation of the thermal comfort according to the German and European standard DIN EN 15251 (DIN, 2012). Each point in this diagram represents the hourly average operative temperature and the hourly average ambient outdoor temperature. The red dotted lines mark the thermal comfort zone for different ambient temperature according to the German standard. As we can see, all of the 4 cases meet the requirements on thermal comfort throughout the year. The percentage of the uncomfortable hours in the whole year for all 4 different size rations are below 5%, which is the recommended limit (DIN, 2012).
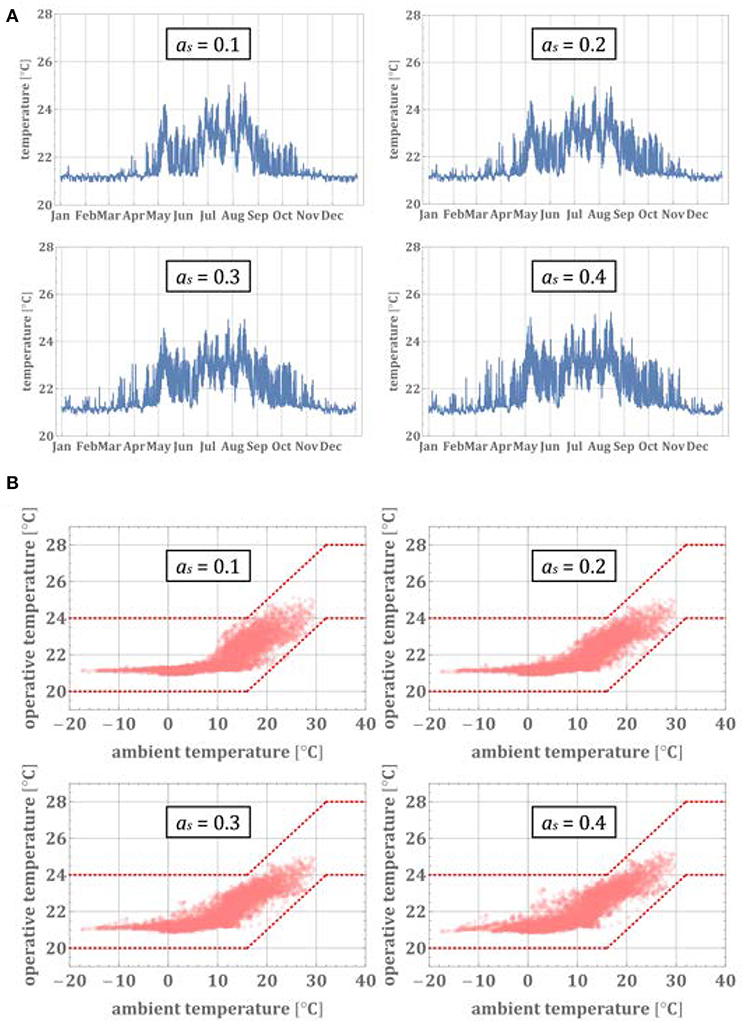
Figure 9. (A) Indoor temperature of a highly-occupied office room for different window-to-floor area ratios and implementing fluidic IGUs. (B) Thermal comfort evaluation according to DIN EN 15251 (DIN, 2012) for a highly-occupied office room and variable window-to-floor area ratios, implementing fluidic IGUs (see text for details).
Figure 10 shows the hourly difference between the photovoltaic electricity generation and the actual electricity consumption of the device for the room with a window-to-floor ratio of 0.4. Negative values mean that the PV power is not enough to cover the electricity consumption of the device. However, it is also interesting to see that the electricity generation from the photovoltaic is often more than actually consumed during the trans-seasonal period and summer. The excess part of the electricity generation can be eventually used for other purpose, such as domestic water heating or artificial lighting, and can be stored to buffer negative time periods.
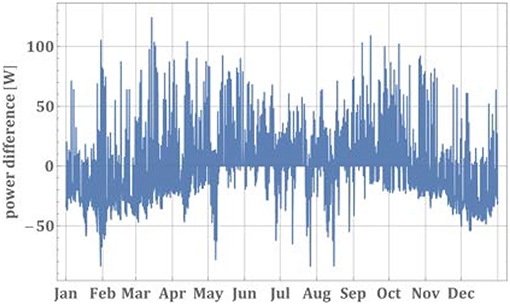
Figure 10. Power difference between on-device PV generation and device consumption.
Figure 11 shows the energy consumption and performance of the proposed device. The energy consumption is presented in kWh/(m2 a), which means how much energy in kWh is estimated to be consumed every year per window size or floor size. For the different window-to-floor size ratios, the final energy consumption for the operation mode active heating does not differ significantly, Figure 11A. The room with larger glazing consumes less than the ones with smaller glazing. However, the seasonal heating performance of the device is higher for larger size ratios. This is because the room with smaller size ratio needs higher condensing temperature during winter, leading to lower efficiency of the heat pump cycle, Figure 11B. On the other hand, as expected, the room with larger glazing size consumes more final energy for operation in active cooling mode. In the same way as for the heating period, the seasonal cooling performance factor of the room with larger size ratio is also higher.
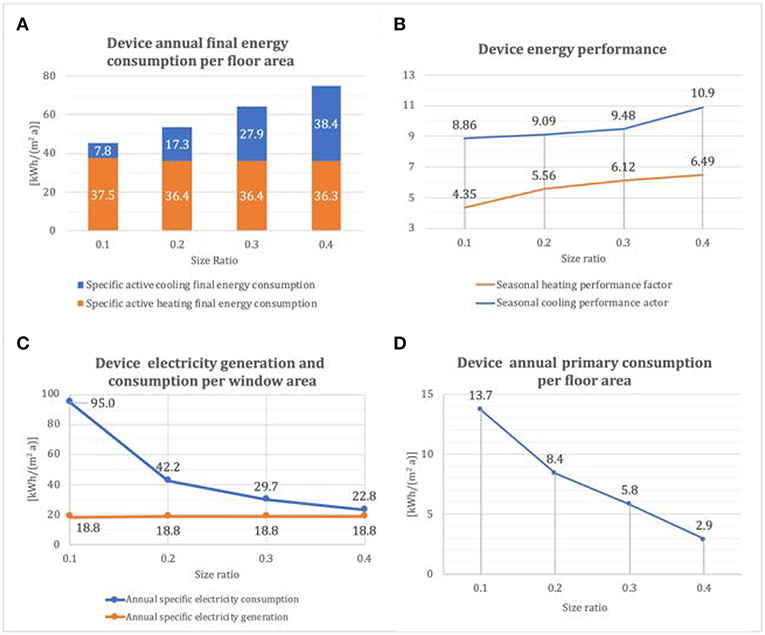
Figure 11. Final energy consumption (A), energy efficiency (B), electricity generation and consumption (C), and primary energy consumption (D) for a highly-occupied office room and variable window-to-floor area ratios, implementing fluidic IGUs (see text for details).
Figure 11C shows the annual energy balance. For different size ratios, the specific annual electricity generation per window area remains constant at 18.8 kWh/(m2a). Additionally, the specific annual electricity consumption reduces with a larger size ratio. The curve is not linear because of the difference in the energy efficiency and higher cooling energy consumption for larger size ratio. On the other side, it is interesting to see that the difference between the electricity generation and consumption reduces with a larger size ratio. For the size ratio of 0.4, the transparent photovoltaic can cover 82.5% of the electricity consumption.
Figure 11D shows an estimation for the specific primary energy consumption per floor area. The specific primary energy consumption qp is calculated as
in which qc,w is the specific final energy consumption per window area, qg is the electricity energy consumption per window area, as is the size ratio and fp is the primary energy factor. For Germany, the current primary energy factor for electricity is 1.8 (EnEV, 2015). The results show that the larger the size ratio becomes, the less primary energy is needed. For the size ratio of 0.4, the specific primary energy consumption lies at only 2.9 kWh/(m2a).
In Figure 12, we show the operative temperature for the lowly occupied office, again with different window-to-floor area ratios. Compared to the highly occupied office, the temperature during summer is lower. For greater size ratio, the temperature during the trans-seasonal period is also higher (April, October). The thermal comfort evaluation again shows that all cases meet the requirements of DIN (2011). The percentage of uncomfortable hours is always below 5%.
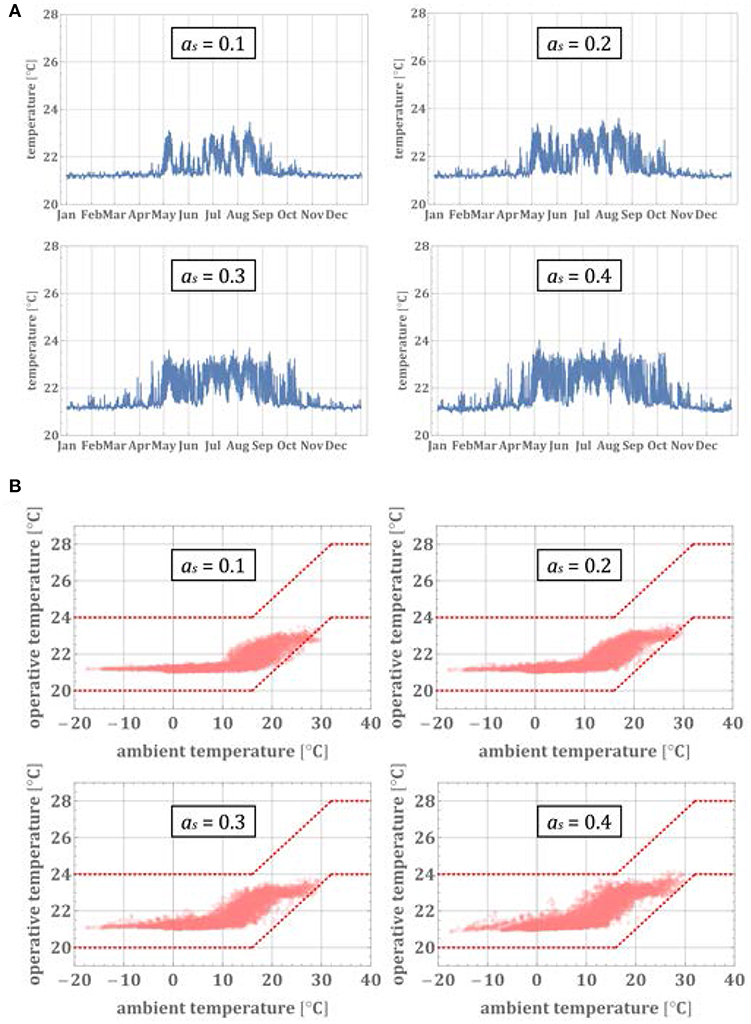
Figure 12. (A) Indoor temperature of a lowly-occupied office room for different window-to-floor area ratios and implementing fluidic IGUs. (B) Thermal comfort evaluation according to DIN EN 15251 (DIN, 2012) for a lowly-occupied office room and variable window-to-floor area ratios, implementing fluidic IGUs (see text for details).
Figure 13A shows the specific device annual final energy consumption per floor area for the lowly-occupied room. Compared to the high office occupation, the heating energy consumption is higher and the cooling energy consumption is lower because of the smaller internal heat gain. Furthermore, the higher the size ratio becomes, the less heating energy and the more cooling energy is consumed. The device energy performance is illustrated in Figure 13B. Similar to the highly occupied office, we can observe that the device performs more efficiently if the size ratio is higher. The diagram for the annual energy balance in Figure 13C shows that the PV supplement can cover up to 75.5% of the annual electricity consumption at a size ratio of 0.4. The specific primary energy consumption is higher than in the highly occupied office due to more heating energy consumption. However, the annual device primary energy consumption is still at a low level of 4.4 kWh/(m2a), as shown in Figure 13D.
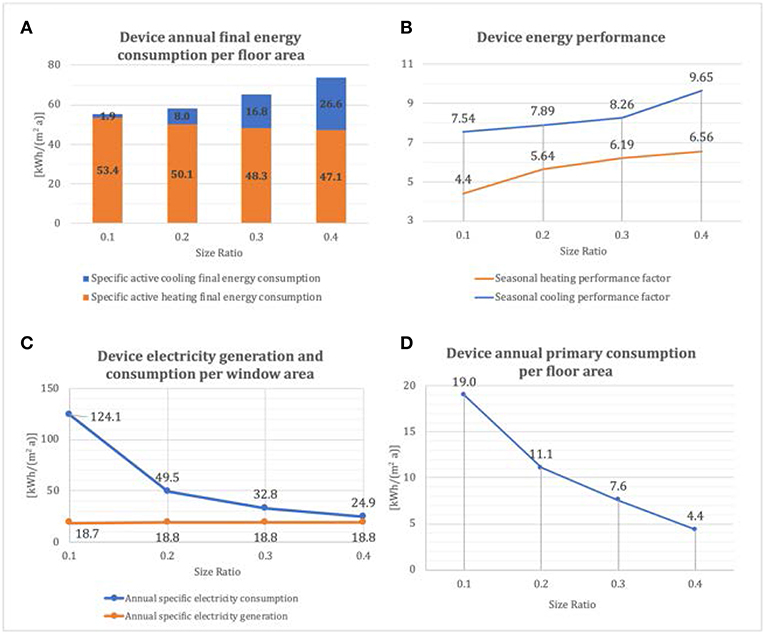
Figure 13. Final energy consumption (A), energy efficiency (B), electricity generation and consumption (C), and primary energy consumption (D) for a lowly-occupied office room and variable window-to-floor area ratios, implementing fluidic IGUs (see text for details).
As shown in the previous sections, the electricity generated by the photovoltaic layer is sufficient to cover a major amount of the energy required by the device. This leads to energy concepts including battery storages and DC/AC inverters, which are not in the focus within this paper.
As pointed out, a larger glazing size also increases the cooling load of the room. This can be addressed by further solar shading methods which reduce the solar heat gain. However, systems such as external jalousie will block the solar irradiation on the auxiliary PV device, thus requiring remote powering and additional device wiring. A promising and more elegant approach is to use electrochromic or photochromic materials instead, enabling adaptive changes in spectral transmittance, reflectance or absorptance.
In summary, we presented a triple-glazed IGU device with two integrated capillary glass panels and an optional transparent photovoltaic module. This device can be operated for active heating, active cooling and passive cooling. The steady-state calculation has shown U-values below 1.0 W/(m2 K) when low-e coatings are applied on the glass panes. Long-term computational performance analysis showed that all test cases meet standard requirements on thermal comfort. Furthermore, the seasonal performance factor for heating with the window-to-floor area ratio of 0.4 reaches ~6.5, and an excellent 10.9 for cooling. The larger the glazing size, the more of its intrinsic energy consumption can be covered by on-device PV, i.e., up to 82.5% of the annual electricity consumption of auxiliary pumps and condensers. To reduce the solar heat gain in summer, it is possible to introduce electrochromic or photochromic materials, eventually directly provided by functionalizing the circulation fluid (Heiz et al., 2017).
The datasets generated for this study are available on request to the corresponding author.
MK, MF, and LW conceived of the presented concept. MF and LS designed the computational framework and carried out the implementation. LS conducted the numerical simulation. LS, MF, and LW discussed the results and wrote the final manuscript. All authors contributed to manuscript revisions.
We gratefully acknowledge financial support from the European Commission through its Horizon-2020 framework program (Grant Agreement No. GA 637108).
The authors declare that the research was conducted in the absence of any commercial or financial relationships that could be construed as a potential conflict of interest.
We acknowledge fruitful discussion and collaboration with all members of the LaWin project consortium.
Beuken, C. L. (1936). Wärmeverluste Bei Periodisch Betriebenen Elektrischen Öfen: Eine Neue Methode Zur Vorausbestimmung Nicht-Stationärer Wärmeströmungen. Freiberg: Bergakad.
Bohl, W., and Elmendorf, W. (2005). Technische Strömungslehre, 13th Edn. Würzburg: Vogel Buchverlag.
British Standard (2011). BS EN 673: Glass in building - Determination of Thermal Transmittance (U value) - Calculation Method.
Chae, Y. T., Kim, J., Park, H., and Shin, B. (2014). Building energy performance evaluation of building integrated photovoltaic (BIPV) window with semi-transparent solar cells. Appl. Energy 129, 217–227. doi: 10.1016/j.apenergy.2014.04.106
ChemSpider (2010). 1-Chloro-3,3,3-trifluoropropene. ChemSpider. Available online at: http://www.chemspider.com/Chemical-Structure.10331370.html (accessed April 11, 2019).
Deutscher Wetterdienst (2017). Testreferenzjahre (TRY). Deutscher Wetterdienst DWD. Available online at: https://www.dwd.de/DE/leistungen/testreferenzjahre/testreferenzjahre.html (accessed December 10, 2018).
DIN (2011). DIN V 18599: Energetische Bewertung von Gebäuden - Berechnung des Nutz-, End- und Primärenergiebedarfs für Heizung, Kühlung, Lüftung, Trinkwarmwasser und Beleuchtung - Teil 10: Nutzungsrandbedingungen, Klimadaten.
DIN (2012). DIN EN 15251: Eingangsparameter für das Raumklima zur Auslegung und Bewertung der Energieeffizienz von Gebäuden - Raumluftqualität, Temperatur, Licht und Akustik.
Dubey, S., Sarvaiya, J. N., and Seshadri, B. (2013). Temperature dependent Photovoltaic (PV) efficiency and its effect on PV production in the world – a review. Energy Proc. 33, 311–321. doi: 10.1016/j.egypro.2013.05.072
EnEV (2015). Verordnung über Energiesparenden Wärmeschutz und Energiesparende Anlagentechnik bei Gebäuden (Energieeinsparverordnung - EnEV).
Evans, D. L. (1981). Simplified method for predicting photovoltaic array output. Solar Energy 27, 555–560.
Fleiter, T., Elsland, R., Rehfeldt, M., Steinbach, J., Reiter, U., Catenazzi, G., et al. (2017). Profile of Heating and Cooling Demand in 2015. Available online at: http://heatroadmap.eu/resources/3.1%20Profile%20of%20the%20heating%20and%20cooling%20demand%20in%20the%20base%20year%20in%20the%2014%20MSs%20in%20the%20EU28.pdf.
Folienwerk Wolfen GmbH (2017). Technical Data Sheet Evguard® – The EVA Laminating Film for Safety, Security and Decorative Glass. Available online at: https://www.folienwerk-wolfen.de/fileadmin/upload/downloads/Glass-lamination_films/2017-08_Technical-Data_evguard_EN.pdf (accessed April 12, 2019).
Fraaß, M. (2001). Ein Beitrag zur Theorie des Thermisch aktivierbaren bauteils. Dissertation TU Berlin. 1–148.
GEA (2012). Global Energy Assessment - Toward a Sustainable Future. Cambridge; New York, NY; Laxenburg: Cambridge University Press; International Institute for Applied Systems Analysis.
Heiz, B. P., Pan, Z., Lautenschläger, G., Sirtl, C., Kraus, M., and Wondraczek, L. (2016). Ultrathin fluidic laminates for large-area Façade integration and smart windows. Adv. Sci. 4, 1600362. doi: 10.1002/advs.201600362
Heiz, B. P. V., Pan, Z., Su, L., Le, S. T., and Wondraczek, L. (2017). A large-area smart window with tunable shading and solar-thermal harvesting ability based on remote switching of a magneto-active liquid. Adv. Sust. Syst. 2:1700140. doi: 10.1002/adsu.201700140
Heiz, B. P. V., Pan, Z., and Wondraczek, L. (2018b). Outdoor performance of fluidic glass-glass laminate windows for building integration. Energy Technol. 7:1800810. doi: 10.1002/ente.201800810
Heiz, B. P. V., Su, L., Pan, Z., and Wondraczek, L. (2018a). Fluid-integrated glass-glass laminate for sustainable hydronic cooling and indoor air conditioning. Adv. Sust. Syst. 56, 1800047. doi: 10.1002/adsu.201800047
Honeywell (2018). Solstice® zd (R-1233zd) Thermodynamic Properties Chart. 1–3. Available online at: https://www.honeywell-lgwp.com/?document=solstice-zd-thermodynamic-properties-chartanddownload=1 (accessed December 9, 2018).
IEA (2013). Transition to Sustainable Buildings: Strategies and Opportunities to 2050. Available online at: https://www.iea.org/publications/freepublications/publication/Building2013_free.pdf.
ISO (2003). ISO 9050: Glass in building – Determination of Light Transmittance, Solar Direct Transmittance, Total Solar Energy Transmittance, Ultraviolet Transmittance and Related Glazing Factors.
ISO (2007). ISO 6946: Building Components and Building Elements - Thermal Resistance and Thermal Transmittance - Calculation Method.
Klepeis, N. E., Nelson, W. C., Ott, W. R., Robinson, J. P., Tsang, A. M., Switzer, P., et al. (2001). The National Human Activity Pattern Survey (NHAPS): a resource for assessing exposure to environmental pollutants. J. Expos. Sci. Environ. Epidemiol. 11, 231–252. doi: 10.1038/sj.jea.7500165
Koschenz, M., and Lehmann, B. (2000). Thermoaktive Bauteilsysteme Tabs. Dübendorf: EMPA Energiesysteme/Haustechnik.
Mondéjar, M. E., McLinden, M. O., and Lemmon, E. W. (2015). Thermodynamic properties of trans-1-Chloro-3,3,3-trifluoropropene (R1233zd(E)): vapor pressure, (p, ρ, T) behavior, and speed of sound measurements, and equation of state. J. Chem. Eng. Data 60, 2477–2489. doi: 10.1021/acs.jced.5b00348
Olesen, B. W. (2002). Radiant floor heating in theory and practice. ASHRAE J. 44, 19–26. Availabe online at: https://pdfs.semanticscholar.org/c230/44aad20eec7e6f36fae1dc73340ff0710190.pdf
Orkin, V. L., Martynova, L. E., and Kurylo, M. J. (2014). Photochemical properties of trans-1-Chloro-3,3,3-trifluoropropene (trans-CHCl-CHCF 3): OH reaction rate constant, UV and IR absorption spectra, global warming potential, and ozone depletion potential. J. Phys. Chem. A 118, 5263–5271. doi: 10.1021/jp5018949
SCHOTT North America Inc. (2014). BOROFLOAT® 33 - Optical Properties. Available online at: https://refractiveindex.info/download/data/2014/BOROFLOAT%2033_Refractive%20Index.pdf (accessed April 9, 2019).
Sirtl, C., and Kraus, M. (2018). Bonding quality of joined glass components exposed to UV and fluidic influences. ce/papers 2, 399–408. doi: 10.1002/cepa.940
Stetiu, C. (1999). Energy and peak power savings potential of radiant cooling systems in US commercial buildings. Energy Build. 30, 127–138.
United Nations (2015). “Transforming our world: the 2030 agenda for sustainable development,” in Resolution Adopted by the General Assembly. Seventieth United Nations General Assembly (New York, NY). 25.
VDI (2012). VDI 6007 Blatt 2: Berechnung des Instationären Thermischen Verhaltens von Räumen und Gebäuden.
VDI (2015). VDI 6007 Blatt 1: Berechnung des Instationären Thermischen Verhaltens von Räumen und Gebäuden.
Keywords: smart window, building integrated photovoltaic, heat pump, HVAC, energy conservation
Citation: Su L, Fraaß M, Kloas M and Wondraczek L (2019) Performance Analysis of Multi-Purpose Fluidic Windows Based on Structured Glass-Glass Laminates in a Triple Glazing. Front. Mater. 6:102. doi: 10.3389/fmats.2019.00102
Received: 09 March 2019; Accepted: 18 April 2019;
Published: 07 May 2019.
Edited by:
Yong Gyu Choi, Korea Aerospace University, South KoreaReviewed by:
Guglielmo Macrelli, Independent Researcher, Este, ItalyCopyright © 2019 Su, Fraaß, Kloas and Wondraczek. This is an open-access article distributed under the terms of the Creative Commons Attribution License (CC BY). The use, distribution or reproduction in other forums is permitted, provided the original author(s) and the copyright owner(s) are credited and that the original publication in this journal is cited, in accordance with accepted academic practice. No use, distribution or reproduction is permitted which does not comply with these terms.
*Correspondence: Lothar Wondraczek, bG90aGFyLndvbmRyYWN6ZWtAdW5pLWplbmEuZGU=
Disclaimer: All claims expressed in this article are solely those of the authors and do not necessarily represent those of their affiliated organizations, or those of the publisher, the editors and the reviewers. Any product that may be evaluated in this article or claim that may be made by its manufacturer is not guaranteed or endorsed by the publisher.
Research integrity at Frontiers
Learn more about the work of our research integrity team to safeguard the quality of each article we publish.