 Katelyn A. Kirchner
 John C. Mauro
94% of researchers rate our articles as excellent or good
Learn more about the work of our research integrity team to safeguard the quality of each article we publish.
Find out more
ORIGINAL RESEARCH article
Front. Mater. , 14 February 2019
Sec. Ceramics and Glass
Volume 6 - 2019 | https://doi.org/10.3389/fmats.2019.00011
This article is part of the Research Topic Topology of Disordered Networks and their Applications View all 16 articles
Non-equilibrium systems continuously evolve toward states with a lower free energy. For glass-forming systems, the most stable structures satisfy the condition of isostaticity, where the number of rigid constraints is exactly equal to the number of atomic degrees of freedom. The rigidity of a system is based on the topology of the glass network, which is affected by atomistic structural rearrangements. In some systems with adaptable network topologies, a perfect isostatic condition can be achieved over a range of compositions, i.e., over a range of different structures, giving rise to the intermediate phase of optimized glass formation. Here we develop a statistical mechanical model to quantify the width of the intermediate phase, accounting for the rearrangement of the atomic structure to relax localized stresses and to achieve an ideal, isostatic state.
Within the field of topological constraint theory, there is growing interest in the ability of a glass network to adapt its topology to achieve isostaticity. A glass network is isostatic when the number of rigid constraints per atom, n, equals the number of translational degrees of freedom (Phillips, 1979). For a system in three-dimensional space, each atom has three degrees of freedom; hence, 〈n〉 = 3 is the condition for achieving an isostatic network (Thorpe, 1983). If 〈n〉 > 3 the system is overconstrained (stressed rigid), and if 〈n〉 < 3 the system is underconstrained (floppy) (Thorpe, 1983). In the overconstrained region, additional rigidity, beyond 〈n〉 = 3, creates localized stresses. Elimination of these stresses can be achieved through an imposition of crystalline order, which drives the network out of the glassy state (Thorpe, 1983).
When topological constraint theory of glass was originally proposed by Phillips and Thorpe, the isostatic state was predicted to be achieved at a single composition, viz., the rigidity percolation threshold (Phillips and Thorpe, 1985). However, in 1999, Raman scattering and temperature-modulated differential scanning calorimetry (MDSC) experiments by Punit Boolchand et al. revealed a finite width of isostatic compositions in which the system can maintain stability, called the intermediate phase (IP) (Selvanathan et al., 1999; Boolchand et al., 2001b; Micoulaut, 2007; Moukarzel, 2013). Thorough investigations, particularly in chalcogenide systems, have revealed a difference between the onset of rigidity and the onset of stress, creating a finite width of compositions that enable the most stable, isostatic state (Selvanathan et al., 1999; Boolchand et al., 2001b). One of the most pronounced signatures of the intermediate phase was detected using MDSC measurements (Feng et al., 1997), which measures the non-reversible enthalpy of relaxation, ΔH. The difference between the original Phillips-Thorpe single percolation threshold result and Boolchand's intermediate phase can be visualized in Figures 1A,B, respectively, where the blue circles indicate the lowest energy states of ΔH and hence the isostatic composition(s).
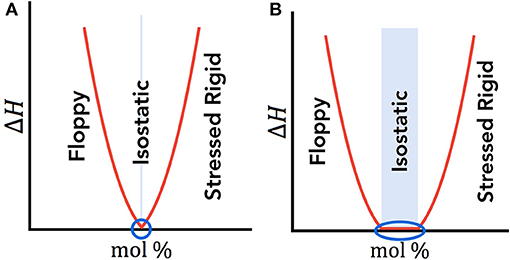
Figure 1. (A) Phillips-Thorpe theory based on a single isostatic point. (B) Boolchand intermediate phase where the isostatic region encompasses a finite width. In both (A) and (B), the isostatic region is shown as the blue shaded region, and the blue circle identifies the compositions with the lowest enthalpy, ΔH, therefore indicating the energetically preferred and isostatic composition(s).
Although a consensus within the glass community has still not been reached regarding the existence of the intermediate phase, over the past 18 years understanding of the phenomenon has greatly advanced. Evidence of the IP has been found through numerical studies (Thorpe et al., 2000), analysis of finite size clusters (Micoulaut and Phillips, 2003), and thorough analyses using MDSC (Selvanathan et al., 1999, 2000; Boolchand et al., 2001b; Vaills et al., 2005; Novita et al., 2007) and Raman scattering (Selvanathan et al., 1999, 2000; Boolchand et al., 2001a; Wang et al., 2001; Novita et al., 2007). These studies all reveal two distinct thresholds marking the boundaries of the intermediate phase: the rigidity transition (the lower bound, below which there are floppy modes in the network) and the stress transition (the upper bound, above which the network is stressed-rigid). Between the two thresholds, fluctuations in the system can enable self-organization, as visualized in Figure 2.
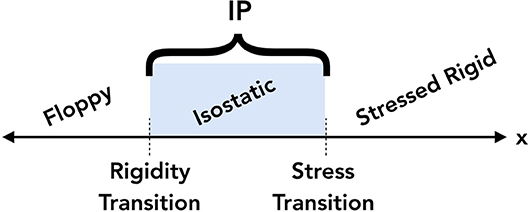
Figure 2. A visual representation of the two thresholds bounding the intermediate phase (IP) for varying compositions, x. The rigidity transition and stress transition separate the floppy, isostatic, and stressed rigid compositions, as shown.
A challenge when studying the intermediate phase is the apparent irreproducibility of some of the experiments, causing the physical origins and very existence of the phase to be controversial. Careful sample preparation is necessary in order to detect the IP due to the experiment's high sensitivity to impurities, inhomogeneities, and the thermal history of the glass (Bhosle et al., 2011, 2012). Some critics of the intermediate phase attribute the observed finite widths as possible experimental artifacts (Golovchak et al., 2008; Lucas et al., 2009; Shpotyuk and Golovchak, 2011). During MDSC experiments on Ge-Se glasses, the non-reversible enthalpy was shown to decrease in the IP domain, inferring a need for Ge-Se-Se isostatic structural fragments to account for the rigid but unstressed network (Micoulaut and Phillips, 2003; Massobrio et al., 2007; Sartbaeva et al., 2007). However, an extensive high-temperature nuclear magnetic resonance study revealed that these fragments were missing from the structure (Lucas et al., 2009). To account for this discrepancy, Lucas et al. disagreed with the existence of the intermediate phase and instead hypothesized that the previously observed phase could be an experimental artifact resulting from the use of a single modulation frequency in the MDSC experiments. However, subsequent modeling work showed that the frequency correction used in the analysis of the MDSC experiments provided non-reversing heat flows independent of the particular choice of modulation frequency (Guo et al., 2012).
Another claim against the existence of the intermediate phase is the observation of physical aging in the intermediate phase glasses (Golovchak et al., 2006, 2008, 2011; Shpotyuk et al., 2008; Elabbar and Adu-Sehly, 2011). The intermediate phase is reported to be characterized by high stability and a lack of physical aging. However, when differential scanning calorimetry was used to investigate the kinetics associated with the glass transition, results showed that all samples had evidence of physical aging behavior (Zhao et al., 2013). These inconsistencies in the physical understanding of glass adaptability and isostaticity sparked the glass community's growing interest in this field.
Further work is therefore required to elucidate the origin of the intermediate phase. Considering that a finite width of isostatic compositions is indeed possible, the second point of debate is the underlying mechanisms (structure, dynamics, interaction, etc.) enabling the two-threshold intermediate phase. Typically, studies emphasize the central role of fluctuations (Thorpe et al., 2000; Barré et al., 2005; Chubynsky et al., 2006; Micoulaut, 2006). More specifically, it is proposed that the fluctuations in the system enable the atoms to self-organize into a stress-free state while still maintaining a non-crystalline structure of the glass. These structural rearrangements relieve additional stresses, driving the system back toward a lower free energy state (Selvanathan et al., 1999; Boolchand et al., 2001b). The network mitigates the stresses by adapting its topology, thereby affecting the number of rigid constraints in the network.
Topological fluctuations in a glassy system are based on the distribution in rigid constraints, n(x,T,P) (Micoulaut, 2016). Given the non-linear behavior of coordination changes with pressure, pressure dependence is out of the scope in this simplified topological model, i.e., here we will only explore the dependence on composition and temperature. Additionally, this paper considers the network's ability to adapt its topology to eliminate stresses, without considering the kinetics of this adaptation process.
This paper explores both the statistical mechanical origin of the intermediate phase, as well as the role of topological fluctuations in governing its width. The proposed mechanism for the intermediate phase is based on the ability of the network to self-organize, i.e., to eliminate localized stress due to the adaptability of the network. This adaptability is made possible by the localized fluctuations in the glass network's structure and topology, with localized stresses as the driving force for these rearrangements. Modeling the distribution of topological fluctuations was made possible in prior work by linking statistical mechanics and topological constraint theory (Kirchner et al., 2018). Extending this previous work, the current investigation analyzes the degree of self-organization enabled through these structural and topological fluctuations to create a generalized approach for modeling the width of the intermediate phase of an arbitrary glass-forming system. The model is used to quantify the width of the intermediate phase, which can be defined either in units of constraints, n, or composition, x. In both representations, the width is analyzed as a function of composition and temperature. These results are then discussed in relation to localized topological fluctuations. Utilizing the general approach outlined in this paper, the structure of a glass-forming system could potentially be designed to achieve a desired intermediate phase width.
The width of the intermediate phase is dependent on the adaptability of the glass network, which is enabled by the distribution of rigidity fluctuations. Prior work by the authors established a general approach for calculating the distribution of the number of rigid constraints per atom by linking statistical mechanics and topological constraint theory (Kirchner et al., 2018). Through statistical mechanics, the probability of site occupation is given by Mauro (2013); Mauro and Smedskjaer (2014)
where Qm−1 is the path-dependent partition function calculated after occupation of modifier m−1 (which normalizes the distribution at each step), gi is the population size of network former sites of type i, and ai,m−1 is the number of type i sites previously occupied after modifier m−1. ΔHi is the enthalpy change associated with occupying site type i, k is Boltzmann's constant, and T is the absolute temperature. To account for thermal history effects in a glass, the temperature can be set equal to the fictive temperature of the system.
This statistical mechanical approach calculates the probability density of Ni(x), the mole fraction of network-forming species i in composition x, which serves as an input for the distribution of the number of atomistic constraints, given by Mauro et al. (2009); Mauro (2011)
In Equation (2) the outer summation is over the network-forming species i and the inner summation is over the various constraints α. wi,α is the number of constraints of type α associated with the species type i and qα(T) is the temperature-dependent rigidity of constraint α, given by
The rigidity for each constraint, α, is an independent function of the absolute temperature, T, where v is the vibrational attempt frequency, tobs is the observation time, and ΔFα* is the activation free energy for breaking the α constraint, given by
where Tα is the onset temperature for constraint α. The onset temperature, Tα, is defined as the temperature at which the probability of breaking the constraint is exactly 1/2 (Mauro, 2011). Linking Equations (1,2) results in the distribution of local constraints, which quantifies the topological fluctuations dictating the width of the intermediate phase (Kirchner et al., 2018).
The width of the intermediate phase is defined by two boundaries: the rigidity transition and the stress transition. The rigidity transition occurs when the average number of atomic constraints, 〈n〉, equals the number of degrees of freedom; this represents the transition from a flexible to an isostatic network. Since here we consider a three-dimensional network, the rigidity transition occurs when 〈n〉 = 3. Note that the number of rigid constraints per atom, n, is typically presented as a single mean value; however, this investigation explores the distributions of fluctuations, and hence, the full distribution of n. Therefore, in the context of this paper, 〈n〉 refers to the mean, while n refers to the distribution of the number of atomistic constraints.
Since the dimensionality of the system remains constant, the rigidity transition in a 3D network is defined by
The second threshold, the stress transition, occurs when the overconstrained system can no longer rearrange itself into a stress-free state. This boundary is defined by the low-rigidity tail of the distribution, which we quantity with the floppy mode probability, f, given by
where P(n) is the probability density function of the rigidity distribution n. The quantity f therefore gives the probability of the system having an atomic rigidity less than or equal to three.
It is important to note that not all systems will enable rearrangement, and to model the obtainable intermediate phase within a glass-forming system we need to incorporate a reasonable threshold for rearrangement. Using the definition of f in Equation (6), we can define a material property, fthres, which is the threshold probability for the system to be able to rearrange its structure and topology. In other words, we can define fthres as a minimum threshold for which the system can remain isostatic by relaxing the localized stresses in a stressed-rigid network through structural rearrangements. As long as f>fthres the structure can rearrange itself to eliminate the stresses, viz., by biasing the structure toward the stress-free isostatic configurations. The driving force for this network adaptability is the localized stress generated in the overconstrained, stressed-rigid configurations. Once f<fthres the isostatic configurations are no longer considered to be accessible, i.e., the stresses in the network are too high to fully relax. Therefore, f = fthres marks the stress transition, i.e., the second boundary of the intermediate phase, which can be given in terms of the corresponding constraint distribution, nstress, and is defined as
The difference between the two boundaries, given by Equations (5,7), dictates the maximum allowed width, w, of the intermediate phase. The width can be given either in units of the difference in number of constraints,
or more typically by the corresponding compositional width,
where wn > 0 and wx > 0. Figure 3 illustrates the thresholds and corresponding parameters that determine this maximum width of constraints or compositions enabling self-organization with a disordered network. Given that fthres can vary for different systems, here we consider the intermediate phase width as a function of this material property, fthres.
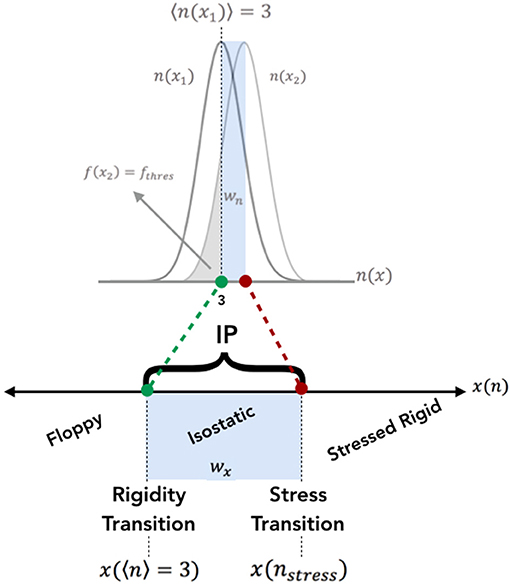
Figure 3. A visual representation of the thresholds that determine the width of the IP, both in terms of the atomic constraints, n(x), and the composition, x(n). Within his paper, the constraints are given as a distribution, hence incorporating the statistical fluctuations of constraints. The rigidity transition is determined by the composition in which the constraint distribution satisfies 〈n〉 = 3. The stress transition is determined by the composition corresponding to the constraint distribution of nstress.
The scope of the current investigation considers a simplified glass network with composition A1−xBx My, where A and B are the two network formers and M is the network modifier. Given that there are two types of network formers and one type of modifier, there are four possible structural motifs within the system, based on whether a network-forming site is either unoccupied (denoted as Aun and Bun) or occupied (Aoc and Boc) by a modifier. Following Equation (1), the probability of site occupation is based on the competition between entropic and enthalpic effects. The compositions of A, B, and M determine the entropic preferences, while the enthalpic preferences are determined by the relative energies associated which each state. In our model, we arbitrarily specify the B site to be enthalpically favored for modifier association, i.e., HA,oc> HB,oc.
The set of parameter values is provided in Table 1, including the number of constraints, wi,α, the onset temperatures, Tα (hence, dictating the rigidity, qα(T), of each constraint), the temperature, the concentration of network formers and network modifiers, and the value of vtobs, i.e., the complete set of variables necessary to solve Equations (1–4). The model's parameters were arbitrarily chosen to make 〈n〉 ≈ 3 near [A] = [B] ≈ 0.5. [B], [M], T were then altered to find the thresholds for the IP.
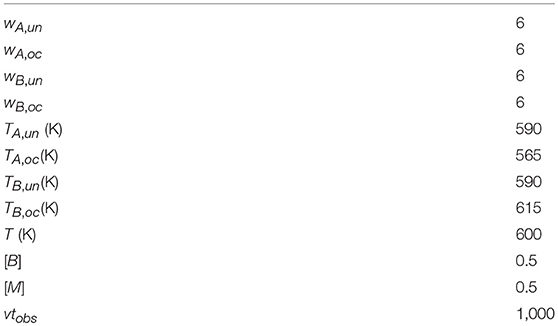
Table 1. The arbitrary model's starting conditions, prior to varying the concentration of network former, B, the network modifier, M, or the temperature, T.
As addressed in Equations (8,9), the width of the intermediate phase can be expressed either in units of constraints, n, or composition, x. In both representations, the constraints and compositions defining the intermediate phase width are based on the network's composition and temperature.
The concentration of network former B, the concentration of network modifier M, and the absolute temperature of the system, T, dictate the distribution of n, and therefore, the intermediate phase width in units of n. Figure 4 illustrates these variables altering the distribution of n, thereby influencing f and 〈n〉. Given wn> 0 and Equation (8), the IP width in units of n can only be applied to data from 〈n〉 ≥ 3. Figures 5A,B use Equation (8) to then plot the IP widths in units of n in terms of fthres or ln(fthres), respectively. Both figures show that changing [B], [M], or T result in similar widths for a given fthres.
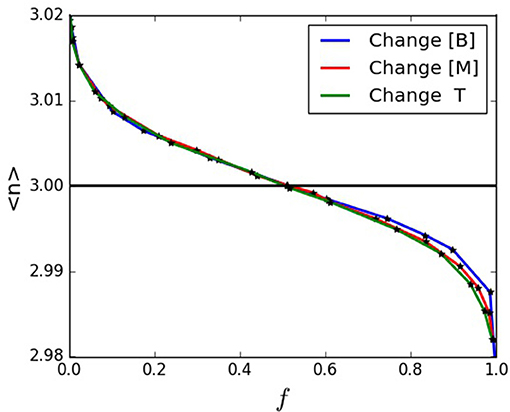
Figure 4. 〈n〉 vs. f when varying the concentration of network formers, B, modifiers, M, and temperature, T.
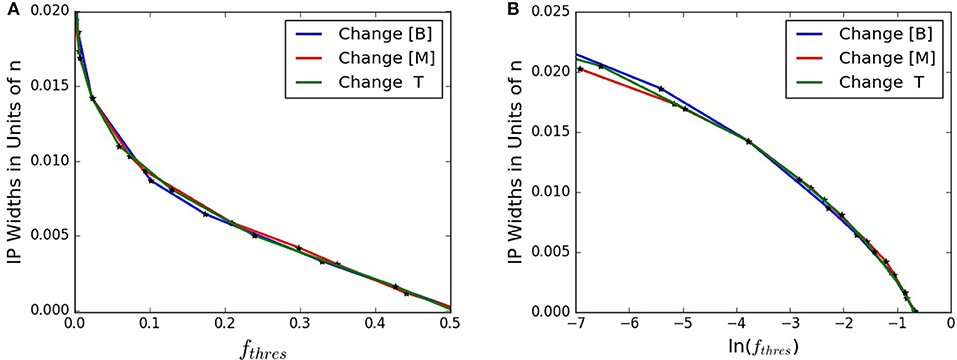
Figure 5. (A) The IP width, wn, given by Equation (8), based on fthres. (B) The IP width, wn, given by Equation (8), based on ln(fthres).
As shown with wn, altering composition dictates the width between the two IP thresholds. To measure wx, the intermediate phase width in terms of the glass composition A1−xBx My, we determine the composition x at each of the IP thresholds. As defined in Equation (9), the difference between these the composition at 〈n〉 = 3 and the composition at nstress determines the width wx. Given a sample's material property fthres, this approach enables us to quantify the threshold proposed in Figure 2, as shown in Figure 6 for an arbitrary fthres = 0.1. A more general representation of wx for each fthres is plotted in Figure 7. From these results, with a known rearrangement threshold for a given glass-forming system, we can approximate the width of the intermediate phase.
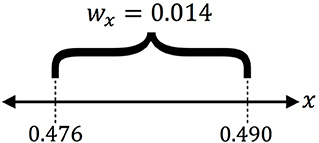
Figure 6. An example IP for fthres = 0.1 in terms of composition. This figure shows that the model can quantify the theoretical IP, as given in Figure 2.
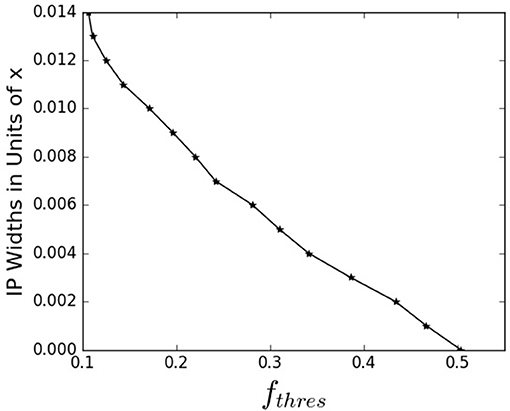
Figure 7. The width of the IP in terms of composition, x, based on fthres. Given an fthres, which is a material property, this graph allows us to determine the corresponding wx if the system enables adaptable network topologies.
The proposed mechanism for self-organization, and hence the intermediate phase, is topological fluctuations, which depend on the standard deviation of the distribution of constraints. Figure 8 plots the magnitude of fluctuations (quantified using the standard deviation of n, calculated over the ensemble of configurations resulting from the combined statistical mechanical/topological model) compared to the intermediate phase width for an arbitrary value of fthres = 0.1. Details of the procedure for calculating the standard deviation of n are provided in our previous work (Kirchner et al., 2018). The results in Figure 8 show a direct correlation between the maximum fluctuations and the maximum intermediate phase width, hence supporting the proposed mechanism of topological fluctuations enabling the adaptability of glass-forming systems. Increased fluctuations thereby enable a greater width for the intermediate phase.
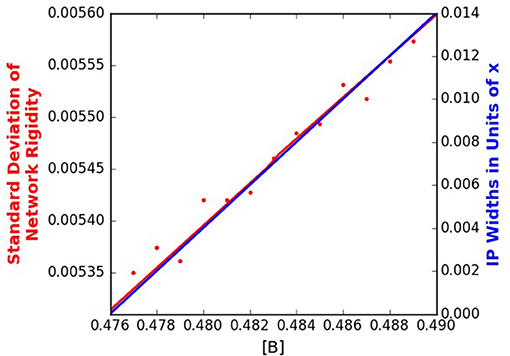
Figure 8. The standard deviation of the distribution of constraints, n, and the resulting intermediate phase width, wx, for fthres = 0.1.
While this research focuses on the topological origin of the intermediate phase, we have not addressed the important question of the kinetics of the topological changes that enable intermediate phase formation. Moreover, while we have considered the temperature dependence of the constraint rigidity, pressure effects have not yet been investigated. Both of these subjects will be suitable topics for future studies.
In this paper we have established a general approach for calculating the boundaries of the intermediate phase for an arbitrary glass-forming system. Our calculation is based on topological fluctuations in the network, which allow for the ability of the glass to relax localized stresses from a stressed-rigid condition. The width of the intermediate phase increases with the level of topological fluctuations, since these fluctuations allow for self-organization of the network, i.e., the ability of the glass to dynamically adapt its topology to alleviate localized stresses. The distribution of fluctuations, as dependent on composition and temperature, was modeled by linking statistical mechanics and topological constraint theory, which can then be used to quantify the width of the intermediate phase in an arbitrary glass-forming system. This theory could also be extended to incorporate the pressure dependence of the intermediate phase boundaries. Future work may also include an in-depth study of the kinetics of the topological reconfigurations enabling the adaptability of the network.
All authors listed have made a substantial, direct and intellectual contribution to the work, and approved it for publication.
We are grateful for funding from the U.S. National Science Foundation (CMMI 1762275).
The authors declare that the research was conducted in the absence of any commercial or financial relationships that could be construed as a potential conflict of interest.
We are grateful for valuable discussions with Dr. Seong H. Kim of Penn State.
Barré, J., Bishop, A. R., Lookman, T., and Saxena, A. (2005). Adaptability and “intermediate phase” in randomly connected networks. Phyis. Rev. Lett. 97:208701. doi: 10.1103/PhysRevLett.94.208701
Bhosle, S., Gunasekera, K., Boolchand, P., and Micoulaut, M. (2012). Melt homogenization and self-organization in chalcogenides-part 1. Int. J. Appl. Glass Sci. 3, 189–205. doi: 10.1111/j.2041-1294.2012.00093.x
Bhosle, S., Gunasekera, K., Chen, P., Boolchand, P., Micoulaut, M., and Massobrio, C. (2011). Meeting experimental challenges to physics of network glasses: assessing the role of sample homogeneity. Solid State Comm. 151, 1851–1855. doi: 10.1016/j.ssc.2011.10.016
Boolchand, P., Feng, X., and Bresser, W.J. (2001a). Rigidity transitions in binary Ge-Se glasses and the intermediate phase. J. Non Cryst. Solids 293–295, 348–356. doi: 10.1016/S0022-3093(01)00867-5
Boolchand, P., Georgiev, D.G., and Goodman, B. (2001b). Discovery of the intermediate phase in chalcogenide glasses. J. Optoelectro. Adv. Mat. 3, 703–720.
Chubynsky, M. V., Briève, M.-A., and Mousseau, N. (2006). Self-organization with equilibration: A model for the intermediate phase in rigidity percolation. Phys. Rev. E74:016116. doi: 10.1103/PhysRevE.74.016116
Elabbar, A. A., and Adu-Sehly, A. A. (2011). Structural relaxation and rigidity transition in aged and rejubenated AsxSe100−x glasses. Phys. B. 406, 4261–4265. doi: 10.1016/j.physb.2011.08.039
Feng, X., Bresser, W., and Boolchand, P. (1997). Direct evidence for stiffness threshold in chalcogenide glasses. Phys. Rev. Lett. 78, 4422–4425. doi: 10.1103/PhysRevLett.78.4422
Golovchak, R., Gorecki, C.z., Koxdras, A., and Shpotyuk, O. I. (2006). Physical ageing effects in vitreous arsenic selenides. Solid State Comm. 137(1–2), 67–69. doi: 10.1016/j.ssc.2005.10.009
Golovchak, R., Jain, H., Shpotyuk, O., Kozdras, A., Saiter, A., and Saiter, J-M. (2008). Experimental verification of the reversibility window concept in binary As-Se glasses subjected to a long-term physical aging. Phys. Rev. B. 78:014202. doi: 10.1103/PhysRevB.78.014202
Golovchak, R., Kozdras, A., Shpotyuk, O., Gorecki, C. Z., Kovalskiy, A., and Jain, H. (2011). Temperature-dependent structural relaxation in As40Se60 glass. Phys. Lett. A. 375, 3032–3036. doi: 10.1016/j.physleta.2011.06.056
Guo, X., Mauro, J. C., Allan, D. C., and Yue, Y. (2012). On the frequency correction in temperature-modulated differential scanning calorimetry of the glass transition. J. Non Crystal. Solids 358, 1710–1715. doi: 10.1016/j.jnoncrysol.2012.05.006
Kirchner, K. A., Kim, S. H., and Mauro, J. C. (2018). Statistical mechanics of topological fluctuations in glass-forming liquids. Phys. A. 510, 787–801. doi: 10.1016/j.physa.2018.07.028
Lucas, P., King, E. A., Gulbiten, O., Yarger, J. L., Soignard, E., and Bureau, B. (2009). Bimodal phase percolation model for the structure of Ge-Se glasses and the existence of the intermediate phase. Phyis. Rev. B. 80:214114. doi: 10.1103/PhysRevB.80.214114
Massobrio, C., Celino, M., Salmon, P. S., Martin, R. A., Micoulaut, M., and Pasquarello, A. (2007). Atomic structure of the two intermediate phase glasses SiSe4 and GeSe4. Physic. Rev. B. 79:174201. doi: 10.1103/PhysRevB.79.174201
Mauro, J. C. (2013). Statistics of modifier distributions in mixed network glasses. J. Chem. Phys. 138:12A522. doi: 10.1063/1.4773356
Mauro, J. C., Gupta, P. K., and Loucks, R. J. (2009). Composition dependence of glass transition temperature and fragility. II. a topological model of alkali borate liquids. J. Chem. Phys. 130:234503. doi: 10.1063/1.3152432
Mauro, J. C., and Smedskjaer, M. M. (2014). Statistical mechanics of glass. J. Non Crystal. Solids 396–397, 41–53. doi: 10.1016/j.jnoncrysol.2014.04.009
Micoulaut, M. (2006). Rigidity and intermediate phases in glasses driven by speciation. Phys. Rev. B. 74:184208. doi: 10.1103/PhysRevB.74.184208
Micoulaut, M. (2007). Simple clues and rules for self-organized rigidity in glasses. J. Optoelectr. Adv. Mat. 9, 3235–3240.
Micoulaut, M. (2016). Concepts and applications of rigidity in non-crystalline solids: a review on new developments and directions. Adv. Phys. X. 1, 147–175. doi: 10.1080/23746149.2016.1161498
Micoulaut, M., and Phillips, J. C. (2003). Rings and rigidity transitions in network glasses. Phys. Rev. B. 67:104204. doi: 10.1103/PhysRevB.67.104204
Moukarzel, C. F. (2013). Two rigidity-percolation transitions on binary Bethe networks and the intermediate phase in glass. Phys. Rev. E 88:062121. doi: 10.1103/PhysRevE.88.062121
Novita, D. I., Boolchand, P., Malki, M., and Micoulaut, M. (2007). Fast-Ion conduction and flexibility of glassy networks. Phys. Rev. Lett. 98:195501. doi: 10.1103/PhysRevLett.98.195501
Phillips, J. C. (1979). Topology of covalent non-crystalline solids I: short-range order in chalcogenide alloys. J. Non Crystal. Solids 34, 153–181. doi: 10.1016/0022-3093(79)90033-4
Phillips, J. C., and Thorpe, M. F. (1985). Constraint theory, vector percolation and glass formation. Solid State Comm. 53, 699–702. doi: 10.1016/0038-1098(85)90381-3
Sartbaeva, A., Wells, S. A., Huerta, A., and Thorpe, M. F. (2007). Local structural variability and the intermediate phase window in network glasses. Phys. Rev. B. 75:224204. doi: 10.1103/PhysRevB.75.224204
Selvanathan, D., Bresser, W. J., and Boolchand, P. (2000). Stiffness transitions in SixSe1−x glasses from Raman scattering and temperature-modulated differential scanning calorimetry. Phys. Rev. B. 61:15061. doi: 10.1103/PhysRevB.61.15061
Selvanathan, D., Bresser, W. J., Boolchand, P., and Goodman, B. (1999). Thermally reversing window and stiffness transitions in chalcogenide glasses. Solid State Comm. 111, 619–624. doi: 10.1016/S0038-1098(99)00248-3
Shpotyuk, O., and Golovchak, R. (2011). Pseudo-self-organized topological phases in glassy selenides for IR photonics. Phys. Status Solidi C 8:2572. doi: 10.1002/pssc.201084136
Shpotyuk, O., Hyla, M., Boyko, V., and Golovchak, R. (2008). Reversibility windows in selenide-based chalcogenide glasses. Phys. B. 403, 3830–3837. doi: 10.1016/j.physb.2008.07.024
Thorpe, M. F. (1983). Continuous deformations in random networks. J. Non Crystal. Solids 57, 355–370. doi: 10.1016/0022-3093(83)90424-6
Thorpe, M. F., Jacobs, D. J., Chubynsky, M. V., and Phillips, J. C. (2000). Self-organization in network glasses. Part II. Chalcogenide and organic semiconductors. J. Non Crystal. Solids 266–269, 859–866. doi: 10.1016/S0022-3093(99)00856-X
Vaills, Y., Qu, T., Micoulaut, M., Chaimbault, F., and Boolchand, P. (2005). Direct evidence of rigidity loss and self-organization in silicate glasses. J. Phys. Condensed Mat. 17, 4889–4896. doi: 10.1088/0953-8984/17/32/003
Wang, Y., Wells, J., Georgieve, D. G., and Boolchand, P (2001). Sharp rigid to floppy phase transition induced by dangling ends in a network glass. Phys. Rev. Lett. 87:185503. doi: 10.1103/PhysRevLett.87.185503
Keywords: glass, intermediate phase, topological constraint theory, statistical mechanics, modeling
Citation: Kirchner KA and Mauro JC (2019) Statistical Mechanical Model of the Self-Organized Intermediate Phase in Glass-Forming Systems With Adaptable Network Topologies. Front. Mater. 6:11. doi: 10.3389/fmats.2019.00011
Received: 27 November 2018; Accepted: 25 January 2019;
Published: 14 February 2019.
Edited by:
Matthieu Micoulaut, Sorbonne Universités, FranceReviewed by:
Stefan Karlsson, RISE Research Institutes of Sweden, SwedenCopyright © 2019 Kirchner and Mauro. This is an open-access article distributed under the terms of the Creative Commons Attribution License (CC BY). The use, distribution or reproduction in other forums is permitted, provided the original author(s) and the copyright owner(s) are credited and that the original publication in this journal is cited, in accordance with accepted academic practice. No use, distribution or reproduction is permitted which does not comply with these terms.
*Correspondence: John C. Mauro, amNtNDI2QHBzdS5lZHU=
Disclaimer: All claims expressed in this article are solely those of the authors and do not necessarily represent those of their affiliated organizations, or those of the publisher, the editors and the reviewers. Any product that may be evaluated in this article or claim that may be made by its manufacturer is not guaranteed or endorsed by the publisher.
Research integrity at Frontiers
Learn more about the work of our research integrity team to safeguard the quality of each article we publish.