 Matej Mičušík1*
 Christos Chatzimanolis2Jana Tabačiarová1Jozef Kollár1Apostolos Kyritsis2Polycarpos Pissis2
 Jürgen Pionteck3Karol Vegso4
 Peter Siffalovic4Eva Majkova4
 Mária Omastová1*
- 1Polymer Institute, Slovak Academy of Sciences, Bratislava, Slovakia
- 2Physics Department, National Technical University of Athens, Athens, Greece
- 3Department Functional Nanocomposites and Blends, Leibniz Institute of Polymer Research Dresden, Dresden, Germany
- 4Institute of Physics, Slovak Academy of Sciences, Bratislava, Slovakia
Polymeric composites of the linear triblock copolymer poly(styrene-co-ethylene/butylene-co-styrene) grafted with maleic anhydride units (SEBS-MA) or MA modified by hydrophilic polyethylene glycol (PEG) and containing various amounts of multiwall carbon nanotubes (MWCNTs) as conducting filler—were prepared by solvent casting. The MWCNT surface was modified by a non-covalent approach with a pyrene-based surfactant to achieve a homogeneous dispersion of the conducting filler within the polymeric matrix. The dispersion of the unmodified and surfactant-modified MWCNTs within the elastomeric SEBS-MA and SEBS-MA-PEG matrices was characterized by studying the morphology by TEM and SAXS. Dynamical mechanical analysis was used to evaluate the interaction between the MWCNTs and copolymer matrix. The electrical conductivity of the prepared composites was measured by dielectric relaxation spectroscopy, and the percolation threshold was calculated. The prepared elastomeric composites were characterized and studied as humidity sensor. Our results demonstrated that at MWCNTs concentration slightly above the percolation threshold could result in large signal changes. In our system, good results were obtained for MWCNT loading of 2 wt% and an ~0.1 mm thin composite film. The thickness of the tested elastomeric composites and the source current appear to be very important factors that influence the sensing performance.
Introduction
Polymer composite materials are cost-effective and consist of two or more components with significantly different physical or chemical properties, and when combined, the final material might possess superior characteristics when compared to the individual components. The new material may be more suitable for specific applications, may be stronger, lighter or less expensive compared to traditional materials.
Advantages of composite materials include the combination of the desired properties of each of the constituent elements in the new material. These properties remain unchanged or even improved; for example, the combination of a conductive filler and polymer results in a material with the electrical conductivity of the filler and the light weight, easy processing, and good mechanical properties of the polymer matrix.
Electrically conductive composites are very interesting materials that are capable of substantial elastic stretching and bending that is required for applications, such as smart clothing (Robert, 2003), flexible displays (Fihn, 2006), stretchable circuits (Lacour et al., 2004), strain gauges (Engel et al., 2006), implantable devices (Johnson et al., 2004), high-stroke microelectromechanical systems (Pelrine et al., 2000), and dielectric elastomer actuators. The composite materials are also suitable for gas-sensing as chemical sensors, vapor detectors, and “electronic noses” because their electrical resistance can provide a reversible change upon attack by solvent vapor. This type of composites has shown good liquid and vapor sensing properties.
In addition, sensors based on elastomers seem to be very interesting due to the benefits of good sensitivity and reproducibility, good processability, and reasonable costs (Dong et al., 2004; Wang et al., 2007). Since elastomeric matrices provide a wide range of different chemical and physical properties, there is an immense potential for adjusting the final properties of a sensor with respect to its selectivity and final application. Additionally, the production is simple and can be realized at lower final expenses compared to classical sensors based on semiconductors, solid electrolytes, semiconducting metal oxides, etc. Furthermore, elastomers such as the maleic anhydride-grafted triblock copolymer poly(styrene-co-ethylene/butylene-co-styrene) (SEBS-MA) exhibit good mechanical properties. The flexibility of the material is required not only for strain sensors (Georgousis et al., 2015) or color indicators (Yu et al., 2014) but also for chemisensors to increase their applicability in a wider range of conditions.
Elastomer-based composites have been used as actuators (Czaniková et al., 2013), sound adsorption materials (Ersoy et al., 2011), flame retardants (Jiang et al., 2013), and vapor (Tabačiarová et al., 2016) or temperature sensors (Matzeu et al., 2012). An advantage of SEBS-MA as a promising material for chemical sensors is the hydrophilic nature of the maleinized block, which contains functional groups that enable interactions with polar molecules of the otherwise hydrophobic polymer SEBS. While these elastomers are non-crosslinked, after extended exposure to organic solvent the material can dissolve, and this prevents its repeatable use as sensor. For the SEBS polymer, this problem can be solved by the amplification of the hydrophilic parts obtained by grafting hydrophilic polyethylene glycol (PEG) groups to gain amphiphilic materials (Camus et al., 2004). The amphiphilic nature means, it subsequently becomes swellable in polar solvents like water due to the hydrophilic PEG side chains but remains insoluble because of the hydrophobic SEBS main chain. Additionally, Dong et al. (2008) proved that the grafting of PEG to PMMA resulted in a lower resistance due to different filler dispersion status compared to composites prepared without PEG. Another observation proved that PEG can also influence the sensing rate by softening the polymeric matrix (Zhao et al., 2006). Moreover, PEG modification leads to a more hydrophilic material, which can subsequently be used as a water sensor (Yang et al., 2002).
Carbon nanotubes (CNTs) are one of the most interesting classes of nanostructured materials that possess unique mechanical, electrical, and thermal properties (Zhang et al., 2005; Pötschke et al., 2011). CNTs as one of the most studied nanofiller for polymers is really complicated to uniformly dispersed in composites at the nanoscale, because of the strong van der Waals interactions between individual nanotubes. Based on several studied strategies for good dispersion of fillers in polymer matrices, the main advantage of non-covalent modification by surfactants is the preservation of the conjugated system of the CNT sidewalls and the conservation of the sp2-conjugated structures. When the conducting filler is mixed with the polymeric matrix, only a slow increase in the conductivity of the composite can be observed at low filler contents until the filler loading reaches the percolation threshold (Lux, 1993; Bunde and Dietrich, 2000; Youngs, 2002). Here, within a narrow filler concentration range, a small increase in the filler loading causes a jump-like increase in the electrical conductivity. Especially composites with a filler concentration that is slightly above the percolation threshold can be used for sensing.
The main mechanism of vapor sensing is based on the swelling ability of the polymer matrices. If an analyte molecule successfully diffuses into the polymeric matrix of the composites, the local volumetric uptake will extend the conducting filler-filler adjacent distances, which decreases the tunneling current. As the swelling process proceeds the resistance of the polymer composite is increasing (Villmow et al., 2011). The solvent or vapor should have a high affinity for the polymeric matrix used. Villmow et al. (2012) have shown that a so-called “good” solvent should have similar solubility parameters as the polymer matrix. Using this criterion, they foresaw which organic compounds would exhibit a good resistivity response for particular polymer composites. Therefore, by selecting the proper polymer matrix, it is possible to optimize the selectivity of the chemisensor.
There are only few papers that discuss the use of SEBS conductive composites as sensors (Matzeu et al., 2012; Calisi et al., 2013). However, extensive work has been carried out to enhance the water sorption mechanism by sulfonation and the introduction of polar groups into the non-polar material (Butkewitsch and Scheinbeim, 2006; Li et al., 2018). In this case, the introduction of PEG and CNTs in a hydrophobic dielectric SEBS matrix results in a hydrophilic and highly conductive material, which may be suitable for relative humidity (R.H.) sensing applications.
In this work, composites of linear triblock copolymers modified by hydrophilic PEG segment filled with carbon nanotubes with varying filler concentrations were prepared. The electrical conductivity, morphology and sensing properties at various humidity levels were studied.
Experimental
Materials
As the polymeric matrix, maleic anhydride modified poly(styrene-co-ethylene/butylene-co-styrene) (SEBS-MA) supplied by Kraton (Kraton G 1901 FG, Kraton, USA) has been used. SEBS-MA is a linear terpolymer containing 1.4–2 wt% of maleic anhydride and 30 wt% of polystyrene with a specific gravity of 0.91 g/cm3 and a weight average molecular weight (Mw) of about 59 700 g/mol. Polyethylene glycol (PEG) with a Mw = 2,000 g/mol was supplied by Merck (Slovakia) and was used as received for SEBS-MA modification. Multiwall carbon nanotubes (MWCNTs) were supplied by Nanocyl (Nanocyl 7,000, Belgium). The MWCNTs have a purity of 90 %, an outer mean diameter of 9.5 nm, a mean length of 1.5 μm, and a specific surface area of 250–300 m2 g −1. Cholesteryl-pyrenecarboxylate (PyChol), used for MWCNT modification, was prepared in Polymer Institute, SAS [more details are provided in Czaniková et al. (2013)].
SEBS-MA-PEG Synthesis
SEBS-MA was modified by PEG using a procedure (Camus et al., 2004), where the primary goal was the chemical grafting of hydrophilic groups to make the copolymers amphiphilic. SEBS-MA block copolymer (80 g) containing ~2 wt% of succinic anhydride groups was dissolved in toluene (600 mL) at ~120°C under reflux. Sulfuric acid (2.5 mL) was then added as a catalyst for the esterification reaction. A solution of polyethylene glycol (128 g, Mw ~2,000 g/mol) in toluene (400 mL) was prepared separately by agitation at 50°C. The solution was then added in portions over a period of 30 min to the previously prepared solution of Kraton G 1901, again under reflux and with agitation. The reaction mixture was stirred for 2 h at 120°C. The solution was then precipitated in a hot mixture of water:ethanol (1:1.3 L) and separated by sedimentation and decantation. The residual crude product was concentrated by a rotary vacuum evaporator. The unreacted excess of polyethylene glycol was removed from the amphiphilic copolymer by the following procedure: the crude product was dissolved in toluene (1 L) at 120°C under reflux, added to hot water (2 L) and stirred vigorously under reflux for 15 min. The mixture was allowed to cool down to ~70°C, and the precipitated polymer was separated by sedimentation and decantation. This purification step was repeated until all the polyethylene glycol had been removed. The polymer was then dried in the vacuum oven at 50°C to produce 68 g of the final amphiphilic copolymer. Gel permeation chromatography (GPC) was used to proof the absence of polyethylene glycol after its purification. The successful modification of final copolymer was verified by FTIR spectroscopy, which confirmed the presence of characteristic PEG peaks. FTIR-ATR (cm−1, Ge: 1460 m, 1340 s, 1150 m, 1100 s, 1010 m).
Preparation of SEBS-MA/CNT Composites With and Without the PyChol Compatibilizer
A dispersion of the MWCNT (and PyChol) in toluene was stirred by a magnetic stirrer for 1 h (in the presence of the compatibilizer, the weight ratio of MWCNT:PyChol was 1:1). Under magnetic stirring, the dispersion was then sonicated for 1 h with a Hielscher 400 S sonicator (equipped with an H7 sonotrode) at an amplitude of 40 % (~ 70 μm, ~120 W/cm2) and a duty cycle of 100 %. An ice bath was very important for this step because to hinder the temperature increase of the solution and fast evaporation of the solvent during sonication. After 1 h, the matrix polymer was added, and the covered solution was stirred again for 1 h. When the polymer was dissolved (after 2 h), the covered solution was stirred by a high-speed mixer (IKA RW 16 basic) for 3 h at 1,080 rpm. The prepared solution was poured into a Teflon-coated Petri dish, and the solvent was allowed to evaporate. The samples were successively dried at laboratory temperature (24 h), in an oven at 60°C (8 h), and in a vacuum oven at 90°C (14 h). The prepared samples contained 0.5–4 wt% of the MWCNT with or without PyChol. The MWCNT modified with PyChol will be labeled MWCNT-P.
Preparation of SEBS-MA-PEG/MWCNT Composites
SEBS-MA-PEG/MWCNT-P composites, which also contain the PyChol compatibilizer, were prepared by solution casting, as described above for the SEBS-MA/MWCNT composites. As mentioned previously, chloroform as a solvent for the matrix dissolution was required; therefore, it was used throughout the entire procedure. The prepared samples contained 1–3 wt% of MWCNT and PyChol.
Composites Characterization
Broadband Dielectric Spectroscopy
Broadband dielectric spectroscopy (BDS) was used to determine the dielectric properties of materials either in the time or frequency domain. It is based on the interaction of an external field with the electric dipole moment of the sample and is often expressed by the complex permittivity. Moreover, it is an experimental method for characterizing electrochemical systems (Kremer and Schönhals, 2003).
The electrical conductivity of the composites in this work was measured by broadband dielectric spectroscopy using a Novocontrol Concept 40 with an Alpha dielectric spectrometer provided by Novocontrol Technologies GmbH (Hundsangen, Germany). Measurements were performed in the frequency range from 10−1 Hz to 106 Hz at a temperature of 25°C. The BDS-1200 parallel-plate capacitor with two gold-plated electrodes was used as a test cell; it was also supplied by Novocontrol Technologies. The diameter of the pressed sample was 20 mm, and the thickness was ~ 0.3 mm and 0.1 mm. The system is fully automated, and the WinDeta software was used to control the system and for data acquisition.
For electrical measurements, 3 compression molded plates (diameter 20 mm; thickness ca 0.3 mm) for each composite were prepared using a hydraulic press at 120°C. All samples were preheated for 2 min, compressed for 10 min, and subsequently cooled. For vapor sensing experiments, the pressed pellets were cut into strips.
Dynamic Mechanical Properties
Dynamic mechanical analysis (DMA) was performed using a Q800 DMA analyzer (TA Instruments, USA). Strips with a working length of 9 mm, a width of 4 mm and a thickness of ca. 0.3 mm were cut from the prepared composite films. The samples were measured in strain mode at 5 Hz and at a heating rate of 3°C/min in the temperature range from −65 to 125°C.
Morphology Analysis
Transmission electron microscopy (TEM) measurements were performed using a TEM LIBRA 200 MC or LIBRA 120 supplied by Carl Zeiss SMT (Oberkochen, Germany) with an acceleration voltage of 200, respectively 120 kV. For TEM investigations, ultrathin sections of the samples (~60 nm thickness) were sliced with a diamond knife (35° knife angle; DIATOME, Switzerland) using an ultramicrotome EM UC/FC 6 produced by Leica (Austria). The ultrathin sections were created at a temperature of −160°C and a cutting speed of 0.2 mm/s. Staining with RuO2 resulted in contrast of the different blocks in phase separated blockcopolymers, but the dispersion of the CNT became visible in non-stained samples.
SAXS
The small-angle X-ray scattering (SAXS) measurements were performed on Nanostar (Bruker AXS, Germany) equipped with a liquid-metal jet X-ray source (Excillum, Sweden). The collimated X-ray beam with the diameter of 0.5 mm and wavelength of 1.34Å was used to collect the SAXS patterns by means of a two-dimensional X-ray detector Vantec (Bruker AXS, Germany). The X-ray beam was aligned along the load direction used in hydraulic press to form the samples. The reciprocal space was calibrated using a silver behenate standard.
Humidity Sensor Testing
Sensor testing at room temperature was performed in a custom-built setup consisting of mass flow controllers (MFCs), a controlled evaporation mixer (CEM), a home-made sample cell with sample holders and connectors, devices for electrical/dielectric measurements, a temperature/relative humidity (R.H.) sensor, gas cylinders, a cylinder for liquids, and a computer. The samples were tested for changes in their electrical characteristics when they were exposed to known water vapor concentrations (Scheme 1).
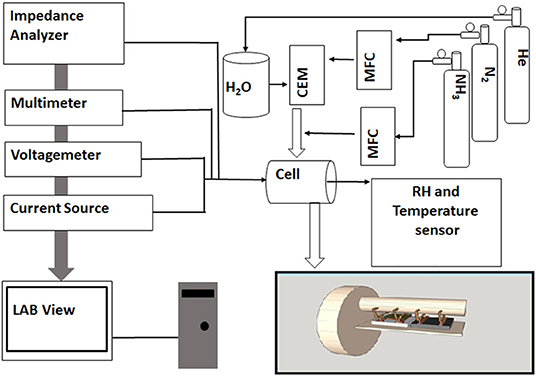
Scheme 1. Schematic representation of the humidity sensing setup. Note the sample cell interior with the sample holder and sensors (inlay).
The sensors were prepared by sputtering 2 gold electrodes on top of the films; the spacing between the electrodes was 7 mm Scheme 2.
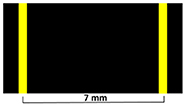
Scheme 2. Illustration of samples prepared for sensor testing.
The sensors were placed in the custom-built test chamber outfitted with electrical and gas inlet and outlet connections. The gas mixtures were prepared and distributed in the setup by computer controlled mass flow controllers (Bronkhost). Source current control and resistance measurements were performed by Keithley 2182A, 6220, and 6517B instruments connected to a computer with LabVIEW. The samples were dried in N2 flow prior to the measurements and then tested with varying relative humidity (R.H., %) pulses. The standard procedure consists of sample exposure at a specific R.H. for a time interval of 10 min, which is always followed by the drying step where pure N2 flows through the cell for 15 min. The resistance (in Ohm) and voltage (in Volt) necessary to keep the source current constant were recorded as a function of time, depending on the device used, and these raw data were transformed in signal change values (in %) using the following Equation (1):
where S0 is the initial resistance or voltage recorded after the sensor equilibration under N2 flow, and S(t) is the resistance or voltage at any given time.
Results and Discussion
In Figure 1 the frequency dependence of the real part of the complex ac electrical conductivity, σ′, as measured by BDS at T = 25°C, is shown. Three different samples from each MWCNT concentration were measured to determine if the filler distribution was homogeneous enough to obtain reproducible results. Figures 1A,B represent the conductivity data of SEBS-MA/MWCNT composites with (Figure 1B) and without (Figure 1A) modification of the MWCNT surfaces. Without surface treatment of MWCNT with PyChol (SEBS-MA/MWCNT—Figure 1A), the measured conductivities were lower than those obtained on composites with surface-treated MWCNT (SEBS-MA/MWCNT-P—Figure 1B). A reasonably good reproducibility was also achieved with the composites based on the PEG-modified SEBS-MA polymer matrix and the modified MWCNT filler (SEBS-MA-PEG/MWCNT-P, Figure 1C).
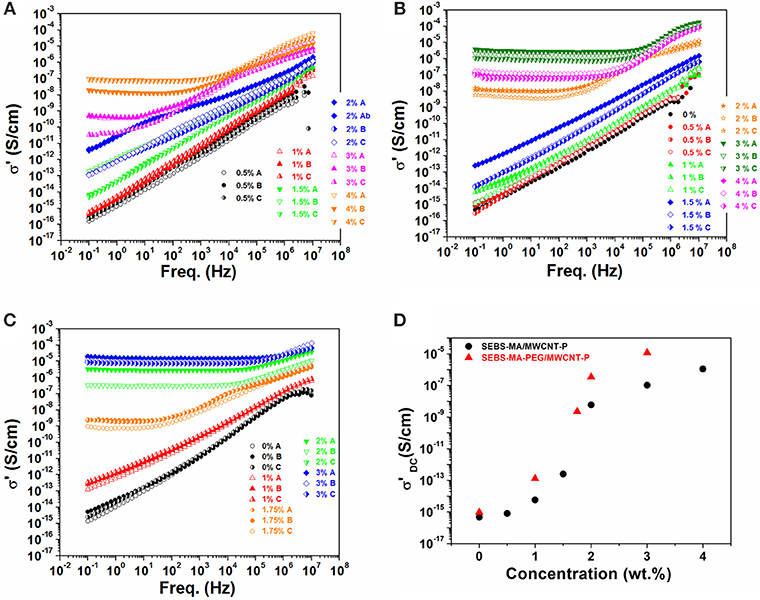
Figure 1. Real part of the complex electrical conductivity vs. frequency measured at various filler loadings of (A) SEBS-MA/MWCNT, (B) SEBS-MA/MWCNT-P, and (C) SEBS-MA-PEG/MWCNT-P composites (three different samples from each MWCNT concentration were measured). In (D) the filler concentration dependence of σ′DC for SEBS-MA/MWCNT-P and SEBS-MA-PEG/MWCNT-P composites is shown.
From the data shown in Figures 1A–C, the real part of the dc conductivity value (σ′DC) has been estimated for each composite, either from the dc plateau in the σ′(f) plots at high filler concentrations or the σ′ values measured at f = 0.1 Hz for the composites with low filler concentrations. The estimated values for the SEBS-MA/MWCNT-P and SEBS-MA-PEG/MWCNT-P composites are shown in Figure 1D (the average value of all three samples at each concentration was used). Figure 1D clearly shows that the SEBS-MA-PEG/MWCNT-P composites at a 3 wt% filler loading exhibit higher conductivity (>10−5 S/cm) than the composites based on SEBS-MA without PEG modification. Additionally, the data show a saturation of the dc conductivity at a higher filler concentration, which enables the estimation of the critical MWCNT concentration for the formation of the percolating conducting network (the percolation threshold). In general, the critical concentration of the percolation threshold significantly dictates the filler concentration range for the composites that may be suitable for vapor sensing applications (The dc conductivity data for the SEBS-MA/MWCNT composites are not included in Figure 1D because their filler concentration dependence was almost linear in the range studied here and, therefore, no percolation threshold could be determined for these composites).
The obtained results demonstrate that composites prepared with PyChol modified MWCNT exhibited enhanced conductivity compared to the composites with unmodified MWCNT. Therefore, significant progress was achieved due to the decrease of the percolation threshold value in comparison with previous composites that were prepared without using PyChol. The percolation threshold pc was calculated according to
where σ is the conductivity, σ0 is a conductivity parameter, p is the volume fraction of the filler, and t is a critical exponent related to the dimensionality of the investigated system. The best fit for the SEBS-MA/MWCNT-P data was achieved for pc = 1.65 wt% and for SEBS-MA-PEG/MWCNT-P for pc = 1.45 wt%. For the above evaluation, the wt% values were previously converted to vol%, as described in Logakis et al. (2010).
Morphology
To compare the morphology of the SEBS-MA composites with and without PEG modification, TEM studies were performed. Figure 2 shows the block-copolymer matrix morphologies of the composites stained by RuO2 using the same magnification. In case of SEBS-MA some degree of alignment in one direction was observed, certainly caused by orientation during pressing (Figures 2A,B), which is only in parts also in the micrographs of the PEG-grafted matrix (Figures 2C,D) visible. The composite (Figures 2E,F) appears non-orientated. The PEG-grafted SEBS and its composite exhibit slightly increased periodicities. The domain enlargement is caused by the modification procedure, which influenced the volume composition of the matrix. Due to the presence of RuO2, it was not possible to recognize the MWCNTs in the composites. The TEM images of unstained SEBS-MA composites in Figures 3A,B reveal individual MWCNTs and only few small agglomerates that are well wetted by the rubber matrix. Despite the dark shadows in the TEM of SEBS-MA-PEG/2MWCNT-P in Figures 3C,D, individual well-dispersed MWCNTs and small agglomerates can be also observed in these composites. Thus, the conductive percolation networks in both types of composites consist of some small agglomerates interconnected by well-dispersed MWCNTs.
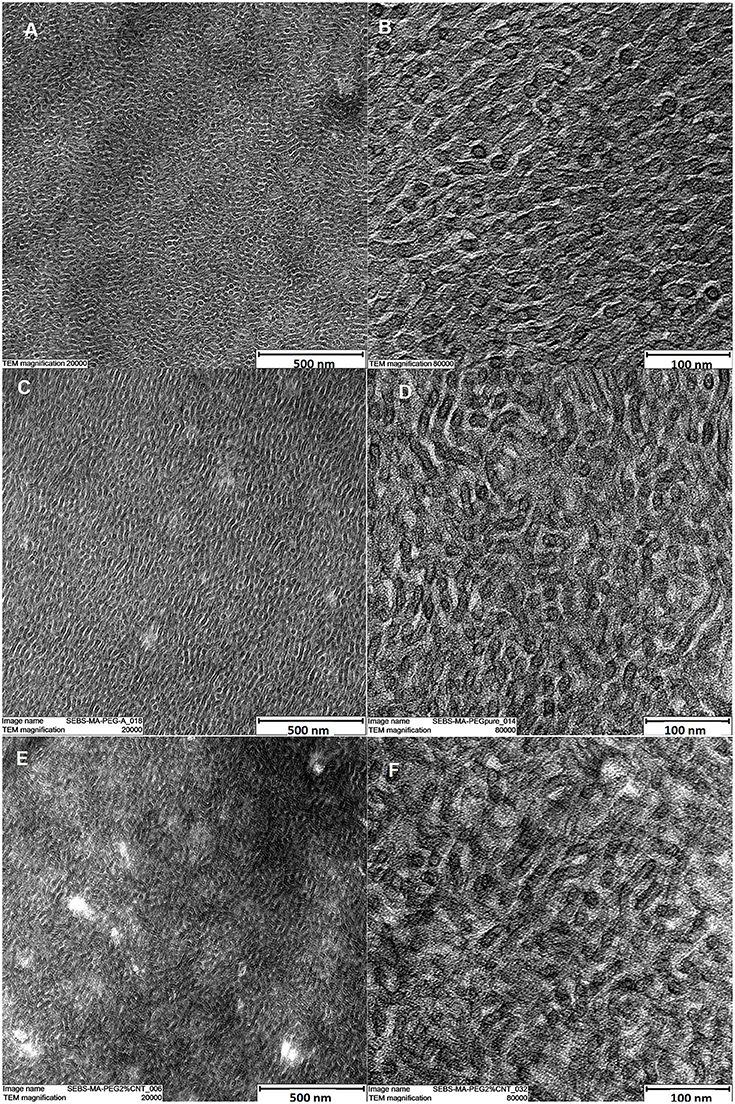
Figure 2. TEM images of RuO2-stained samples of (A,B) SEBS-MA, (C,D) SEBS-MA-PEG, and (E,F) SEBS-MA-PEG/2MWCNT-P.
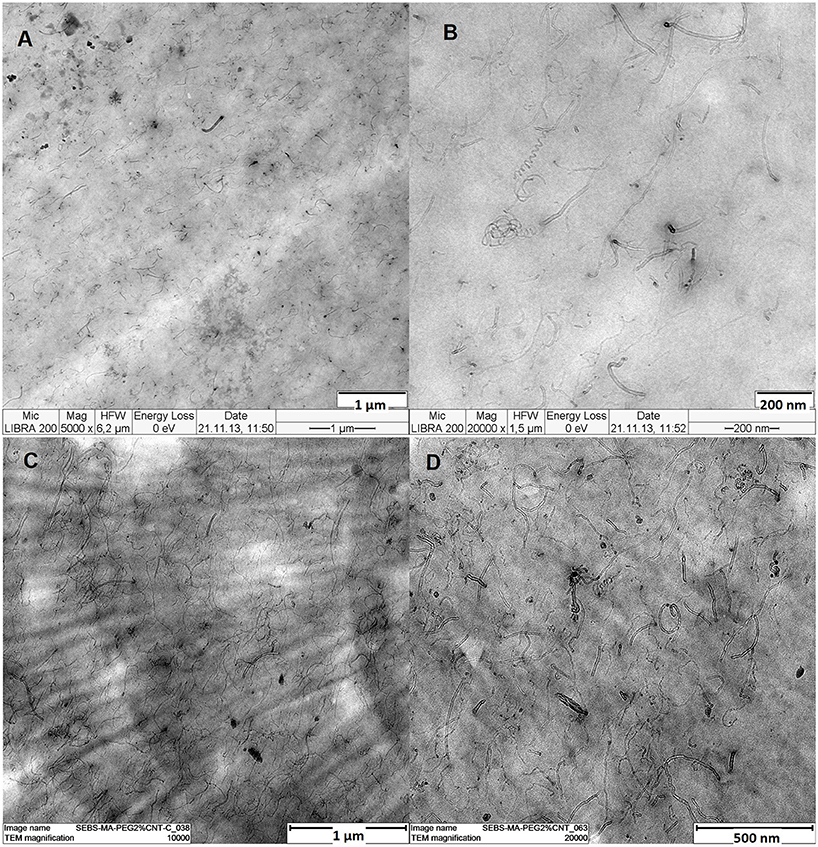
Figure 3. TEM images of (A,B) SEBS-MA/2MWCNT-P and (C,D) SEBS-MA-PEG/2MWCNT-P.
The SAXS enables statistical insight into the morphology of block copolymers. The structure, microdomain size and orientation can be evaluated from the two-dimensional (2D) SAXS patterns. Figure 4A shows the SAXS pattern of the non-pressed SEBS-MA (solvent casted) copolymer sample. The pattern has a radial symmetry, which points to an isotropic (random) orientation of ordered microdomains. The radial average of SAXS intensity as a function of q is shown in Figure 4E. The lamellar morphology of triblock copolymer is confirmed by the multiple orders of Bragg peaks at the relative positions of 1:2:3:4:5 (Borsali and Pecora, 2008). The estimated size of microdomain is 30 nm (), as calculated from the position of the first Bragg peak at qm = 0.21 nm−1. The SAXS pattern of uniaxially pressed SEBS-MA sample is shown in Figure 4B. The uniaxial loading induces a strong orientation of copolymer microdomains. This is validated by an anisotropic SAXS pattern with the Bragg maxima aligned along the constraint direction, which is perpendicular to the polymer flow direction during sample loading (Lee et al., 1996). The SAXS intensity profile along the constraint direction shown in Figure 4E consists of a series of Bragg maxima at q ratios of 1:√3:√7:√9, which suggest the hexagonal packing symmetry. The uniaxial pressure induced formation of the microdomains composed of hexagonally closed-packed polystyrene cylinders in poly-ethylene/butylene matrix (Amurin et al., 2016). The position of the first Bragg maxima at qm = 0.29 nm−1 gives the inter-columnar distance d ≈ 25 nm ().
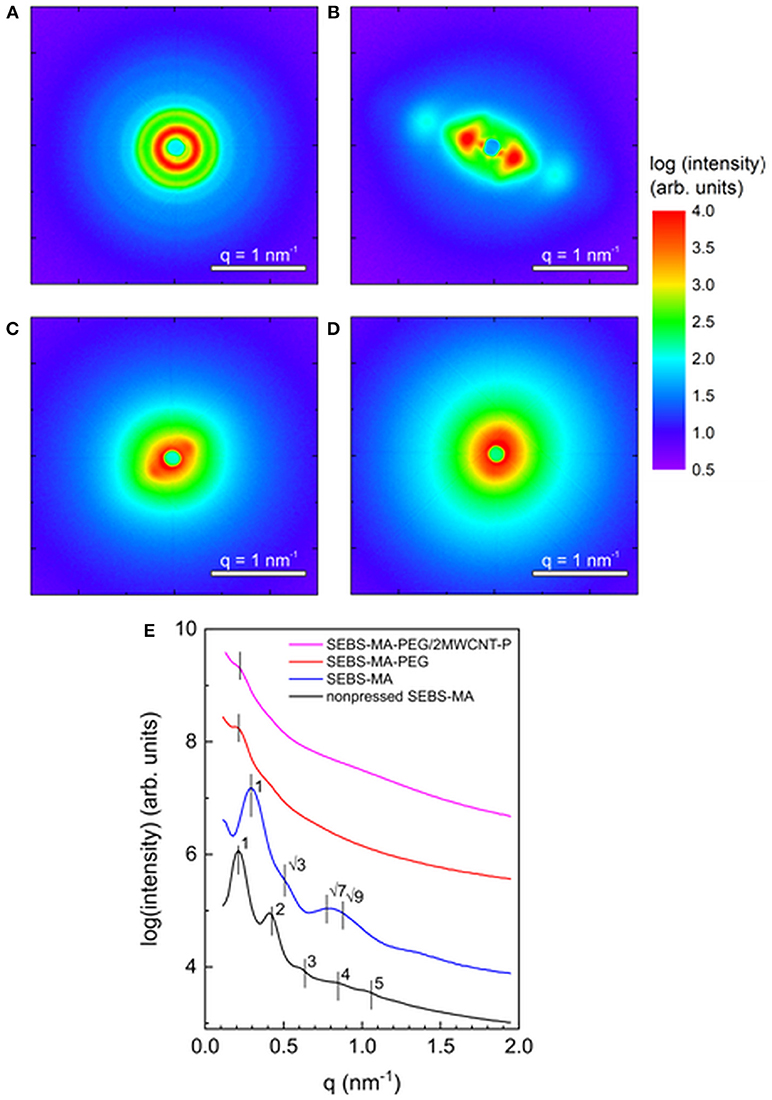
Figure 4. SAXS patterns of (A) nonpressed SEBS-MA, and pressed (B) SEBS-MA, (C) SEBS-MA-PEG, and (D) SEBS-MA-PEG/2MWCNT-P. (E) Extracted SAXS intensity profiles. The vertical lines denote the maxima positions of Bragg peaks.
The grafting of the SEBS-MA copolymer with PEG leads to the formation of microdomains with a decreased short-range order as only the first order Bragg peak is visible in SAXS pattern (Figure 4C). The absence of the higher order Bragg peaks in SAXS intensity profile along the constraint direction shown in Figure 4E disables identification of structural symmetries. However, the position of the first Bragg peak at qm = 0.21 nm−1 gives an estimation of the average microdomain size of around 30 nm, what is some 20% larger than the center-to-center distance between polystyrene cylinders in identically prepared SEBS-MA sample without PEG. The incorporation of PyChol modified MWCNTs into SEBS-MA-PEG matrix at the level of 2 wt% leads to a further decrease of short-range order as evidenced by SAXS pattern (Figure 4D). The SAXS intensity profile (Figure 4E) reveals only a small Bragg peak at the qm = 0.22 nm−1. This suggests a negligible increase of microdomain size by < 3% due to incorporation of MWCNTs. The presence of MWCNTs in polymer matrix can be observed as a slight shoulder in SAXS intensity profile centered around 1 nm−1, which can be assigned to the form factor of single dispersed MWCNT.
DMA
In Figure 5, the results from DMA measurements of the composites are shown. Interestingly, Young's modulus of the pure SEBS-MA matrix increases after PEG modification. This increase can be attributed to the presence of PEG crystalline domains (Michell et al., 2013). For the SEBS-MA/MWCNT-P composites, the presence of MWCNTs leads to a slight shift of the Tg of the soft blocks to a higher T and a much smaller peak than that of the pure polymer, which indicates a close interaction between the MWCNTs and the butylene/ethylene phase. This is in accordance with the observation by Ilčíková et al. (2014), where PyChol-modified MWCNTs mostly interacted with this phase. For the SEBS-MA-PEG/MWCNT-P composites, the presence of MWCNTs clearly resulted in a decrease in the height of the melting region of PEG (25–60°C), which indicates a good interaction between PEG and MWCNTs. MWCNT may reduce the crystallinity of PEG (Tg ca. −65°C) phase possibly due to reduced mobility and the shift of Tg of EB-g-PEG block counts for good CNT interaction to this phase causing this reduced mobility. This can also explain that the E-modulus is smaller in the presence of CNT at low temperatures. Then, cold crystallization and melting during heating in DMA measurement may cause the higher modulus between 0 and 50°C. In addition, there is some shift of the Tg of the butylene/ethylene phase (from −36.4 for SEBS-MA-PEG to −33.8°C for SEBS-MA-PEG/2MWCNT-P) compared to the negligible shift in the case of PEG-free composite, indicating improved interaction of MWCNTs with butylene/ethylene phase after PEG modification. The Tg of the PS blocks reduces caused by grafting with PEG and the presence of MWCNTs further slightly reduces the Tg by 1°C in case of PEG-free systems and 0.4°C in case of SEBS-MA-PEG.
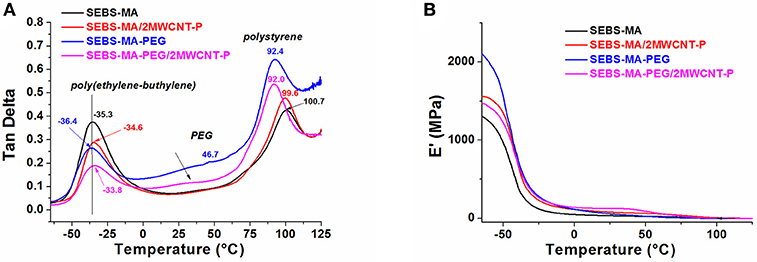
Figure 5. (A) The tan delta curve and (B) Young's modulus of the studied samples measured by DMA.
For water sensing, the most important attribute is a very good interaction between MWCNTs with the PEG phase, which can subsequently be beneficial for a good electrical response since the preferential PEG phase changes its morphology upon water uptake.
Humidity Sensing Results
As mentioned above in the experimental section, the response of the composites as humidity sensors is expressed via the quantity S (in %), which is evaluated using Equation (1).
Our experiments reveal that it was difficult to measure any response to humidity changes for the SEBS-MA/MWCNT-P composites because of the small electrical conductivity of the composites and, mainly, due to the limited hydrophilicity of the matrix. In contrast, the SEBS-MA-PEG/MWCNT-P composites respond satisfactorily to humidity changes and, thus, sensing experiments were performed using these composites.
The first experiments were conducted using specimens with a thickness of ca. 0.3 mm, which was the thickness of the compression molding template used for sample preparation for other characterization techniques (BDS and DMA).
Figure 6 shows the response data of all samples at room temperature using the same source current (Isc = 0.1 μA). The sample containing 1.75 wt% MWCNT-P is the most sensitive sample; however, the signal itself contains significantly more noise. Such a behavior is expected for MWCNT concentrations slightly above the percolation threshold. Slight swelling can disrupt the few conductive paths in the composite, which results in a more dramatic change in the signal. However, the sample containing 3 wt% MWCNT-P has the worst sensing characteristics with a response of only 1.3% at highest analyzed humidity, which is mainly because of high MWCNT content and, consequently, conducting paths can be found in abundance, so that the overall conductivity of the material is much less affected by swelling than that of SEBS-MA-PEG/MWCNT-P composites with lower conductive filler contents.
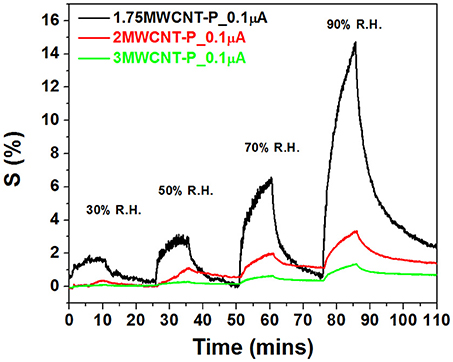
Figure 6. Sensing results of ~ 0.3 mm thick SEBS-MA-PEG/MWCNT-P samples at room temperature. The humidity was increased in each sensing cycle.
The shape of the signal in Figure 6 allows determining the slope of the short linear region of the response at the beginning of the pulse; this corresponds to the rate of the signal change at the first established stage of each R.H. level tested.
The data in Figure 7 can be used later to determine the sensitivity of the sensor. Figure 7 shows the rate of the signal change as a function of increasing humidity. The samples with high MWCNT loadings (2 and 3 wt% MWCNT) exhibit almost constant sensing characteristics at all humidities; however, as observed in Figure 6, they appear to respond slower than the 1.75 wt% MWCNT sample. This behavior indicates that there is an upper limit of the MWCNT concentrations for optimum sensing capabilities.
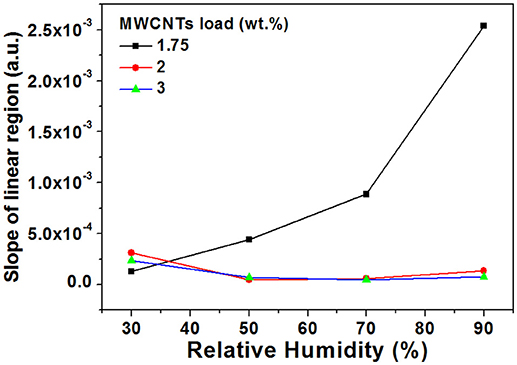
Figure 7. Slope of the linear region at the beginning of the response after the exposure of ~0.3 mm thin SEBS-MA-PEG/MWCNT-P samples to various R. H. levels.
To further improve the response of our sensors, we decided to prepare thinner samples. Indeed, these thin samples with a thickness of ~0.1 mm showed much smoother responses and, interestingly, the responses were more intense for the composite with higher filler loading of 2 wt% compared to that with 1.75 wt% of MWCNT (the concentration with highest responses found for the thicker samples) (Figure 8). Possibly, during compression to thinner samples the anisotropy of the filler orientation becomes higher resulting in small shift of percolation concentration and remaining stresses, which results in the composite with 1.75 wt% MWCNT-P in unstable swelling/deswelling behavior, while at higher loadings of MWCNT-P the composite is more stable. However, a proof for this assumption is not easy and behind the goal of this work. For the thinner sample of SEBS-MA-PEG/2MWCNT-P (~0.1 mm) at a source current of 0.1 μA (red line in Figure 8B), smoother responses than those of the thicker samples were achieved (~0.3 mm, Figure 6).
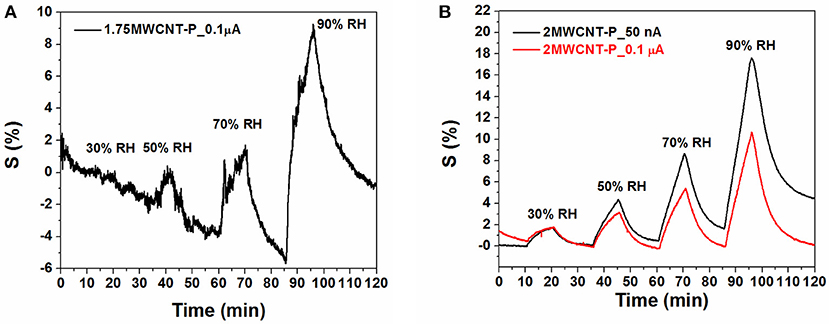
Figure 8. Cyclic sensing measurements with different source currents using thin samples (~0.1 mm) of (A) SEBS-MA-PEG/1.75MWCNT-P and (B) SEBS-MA-PEG/2MWCNT-P.
Comparative measurements were also conducted with different source currents to examine the current effect on the sensing behavior (Figure 8B). Surprisingly, it seems that the current may have a remarkable effect on the overall signal. The 2MWCNT-P sample shows enhanced signal changes for smaller source currents; however, a drift is evident in the baseline as the humidity rises. For both Isc values used, stable signals are produced, and the curves exhibit increasing differences as the humidity increases.
Finally, the thin SEBS-MA-PEG/2MWCNT-P sample (~0.1 mm) was tested to determine its sensing characteristics when exposing to different humidities directly. Several specimens were prepared and tested by exposing them to various humidity levels.
In Figure 9, the responses of the SEBS-MA-PEG/2MWCNT-P thin films with a thickness of ~0.1 mm to varying humidities are shown. The source current was set to 100 μA (to minimize the above-mentioned baseline drift at lower currents, Figure 8), and tests were conducted for 10 min exposures at 30, 50, 70, and 90 % R.H. There is an obvious change in the overall sensing behavior. The important result is that the sensor shows a rapid response, and the signal after the first fast response increases continuously with time. The slope of this increase seems to correlate with the humidity. The slope of the beginning response exhibits an obvious correlation with the relative humidity (Figure 9B).
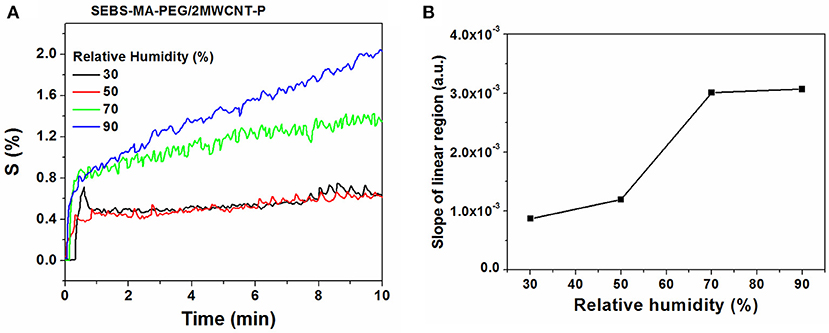
Figure 9. (A) Response of ~0.1 mm thick SEBS-MA-PEG/2MWCNT-P samples exposed to various humidities and (B) the corresponding slopes of changes of S in the linear region at the beginning of the response curves.
Therefore, the exposure time was extended in order to investigate if a steady state signal before and during certain RH exposure can be achieved (Figure 10). It is obvious that before measurement the sample need some period of time to dry-out and equilibrate to reach the steady state signal. Equilibration was reached within about 50 min. and before starting the exposure to different humidities S was set to 0 (St = S0, s. equation 1). Importantly, above 50 % RH, stable signals during extended exposure were not reached within a practical time period. At 30 or 50 % RH, upon few seconds of exposure, the signal deviates from the initial linear rise and converge to a steady state. This steady state was observed for 30 % RH after 1 h and for 50 % RH it was nearly constant after 2.5 h (remaining slop equals 0.003 %/min). However, for 70 and 90 % RH even after 2.5 h exposure S continuously increased and much longer times will be required to reach equilibrium.
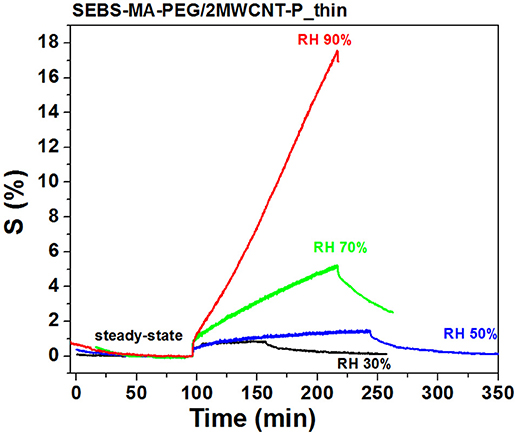
Figure 10. Responses of SEBS-MA-PEG/2MWCNT-P thin samples (~0.1 mm) to 30, 50, 70, and 90 % RH during extended exposure time.
Bearing in mind that a steady state condition during extended exposure could not be used for sensor characterization and operation, we have used the linear region of the signal and the shortly thereafter time period of 10 min. to discuss the sensing behavior. It was observed that for about 10 min of exposure, the signals were varying enough to differentiate between the applied humidities, as well in respect of sensing response in the beginning linear region and in maximum signal change.
Conclusions
We prepared homogeneous composites based on an elastomeric matrix and MWCNTs.
TEM analysis showed that the conductive percolation networks in the prepared composites consist of some small agglomerates interconnected by well-dispersed MWCNTs.
The electrical conductivity measurements revealed that the nanocomposites with surface-modified CNTs exhibit higher conductivity values, and among them, those with a PEG modification exhibit the lowest percolation threshold (pc = 1.45 wt%). As demonstrated by DMA, the interaction of the MWCNTs with the EB-g-PEG phase was very good, which can subsequently be beneficial for good electrical responses of a humidity sensor since the PEG preferentially interacts with water molecules.
Our investigation showed that the SEBS-MA-PEG/MWCNT-P nanocomposites are promising candidate materials for sensing low amounts of humidity. Our experimental studies indicate that for the proper selection of the sensing sample, three major parameters must be considered. The first parameter is the MWCNT loading. MWCNT concentrations slightly above the percolation threshold results in large signal changes; however, the final sensing characteristics are unstable. In our system, best results were obtained for an MWCNT loading of 2 wt%. The second factor is the source current applied during the tests. Low current values (in the order of nA for our specimens) are presumably beneficial for the sensing mechanism in the entire R.H. range. Finally, an important factor for the sensing quality is the film thickness. The results obtained indicated that thin films (with a thickness in the order of 0.1 mm) exhibit very smooth and stable signals compared to films with 0.3 mm thickness. It is obvious from our study that the performance of this type of sensors can be optimized by proper combination of the filler loading, the source current for testing, and the thickness of the composite film.
Author Contributions
MM was the main author and did the analysis from DMA and dielectric relaxation spectroscopy. CC has performed and discussed the sensing experiments. JT has prepared the composites and contributed to the introduction and writing. JK has prepared and characterized the amphiphilic SEBSMAPEG polymer matrix. AK and PP have discussed the whole manuscript, especially the sensing experiments. JP has conducted the morphological analysis and discussed the whole paper. KV, PS, EM have performed and discussed SAXS analysis. MO overviewed the dielectric relaxation spectroscopy and morphology study and the manuscript writing.
Conflict of Interest Statement
The authors declare that the research was conducted in the absence of any commercial or financial relationships that could be construed as a potential conflict of interest.
Acknowledgments
This research was supported by the VEGA 02/0010/18 and APVV-0593-11 projects (Slovakia) and a bilateral Slovak-German project supported by DAAD (PPP Slowakei, 2013–2014). We are grateful to Uta Reuter for TEM analysis.
References
Amurin, L. G., Carastan, D. J., and Demarquette, N. R. (2016). Morphological evolution of block copolymer nanocomposites submitted to extensional flows. J. Rheol. 60, 175–189. doi: 10.1122/1.4938278
Borsali, R., and Pecora, R. (eds) (2008). Soft Matter Characterization. Dordrecht: Springer Netherlands. doi: 10.1007/978-1-4020-4465-6
Butkewitsch, S., and Scheinbeim, J. (2006). Dielectric properties of a hydrated sulfonated poly(styrene–ethylene/butylenes–styrene) triblock copolymer. Appl. Surf. Sci. 252, 8277–8286. doi: 10.1016/j.apsusc.2005.10.059
Calisi, N., Giuliani, A., Alderighi, M., Schnorr, J. M., Swager, T. M., Di Francesco, F., et al. (2013). Factors affecting the dispersion of MWCNTs in electrically conducting SEBS nanocomposites. Eur. Polym. J. 49, 1471–1478. doi: 10.1016/j.eurpolymj.2013.03.029
Camus, E., Brachats, C., and Auguste, S. (2004). Amphiphilic Copolymers for Use in Particular as Emulsifying Agent. U.S. Patent No. US2004/0097624A1. Minneapolis, MN: Merchant and Gould PC.
Czaniková, K., Ilčíková, M., Krupa, I., Mičušík, M., Kasák, P., Pavlova, E., et al. (2013). Elastomeric photo-actuators and their investigation by confocal laser scanning microscopy. Smart Mater. Struct 22:104001. doi: 10.1088/0964-1726/22/10/104001
Dong, X. M., Fu, R. W., Zhang, M. Q., Zhang, B., and Rong, M. Z. (2004). Electrical resistance response of carbon black filled amorphous polymer composite sensors to organic vapors at low vapor concentrations. Carbon 42, 2551–2559. doi: 10.1016/j.carbon.2004.05.034
Dong, X. M., Luo, Y., Xie, L. N., Zhang, S. T., Zhang, Y. C., and Zheng, X. L. (2008). Conducting property of carbon black filled poly(ethylene glycol)/poly(methyl methacrylate) composites as gas-sensing materials. J. Appl. Polym. Sci. 107, 2322–2328. doi: 10.1002/app.27221
Engel, J. M., Chen, N., Ryu, K., Pandya, S., Tucker, C., Yang, Y., et al. (2006). Proceedings of the Solid-State Sensors, Actuators, and Microsystems Workshop, eds L. Spangler, T. W. Kenny (San Diego, CA: Transducer Research Foundation Inc.).
Ersoy, S., Ulug, E., and Taşdemir, M. J. (2011). Sound adsorption and morphological properties of SIS/HIPS/CaCO 3 polymer composites. Polym. Mater. 28, 551–560.
Fihn, M. (2006). The challenges of commercializing flexible displays. Solid State Technol. 49, 43–46.
Georgousis, G., Pandis, C., Kalamiotis, A., Georgiopoulos, P., Kyritsis, A., Kontou, E., et al. (2015). Strain sensing in polymer/carbon nanotube composites by electrical resistance measurement. Compos. Part B-Eng. 68, 162–169. doi: 10.1016/j.compositesb.2014.08.027
Ilčíková, M., Mosnáček, J., Mrlík, M., Sedláček, T., Csomorová, K., Czaniková, K., et al. (2014). Influence of surface modification of carbon nanotubes on interactions with polystyreneb-polyisoprene-b-polystyrene matrix and its photo-actuation properties. Polym. Adv. Technol. 25, 1293–1300. doi: 10.1002/pat.3324
Jiang, Z., Liu, S., Zhao, J., and Chen, X. (2013). Flame-retarded mechanism of SEBS/PPO composites modified with mica and resorcinol bis(diphenyl phosphate). Polym. Degrad. Stabil. 98, 2765–2773. doi: 10.1016/j.polymdegradstab.2013.10.013
Johnson, L., Perkins, F. K., O'Hearn, T., Skeath, P., Merritt, C., Frieble, J., et al. (2004). Electrical stimulation of isolated retina with microwire glass electrodes. J. Neurosci. Meth. 137, 265–273. doi: 10.1016/j.jneumeth.2004.02.035
Lacour, S. P., Jones, J., Suo, Z., and Wagner, S. (2004). Design and performance of thin metal film interconnects for skin-like electronic circuits. IEEE Electr. Device L. 25, 179–181. doi: 10.1109/LED.2004.825190
Lee, H. H., Register, R. A., Hajduk, D. A., and Gruner, S. M. (1996). Orientation of triblock copolymers in planar extension. Polymer Eng. Sci. 36, 1414–1424. doi: 10.1002/pen.10536
Li, Y., Zhao, H., Jiao, M., and Yang, M. (2018). Sulphonated polystyrene-b-poly(4-vinylpyridine) with nanostructures induced by phase separation as promising humidity sensitive material. Sensor Actuat. B. 257, 1118–1127. doi: 10.1016/j.snb.2017.11.034
Logakis, E., Pollatos, E., Pandis, C. h., Peoglos, V., Zuburtikudis, I., Delides, C. G., et al. (2010). Structure–property relationships in isotactic polypropylene/multi-walled carbon nanotubes nanocomposites. Compos. Sci. Technol. 70, 328–335. doi: 10.1016/j.compscitech.2009.10.023
Lux, F. (1993). Models proposed to explain the electrical conductivity of mixtures made of conductive and insulating materials. J. Mater. Sci. 28, 285–301.
Matzeu, G., Pucci, A., Savi, S., Romanelli, M., and Di Francesco, F. (2012). Sensor. Actuat. A-Phys. 178, 94–99. doi: 10.1016/j.sna.2012.02.043
Michell, R. M., Blaszczyk-Lezak, I., Mijangos, C., and Müller, A. J. (2013). Confinement effects on polymer crystallization: from droplets to alumina nanopores. Polymer 54, 4059–4077. doi: 10.1016/j.polymer.2013.05.029
Pelrine, R., Kornbluh, R., Pei, Q., and Joseph, J. (2000). High-speed electrically actuated elastomers with strain greater than 100%. Science 287, 836–839. doi: 10.1126/science.287.5454.836
Pötschke, P., Kobashi, K., Villmow, T., Andres, T., Conceição Paiva, M., and Covas, J. A. (2011). Liquid sensing properties of melt processed polypropylene/poly(ε-caprolactone) blends containing multiwalled carbon nanotubes Compos. Sci. Technol. 71, 1451–1460. doi: 10.1016/j.compscitech.2011.05.019
Robert, F. (2003). Electronic textiles charge ahead. Science 301, 909–911. doi: 10.1126/science.301.5635.909
Tabačiarová, J., Krajči, J., Pionteck, J., Reuter, U., Omastová, M., and Mičušík, M. (2016). Styrene butadiene rubber/carbon filler-based vapor sensors. Macromol. Chem. Phys. 217, 1149–1160. doi: 10.1002/macp.201500298
Villmow, T., John, A., Pötschke, P., and Heinrich, G. (2012). Polymer/carbon nanotube composites for liquid sensing: selectivity against different solvents. Polymer 53, 2908-2918. doi: 10.1016/j.polymer.2012.04.050
Villmow, T., Pegel, S., John, A., Rentenberger, R., and Pötschke, P. (2011). Liquid sensing: smart polymer/CNT composites. Mater. Today 14, 340–345. doi: 10.1016/S1369-7021(11)70164-X
Wang, H., Li, Y., Chen, Y., Yuan, M., Yang, M., and Yuan, W. (2007). Composites of carbon black functionalized with polymers as candidates for the detection of methanol vapor. React. Funct. Polym. 67, 977–985. doi: 10.1016/j.reactfunctpolym.2007.05.021
Yang, M. J., She, Y., and Li, Y. (2002). Humidity sensitive properties of quaternized poly(4-vinylpyridine-co-butyl methacrylate). J. Mater. Sci. Lett. 21, 1477–1479.
Youngs, I. J. (2002). Exploring the universal nature of electrical percolation exponents by genetic algorithm fitting with general effective medium theory. J. Phys. D Appl. Phys. 35, 3127–3137.
Yu, C., Zhang, Y., Cheng, D., Li, X., Huang, Y., and Rogers, J. A. (2014). All-elastomeric, strain-responsive thermochromic color indicators. Small 10, 1266–1271. doi: 10.1002/smll.201302646
Zhang, B., Fu, R. W., Zhang, M. Q., Dong, X. M., Lan, P. L., and Qiu, J. S. (2005). Preparation and characterization of gas-sensitive composites from multi-walled carbon nanotubes/polystyrene. Sensor. Actuat. B-Chem. 109, 323–328. doi: 10.1016/j.snb.2004.12.066
Keywords: carbon nanotubes, sensor, humidity, polymer, nanocomposite, electrical conductivity
Citation: Mičušík M, Chatzimanolis C, Tabačiarová J, Kollár J, Kyritsis A, Pissis P, Pionteck J, Vegso K, Siffalovic P, Majkova E and Omastová M (2019) Polyethylene Glycol-Modified Poly(Styrene-co-Ethylene/Butylene-co-Styrene)/Carbon Nanotubes Composite for Humidity Sensing. Front. Mater. 5:79. doi: 10.3389/fmats.2018.00079
Received: 18 September 2018; Accepted: 12 December 2018;
Published: 09 January 2019.
Edited by:
Raquel Verdejo, Ciencia y Tecnología de Polímeros (ICTP); Spanish National Research Council (CSIC), SpainReviewed by:
Walter Caseri, ETH Zürich, SwitzerlandClaudia Merlini, Federal University of Santa Catarina, Brazil
Copyright © 2019 Mičušík, Chatzimanolis, Tabačiarová, Kollár, Kyritsis, Pissis, Pionteck, Vegso, Siffalovic, Majkova and Omastová. This is an open-access article distributed under the terms of the Creative Commons Attribution License (CC BY). The use, distribution or reproduction in other forums is permitted, provided the original author(s) and the copyright owner(s) are credited and that the original publication in this journal is cited, in accordance with accepted academic practice. No use, distribution or reproduction is permitted which does not comply with these terms.
*Correspondence: Matej Mičušík, bWF0ZWoubWljdXNpa0BzYXZiYS5zaw==
Mária Omastová, bWFyaWEub21hc3RvdmFAc2F2YmEuc2s=