
95% of researchers rate our articles as excellent or good
Learn more about the work of our research integrity team to safeguard the quality of each article we publish.
Find out more
ORIGINAL RESEARCH article
Front. Mater. , 27 July 2018
Sec. Thin Solid Films
Volume 5 - 2018 | https://doi.org/10.3389/fmats.2018.00043
 Udit Narula1
 Cher Ming Tan1,2,3,4,5*
Determination of key factors and parameters is necessary to design any process when number of factors are large. Design of Experiments technique is an important statistical tool to serve the purpose. This work demonstrates a method to perform qualitative analysis in order to determine cardinal control factors for Graphene growth at low temperature values using Fractional Factorial design. Graphene is synthesized using Plasma Enhanced Chemical Vapor Deposition (PECVD) method in this work. Attribute Response Analysis suggests that Graphene growth temperature, deposition time and RF power are important controlling factors. This is verified by Graphene growth using the predicted recipe.
2D materials are becoming increasingly popular after the discovery of Graphene (Novoselov et al., 2004). This wonder-material comprises of honeycomb crystal lattice and is only single-atom thick (Novoselov et al., 2005; Allen et al., 2010; Zhu et al., 2010). Due to its superior electrical (Geim and Novoselov, 2007; Moser et al., 2007) and thermal (Balandin et al., 2008) properties, Graphene finds its place in various applications such as photodetectors, optical modulator, sensors and metrology, etc. (Novoselov et al., 2012).
Among various well established Graphene growth methods Chemical vapor deposition (CVD) technique (Reina et al., 2009; Thiele et al., 2010) is the most common and economical in terms of size and quality. However, the working temperature used in CVD method is about 900–1020°C.
Therefore, there is a shift in approach and Plasma-Enhanced CVD (PECVD) has become increasingly prominent because of its low operational temperature and has been employed for growing carbon nanostructures successfully (Wu et al., 2002). Nickel substrate has been successfully used for Graphene Synthesis using PECVD (Nandamuri et al., 2010; Qi et al., 2011; Peng et al., 2013, 2015), but the key process parameters and their purview to control and influence the synthesis is not methodically studied. This is necessary as there are more number of growth parameters in PECVD as compared to conventional CVD. Therefore, several recipes to produce PECVD based Graphene are possible and each recipe will result in different quality of Graphene. Hence, a systematic study of important process factors is required for different quality of Graphene suitable for different applications, so that engineering of synthesized graphene can be made possible.
One factor at a time (OFAT) experiments are usually performed for such investigation, wherein each factor involved in the experiment is varied one at a time while holding others fixed (Mason et al., 1991; Czitrom, 1999). On the other hand, Design of Experiments (DoE) method for conducting experiments is one of the statistical approaches which is more efficient in order to study two or more simultaneously varying factors (Czitrom, 1999; Mei et al., 2015). This is because DoE method ensures minimum number of experimental runs and provides information on the significances of individual factors as well as their interaction (Mason et al., 1991; Czitrom, 1999; Montgomery and Runger, 2010; Mei et al., 2015). In fact, DoE has been implemented for controlling process parameters for various nano-suspension (Verma et al., 2009) and nano-carriers (Xu et al., 2011; Kamal et al., 2015) and surface roughness prediction (Vicente et al., 1998).
This work demonstrates a method to perform Qualitative Analysis of Graphene synthesized by PECVD in a low temperature regime. The Qualitative Analysis is conducted using Attribute-Response Fractional-Factorial DoE design in order to determine the essential factors that influence the synthesis of Graphene on a Nickel thin film.
Design-of-Experiments (DoE) is a very simple and yet an efficient statistical tool to determine the simultaneous variation in effects and contributions of different levels of multiple-factors involved in an experiment (Lorenzen and Anderson, 1993; Vicente et al., 1998). The need for implementation of DoE in this work is evident from the fact that the parameters used to synthesize materials at nano-level such as Graphene is much more stringent than any other macro-level process. This work primarily focusses on Factorial Experiments which involves two levels for each of the multiple factors and the response is carefully chosen for which the significance and effects of parameters are elucidated. This technique helps in clearing the dilemma of selecting appropriate levels of factors for experiment designers, by performing minimum experiments and obtaining maximum information from the same. In order to save time and resources further, Fractional-Factorial DoE (Montgomery, 2013) is a viable option for systematically reducing the number of experimental runs without deteriorating the necessary statistical information. The methodology for the DoE implementation in this work is explained below.
Qualification Analysis of growth parameters for Graphene synthesized by PECVD on a nickel substrate in a low temperature regime is conducted using Attribute-Response (Jayakumar, 2018) Fractional-Factorial DoE design. An Attribute-Response (Jayakumar, 2018) DoE Analysis is used here because not every recipe results in Graphene synthesis. Hence, we study the effect of levels on the process factors which are favorable for synthesis of Graphene. Here, five main factors with two levels each are considered as shown in Table 1.
Since this work shows a qualification study of growth parameters, all the factors which can influence the possibility of growing Graphene are considered. The choice of five main factors are made on the basis of pilot experiments as all these factors are involved in Graphene growth in this process and can be controlled. The choice of levels has been made after careful study of literature summarized in Table 2. From Table 2, the temperature range is chosen to be 400–600°C keeping in mind the minimum possible growth temperature (Peng et al., 2013) and application of Graphene on Ni metal for semiconductor-based applications. Similarly, the H2/CH4 gas ratio, Deposition Time, Power and Ar gas flow rate are chosen based on a balanced combination of data in Table 2 and equipment limitations.

Table 2. Summary of Reported Works with different recipes for PECVD graphene growth on Ni substrate.
The five factors in Table 1 are named as A, B, C, D, and E and their levels are coded as mathematical “−1” and “+1” for low and high levels respectively. The two levels of each factors are chosen based on preliminary experimental results and various works reported previously (Nandamuri et al., 2010; Qi et al., 2011; Peng et al., 2013, 2015) which suggested a range of levels for each factor suitable for Graphene synthesis. Since the number of factors involved in the process is 5, the experimental runs as per the Factorial design will be 32 which is quite large to practically experiment with. Therefore, we choose Fractional-Factorial design for DoE analysis.
E-beam deposition technique is used to prepare the experimental sample by deposition of 100 nm thick Nickel film on 1 cm × 1 cm Si/SiO2 substrate using E-BEAM System by Kao Duen Technology Corporation which is transferred to PECVD chamber (by Kao Duen Technology Corporation). Graphene deposition process using PECVD method might possibly result into samples either with or without Graphene. Hence an Attribute Response (positive if Graphene is present and negative if Graphene absent) is analyzed. The PECVD chamber pressure is pumped down to 20 mtorr and the recipe for Graphene growth is adjusted based on the factors chosen in Table 3. Specifically, for factor C which is the H2/CH4 gas ratio, the flow rate for H2 is fixed to 50 sccm and the same for CH4 is varied from 5 to 1 sccm in order to produce the gas ratios of 10 and 50, respectively.
The apparatus schematic for Graphene synthesis using PECVD method is shown in Figure 1.
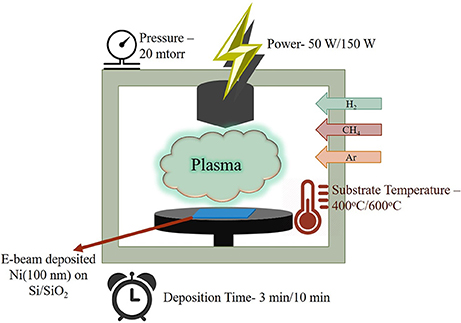
Figure 1. Schematic of PECVD chamber for Graphene synthesis. 100 nm of Nickel film on Si/SiO2 substrate is treated with 2 levels of substrate temperature, RF power, H2/CH4 ratio, deposition time, Ar flux in a PECVD chamber. The recipe is adjusted as per the levels chosen for DoE analysis.
To reduce the number of experiments with 5 factors, which would be 25 = 32, Factorial DoE experiment is employed in this work, and we consider LF−2 analysis where L represents number of levels i.e., 2, and F represents number of factors i.e., 5. Thus, only eight experimental runs are needed, and the experimental conditions are presented in Table 3. In order to have five replicates, five samples are kept in the PECVD chamber for each experimental run.
The construction of the experimental conditions in Table 3 can be referenced to (Montgomery and Runger, 2010). Here all eight possible combinations of levels for factors A, B, C are considered while the levels for factors D and E are chosen using Design Generators AB and AC, respectively.
Table 4 shows the summary of all the experimental runs where disordered graphite (Boyd et al., 2015) deposition for 2nd and 6th experimental runs. On the contrary, successful Graphene deposition occurred for 4th and 8th experimental runs only. These are verified by characterization of the experimental samples using Raman Spectroscopy (the equipment used is PTT RAMaker Micro Raman/PL/TR-PL Spectrometer by Protrustech Company Limited). The laser excitation wavelength used is 473 nm and the laser spot size is 0.5 μm in diameter). Five different points on a sample is scanned for Raman spectrum.
The appearance of ID, IG, and I2D peaks in the Raman Spectrum (Ferrari and Robertson, 2001; Ferrari, 2007) of 4th and 8th experimental runs are shown in Figure 2.
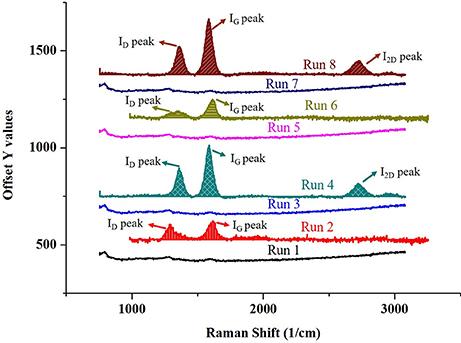
Figure 2. Raman Spectrum for all eight experimental runs; successful Graphene deposition for runs 4 and 8 is evident by the appearance of ID, IG, and I2D peaks whereas for runs 2 and 6 result in disordered graphene signature. Runs 1, 3, 5, and 7 result in flat Raman characteristics.
The value of pg in Table 4 indicates the proportion of samples out of five replicates, with the presence of Graphene on them at each of the five points. The proportion, pg is treated with the Arcsine (or inverse sine: sin−1) transformation which is often used to “normalize” data comprising of percentage or proportion (Dytham, 2011; Jayakumar, 2018).
Figure 3 shows the main effect plots (obtained using Minitab Trial Version 17) of the five factors with respect to the Arcsin [sqrt(pg)] which is the response in this case.
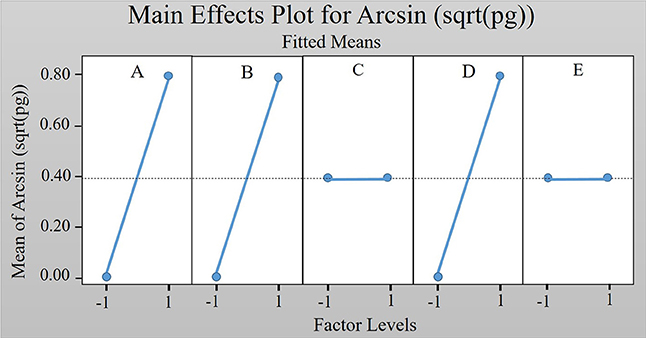
Figure 3. Main effect plots for the Arcsin [sqrt(pg)] response. Factors “A,” “B,” and, “D” show the main effects.
Main effect plots are often used in DoE analysis to observe the average change in a response as a result of variations in the factors' level (Spall, 2010). Non-horizontal main effect plots represent different levels of the factor affecting the response differently and steepness of the slope of such plots indicates magnitude of the main effect. On the other hand, horizontal (parallel to the x-axis) main effect plots indicate absence of main effects (Jayakumar, 2018). Figure 3 indicates that factors A, B, and D are non-parallel and thus, they affect the response.
Figure 4 shows the normal plot of the effects obtained by Attribute-Response Fractional-Factorial DoE analysis (using Minitab Trial Version 17) which reaffirms that factor A which is Temperature, factor B which is RF power and factor C which is deposition time, are significant.
The variation in the outcome-responses due to variation in factors individually are vulnerable to the noise occurring in the experiments, and only suitable and correct statistical significance should be the basis for considering the main effects. In order to test for statistical significance, Analysis of Variance (ANOVA) statistics are used and presented in Table 5.
Table 5 indicates that factors A, B, and D are statistically significant for the response at 1% significant level as the P < 0.01 and is consistent with the Normal plot in Figure 4. Note here that the P-values for factors C and E are also zero, and their zero is due to the zero sum of square, and hence they are not considered as statistically significant.
Here a worth noting point is that lower order Interaction terms other than BC and BE (both are statistically insignificant as shown in Table 5 due to zero value of sum of squares and hence a null P-value) are not considered and are removed because they are confounding in nature which means that their effects cannot be estimated separately from one another (Minitab Assistant White Paper). For example, interaction term AD is confounded with factor B because D = AB (Design Generator), so AD = A.AB = B (A.A is always unity) (Lorenzen and Anderson, 1993; Minitab Assistant White Paper1). Similarly other interaction terms are confounded with the terms present in Table 4 and are removed.
On the other hand, higher order interaction terms, are pooled as an estimate of error (Montgomery and Runger, 2010) because three-factor, four-factor and five-order interactions are negligible and the system is dominated by main effects and lower order interactions as governed by Sparsity Effects Principle (Montgomery and Runger, 2010).
Figure 5 shows the predicted recipe based on our DoE analysis. This prediction is generated by Response Optimizer tool (Minitab.com, 2018) which takes in account the combined effect of levels of the factors under consideration, in order to maximize the chances of growth of Graphene which is the value of Arcsin [sqrt(pg)] in our case and minimize the chances of obtaining disordered graphite. It predicts that for a recipe of 600°C temperature (high level for factor A), 150 W RF power (high level for factor B), H2/CH4 gas flux ratio of 50 (high level for factor C), 10 min of deposition time (high level for factor D), and 10 sccm of Argon (low level for factor E), the outcome-response will be synthesis of Graphene with 95% confidence level.
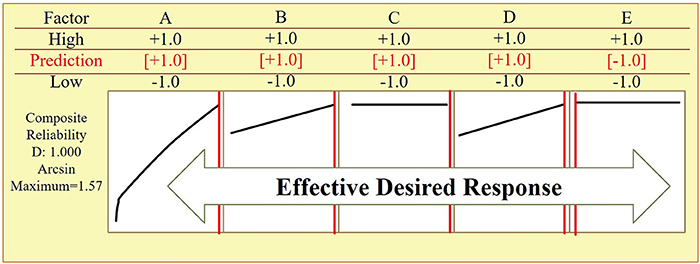
Figure 5. Predicted recipe based on the DoE analysis indicating high levels of factors “A,” “B”, “C,” “D” while low level of factor “E” will result in effective desired response of synthesizing Graphene.
This outcome predicted through the DoE analysis is indeed verified experimentally by running an experiment based on the predicted recipe and examine its Graphene signature using Raman Characteristics. Figure 6 shows the Raman spectrum for the experimental run of predicted recipe.
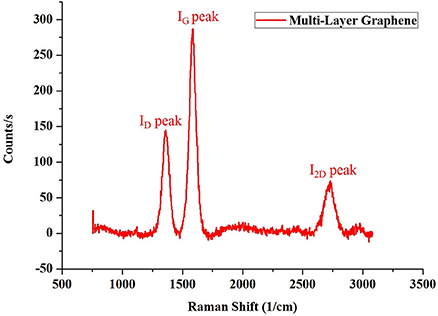
Figure 6. Raman spectrum for the Ni sample treated with a recipe of 600°C temperature, 150 W RF power, H2/CH4 gas flux ratio of 50, 10 min of deposition time and 10 sccm of Argon in PECVD chamber. Presence of ID, IG peaks, and a significant I2D confirms presence of Graphene.
Figure 6 depicts presence of multi-layer Graphene (Ferrari and Robertson, 2001; Ferrari, 2007) synthesis based on the predicted recipe in Figure 5 as ID/IG and I2D/IG ratios are 0.517 and 0.189, respectively.
The novelty of this work lies in the ability of such implementation, to evaluate the extent of each parameter contributing to the possibility of Graphene growth. This work exhibits a qualification analysis in order to determine the key factors and their extent of significance which will facilitate the growth process. The optimized growth recipe reveals the best combination of parameters' levels for the desired outcome. This study is the first step toward the Quantitative study which determines the key factors which influence the quality (in terms of defects and number of layers) which makes the design of entire Graphene process systematic and economical. Especially in cases where the number of factors is large and yet with less number of experiments using Fractional-Factorial methodology, we can determine crucial information. Such an implementation also reveals those parameters' combinations which otherwise, is not considered as a part of the experimental runs, but still can be the best ones based on the DoE analysis.
Qualitative Analysis of low temperature Graphene growth on Nickel substrate using PECVD has been successfully implemented using Design-of Experiments. Important process factors which control growth process are studied systematically. Growth temperature, RF power of PECVD chamber and deposition time are the key factors which are found to be significant ones for low temperature Graphene growth. An optimized recipe deduced from the DoE analysis which predicts levels for every factor with 95% confidence level of growing Graphene, is experimentally verified.
All authors listed have made a substantial, direct and intellectual contribution to the work, and approved it for publication.
Source: Ministry of Science and Technology, Taiwan (grant no.: MOST 105-2221-E-182-060).
The authors declare that the research was conducted in the absence of any commercial or financial relationships that could be construed as a potential conflict of interest.
The reviewer MT and handling Editor declared their shared affiliation.
We acknowledge the support of Ministry of Science and Technology, Taiwan and Chang Gung University (CGU). We extend our gratitude to Prof. Chao Sung Lai and staff of Semiconductor Laboratory for the support.
1. ^Minitab Assistant White Paper Design of Experiments (DOE). Available Online at: http://support.minitab.com/en-us/minitab/17/Assistant_DOE.pdf (Accessed January 5, 2018).
Allen, M. J., Tung, V. C., and Kaner, R. B. (2010). Honeycomb carbon: a review of graphene. Chem. Rev. 110, 132–145. doi: 10.1021/cr900070d
Balandin, A. A., Ghosh, S., Bao, W., Calizo, I., Teweldebrhan, D., Miao, F., et al. (2008). Superior thermal conductivity of single-layer graphene. Nano Lett. 8, 902–907. doi: 10.1021/nl0731872
Boyd, D. A., Lin, W. H., Hsu, C. C., Teague, M. L., Chen, C. C., Lo, Y. Y., et al. (2015). Single-step deposition of high-mobility graphene at reduced temperatures. Nat. Commun. 6:6620. doi: 10.1038/ncomms7620
Dytham, C. (2011). Choosing and Using Statistics a Biologist's Guide, 3rd Edn. Hoboken, NJ: Wiley-Blackwell.
Ferrari, A. C. (2007). Raman spectroscopy of graphene and graphite: disorder, electron-phonon coupling, doping and nonadiabatic effects. Solid State Commun. 143, 47–57. doi: 10.1016/j.ssc.2007.03.052
Ferrari, A. C., and Robertson, J. (2001). Resonant Raman spectroscopy of disordered, amorphous, and diamondlike carbon. Phys. Rev. B 64, 1–13. doi: 10.1103/PhysRevB.64.075414
Geim, A. K., and Novoselov, K. S. (2007). The rise of graphene. Nat. Mater. 6, 183–191. doi: 10.1038/nmat1849
Jayakumar, M. (2018). Design of Experiments (DOE). Available online at: https://www.isixsigma.com/tools-templates/design-of-experiments-doe/ (Accessed January 5, 2018).
Junlei, Q., Lixia, Z., Jian, C., Weitao, Z., Xin, W., and Jicai, F. (2012). Synthesis of graphene on a Ni film by radio-frequency plasma-enhanced chemical vapor deposition. Spec. ISSUE Graphene 57, 3040–3044. doi: 10.1007/s11434-012-5120-4
Kamal, N., Cutie, A. J., Habib, M. J., and Zidan, A. S. (2015). QbD approach to investigate product and process variabilities for brain targeting liposomes. J. Liposome Res. 25, 175–190. doi: 10.3109/08982104.2014.968854
Kim, Y., Song, W., Lee, S. Y., Jeon, C., Jung, W., Kim, M., et al. (2011). Low-temperature synthesis of graphene on nickel foil by microwave plasma chemical vapor deposition. Appl. Phys. Lett. 98:263106. doi: 10.1063/1.3605560
Lorenzen, T. J., and Anderson, V. L. (1993). Design of Experiments: A No-Name Approach. Basel; New York, NY: M. Dekker.
Mason, R. L., Gunst, R. F., and Hess, J. L. (1991). Statistical design and analysis of experiments (with applications to engineering and science). Appl. Stoch. Model. Data Anal. 7, 291–291.
Mei, K. C., Guo, Y., Bai, J., Costa, P. M., Kafa, H., Protti, A., et al. (2015). Organic solvent-free, one-step engineering of graphene-based magnetic-responsive hybrids using design of experiment-driven mechanochemistry. ACS Appl. Mater. Interfaces 7, 14176–14181. doi: 10.1021/acsami.5b03577
Minitab.com (2018). What is Response Optimization? Available Online at: http://support.minitab.com/en-us/minitab/17/topic-library/modeling-statistics/using-fitted-models/response-optimization/what-is-response-optimization/ (Accessed January 5, 2018).
Montgomery, D. C., and Runger, G. C. (2010). Applied Statistics and Probability for Engineers. Jefferson, MI: John Wiley & Sons, Inc.
Moser, J., Barreiro, A., and Bachtold, A. (2007). Current-induced cleaning of graphene. Appl. Phys. Lett. 91:163513. doi: 10.1063/1.2789673
Nandamuri, G., Roumimov, S., and Solanki, R. (2010). Remote plasma assisted growth of graphene films. Appl. Phys. Lett. 96:154101. doi: 10.1063/1.3387812
Novoselov, K. S., Fal'ko, V. I., Colombo, L., Gellert, P. R., Schwab, M. G., and Kim, K. (2012). A roadmap for graphene. Nature 490, 192–200.
Novoselov, K. S., Geim, A. K., Morozov, S. V., Jiang, D., Katsnelson, M. I., Grigorieva, I. V., et al. (2005). Two-dimensional gas of massless Dirac fermions in graphene. Nature 438, 197–200. doi: 10.1038/nature04233
Novoselov, K. S., Geim, A. K., Morozov, S. V., Jiang, D., Zhang, Y., Dubonos, S. V., et al. (2004). Electric field effect in atomically thin carbon films. Science 306, 666–669. doi: 10.1126/science.1102896
Peng, K. J., Lin, Y. H., Wu, C. L., Lin, S. F., Yang, C. Y., Lin, S. M., et al. (2015). Dissolution-and-reduction CVD synthesis of few-layer graphene on ultra-thin nickel film lifted off for mode-locking fiber lasers. Sci. Rep. 5:13689. doi: 10.1038/srep13689
Peng, K. J., Wu, C. L., Lin, Y. H., Liu, Y. J., Tsai, D. P., Pai, Y. H., et al. (2013). Hydrogen-free PECVD growth of few-layer graphene on an ultra-thin nickel film at the threshold dissolution temperature. J. Mater. Chem. C 1, 3862–3870. doi: 10.1039/c3tc30332b
Qi, J. L., Zheng, W. T., Zheng, X. H., Wang, X., and Tian, H. W. (2011). Relatively low temperature synthesis of graphene by radio frequency plasma enhanced chemical vapor deposition. Appl. Surf. Sci. 257, 6531–6534. doi: 10.1016/j.apsusc.2011.02.069
Reina, A., Jia, X., Ho, J., Nezich, D., Son, H., Bulovic, V., et al. (2009). Large area, few-layer graphene films on arbitrary substrates by chemical vapor deposition. Nano Lett. 9, 30–35. doi: 10.1021/nl801827v
Spall, J. (2010). Factorial Design for Efficient Experimentation. IEEE Control Syst. Mag. 30, 38–53. doi: 10.1109/MCS.2010.937677
Thiele, S., Reina, A., Healey, P., Kedzierski, J., Wyatt, P., Hsu, P. L., et al. (2010). Engineering polycrystalline Ni films to improve thickness uniformity of the chemical-vapor-deposition-grown graphene films. Nanotechnology 21:015601. doi: 10.1088/0957-4484/21/1/015601
Verma, S., Lan, Y., Gokhale, R., and Burgess, D. J. (2009). Quality by design approach to understand the process of nanosuspension preparation. Int. J. Pharm. 377, 185–198. doi: 10.1016/j.ijpharm.2009.05.006
Vicente, G., Coteron, A., Martinez, M., and Aracil, J. (1998). Application of the factorial design of experiments and response surface methodology to optimize biodiesel production. Ind. Crops Prod. 8, 29–35. doi: 10.1016/S0926-6690(97)10003-6
Wu, Y., Qiao, P., Chong, T., and Shen, Z. (2002). Carbon nanowalls grown by microwave plasma enhanced chemical vapor deposition. Adv. Mater. 14, 64–67. doi: 10.1002/1521-4095(20020104)14:1<64::AID-ADMA64>3.0.CO;2-G
Xu, X., Khan, M. A., and Burgess, D. J. (2011). A quality by design (QbD) case study on liposomes containing hydrophilic API: I. Formulation, processing design and risk assessment. Int. J. Pharm. 419, 52–59. doi: 10.1016/j.ijpharm.2011.07.012
Keywords: design of experiments, low temperature graphene synthesis, optimized growth parameters, plasma, Raman
Citation: Narula U and Tan CM (2018) Qualitative Analysis of Growth Parameters for PECVD Based Low Temperature Synthesis of Graphene Using Design of Experiments. Front. Mater. 5:43. doi: 10.3389/fmats.2018.00043
Received: 17 April 2018; Accepted: 05 July 2018;
Published: 27 July 2018.
Edited by:
Yu-Lin Shen, University of New Mexico, United StatesReviewed by:
Manuel Pereira Dos Santos, Universidade de Évora, PortugalCopyright © 2018 Narula and Tan. This is an open-access article distributed under the terms of the Creative Commons Attribution License (CC BY). The use, distribution or reproduction in other forums is permitted, provided the original author(s) and the copyright owner(s) are credited and that the original publication in this journal is cited, in accordance with accepted academic practice. No use, distribution or reproduction is permitted which does not comply with these terms.
*Correspondence: Cher Ming Tan, Y210YW5AY2d1LmVkdS50dw==
Disclaimer: All claims expressed in this article are solely those of the authors and do not necessarily represent those of their affiliated organizations, or those of the publisher, the editors and the reviewers. Any product that may be evaluated in this article or claim that may be made by its manufacturer is not guaranteed or endorsed by the publisher.
Research integrity at Frontiers

Learn more about the work of our research integrity team to safeguard the quality of each article we publish.