 Mingyu Huo1,2†
 Min Pang2,3†
 Xuli Ma4Penggong Wang5Chang Sun2,3
 Yulong Zhang2,3Yuchen Gong2,3
 Zhenwei Sun2,3
 Zhaohui Zhang2,3
 Zongling Wang2,3
 Pei Qu2,3*
 Xianxiang Luo1,3*
- 1Institute of Coastal Environmental Pollution Control, Ministry of Education Key Laboratory of Marine Environment and Ecology, and College of Environmental Science and Engineering, Ocean University of China, Qingdao, Shandong, China
- 2Marine Ecology Research Center, First Institute of Oceanography, Ministry of Natural Resources of the People’s Republic of China, Qingdao, Shandong, China
- 3Laboratory for Marine Ecology and Environmental Science, Qingdao Marine Science and Technology Center, Qingdao, Shandong, China
- 4Inspection & Testing Center, China Certification & Inspection Group Shandong Co., LTD., Shinan District, Qingdao City, Shandong, China
- 5China Certification & Inspection Group Shandong Testing Co., LTD., Qingdao, Shandong, China
Introduction: Mercury (Hg) and its organic forms can accumulate in marine organisms, undergoing biomagnification as they transfer through food chains. However, the factors affecting such Hg biomagnification are not fully understood.
Methods: This study analyzed the biomagnification of total mercury (THg) and methylmercury (MeHg) in marine food chains represented by invertebrates and fish from the offshore waters of Changshan Archipelago, grouped into continuous trophic level (TL) ranges based on nitrogen stable isotopic analysis.
Results: Concentrations of THg and MeHg ranged from 4.8 ng/g to 115.4 ng/g and 1.8 ng/g to 47.3 ng/g in invertebrates, and from 3.7 ng/g to 102.1 ng/g and 0.5 ng/g to 67.6 ng/g in fish, with TL ranges for invertebrates and fish of 1.27–2.70 and 1.97–3.60, respectively. Hg concentration increased with increasing TLs in both fish and invertebrates. Combined with nitrogen stable isotopic analysis, trophic magnification factors (TMF) were 1.51 and 1.16 for THg and MeHg in fish, and 1.95 and 1.71 for THg and MeHg in invertebrates, respectively, indicating the biomagnification of THg and MeHg in the study area. Further analysis of Hg biomagnification showed higher TMF values of Hg in both invertebrate and fish groups with higher δ13C values, suggesting that food sources influenced Hg biomagnification in marine organisms.
Discussion: Food sources with lower δ13C values might reduce biomagnification efficiency of both THg and MeHg within marine fauna. These results aided understanding of Hg biomagnification in marine food chains and provided a reference for developing ways to harness Hg pollution.
1 Introduction
Mercury (Hg) is a global pollutant, present within the atmosphere, hydrosphere, ecosphere, and biosphere, and can affect human and ecosystem health as a result of its strong biological toxicity (Driscoll et al., 2013; van Rooyen et al., 2023). Hg and its organic compounds pose a significant concern in marine ecosystems due to their strong toxicity, long-lasting presence, and tendency to accumulate in marine organisms (Niu et al., 2019). Among those organic forms of Hg, methylmercury (MeHg) is the most common; it can be converted from inorganic mercury (IHg) through biological or abiotic processes in aquatic ecosystems (Cao et al., 2020). MeHg can easily be absorbed by marine organisms, which can lead to negative responses in various organ systems at different stages of their life cycle, with resulting neurological and developmental damage in animals and humans (Burgess and Meyer, 2008).
The δ15N stable isotope of nitrogen is used to analyze the trophic levels (TLs) of organisms as a result of its isotopic fraction through food chains; it can also be used to indicate the biomagnification rate of specific pollutants along the food chain, such as Hg (Liu et al., 2019; Cao et al., 2020; Mao et al., 2021; Qu et al., 2022). The biomagnification of Hg among aquatic species has been reporting in studies using δ15N analysis (Lavoie et al., 2013; Liu et al., 2019; Cao et al., 2020; Hilgendag et al., 2022), highlighting the negative effect on human health of the consumption of seafood products. However, within increasing TLs, the increased biomagnification rates of Hg vary because of the varying composition of marine fauna in different locations (Mao et al., 2021; Hilgendag et al., 2022; Qu et al., 2022).
Thus, to monitor local seafood safety to avoid potential health risks from Hg, it is necessary to know how Hg biomagnifies along the food chain and the factors that can affect the Hg biomagnification rate in the environment. There are many factors that can influence Hg biomagnification. For example, Hg biomagnification can increase with latitude, whereas, in warm ecosystems, there might be a decline in the trophic transfer of Hg within aquatic food chains (Lavoie et al., 2013). This decrease can be attributed to a combination of factors such as dilution resulting from growth rate and biomass observed in these highly productive environments (Lavoie et al., 2013).
Higher concentrations of Hg in the surrounding environment can also inhibit the biomagnification of Hg in marine organisms (Lavoie et al., 2013). In addition, the increased complexity of the food chain, as indicated by a wide range of trophic levels and redundancy among benthic organisms, resulted in a decreased efficiency of MeHg transfer between different trophic levels (Hilgendag et al., 2022). Consequently, the MeHg biomagnification rate in benthic food chains was comparatively lower when compared to pelagic or benthopelagic food chains (Hilgendag et al., 2022). Numerous studies have demonstrated that various primary producers, which serve as the main food source in coastal ecosystems—such as macroalgae, seagrasses, and mangroves—possess differing capacities for bioaccumulating heavy metals, including mercury (Hg) (Arisekar et al., 2021; Bonanno et al., 2020a, b). These heavy metals can be transferred to higher TLs through the food chain. Thus, food sources are believed to play a significant role in Hg bioaccumulation (Yoshino et al., 2023), although further research is required to elucidate the specific influence of food sources on Hg biomagnification.
The Changshan Archipelago, located at the confluence of the Bohai and Yellow Seas, has a highly diverse marine fauna and complex food chains, with little industrial pollution; thus, it is an ideal place to study the biomagnification of Hg in a natural aquatic environment. In this study, we conducted analyses on δ13C, δ15N, and concentrations of both THg and MeHg in various organisms. Additionally, the trophic magnification factor (TMF) was calculated to examine the bioaccumulation and biomagnification of Hg in invertebrates and fish inhabiting the offshore waters of Changshan Archipelago. We also explored other factors that might affect the biomagnification rate of Hg along the food chain, such as food source contribution indicated by δ13C values. The results of the study added to our understanding of the potential factors impacting Hg biomagnification in marine organisms, and provided a reference for the prevention and treatment of Hg pollution.
2 Materials and methods
2.1 Sample collection and preparation
Samples were collected from six different sites around the offshore waters of Changshan Archipelago (Figures 1A–F) during October 2023, including a variety of organisms such as invertebrates, fish, and crucial food sources like seagrass and macroalgae consisting of brown algae, red algae, and green algae. The fish and invertebrate samples were collected with the bottom trawler which trawled for 30 – 50 min at each location, maintaining a speed of 2 to 3 knots and an underwater depth of 16–18 m. To explore potential food resources, seagrass and macroalgae samples were manually picked by diving operations in the sample place. After sampling, the basic biological parameters (e.g., length and weight) of each organism were measured and recorded. Each organism was subsequently identified and preserved in polyethylene bags at a temperature of -20°C until further examination in the laboratory. Individual tissues (e.g., muscles) of organisms can offer extended insights into their dietary habits (McIntyre and Flecker, 2006); thus, the white dorsal muscles from every captured fish and the soft tissue of the benthic invertebrates were taken for further stable isotope and Hg analysis. Before analysis, all samples were homogenized.
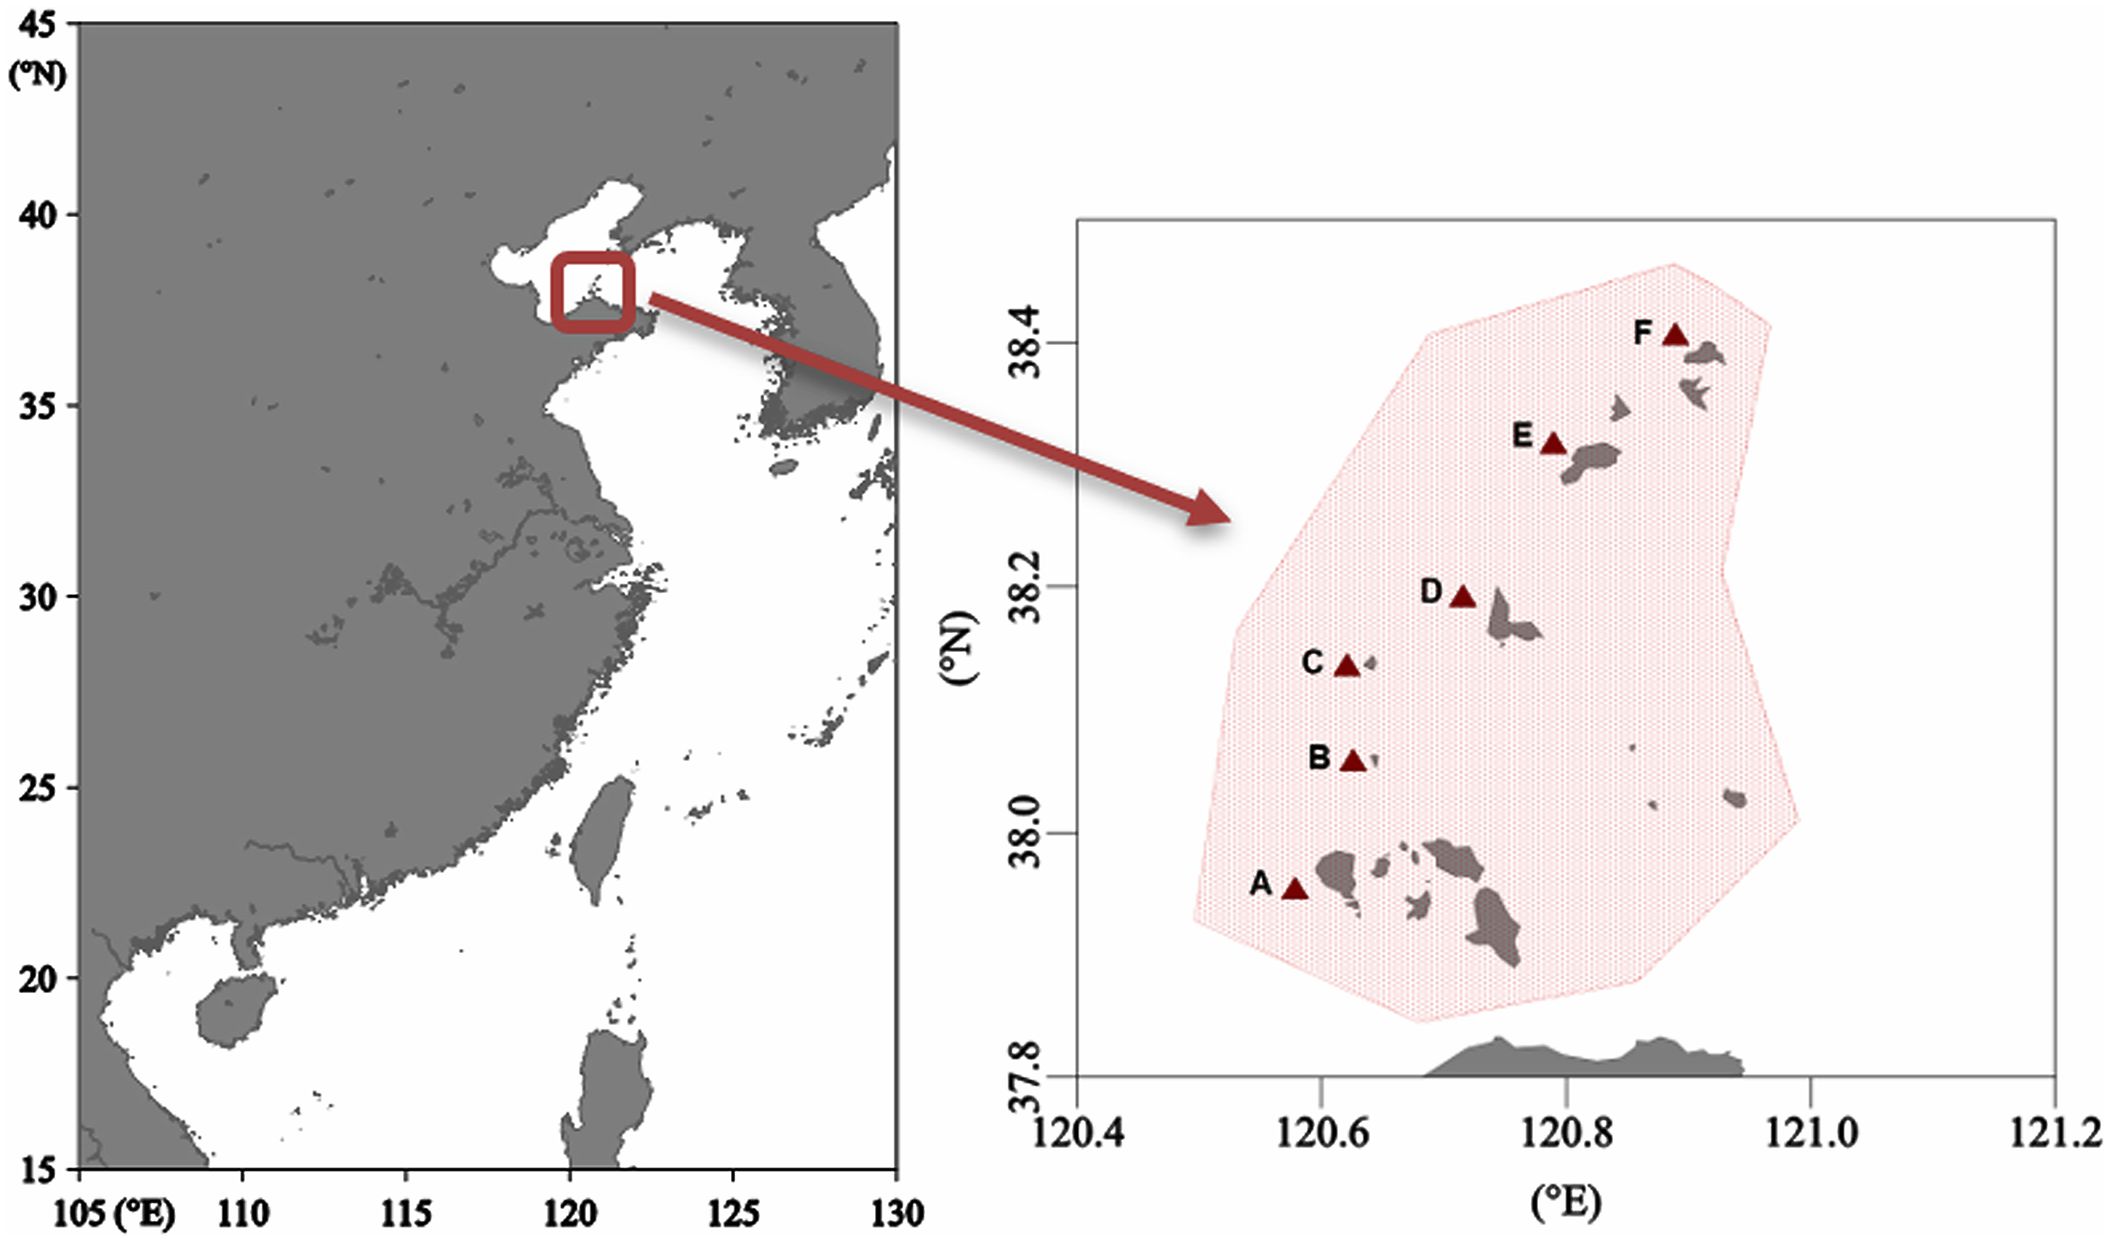
Figure 1. Sampling sites (A–F) in the study area of the offshore waters of Changshan Archipelago.
2.2 Hg analysis
2.2.1 THg analysis
THg levels in wet samples was analyzed according to methods described in the Chinese National Standards (GB 5009.17-2021 National Food Safety Standard-Determination of Total Mercury and Organic-Mercury in Food, 2021). In summary, a homogenized sample weighing 0.5 g was introduced into a microwave digestion tank along with 5 mL of nitric acid. The mixture underwent incubation in the digestion tank for a duration of 1 hr, followed by the addition of hydrogen peroxide (0.5 mL). Subsequently, the digestion was taken overnight within the microwave digestion tank before it was cooled and opened. The solution was moved into a volumetric bottle with a capacity of 25 mL, and then the digestion tank was rinsed with deionized water three times. The rinsing water was combined with the solution transferred previously into the volumetric bottle, diluted with deionized water until the final volume reached 25 mL, and then thoroughly mixed. Furthermore, a test using blank reagents was also conducted. The determination of THg was performed utilizing an atomic fluorescence spectrometer (AFS-930, Beijing JiTian Instrument Ltd., Beijing, China) with two-pass ordinal interaction. Before analysis, the accuracy of the AFS was confirmed using Hg standard solutions with a concentration gradient of 0.00, 0.20, 0.50, 1.00, 1.50, 2.00, and 2.50 μg/L. The concentration of THg in each sample was expressed in X with unit ng/g, calculated using Equation 1:
In the Equation 1, the concentration of THg in the sample solution (μg/L) is denoted as ρ, while ρ0 represents the concentration of THg in the blank (μg/L), V refers to the volume of the sample solution (mL), and m indicates the wet weight of the sample (g).
2.2.2 MeHg analytical method
MeHg within wet samples was analyzed following the method in the Chinese National Standards (GB 5009.17-2021, 2021). In brief, 0.5g of homogenized sample was placed in a plastic tube containing 5 mol/L of hydrochloric acid solution with a volume of 10 mL. The mixture was then subjected to ultrasound treatment at room temperature for 1 hr, followed by centrifugation (8,000 g) at 4°C for 15 minutes. Subsequently, 2 mL of the supernatant was transferred to a volumetric flask with a capacity of 5 mL and the pH level was adjusted to 3–7 using solution of sodium hydroxide (6 mol/L). Afterwards, L-cysteine solution (10 g/L) in an amount of 0.1 mL was added to the volumetric flask, which was then filled up to its final volume of 5mL using deionized water. Finally, the concentration of MeHg in the solution was determined using a high-performance liquid chromatography combined with an atom fluorescence spectrometer instrument (SAP 20, AFS 930, Beijing JiTian Instrument Ltd). Before analysis, the accuracy of the equipment was assessed with MeHg standard solutions with a gradient concentration of 0.0, 1.0, 5.0, 10.0, 30.0, and 50.0 μg/L. The concentration of MeHg was calculated by using Equation 2:
where X is the MeHg concentration in test samples (ng/g), is the dilution factor (2.5 in this study), is the concentration of MeHg in the test sample solution (μg/L), is the MeHg concentration in the blank (μg/L), V is the volume of the test sample solution (mL), and m is the wet weight of the sample (g).
2.2.3 Quality assurance and quality control measures
Certified reference material (CRM) samples for THg (BW-OTL-HW-00044) and MeHg (BW-OTL-PT-00633), purchased from Beijing Micro Standard Object Technology Co., Ltd., China, were digested and analyzed in multiple replicates alongside each batch of samples to ensure quality control and assurance. Procedural blanks, CRMs, as well as invertebrate and fish samples were all analyzed in triplicate, with the mean concentration reported. For all sample types, the percentage relative standard deviation (% RSD) was less than 10%. The recovery rates and detection limits for THg and MeHg from the CRM triplicate analyses were summarized in Table 1.
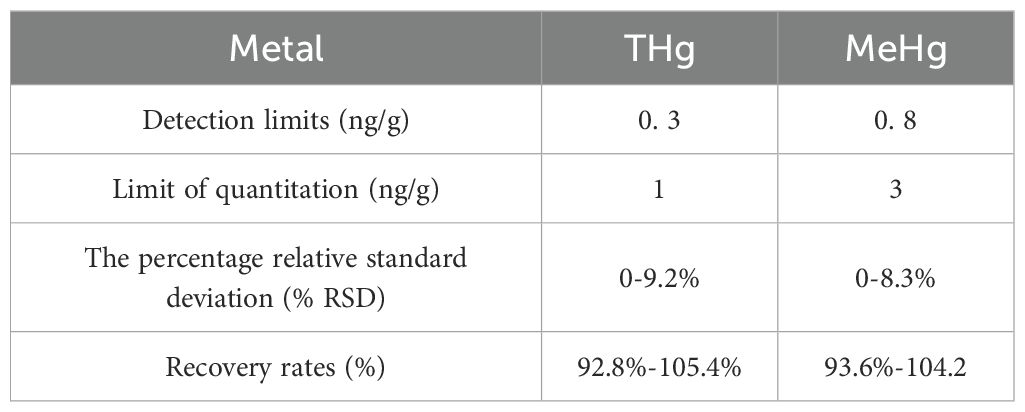
Table 1. Quality assurance/quality control parameters for analysis of THg and MeHg.
2.3 Stable isotope analysis
Both carbon and nitrogen stable isotope values were determined using an online preparation and analysis technique combining an element analyzer (EA-Solink, Thermo Fisher Scientific, Bremen, Germany), an isotope ratio mass spectrometer (DELTA Q, Thermo Fisher Scientific), and the EA-IRMS continuous flow universal interface (Conflo IV, Thermo Fisher Scientific) (Galimov, 2006; Werner and Brand, 2001).
Standard δ unit notation (δ15N, δ13C) was used to express the ratios of stable isotopes, which were defined by Equations 3, 4:
the ratios of heavy carbon and nitrogen isotopes to their lighter counterparts in the samples are denoted as 13C/12Csample and 15N/14Nsample, respectively. The reference standards for 13C and 15N are represented by 13C/12CVPDB (Vienna Pee Dee Belemnite) and by 15N/14Nair (atmospheric nitrogen gas), respectively.
2.4 Calculation of trophic levels
TL determination was based on the fractionation of stable nitrogen isotopes during digestion and metabolism across different levels of the food chain (Caut et al., 2009, 2010), defined by Equations 5–7 revised by Hussey et al. (2014):
where δ15NTL is the ratio of heavy nitrogen isotope to light nitrogen isotope from the samples of the consumers at a given TL, δ15Nlim represents the point at which the nitrogen isotopic saturation occurs as TL increases, δ15Nbase is the average isotope value from the samples of primary producers (7.95‰) in the local food chain, and and are default data, using 5.92 and –0.27 as suggested by Hussey et al. (2014).
2.5 Calculation of trophic magnification
TMF is employed to establish the correlation between pollutant concentration and TL (Fisk et al., 2001) and, thus, to evaluate the magnification of Hg within a food chain using Equations 8, 9:
where LgC presents the THg/MeHg concentration in the organism, while b denotes the slope of the linear equation that expresses how TL is related to the base–10 logarithm of metal concentration within the organism.
2.6 Calculation of food source contributions to fish and inverterbrates
In this study, seagrass and macroalgae were identified as the primary potential food sources for local fish and invertebrates in the study area. To investigate the relationship between Hg biomagnification and food sources, the IsoSource software (Phillips and Gregg, 2003) was utilized to estimate the upper and lower bounds of each source’s contribution. The software evaluated all possible contribution levels ranging from 0% to 100% in small increments of 1–2%.
2.7 Statistical analysis
All statistical analyses were conducted using the SPSSAU 23.0 program (QingSi Technology, Beijing, China). For two-group comparison, P values were obtained through an Independent Samples t-test for normally distributed data and Mann–Whitney nonparametric test for other types of data. A significance level of P < 0.05 was considered to indicate statistical significance in all comparisons.
3 Results
3.1 δ13C and δ15N values for marine organisms from the offshore waters Changshan Archipelago
A total of 136 samples representing 44 species (25 fish species and 19 invertebrate species) were collected for stable isotopic and Hg analysis. The δ13C (‰) values ranged from -22.194 to -16.837 for fish and from -22.647 to -16.784 for invertebrates, respectively. The study area is a seagrass bed where seagrass and macroalgae serve as the main food sources for fish and invertebrates. In this study, the δ13C (‰) values of seagrass ranged from -13.23 to -10.11, while those of macroalgae including brown algae, red algae, and green algae ranged from -29.32 to -11.19 (brown algae: from -27.45 to -14.61; red algae: from -29.32 to -17.70; green algae: from-24.76 to -11.19). The δ15N (‰) values, which indicate trophic levels of marine fauna, ranged from 11.615 to 15.766 for fish and from 9.087 to 13.739 for invertebrates. As shown in Figure 2, the δ15N (‰) values of seagrass ranged from 6.41 to 9.86, and the δ15N (‰) values of brown algae, red algae, and green algae ranged from 3.32 to 11.72, from 6.12 to 10.60, and from 4.72 to 14.64, respectively (Supplementary Tables S1, S2).
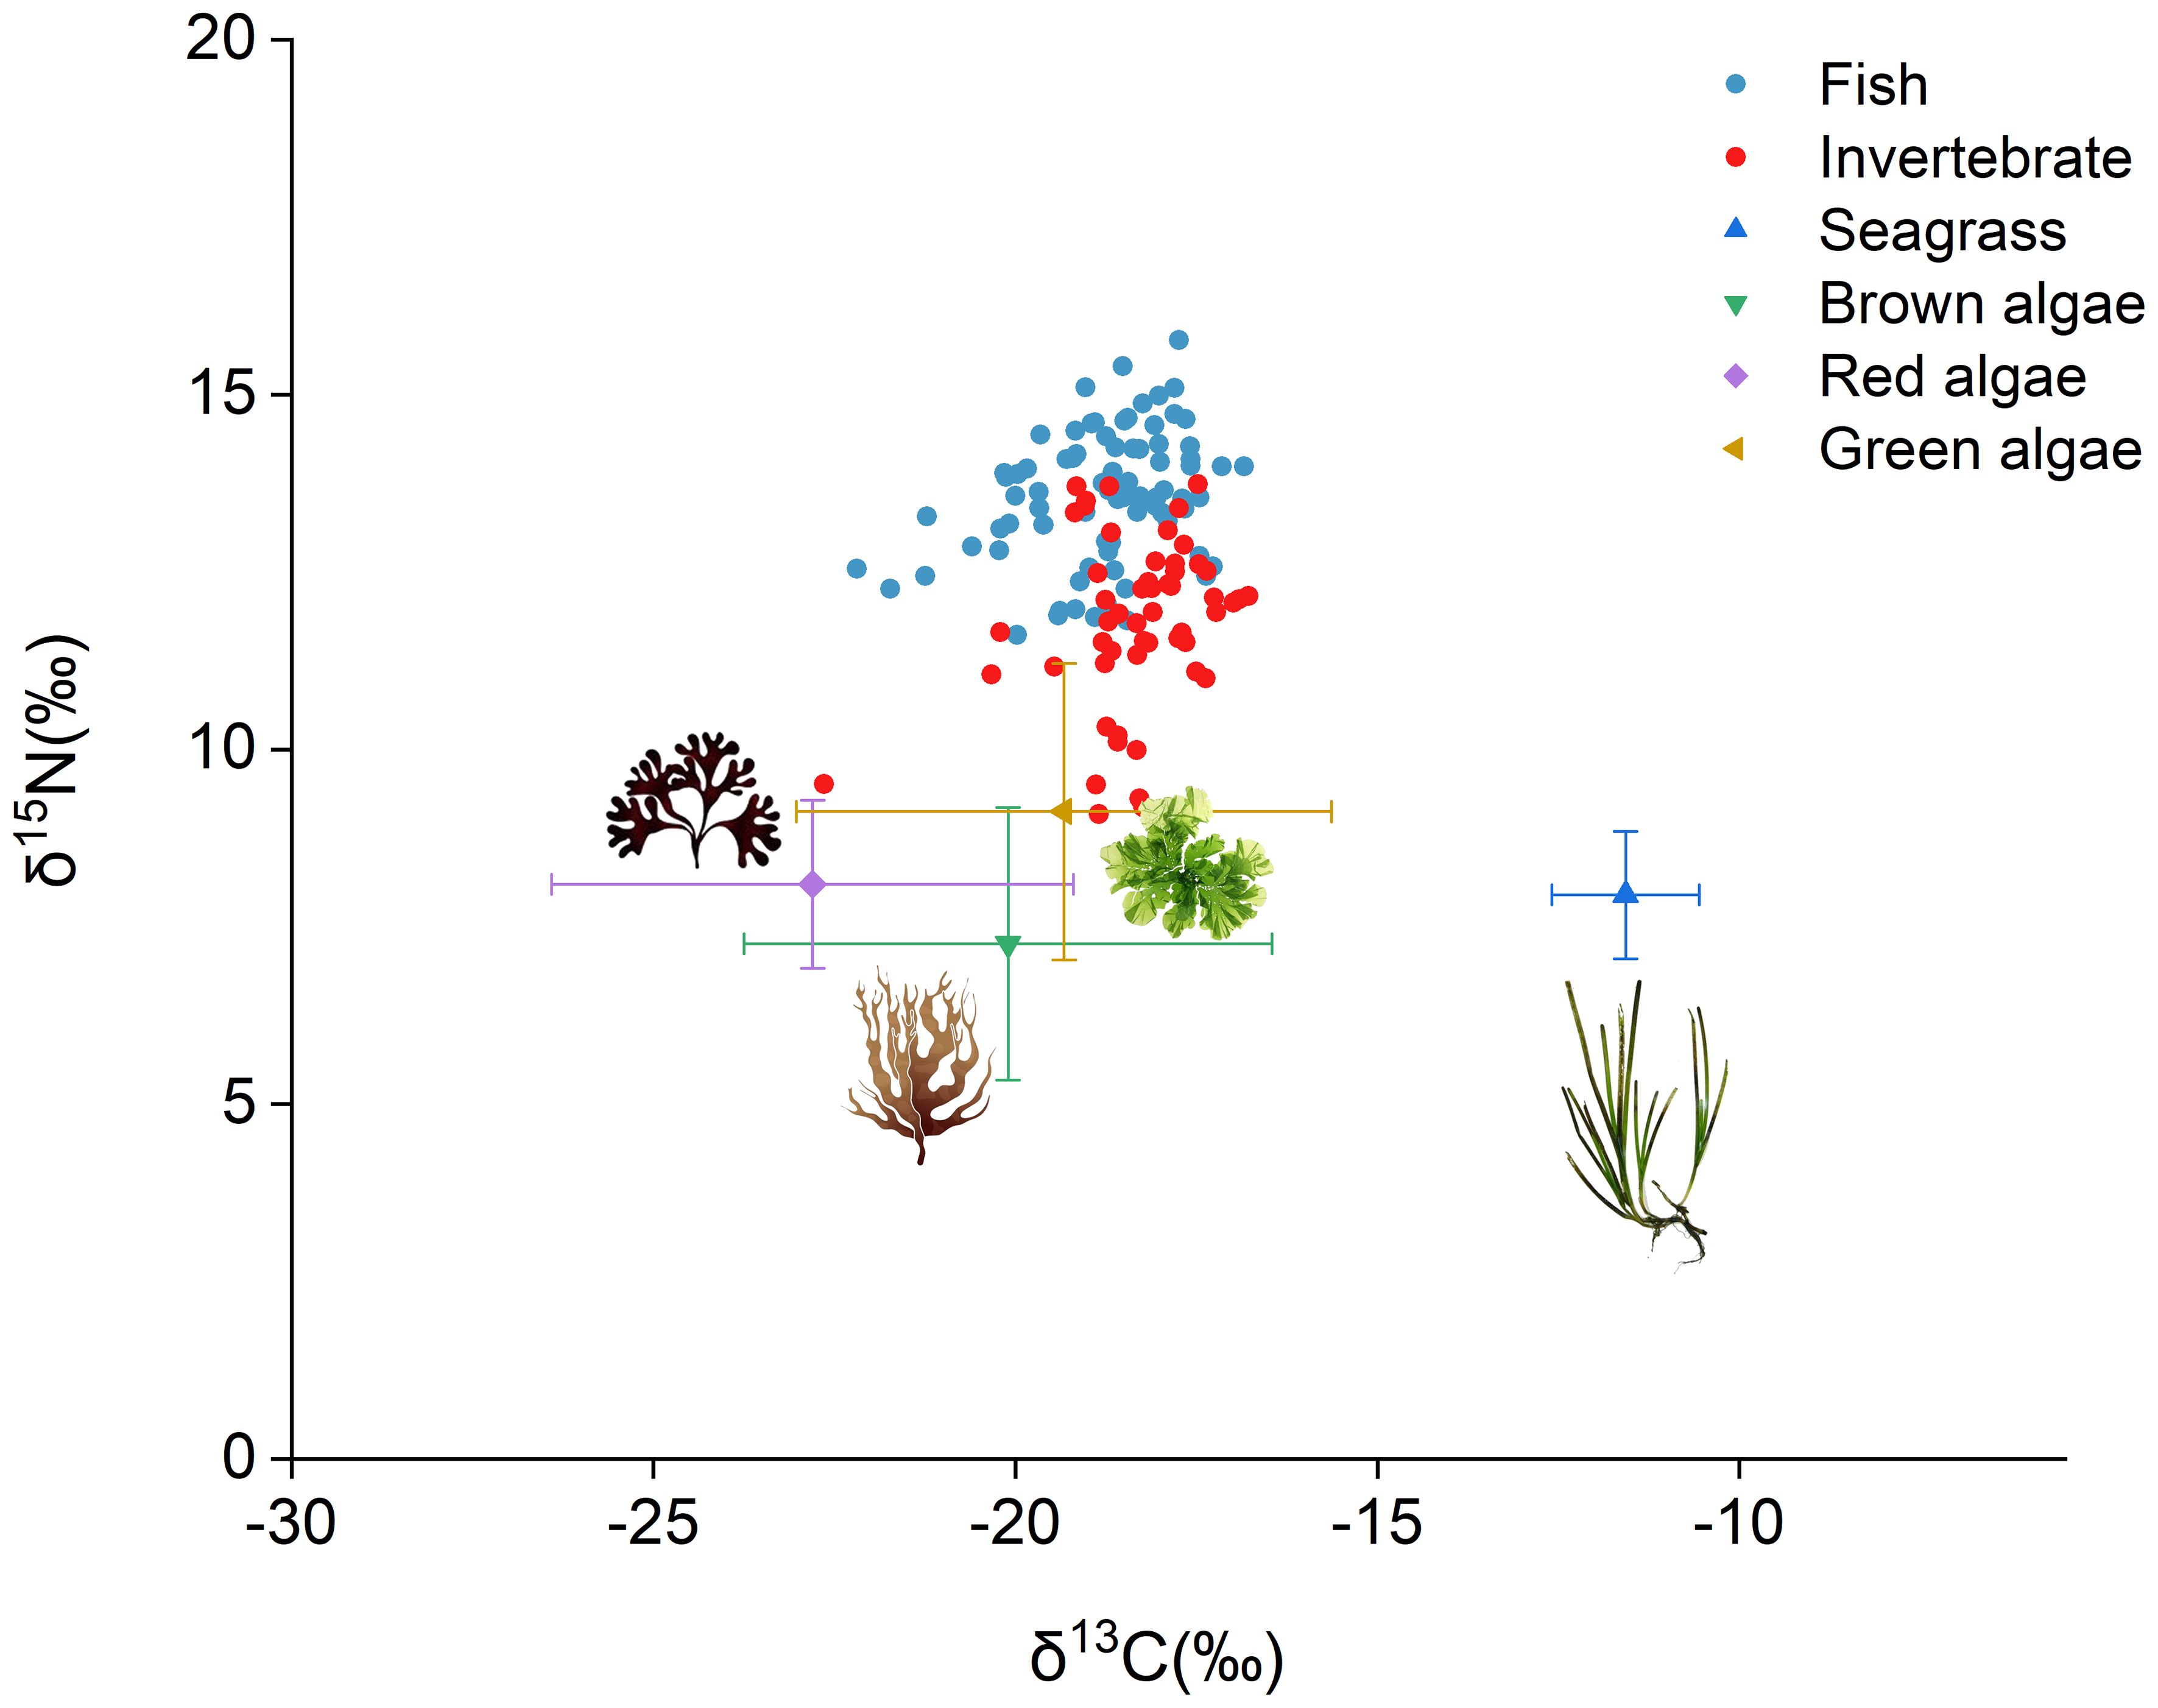
Figure 2. A stable isotope map of δ13C (‰) and δ15N (‰) for fish, invertebrates, and important food resources (seagrass and macroalgae).
3.2 Distribution of THg and MeHg within continuous TLs
Based on δ15N analysis, the fish TLs were exhibited with range from 1.97 to 3.60, and the invertebrate TLs ranged from 1.27 to 2.70. The concentrations of both THg and MeHg in fish varied between3.7 ng/g and 102.1 ng/g, and between.0.5 ng/g to.67.6 ng/g, respectively. In contrast, in invertebrates, THg concentrations ranged from 4.8 ng/g to 115.4 ng/g, and MeHg ranged from 1.8 ng/g to 47.3 ng/g, respectively (Supplementary Table S1) To more accurately illustrate the distribution of THg and MeHg across TLs in the food chain, fish and invertebrate samples were categorized into continuous TL intervals of 0.25 to ensure a relatively uniform sample distribution (2.00–2.25, 2.25–2.50, 2.50–2.75, 2.75–3.00, and 3.00–3.25 for fish samples; and 1.25–1.50, 1.50–1.75, 1.75–2.00, 2.00–2.25, 2.25–2.50, and 2.50–2.75 for invertebrate samples). The concentration of both THg and MeHg in fish and invertebrate generally showed an upward trend as the TL increased, which was particularly evident in the case of THg in invertebrates (Figure 3; Supplementary Table S3).
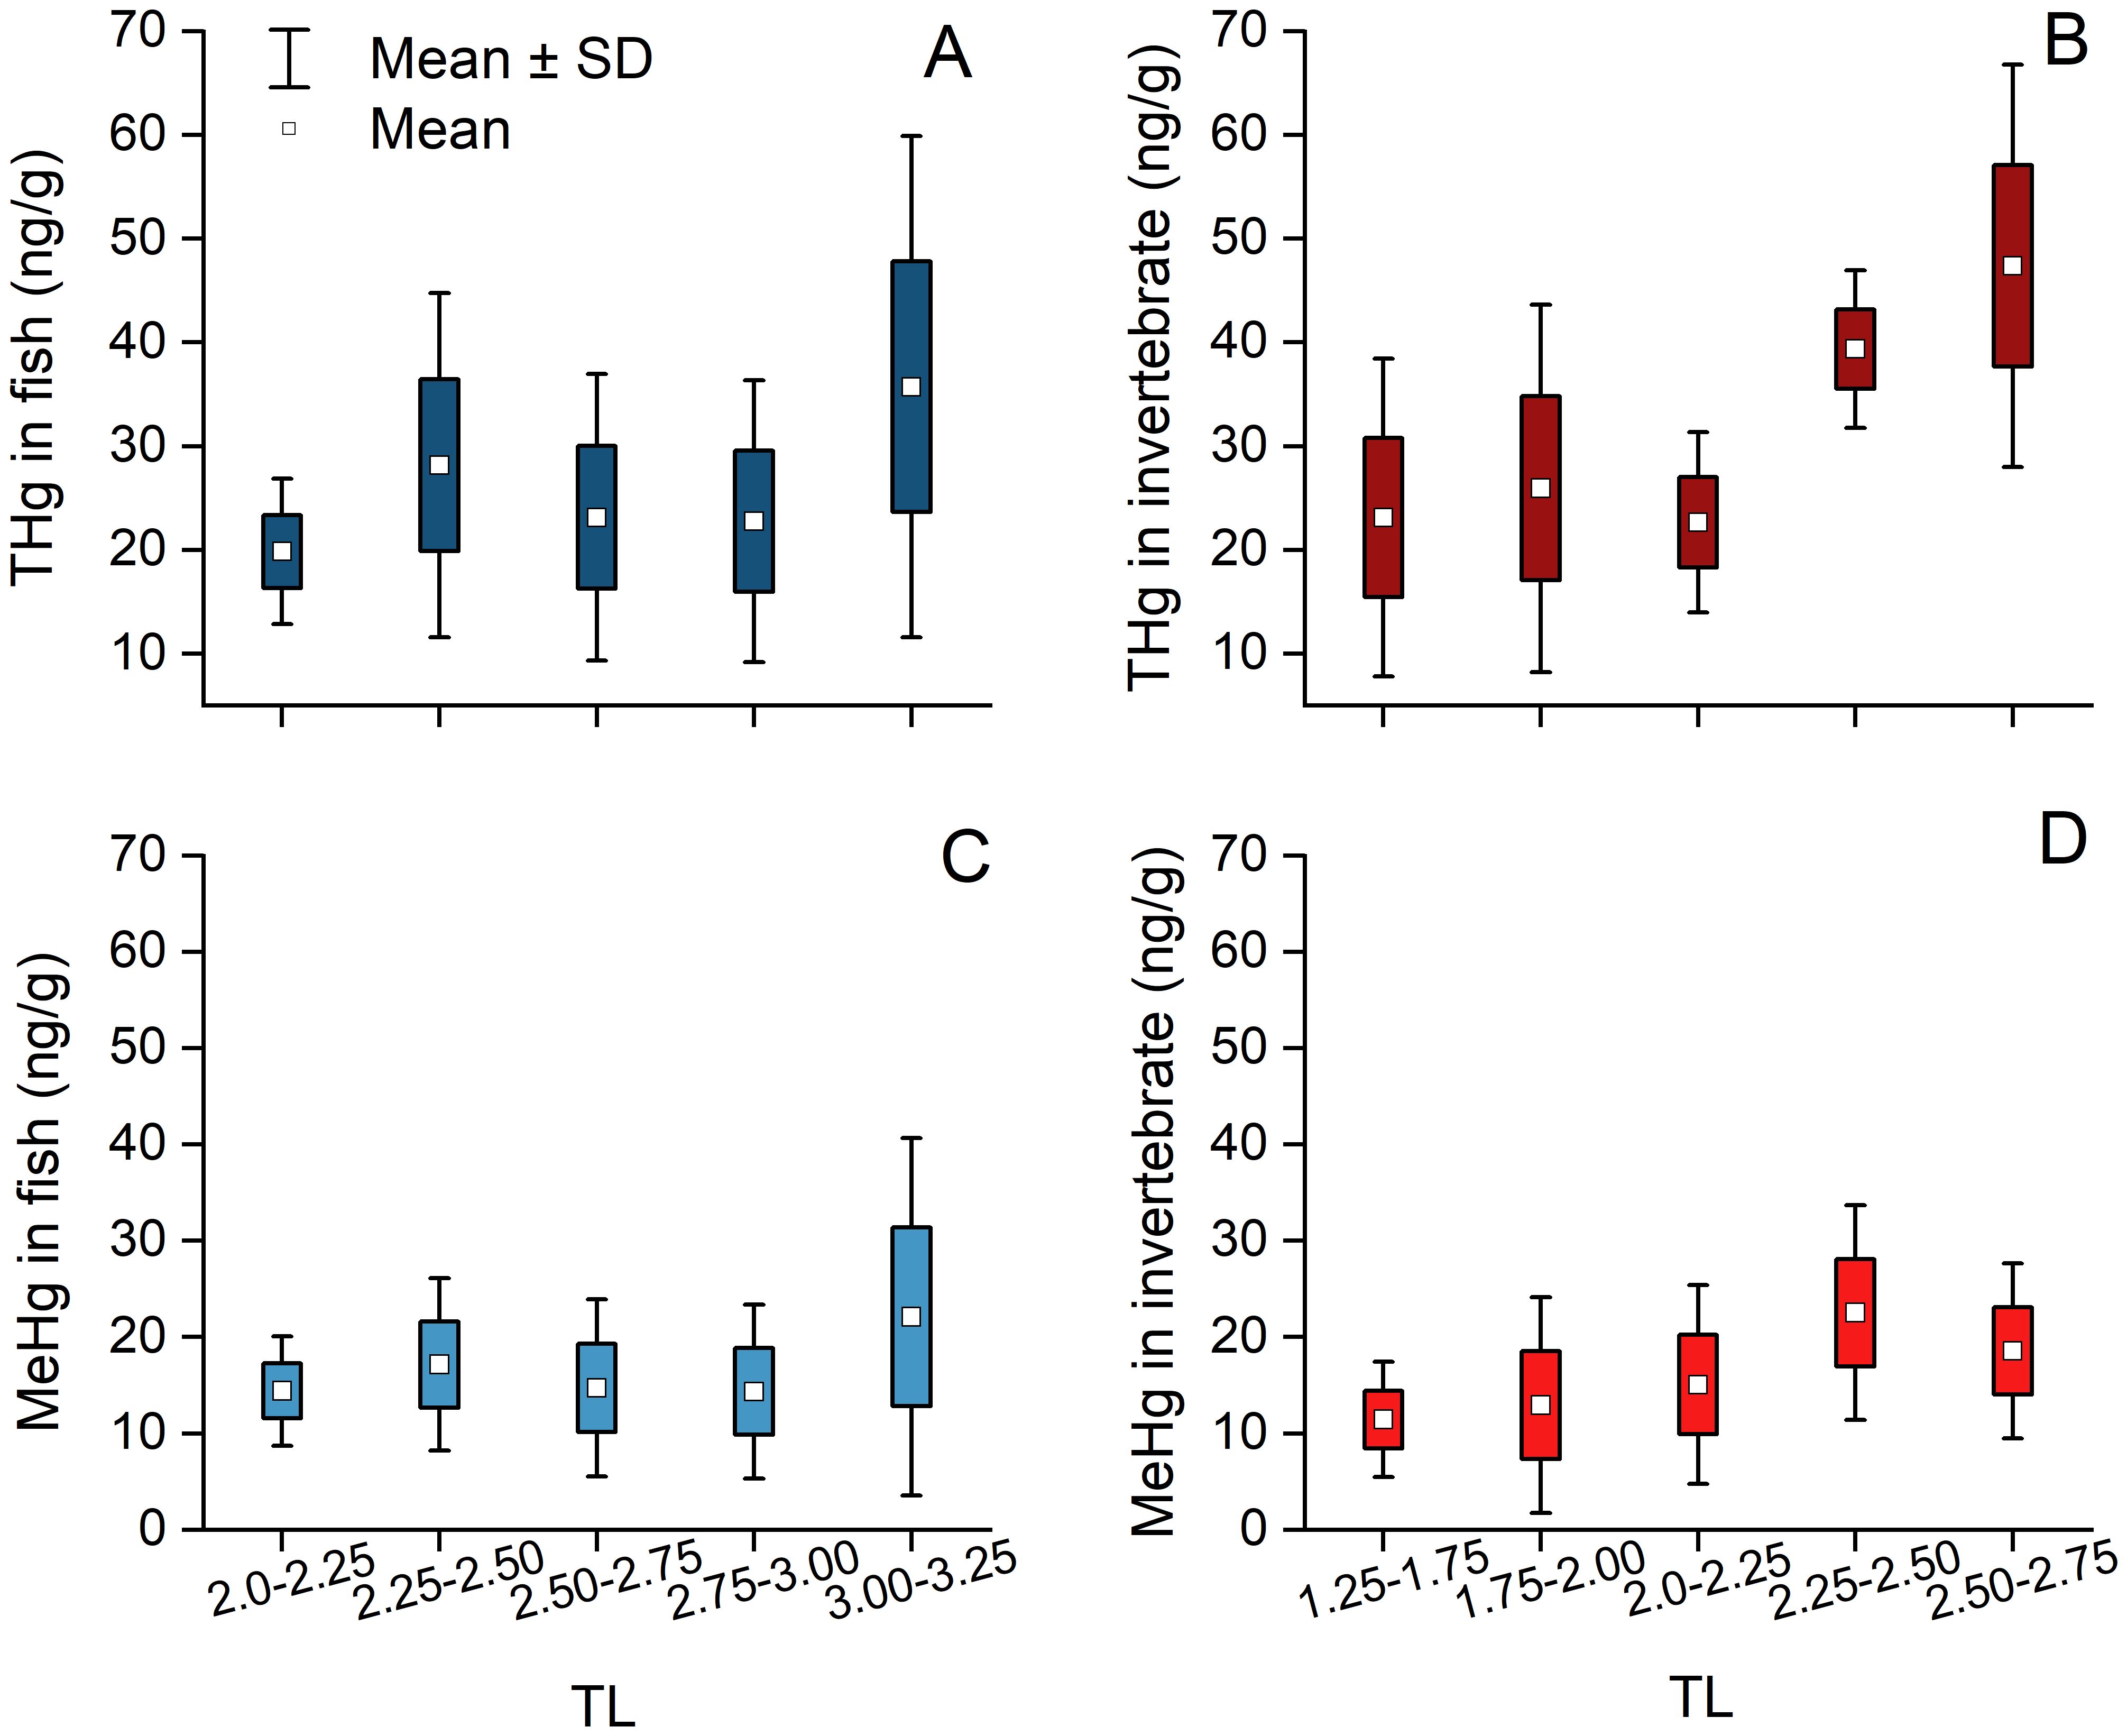
Figure 3. Concentrations of THg (A, B) and MeHg (C, D) in fish and invertebrates within continuous TL ranges. The data represent mean ± standard deviation(SD), while the bars indicate the SD values of Hg concentrations within continuous TL ranges.
3.3 Trophic transfer characteristics of Hg within continuous trophic levels
The TMF method was employed to accurately assess the biomagnification extent of pollutants within trophic levels by establishing a direct correlation between log-transformed pollutant concentrations and TL values of organisms. In this study, a positive linear association was observed between log-transformed THg/MeHg concentrations and both fish and invertebrate TLs (Figure 4). The THg and MeHg trophic magnification slopes of the simple linear regression were 0.179 and 0.066 for fish, and 0.289 and 0.234 for invertebrate, respectively. The corresponding TMF values for THg and MeHg were 1.51 and 1.16 in fish, and 1.95 and 1.71 in invertebrates, respectively.
3.4 The contribution of seagrass and macroalgae as food sources to marine fauna in the Changshan Archipelago
According to the calculations performed using IsoSource software, seagrass contributed 3.3% to 34.7% of fish diets, as shown in Figure 5. Macroalgae collectively accounted for 65.3% to 96.7% of fish diets, with specific contributions as follows: brown algae (4.3% to 34.7%), red algae (16.6% to 89%), and green algae (3.3% to 36.6%). For invertebrates, seagrass contributed between 0% and 38.6%, while macroalgae ranged from 61.4% to 100%. Specifically, brown algae contributed 0% to 32.4%, red algae 15% to 100%, and green algae 0% to 34.5%. Red algae were the predominant food source for both fish and invertebrates, while seagrass, brown algae, and green algae showed comparable contribution rates to marine organisms in the Changshan Archipelago.
4 Discussion
4.1 Hg levels bioaccumulated in marine organisms
In the present study, as described in results, the concentrations of both THg and MeHg in marine organisms from the Changshan Archipelago were lower than those collected from nearby Laizhou Bay (Cao et al., 2020) and the Yellow River Estuary (Qu et al., 2022) (Supplementary Table S4). Compared with other regions, the lower Hg concentration in marine fauna from the Changshan Archipelago might be due to lower Hg concentrations in the seawater around the Changshan Archipelago, where there is less human activity and industrialization [Yellow River Estuary: 0.24 μg/L (Wang et al., 2018); Changshan Archipelago: 0.0487 μg/L (FIO, 2022); Laizhou Bay: 0.23 μg/L (Zhang et al., 2024)].
Previous studies have suggested that invertebrates generally occupy a lower TL compared to fish, resulting in relatively lower concentrations of THg and MeHg accumulation (Liu et al., 2019; Cao et al., 2020; Mao et al., 2021). In the present study, the average trophic level of fish (2.652 ± 0.35) was also significantly higher (P<0.05) than the average trophic level values of invertebrates (2.044 ± 0.37), which confirmed the results in previous studies. However, the differences in Hg levels, both THg and MeHg, between fish and invertebrate samples, were insignificant (P >0.05). THg exhibited a slightly higher degree of biomagnification compared to MeHg along the food chains within the study area. There were many factors that differentially affect Hg biomagnification in fish and invertebrates. For example, Hg levels in sediments and seawater might lead to higher Hg concentrations in invertebrates living in benthic environment via direct absorption (Arcagni et al., 2018), which would then reduce the difference in THg and MeHg levels between fish and invertebrate samples. In addition, other elements, including biological factors, such as species, age, quality of marine organisms, and environmental factors (e.g., temperature and pH), can affect Hg biomagnification (Donald et al., 2015; Hilgendag et al., 2022; Qu et al., 2022).
4.2 Biomagnification of THg and MeHg via trophic tranfer
TMF values for fish and invertebrates collected from the offshore waters of Changshan Archipelago were 1.51 and 1.91 for THg, and 1.16 and 1.61 for MeHg, respectively. The TMF values greater than 1 suggested the occurrence of biomagnification in THg and MeHg among the surveyed marine fauna species from the Changshan Archipelago. Except for the higher TMF value of THg in invertebrates, all other TMF values observed in this study were consistent with previous findings on Hg biomagnification in Laizhou Bay (Cao et al., 2020), the Yellow River Estuary (Qu et al., 2022), and Jiaozhou Bay (Mao et al., 2021) (Supplementary Table S4). As discussed above, these differences could be due to various factors that affect Hg biomagnification within different food chains (Donald et al., 2015; Hilgendag et al., 2022; Qu et al., 2022; Qu et al., 2023).
In the present study, the biomagnification rate of MeHg exhibited a comparatively lower value compared to that observed for THg, as indicated by the TMF values. The findings in this study were opposite to our earlier results from the Yellow River Estuary (Qu et al., 2022) and a global meta-analysis (Lavoie et al., 2013), which attributed the higher TMF values of MeHg compared to other forms of Hg to its superior efficiency in transferring through TLs (Beckers and Rinklebe, 2017). However, the current results in the present study were consistent with the results in the Geum, Han, and Yeongsan Rivers (Kim et al., 2023). Similarly, previous studies have reported consistent trends in specific organisms; for instance, Madgett et al. (2021) noted a decreasing trend in Hg concentration in fish muscles sampled around Scotland as TLs increased. Moreover, Mao et al. (2021) found that while Hg exhibited biomagnification trends with increasing δ15N values in mollusks and fish, this pattern was absent in crustaceans. Numerous factors can influence THg and MeHg concentrations in organisms. Since MeHg is primarily produced in sediments under low-oxygen conditions, while IHg predominates in the water column, Hg from sediments can be more efficiently transferred to benthic marine organisms due to a higher proportion of MeHg in several pathways, leading to greater Hg accumulation at higher TLs (Žižek et al., 2007; Arcagni et al., 2018). Moreover, the inefficient transfer of IHg accumulated in plankton to upper TLs weakens Hg biomagnification along the food chain, so the composition of primary producers within food chains may influence Hg levels in organisms at high TLs (Arcagni et al., 2018). More trophic transfer steps in food chains would also result in higher Hg levels in apex predators (St. Louis et al., 2011). These reports indicated that variations in food chain length or composition, as well as differences in food sources, could influence the conversion efficiency of Hg and its biomagnification.
In this study, the δ13C values of seagrass (-11.57 ± 1.02‰) were significantly higher than those of macroalgae (brown algae: -20.10 ± 3.65‰; red algae: -22.80 ± 3.60‰; green algae: -19.33 ± 3.70‰) (Figure 5; Supplementary Table S5). As shown in Figure 4, fish and invertebrates in the offshore waters of Changshan Archipelago exhibited varying degrees of dietary reliance on seagrass versus macroalgae. To investigate the impact of this dependence on specific food sources on Hg biomagnification along the food chain, fish and invertebrate species were classified into two groups based on their dietary composition. This classification refined the method described by Yoshino et al. (2020) by incorporating contribution values and the average δ13C values of the key food source. Specifically, species with a seagrass contribution exceeding 25.75% to their diet were classified as relatively more dependent on seagrass (S group), while those with a seagrass contribution below 25.75% were classified as relatively less dependent on seagrass and more on macroalgae (M group). This approach ensured that each group had a sufficient sample size to minimize potential errors due to insufficient data. The M group, with seagrass contributions ranging from 0% to 25.75%, included 16 fish and 10 invertebrate species, comprising 56 fish and 26 invertebrate samples. The S group, with seagrass contribution spanning from 25.75% to 38.60%, comprised 9 fish and 9 invertebrate species, consisting of 26 fish and 28 invertebrate samples, respectively. The linear curves fitted between logarithmic transformed THg/MeHg concentrations and TLs revealed that the slopes for both fish and invertebrate samples in the S groups (0.286 and 0.453 for THg, and 0.132 and 0.409 for MeHg) were significantly higher than those in the M group (0.0996 and 0.285 for THg, and -0.0131 and 0.190 for MeHg). This indicated higher corresponding TMFs in the S groups (1.93 and 2.84 for THg, and 1.36 and 2.56 for MeHg). These findings suggested that both fish and invertebrate samples in the S groups, which exhibited greater reliance on seagrass, showed a more pronounced increasing trend compared to those in the M group (Figure 6). This indicated that THg and MeHg were biomagnified to a greater extent in samples with higher δ13C values relative to those with lower δ13C values, while within the group of samples with lower δ13C values, there was no significant increase in THg and MeHg concentrations across rising TLs. This suggested that Hg biomagnification in the offshore waters of Changshan Archipelago depended not only on increases in TL, but also on food sources.
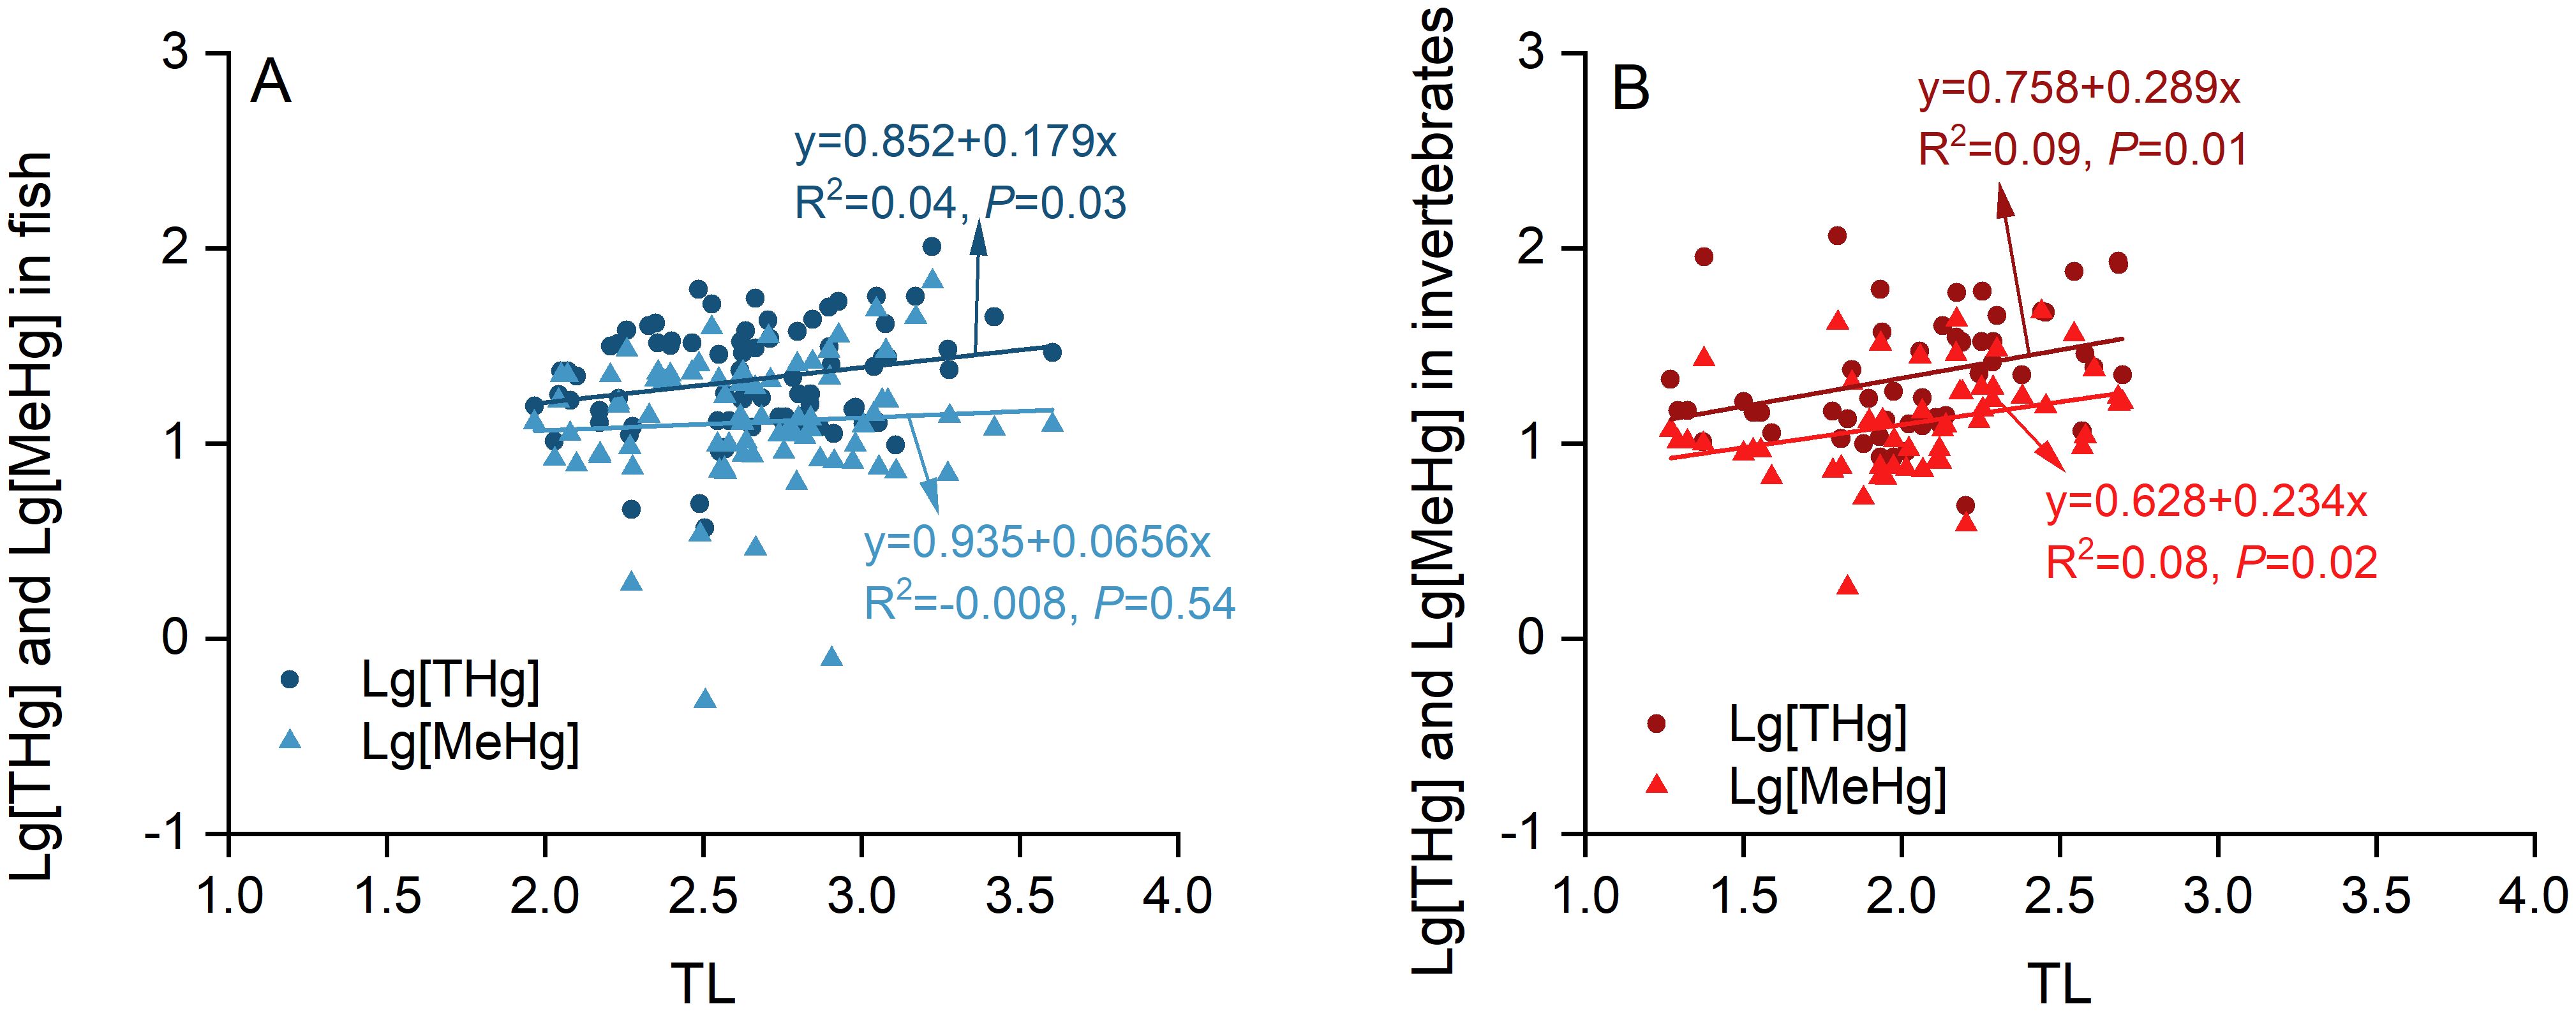
Figure 4. Correlations between log-transformed concentrations of THg and MeHg and TLs in fish (A) and invertebrates (B) from the local food chains.
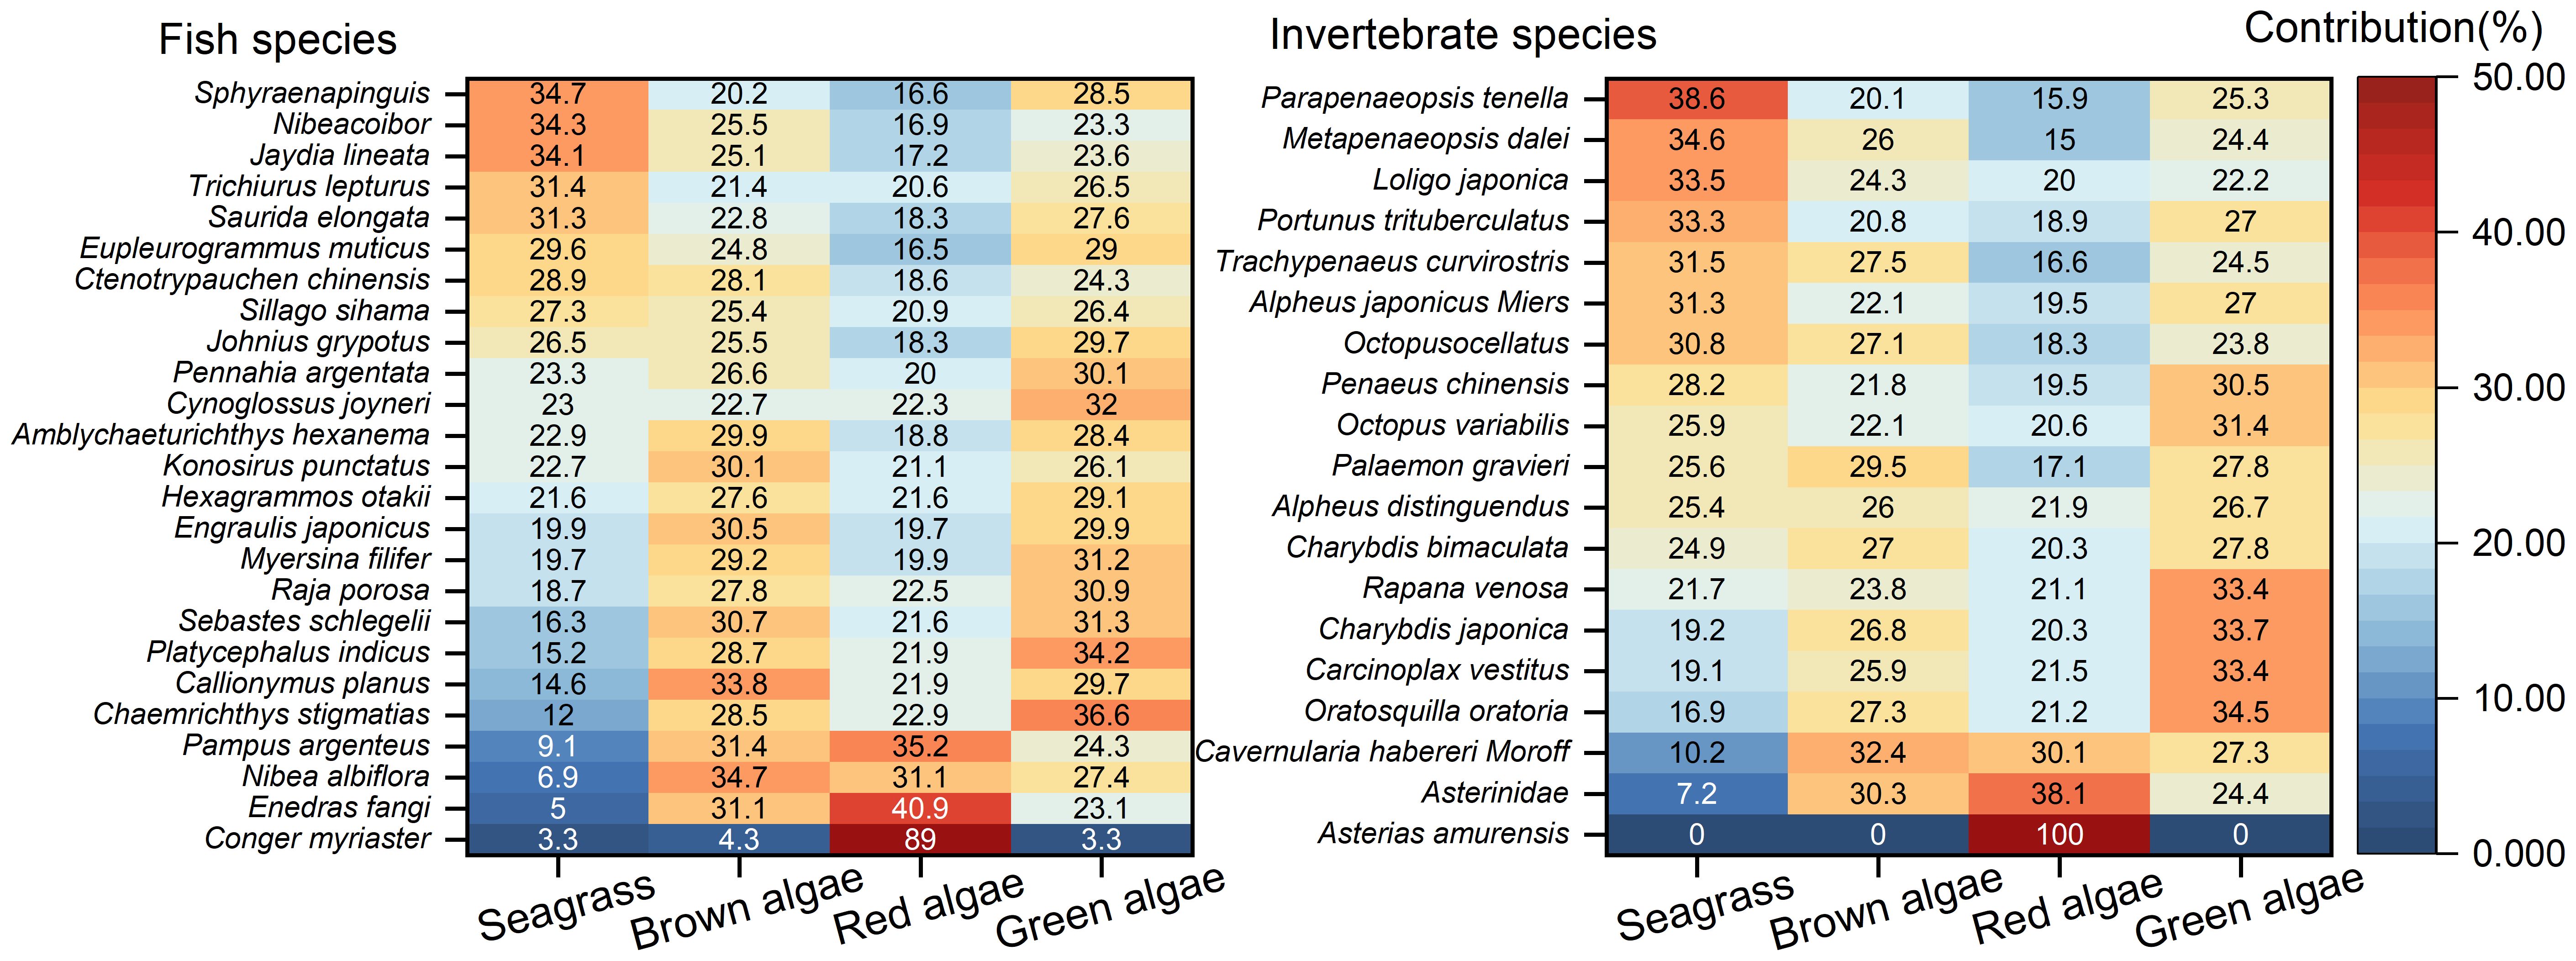
Figure 5. Contributions of seagrass and macroalgae (including brown, red, and green algae) to fish and invertebrates in the Changshan Archipelago.
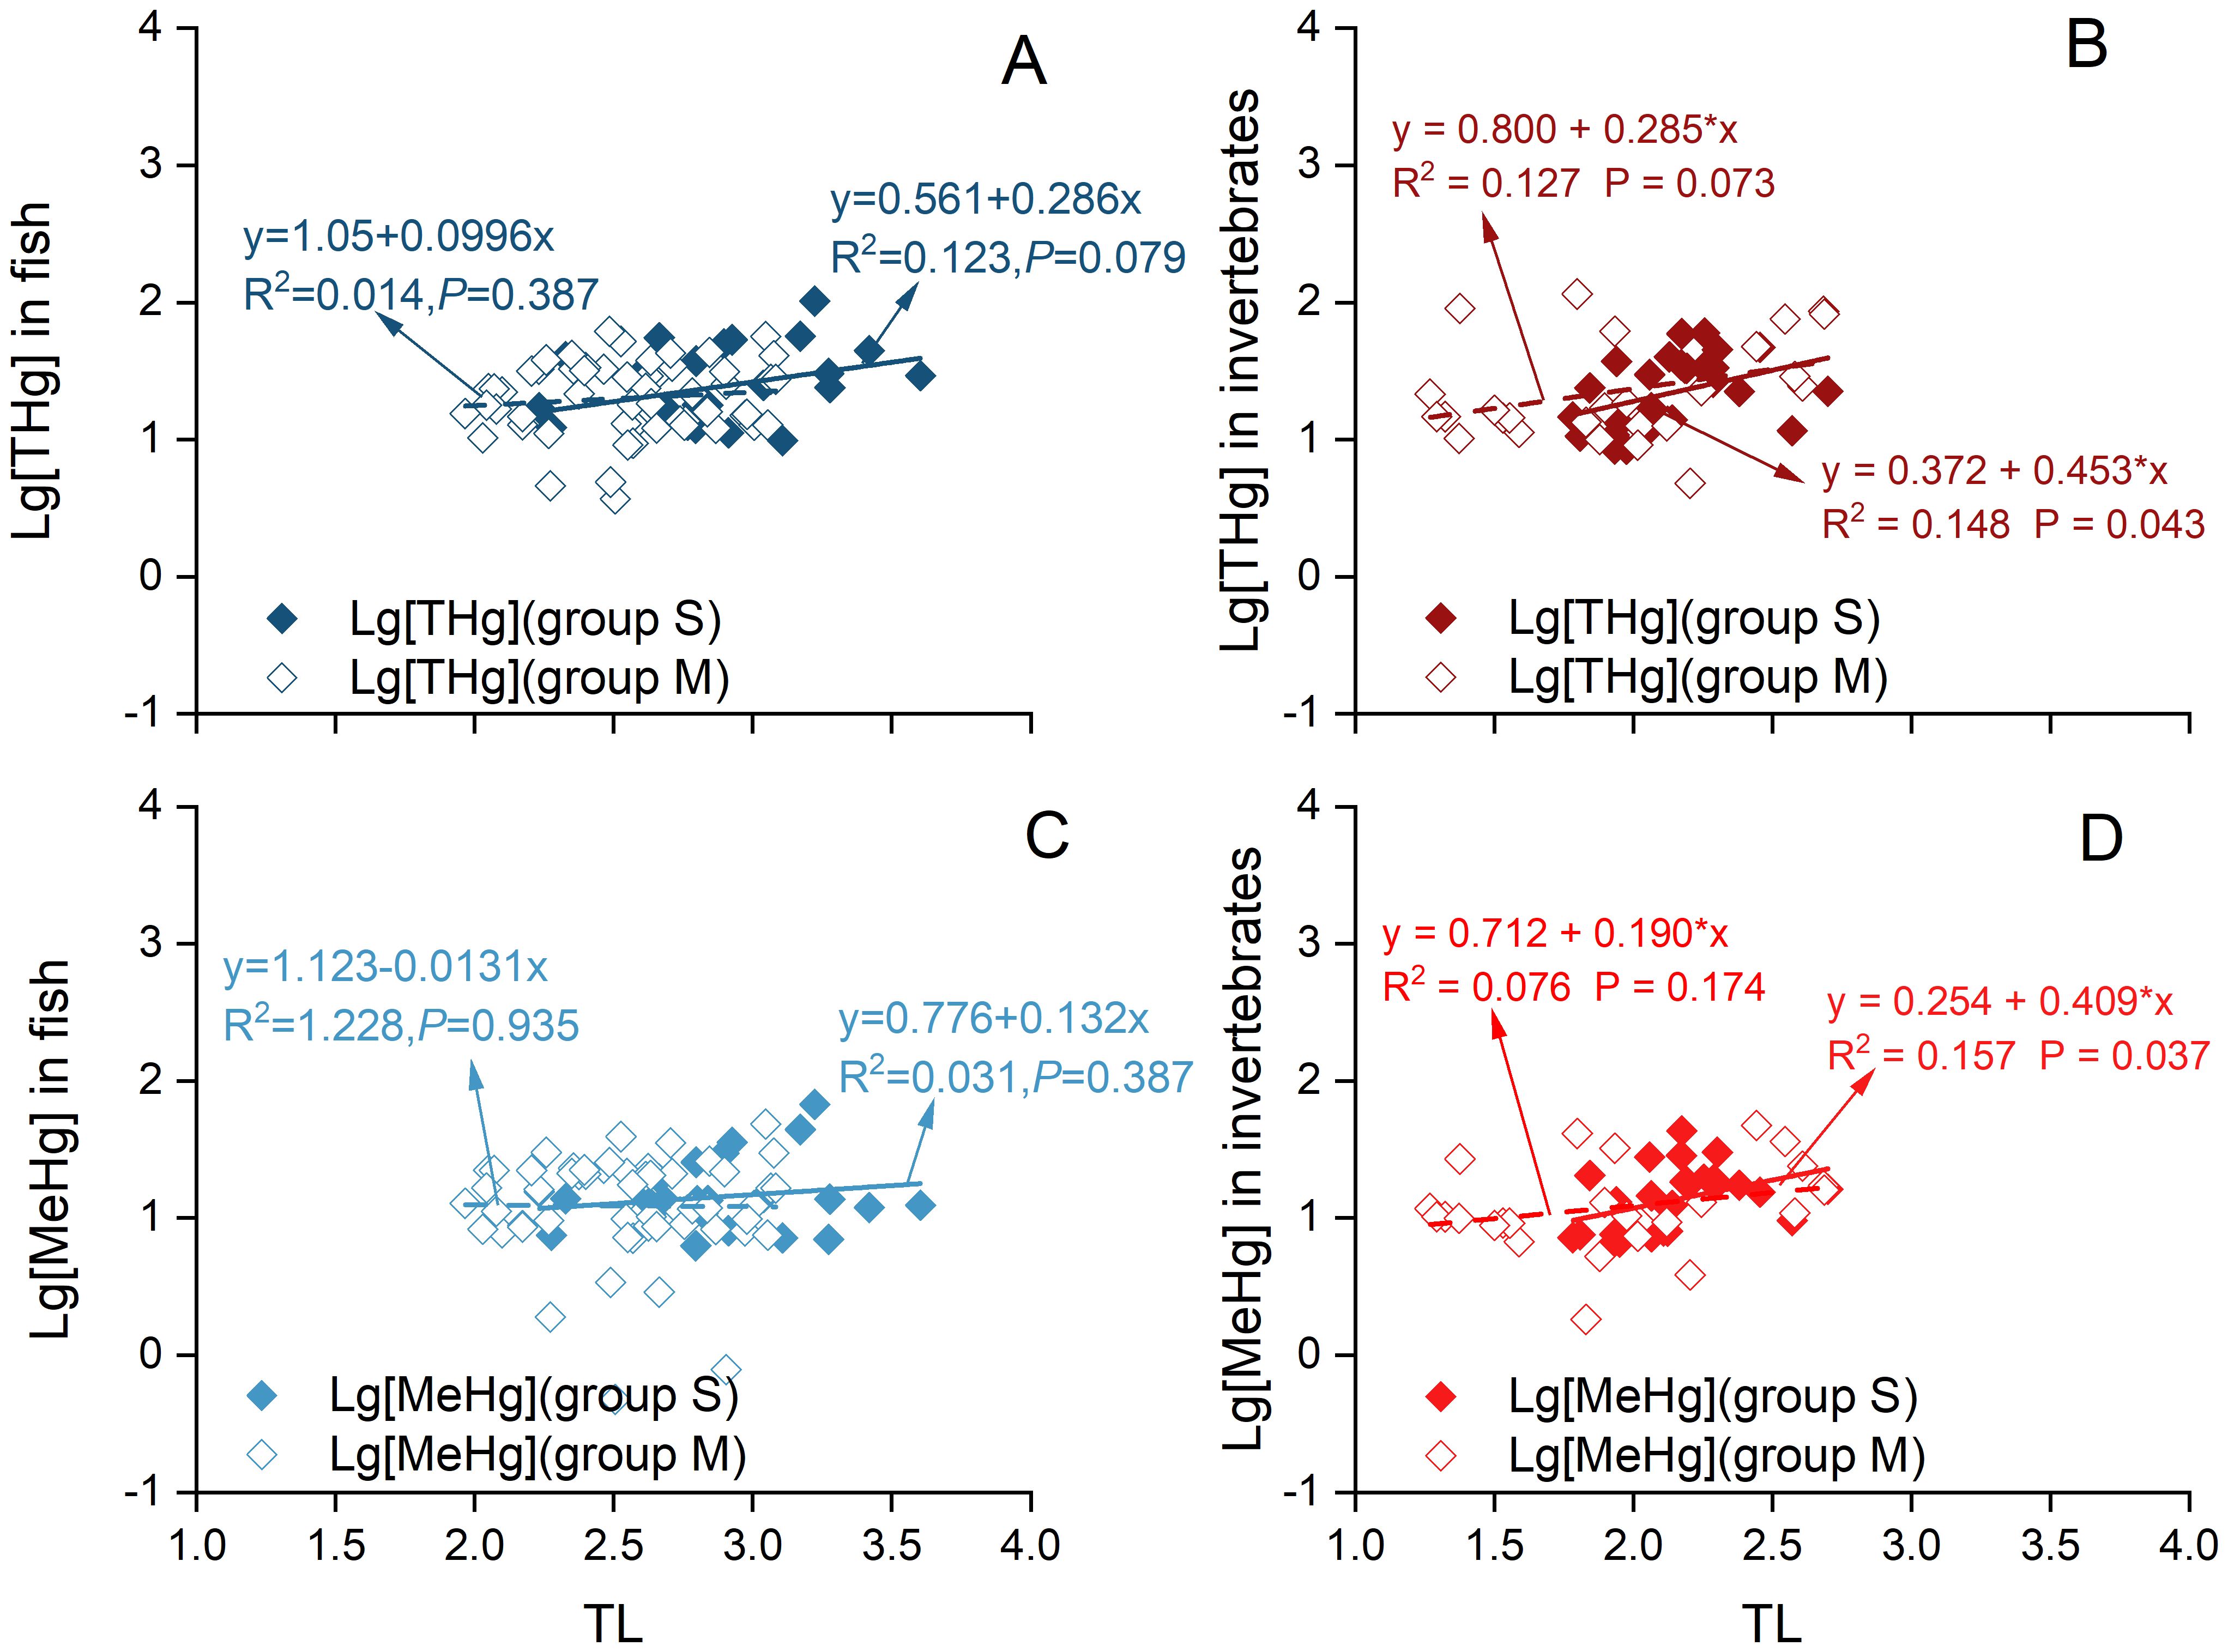
Figure 6. Associations between trophic level (X) and log-transformed concentrations of THg (A, B) in fish and invertebrates, as well as MeHg levels (C, D) (Y), were examined for two distinct trophic groups: Group M, which has relatively lower reliance on seagrass and higher reliance on macroalgae, and Group S, which has relatively higher reliance on seagrass and lower reliance on macroalgae.
To further analyze the potential influence of food sources on THg and MeHg biomagnification through the food chains. Macroalgae exhibited significantly lower δ13C values compared to seagrasses (P< 0.01). Macroalgae are generally more palatable and easier to digest (Macreadie et al., 2017), making them a preferred food source for many marine organisms (Cui et al., 2021; Hu et al., 2021). In contrast, seagrasses, the only entirely marine angiosperms, exhibits substantially higher average δ13C values than macroalgae (Cui et al., 2021; Hu et al., 2021) and possesses defensive mechanisms such as structural toughness and secondary metabolites that reduce palatability and digestibility (Macreadie et al., 2017). Moreover, due to the varying bioavailability of Hg in macroalgae and seagrass, organic matter, and grain size distribution (Bełdowska et al., 2015; Bonanno et al., 2020a, b), these two types of primary producers absorbed different levels of Hg which were transferred to higher trophic levels within the food web. Due to the study from Arisekar et al. (2021), the Hg concentrations bioaccumulated by seagrasses were about 3–4 times higher than those absorbed than macroalgae. The significantly lower biomagnification of Hg via trophic transfer observed in the M groups in this study might be attributed to macroalgae serving as the predominant food source. In contrast, seagrass appeared to contribute relatively more to the S groups, which exhibited higher TMF values. This finding indicated that the composition of primary producers in a food chain significantly influenced Hg biomagnification and subsequent bioaccumulation in marine organisms. Organisms relying on macroalgae with lower δ13C values might experience reduced Hg biomagnification, although this hypothesis requires further validation to establish its rationality and authenticity.
5 Conclusion
In summary, the present study showed THg and MeHg biomagnification in marine fauna from the offshore waters of Changshan Archipelago, with both THg and MeHg levels increasing with higher TLs in both fish and invertebrate samples. In both invertebrates and fish, THg biomagnification was greater than that of MeHg via trophic transfer along local food chains. Dividing the faunal samples into two groups based on their δ13C values indicated that differences in food sources impacted Hg biomagnification, with the latter being higher in samples with higher δ13C values. Combined with the analysis of δ13C values of main primary producers from the offshore waters of Changshan Archipelago, including seagrass and macroalgae, for marine fauna, especially for fish, food sources could indirectly influence Hg bioaccumulation because of their direct effects on Hg biomagnification. A higher proportion of macroalgae among primary producers might decrease Hg biomagnification along the food chain. However, how food sources, such as different macroalgae, affect Hg biomagnification and bioaccumulation within marine fauna should be studied further.
Data availability statement
The raw data supporting the conclusions of this article will be made available by the authors, without undue reservation.
Author contributions
MH: Conceptualization, Formal Analysis, Investigation, Writing – original draft. MP: Conceptualization, Data curation, Funding acquisition, Methodology, Validation, Writing – original draft. XM: Formal Analysis, Methodology, Writing – original draft. PW: Formal Analysis, Methodology, Writing – original draft. CS: Investigation, Methodology, Writing – original draft. YZ: Investigation, Methodology, Writing – original draft. YG: Investigation, Methodology, Writing – original draft. ZS: Investigation, Methodology, Writing – original draft. ZZ: Supervision, Writing – review & editing. ZW: Supervision, Writing – review & editing. PQ: Conceptualization, Funding acquisition, Project administration, Supervision, Writing – review & editing. XL: Project administration, Supervision, Writing – review & editing.
Funding
The author(s) declare that financial support was received for the research and/or publication of this article. This work was financially supported by the Natural Science Foundation of Shandong Province, China (Grant No. ZR2022MD027), and Laoshan Laboratory (Grant No. LSKJ202203902).
Conflict of interest
Author XM was employed by the company China Certification & Inspection Group Shandong Co., LTD. Author PW was employed by the company China Certification & Inspection Group Shandong Testing Co., LTD.
The remaining authors declare that the research was conducted in the absence of any commercial or financial relationships that could be constructed as a potential conflict of interest.
Generative AI statement
The author(s) declare that no Generative AI was used in the creation of this manuscript.
Publisher’s note
All claims expressed in this article are solely those of the authors and do not necessarily represent those of their affiliated organizations, or those of the publisher, the editors and the reviewers. Any product that may be evaluated in this article, or claim that may be made by its manufacturer, is not guaranteed or endorsed by the publisher.
Supplementary material
The Supplementary Material for this article can be found online at: https://www.frontiersin.org/articles/10.3389/fmars.2025.1566875/full#supplementary-material
References
Arcagni M., Juncos R., Rizzo A., Pavlin M., Fajon V., Arribére M. A., et al. (2018). Species- and habitat-specific bioaccumulation of total mercury and methylmercury in the food web of a deep oligotrophic lake. Sci. Total Environ. 612, 1311–1319. doi: 10.1016/j.scitotenv.2017.08.260
Arisekar U., Jeya Shakila R., Shalini R., Jeyasekaran G., Sivaraman B., Surya T. (2021). Heavy metal concentrations in the macroalgae, seagrasses, mangroves, and crabs collected from the Tuticorin coast (Hare Island), Gulf of Mannar, South India. Mar. pollut. Bull. 163, 111971. doi: 10.1016/j.marpolbul.2021.111971
Beckers F., Rinklebe J. (2017). Cycling of mercury in the environment: Sources, fate, and human health implications: A review. Crit. Rev. Environ. Sci. Technol. 47, 693–794. doi: 10.1080/10643389.2017.1326277
Bełdowska M., Jędruch A., Słupkowska J., Saniewska D., Saniewski M. (2015). Macrophyta as a vector of contemporary and historical mercury from the marine environment to the trophic web. Environ. Sci. pollut. Res. 22, 5228–5240. doi: 10.1007/s11356-014-4003-4
Bonanno G., Veneziano V., Orlando-Bonaca M. (2020a). Comparative assessment of trace element accumulation and biomonitoring in seaweed Ulva lactuca and seagrass Posidonia oceanica. Sci. Total Environ. 718, 137413. doi: 10.1016/j.scitotenv.2020.137413
Bonanno G., Veneziano V., Raccuia S. A., Orlando-Bonaca M. (2020b). Seagrass Cymodocea nodosa and seaweed Ulva lactuca as tools for trace element biomonitoring. A comparative study. Mar. pollut. Bull. 161, 111743. doi: 10.1016/j.marpolbul.2020.111743
Burgess N. M., Meyer M. W. (2008). Methylmercury exposure associated with reduced productivity in common loons. Ecotoxicology 17, 83–91. doi: 10.1007/s10646-007-0167-8
Cao L., Liu J., Dou S., Huang W. (2020). Biomagnification of methylmercury in a marine food web in Laizhou Bay (North China) and associated potential risks to public health. Mar. pollut. Bull. 150, 110762. doi: 10.1016/j.marpolbul.2019.110762
Caut S., Angulo E., Courchamp F. (2009). Variation in discrimination factors (Δ 15 N and Δ 13 C): the effect of diet isotopic values and applications for diet reconstruction. J. Appl. Ecol. 46, 443–453. doi: 10.1111/j.1365-2664.2009.01620.x
Caut S., Angulo E., Courchamp F., Figuerola J. (2010). Trophic experiments to estimate isotope discrimination factors. J. Appl. Ecol. 47, 948–954. doi: 10.1111/j.1365-2664.2010.01832.x
Cui L., Jiang Z., Huang X., Chen Q., Wu Y., Liu S., et al. (2021). Eutrophication reduces seagrass contribution to coastal food webs. Ecosphere 12(6):e03626. doi: 10.1002/ecs2.3626
Donald D. B., Wissel B., Anas M. U. M. (2015). Species-specific mercury bioaccumulation in a diverse fish community. Environ. Toxicol. Chem. 34, 2846–2855. doi: 10.1002/etc.3130
Driscoll C. T., Mason R. P., Chan H. M., Jacob D. J., Pirrone N. (2013). Mercury as a global pollutant: sources, pathways, and effects. Environ. Sci. Technol. 47, 4967–4983. doi: 10.1021/es305071v
FIO (First Institute of Oceanography). (2022). Overall Plan for the Changshan Archipelago National Park (in Chinese). eds. by Manage Center for the Changshan Archipelago National Park, Yantai, China.
Fisk A. T., Hobson K. A., Norstrom R. J. (2001). Influence of chemical and biological factors on trophic transfer of persistent organic pollutants in the Northwater Polynya marine food web. Environ. Sci. Technol. 35, 732–738. doi: 10.1021/es001459w
Galimov E. M. (2006). Isotope organic geochemistry. Organic Geochemistry 37, 1200–1262. doi: 10.1016/j.orggeochem.2006.04.009
Hilgendag I. R., Swanson H. K., Lewis C. W., Ehrman A. D., Power M. (2022). Mercury biomagnification in benthic, pelagic, and benthopelagic food webs in an Arctic marine ecosystem. Sci. Total Environ. 841, 156424. doi: 10.1016/j.scitotenv.2022.156424
Hu C., Shui B., Yang X., Wang L., Dong J., Zhang X. (2021). Trophic transfer of heavy metals through aquatic food web in a seagrass ecosystem of Swan Lagoon, China. Sci. Total Environ. 762, 143139. doi: 10.1016/j.scitotenv.2020.143139
Hussey N. E., MacNeil M. A., McMeans B. C., Olin J. A., Dudley S. F. J., Cliff G., et al. (2014). Rescaling the trophic structure of marine food webs. Ecol. Lett. 17, 239–250. doi: 10.1111/ele.12226
Kim D., Won E.-J., Cho H.-E., Lee J., Shin K.-H. (2023). New insight into biomagnification factor of mercury based on food web structure using stable isotopes of amino acids. Water Res. 245, 120591. doi: 10.1016/j.watres.2023.120591
Lavoie R. A., Jardine T. D., Chumchal M. M., Kidd K. A., Campbell L. M. (2013). Biomagnification of mercury in aquatic food webs: a worldwide meta-analysis. Environ. Sci. Technol. 47, 13385–13394. doi: 10.1021/es403103t
Liu J., Cao L., Dou S. (2019). Trophic transfer, biomagnification and risk assessments of four common heavy metals in the food web of Laizhou Bay, the Bohai Sea. Sci. Total Environ. 670, 508–522. doi: 10.1016/j.scitotenv.2019.03.140
Macreadie P. I., Jarvis J., Trevathan-Tackett S. M., Bellgrove A. (2017). Seagrasses and macroalgae: importance, vulnerability and impacts. Climate Change Impacts Fisheries Aquaculture II, 729–770. doi: 10.1002/9781119154051.ch22
Madgett A. S., Yates K., Webster L., McKenzie C., Moffat C. F. (2021). The concentration and biomagnification of trace metals and metalloids across four trophic levels in a marine food web. Mar. pollut. Bull. 173, 112929. doi: 10.1016/j.marpolbul.2021.112929
Mao L., Liu X., Wang Z., Wang B., Lin C., Xin M., et al. (2021). Trophic transfer and dietary exposure risk of mercury in aquatic organisms from urbanized coastal ecosystems. Chemosphere 281, 130836. doi: 10.1016/j.chemosphere.2021.130836
McIntyre P. B., Flecker A. S. (2006). Rapid turnover of tissue nitrogen of primary consumers in tropical freshwaters. Oecologia 148, 12–21. doi: 10.1007/s00442-005-0354-3
Niu Z., Cao Y., Zhao W., Li R. (2019). Distribution and assessment of mercury (Hg) in surface sediments of Futian mangrove forest, China. Environ. Geochem Health 41, 125–134. doi: 10.1007/s10653-018-0151-7
Phillips D. L., Gregg J. W. (2003). Source partitioning using stable isotopes: Coping with too many sources. Oecologia 136, 261269. doi: 10.1007/s00442-003-1218-3
Qu P., Pang M., Wang P., Ma X., Zhang Z., Wang Z., et al. (2022). Bioaccumulation of mercury along continuous fauna trophic levels in the Yellow River Estuary and adjacent sea indicated by nitrogen stable isotopes. J. Hazardous Materials 432, 128631. doi: 10.1016/j.jhazmat.2022.128631
Qu P., Pang M., Shi Y., Wang P., Ma X., Tang X., et al. (2023). Trophodynamics features and potential human health risk of arsenic and cadmium in marine fauna from the Yellow River Estuary, China. Ecol. Indic. 152, 110361. doi: 10.1016/j.ecolind.2023.110361
St. Louis V. L., Derocher A. E., Stirling I., Graydon J. A., Lee C., Jocksch E., et al. (2011). Differences in mercury bioaccumulation between polar bears (Ursus maritimus) from the Canadian high- and sub-arctic. Environ. Sci. Technol. 45, 5922–5928. doi: 10.1021/es2000672
van Rooyen D., Erasmus J. H., Gerber R., Nachev M., Sures B., Wepener V., et al. (2023). Bioaccumulation and trophic transfer of total mercury through the aquatic food webs of an African sub-tropical wetland system. Sci. Total Environ. 889, 164210. doi: 10.1016/j.scitotenv.2023.164210
Wang X., Zhao L., Xu H., Zhang X. (2018). Spatial and seasonal characteristics of dissolved heavy metals in the surface seawater of the Yellow River Estuary, China. Mar. pollut. Bull. 137, 465–473. doi: 10.1016/j.marpolbul.2018.10.052
Werner R. A., Brand W. A. (2001). Referencing strategies and techniques in stable isotope ratio analysis. Rapid Commun. Mass Spectrometry 15, 501–519. doi: 10.1002/rcm.258
Yoshino K., Mori K., Kanaya G., Kojima S., Henmi Y., Matsuyama A., et al. (2020). Food sources are more important than biomagnification on mercury bioaccumulation in marine fishes. Environ. pollut. 262, 113982. doi: 10.1016/j.envpol.2020.113982
Yoshino K., Yamada K., Kanaya G., Komorita T., Okamoto K., Tanaka M., et al. (2023). Food Web Structures and Mercury Exposure Pathway to Fish in Minamata Bay. Arch. Environ. Contam. Toxicol. 85, 360373. doi: 10.1007/s00244-023-01040-y
Zhang X., Sun T., Li F., Ji C., Wu H. (2024). Risk assessment of trace metals and polycyclic aromatic hydrocarbons in seawater of typical bays in the Bohai Sea. Mar. pollut. Bull. 200, 116030. doi: 10.1016/j.marpolbul.2024.11603
Keywords: Hg, stable isotopes, bioaccumulation, biomagnification, food sources, food web
Citation: Huo M, Pang M, Ma X, Wang P, Sun C, Zhang Y, Gong Y, Sun Z, Zhang Z, Wang Z, Qu P and Luo X (2025) Trophic transfer of mercury in marine food chains from the offshore waters of Changshan Archipelago. Front. Mar. Sci. 12:1566875. doi: 10.3389/fmars.2025.1566875
Received: 25 January 2025; Accepted: 17 March 2025;
Published: 04 April 2025.
Edited by:
Jessica Dutton, Texas State University, United StatesCopyright © 2025 Huo, Pang, Ma, Wang, Sun, Zhang, Gong, Sun, Zhang, Wang, Qu and Luo. This is an open-access article distributed under the terms of the Creative Commons Attribution License (CC BY). The use, distribution or reproduction in other forums is permitted, provided the original author(s) and the copyright owner(s) are credited and that the original publication in this journal is cited, in accordance with accepted academic practice. No use, distribution or reproduction is permitted which does not comply with these terms.
*Correspondence: Pei Qu, cXVwZWlAZmlvLm9yZy5jbg==; Xianxiang Luo, bHh4ODE4NzVAb3VjLmVkdS5jbg==
†These authors have contributed equally to this work and share first authorship