 Mingchen Li
 Changdong Wei3
 Yanjun Liu
 Gang Xue
95% of researchers rate our articles as excellent or good
Learn more about the work of our research integrity team to safeguard the quality of each article we publish.
Find out more
ORIGINAL RESEARCH article
Front. Mar. Sci. , 13 March 2025
Sec. Ocean Solutions
Volume 12 - 2025 | https://doi.org/10.3389/fmars.2025.1563310
In this study, a novel wind-wave energy hybrid concept is proposed, consisting of a Three Gorges Leading semi-submersible floating wind turbine and multiple point absorption wave energy converters (WECs). Based on three-dimensional potential flow theory, numerical simulations are conducted using the hydrodynamic analysis software AQWA. The existing experimental data are used to validate the reliability of the numerical model by comparing and analyzing the hydrodynamic responses of the semi-submersible platform and WECs. Subsequently, the Y-shaped WECs microarray form and the Triangular WECs microarray form are designed based on the different connection methods between WECs and the turbine platform. Numerical simulation is conducted to study the influence of these WECs microarrays on the hybrid system’s performance. The results show that WECs microarray significantly affects the wave contours under short waves. Regarding platform motion stability, the Y-shaped microarray shows superior performance. Regarding mooring line tension, the hybrid system has an advantage under short waves. Regarding absorbed power, multi-body hydrodynamic interactions significantly enhance the WECs’ power absorption capacity. Overall, this study will contribute to the design of wind-wave energy hybrid systems.
Given the continuous growth in global energy demand and the heightened focus on renewable energy, marine renewable energy has emerged as a crucial research field, owing to its abundant resources and substantial development potential (Rehman et al., 2023). Among these, wave energy, as one of the primary forms of marine renewable energy, offers considerable advantages, including high energy density, predictability, and broad availability (Mork et al., 2010; Mahdy et al., 2024).
Based on the principle of energy conversion, wave energy converters (WECs) can be categorized into three main types: oscillating water columns (OWCs) (Falcão and Henriques, 2016), oscillating bodies (Guo et al., 2022), and overlapping systems (Contestabile et al., 2020). Although there have been numerous studies on WEC technology, it remains in the early stages of development. The high costs of equipment manufacturing, installation, and maintenance significantly increase overall expenses (Mustapa et al., 2017; Bhuiyan et al., 2022). This economic disadvantage hampers its competitiveness against traditional fossil fuels, slowing the pace of its commercial application (Castro-Santos et al., 2017; Felix et al., 2019).
Compared with WEC, offshore wind power technology is more mature, and the rapid expansion of large offshore wind farms in recent years has been notable (Wu et al., 2019; Soares-Ramos et al., 2020). However, the installed capacity of offshore stationary wind turbines is nearing saturation. Meanwhile, wind energy resources are more abundant in deep and distant sea regions, prompting a shift towards developing floating wind turbines in these areas (Zhou et al., 2023). In this background, the combination of floating offshore wind turbine (FOWT) with WECs microarray to create a wind-wave energy hybrid system is a highly promising technological approach. According to the study of Chozas et al. (2012), compared with single wind energy, the combination of wind and wave technologies led to a reduction of more than 35% in the balancing costs. This is mainly attributed to the fact that, by sharing infrastructure, mooring system, and power transmission system, such hybrid systems can significantly reduce the cost of construction and maintenance, thereby underpinning the sustainable development and long-term utilization of marine renewable energy sources (Wan et al., 2024). In addition, these hybrid systems can achieve a smooth power output and increase the energy production per unit area of ocean space by combining two distinct marine energy sources (Pérez-Collazo et al., 2015).
Over the years, researchers have extensively explored hybrid systems that combine FOWT with WECs, proposing various innovative concepts and assessing their feasibility and performance through both experimental and numerical studies. One of the earliest concepts is the combination of Spar-type wind turbine with WECs. Muliawan et al. (2012, 2013b, 2013a) investigated the concept of Spar-type floating turbine combined with Torus-type point absorption WECs through numerical analysis. They found that integrating WECs enhances the platform’s kinematic behavior and significantly boosts the system’s total power output. Homayoun et al. (2019) analyzed the combination of monopile wind turbine with different geometries of WEC, and discovered that WECs with a curvature inward in the bottom performed the best in terms of wave energy absorption efficiency. Wan et al. (2020a) presented three concepts of column turbine and heave-type WEC combinations for deep, intermediate and shallow water conditions, respectively. The findings revealed significant differences in the dynamic response characteristics of the three concepts under different environmental effects. Ghafari et al. (2021b) studied a hybrid system that integrates Wavestar point absorption WECs around a Hywind platform, and found that increasing the number of WECs optimizes the platform motion. Meanwhile, the system’s energy capture efficiency is enhanced, exemplified by the case of 12 WECs, where the system’s total wind-wave energy increases by 4.25% in comparison with a single wind turbine.
Compared to Spar-type turbines, semi-submersible floating wind turbines offer more installation locations and greater flexibility for the arrangement of WECs, making them more suitable as a foundational platform for constructing wind-wave hybrid systems. Alla Weinstein et al. (2012) explored multiple design options for supporting different types of WECs based on the WindFloat platform. They confirmed the technical feasibility of these design options under regular wave conditions through numerical simulations and experiments. Michailides et al. (2014) analyzed how flap-type WECs affect the dynamic response of a semi-submersible wind power platform. The study showed that integrating WECs can increase the energy output of the system with minimal impact on platform stability. Legaz et al. (2018) proposed a W2Power hybrid system and analyzed the independent and coupled characteristics of wind and wave energy devices, respectively. By conducting modeling experiments, Kamarlouei et al. (2020) found that concentrically arranged WECs can effectively reduce the amplitude of the vertical and longitudinal oscillations of the floating platform, thereby improving motion stability. Ghafari et al. (2021a) discovered that increasing the number of Wavestar WECs around the DeepCwind platform can enhance the total energy output, but it also intensifies the amplitude of the platform motion. A study conducted by Ghafari et al. (2022b) showed that the capture width ratio (CWR) of the Wavestar is directly proportional to its diameter and inversely proportional to wave height. Zhang et al. (2023) proposed a novel SPIC-Wavestar hybrid platform and investigated the effect of varying numbers of WECs on the system performance. Wu et al. (2024) compared the impact of three distinct shapes of WECs on the dynamic response and energy capture of the system and revealed that the hybrid system with the circular truncated conical WECs performed best.
Obviously, current studies focus more on the design and analysis of the number and shape of WECs in a single microarray form. However, studies examining the effect of different WECs microarray forms on system performance are relatively scarce, limiting the in-depth exploration of the collaborative design optimization for multiple devices. Based on the idea of previous work (Cao et al., 2023; Yu et al., 2024), a novel WEC-TGL wind-wave energy hybrid concept is proposed in this study. The system comprises a Three Gorges Leading semi-submersible floating platform (TGL) with symmetrically distributed point absorption WECs microarrays. Two WECs microarray forms, Y-shaped and Triangular, are designed based on the different methods of the connection between the WECs and the FOWT. Numerical analysis is conducted to evaluate the effects of different WEC microarray forms on surrounding wave elevation, motion response, mooring line tension and the absorbed power of WECs within the hybrid system. The analytical approach and research framework used in this study can provide some references for the design and research of other hybrid systems.
The remainder of this paper is organized as follows: Section 2 outlines the theoretical background of the study. Section 3 describes the TGL semi-submersible floating platform and the point absorption WEC, and based on their integration, proposes two new wind-wave hybrid systems. Section 4 validates the hydrodynamic response using available experimental data. Section 5 presents and discusses the results of the study. Section 6 summarizes the main conclusions of the study.
In order to determine the interaction between hydrodynamic loads and floating structures, this study utilizes AQWA, a hydrodynamic analysis software based on three-dimensional potential theory and diffraction/radiation theory. This section presents the theoretical background of AQWA.
Assuming that the fluid field is irrotational, inviscid and incompressible, the corresponding velocity potential function can be shown in Equation 1:
where denotes the coordinates of the water particles in the fluid field. and denote the amplitude and frequency of the incident wave, respectively.
The velocity potential consists of the incident potential , the diffraction potential and the radiation potential , which can be shown in Equation 2 (Barltrop, 1998):
where denotes the radiation potential induced by a motion with unit amplitude and -th degree of freedom.
Laplace’s equation and several boundary condition equations can be used to determine fluid-structure interaction (Newman, 1979), as shown in Equations 3–7:
Boundary element method (BEM) is used for solving velocity potential functions governed by boundary conditions (Ghafari and Dardel, 2018).
The mooring line dynamics problem is solved by the pooled mass method (Hall and Goupee, 2015). This method discretizes each mooring line into multiple finite elements with mass concentrated at the center. The motion equation for each element is shown in Equation 8:
where , , and denote the tension, shear force, bending moment and position vectors at the first node of the element, respectively. , and q denote gravity, hydrodynamic force, and distributed bending moment loads of the element per unit length, respectively. and denote the unstretched length of the element and the mass per unit length, respectively.
The and in Equation 8 can be shown in Equation 9:
Where and denote the bending stiffness and axial stiffness of the cable respectively. denotes the tensile length.
In a floating system with structures, the frequency-domain motion equation for the -th mode can be shown in Equation 10:
where and denote the mass matrix and added mass matrix, respectively. and are the radiative damping matrix and the structural damping matrix, respectively. represents the hydrostatic stiffness matrix. represents the Froude-Krylov force and diffraction force.
The time-domain motion equation of the floating structure can be shown in Equation 11 (Cummins, 1962):
where , and denote the mass matrix, the structural damping matrix and the total stiffness matrix, respectively. is the retardation function. and represent the mooring force and the wave force, respectively.
This section describes the TGL semi-submersible floating platform and the point absorption WEC, followed by the presentation of two proposed WEC-TGL wind-wave energy hybrid systems.
The semi-submersible floating platform utilized in this study is the Three Gorges Leading (TGL). The TGL concept comprises a semi-submersible platform, a flexible tower and a 5MW wind turbine. Figures 1A, B illustrate the composition of the TGL semi-submersible floating platform and the arrangement of the mooring system, respectively. The mooring system comprises three sets of mooring lines, each spaced 120° apart, with two mooring lines per set separated by a 10° spacing angle. Supplementary Table S1 (Cao et al., 2023) provides the specific geometric parameters of the platform. Figures 1C, D depict a schematic of the TGL platform design based on the detailed parameters provided in Supplementary Table S1. The mooring system anchors the TGL platform in 40 m water depth. The key parameters of each mooring line are listed in Supplementary Table S2 (Cao et al., 2023), in which segment 1 of the chain is connected to the fairlead and segment 6 is connected to the anchor. The exact locations of the fairleads and anchors are given in Supplementary Table S3 (Cao et al., 2023).

Figure 1. Three Gorges Leading semi-submersible floating wind turbine. (A) Component structure of the TGL concept. (B) arrangement of the mooring system. (C) Top view of the TGL platform. (D) Side view of the TGL platform.
Wavestar is a point absorption wave energy conversion device. As waves pass, the hemispherical float oscillates, transferring motion through a connecting rod to a hydraulic system, which drives a power generator to convert the float’s mechanical motion into electrical energy. Figure 2 presents a scale diagram of the Wavestar and all its components (Ghafari et al., 2022a), while Windt et al. (2020) provide the specific geometric parameters. In order to fit the dimensions of the TGL platform, the WEC used in this study is scaled up at a 2:1 ratio relative to the Wavestar prototype, with its properties detailed in Table 1. The PTO system is simulated by setting the rotational damping coefficient at the hinge node, and its force and power can be shown in Equations 12, 13:

Figure 2. Illustration of the Wavestar WEC model (Ghafari et al., 2022a).
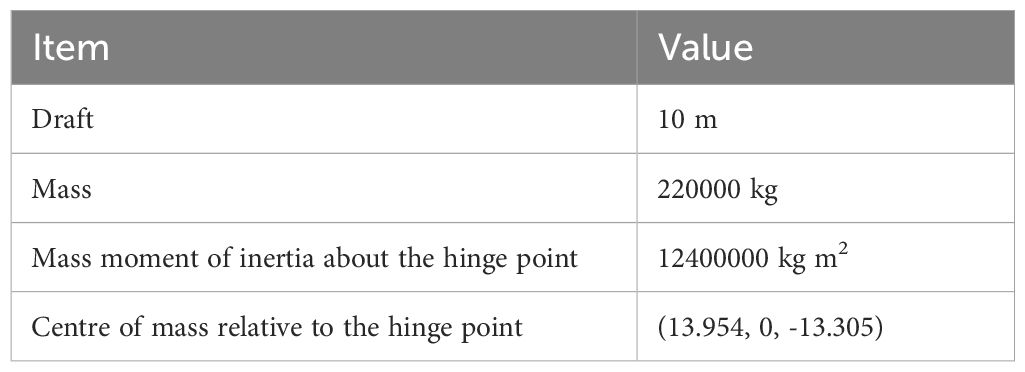
Table 1. Properties of the point absorption WEC.
where and denote the damping coefficient and the angular velocity, respectively.
Figure 3 illustrates two WEC-TGL wind-wave energy hybrid systems: the Y-shaped microarray in Figure 3A and the Triangular microarray in Figure 3B. In both microarray forms, a WEC is installed at the central area on both sides of each TGL platform columns, with a distance of 5.9m from the outside of the column. WECs of the same serial number are kept in an identical position relative to the FOWT, but their connection methods differ. Specifically, WECs in the Y-shaped microarray are connected to the platform through box beams, while WECs in the Triangular microarray are connected to the platform through external crossbeams.
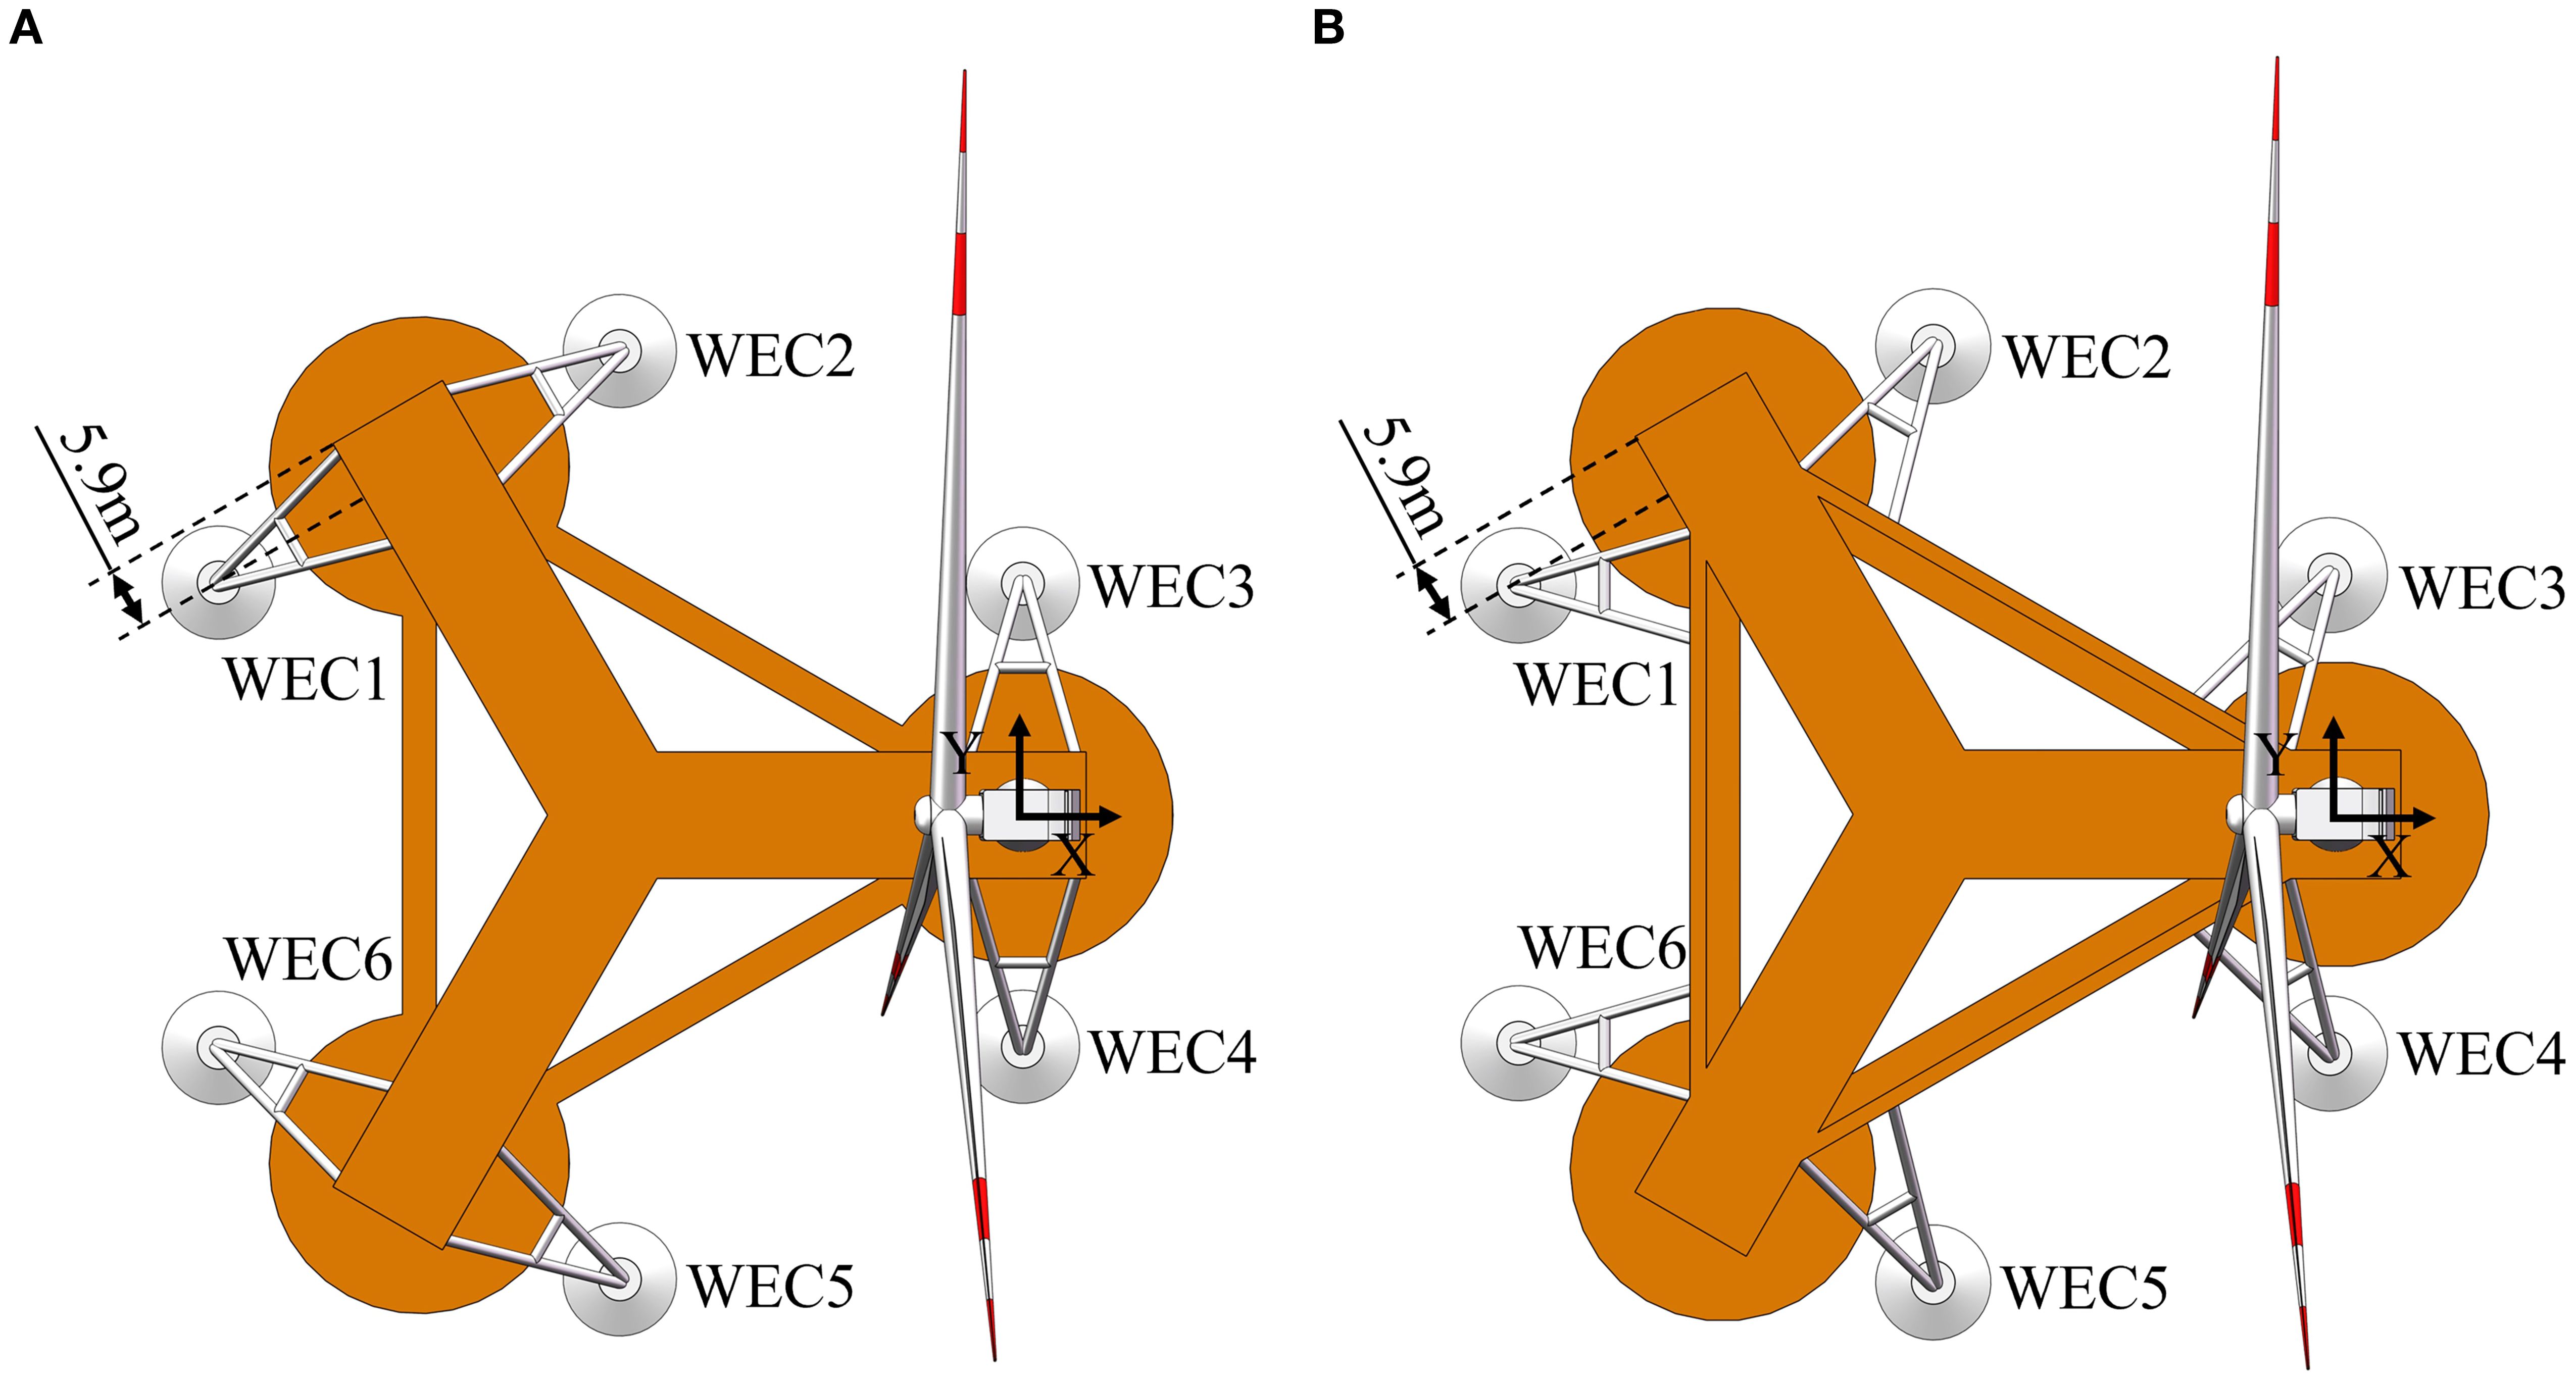
Figure 3. WEC-TGL wind-wave energy hybrid systems. (A) Y-shaped microarray. (B) Triangular microarray.
To ensure the reliability of the numerical model for the hybrid system, this section validates the TGL semi-submersible floating platform and the point absorption WEC, respectively.
It is necessary to conduct a mesh convergence analysis before validating the numerical model. In AQWA, mesh convergence is usually verified by comparing the second-order steady drift forces calculated using near field and far field methods (Yue et al., 2020). The near field method determines the second-order steady drift forces by integrating the pressure over the mesh, while the far field method calculates them based on the momentum flux. When the calculation results of the two methods are in good agreement, it can be confirmed that the mesh quality of the numerical model meets the requirements. In this study, the element sizes of FOWT and WEC are 0.9m and 0.5m, respectively. Figure 4 demonstrates the surge second-order steady drift forces of the FOWT and WEC in the frequency domain. This indicates that the mesh convergence requirement has been satisfied for both research objectives.
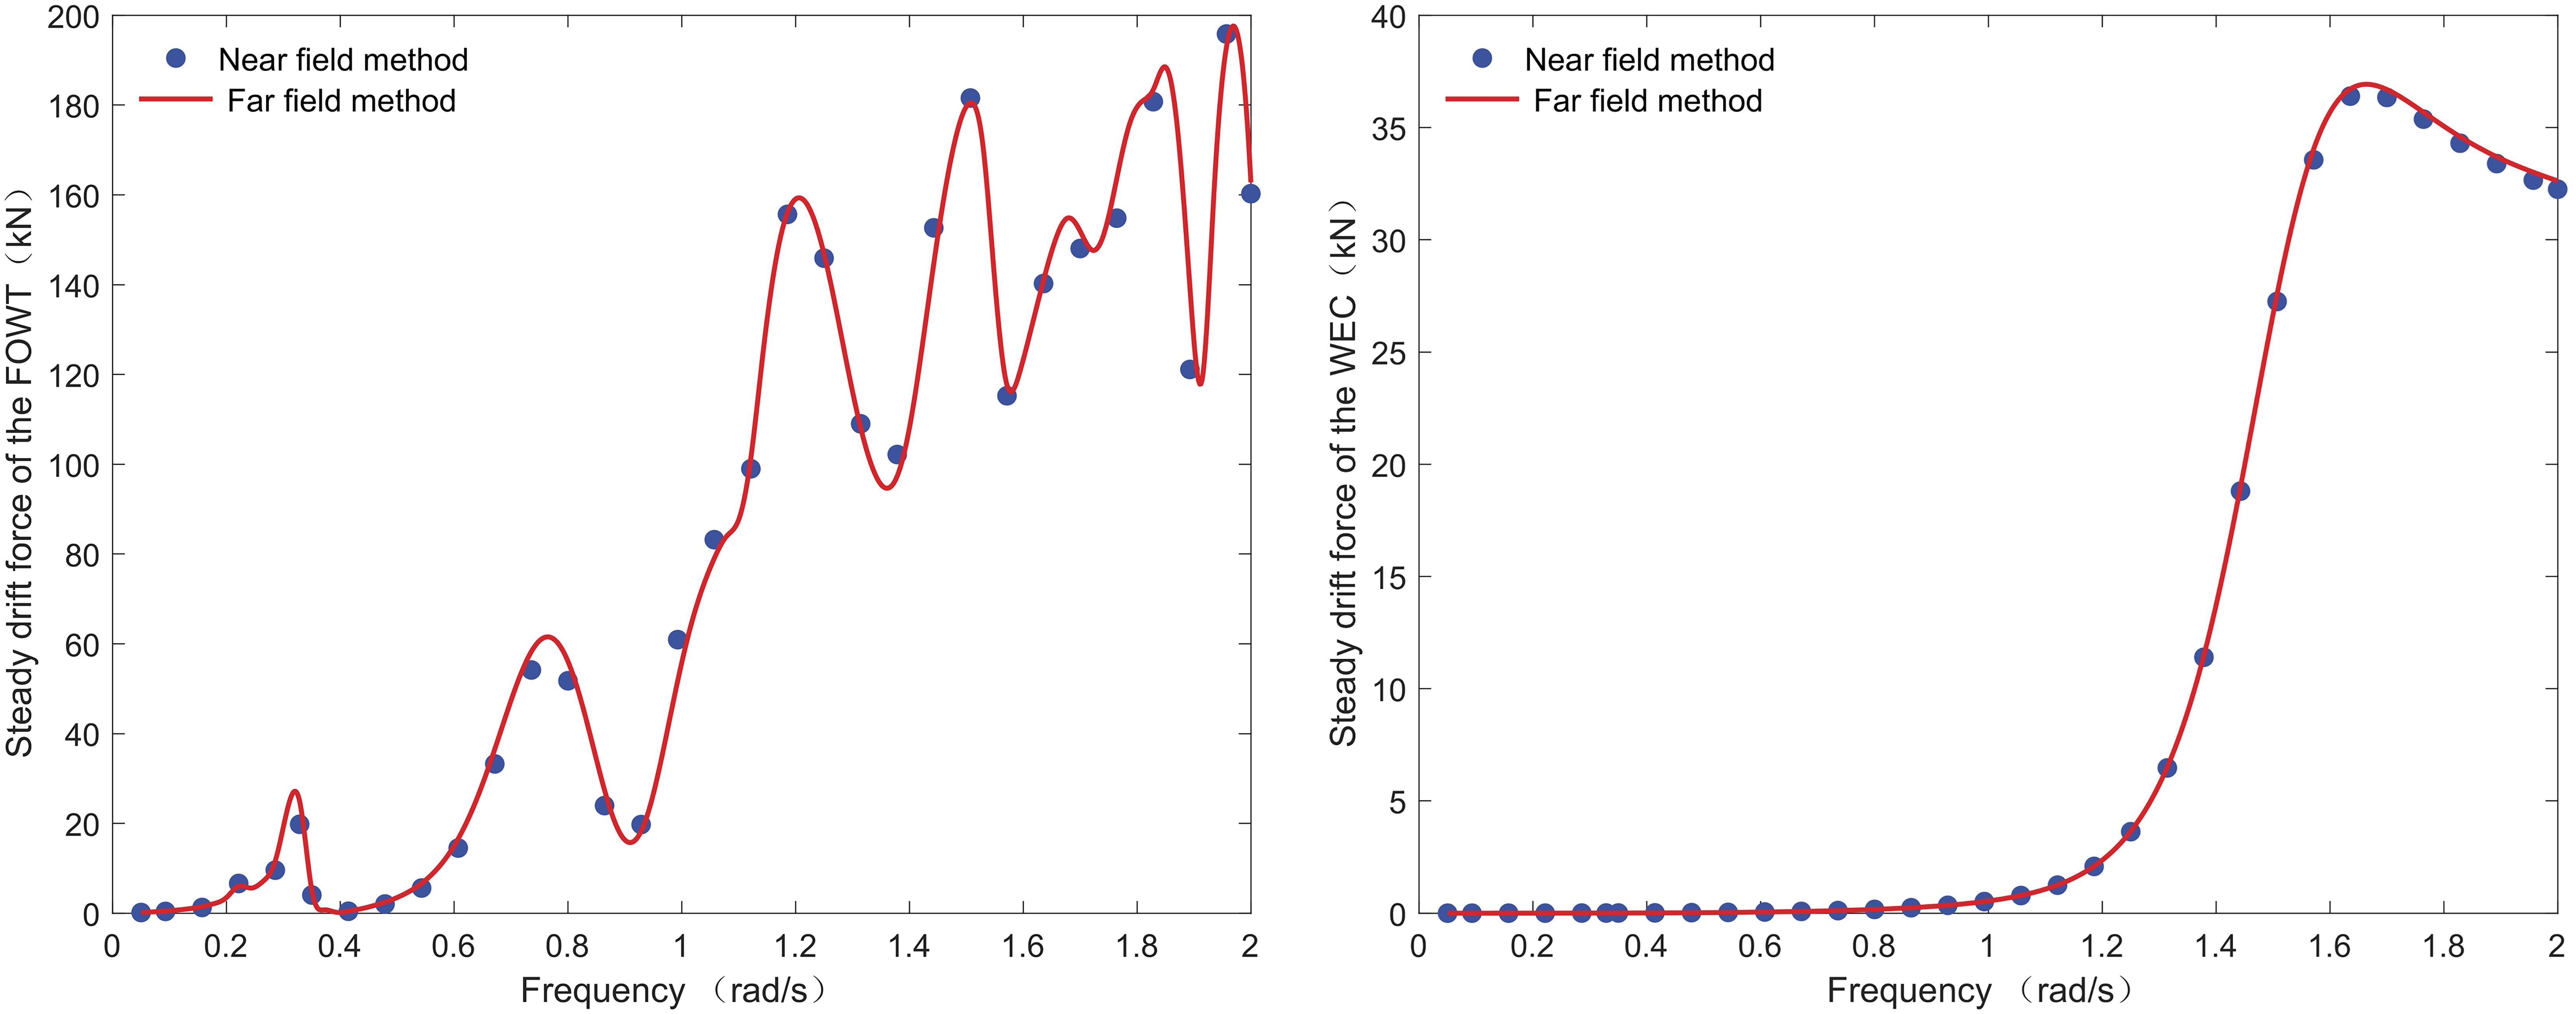
Figure 4. Surge second-order steady drift force in the frequency domain.
Cao et al. (2023) carried out a 1:40 scale experiment on the TGL semi-submersible platform, and the results are used to validate the numerical model in this study. The experiment is conducted in a basin measuring 50 × 40 × 10 meters with wave makers and wave-absorbing beaches. The validation is performed by comparing the statistical values of the motion response under loaded condition, as presented in Table 2. The experiment uses JONSWAP spectra to simulate irregular wave, with a duration of 4000 seconds. Numerical simulation is performed with five different random seeds to obtain the average statistical properties. Figure 5 demonstrates the relative error analysis between the experimental and numerical results. Due to the random nature of irregular waves, the relative error values obtained in this study are slightly larger than those reported in the study by Cao et al. (2023). Nonetheless, the errors remain within acceptable limits, and the numerical model can be considered credible. The relative error can be shown in Equation 14:
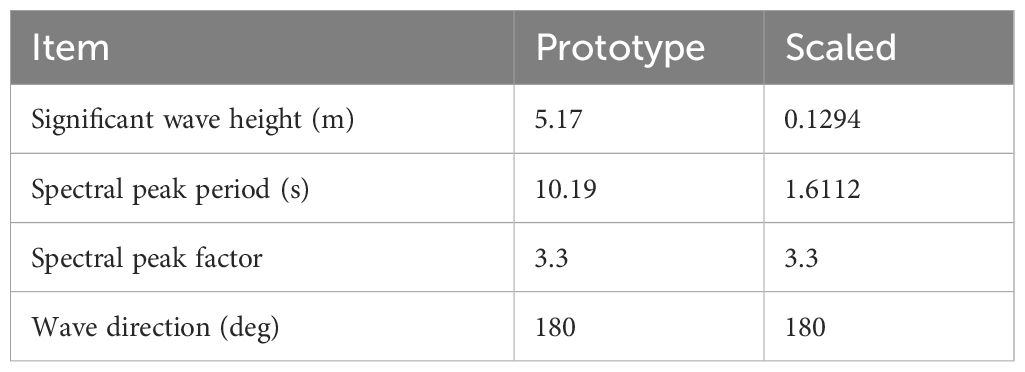
Table 2. Validation load condition.
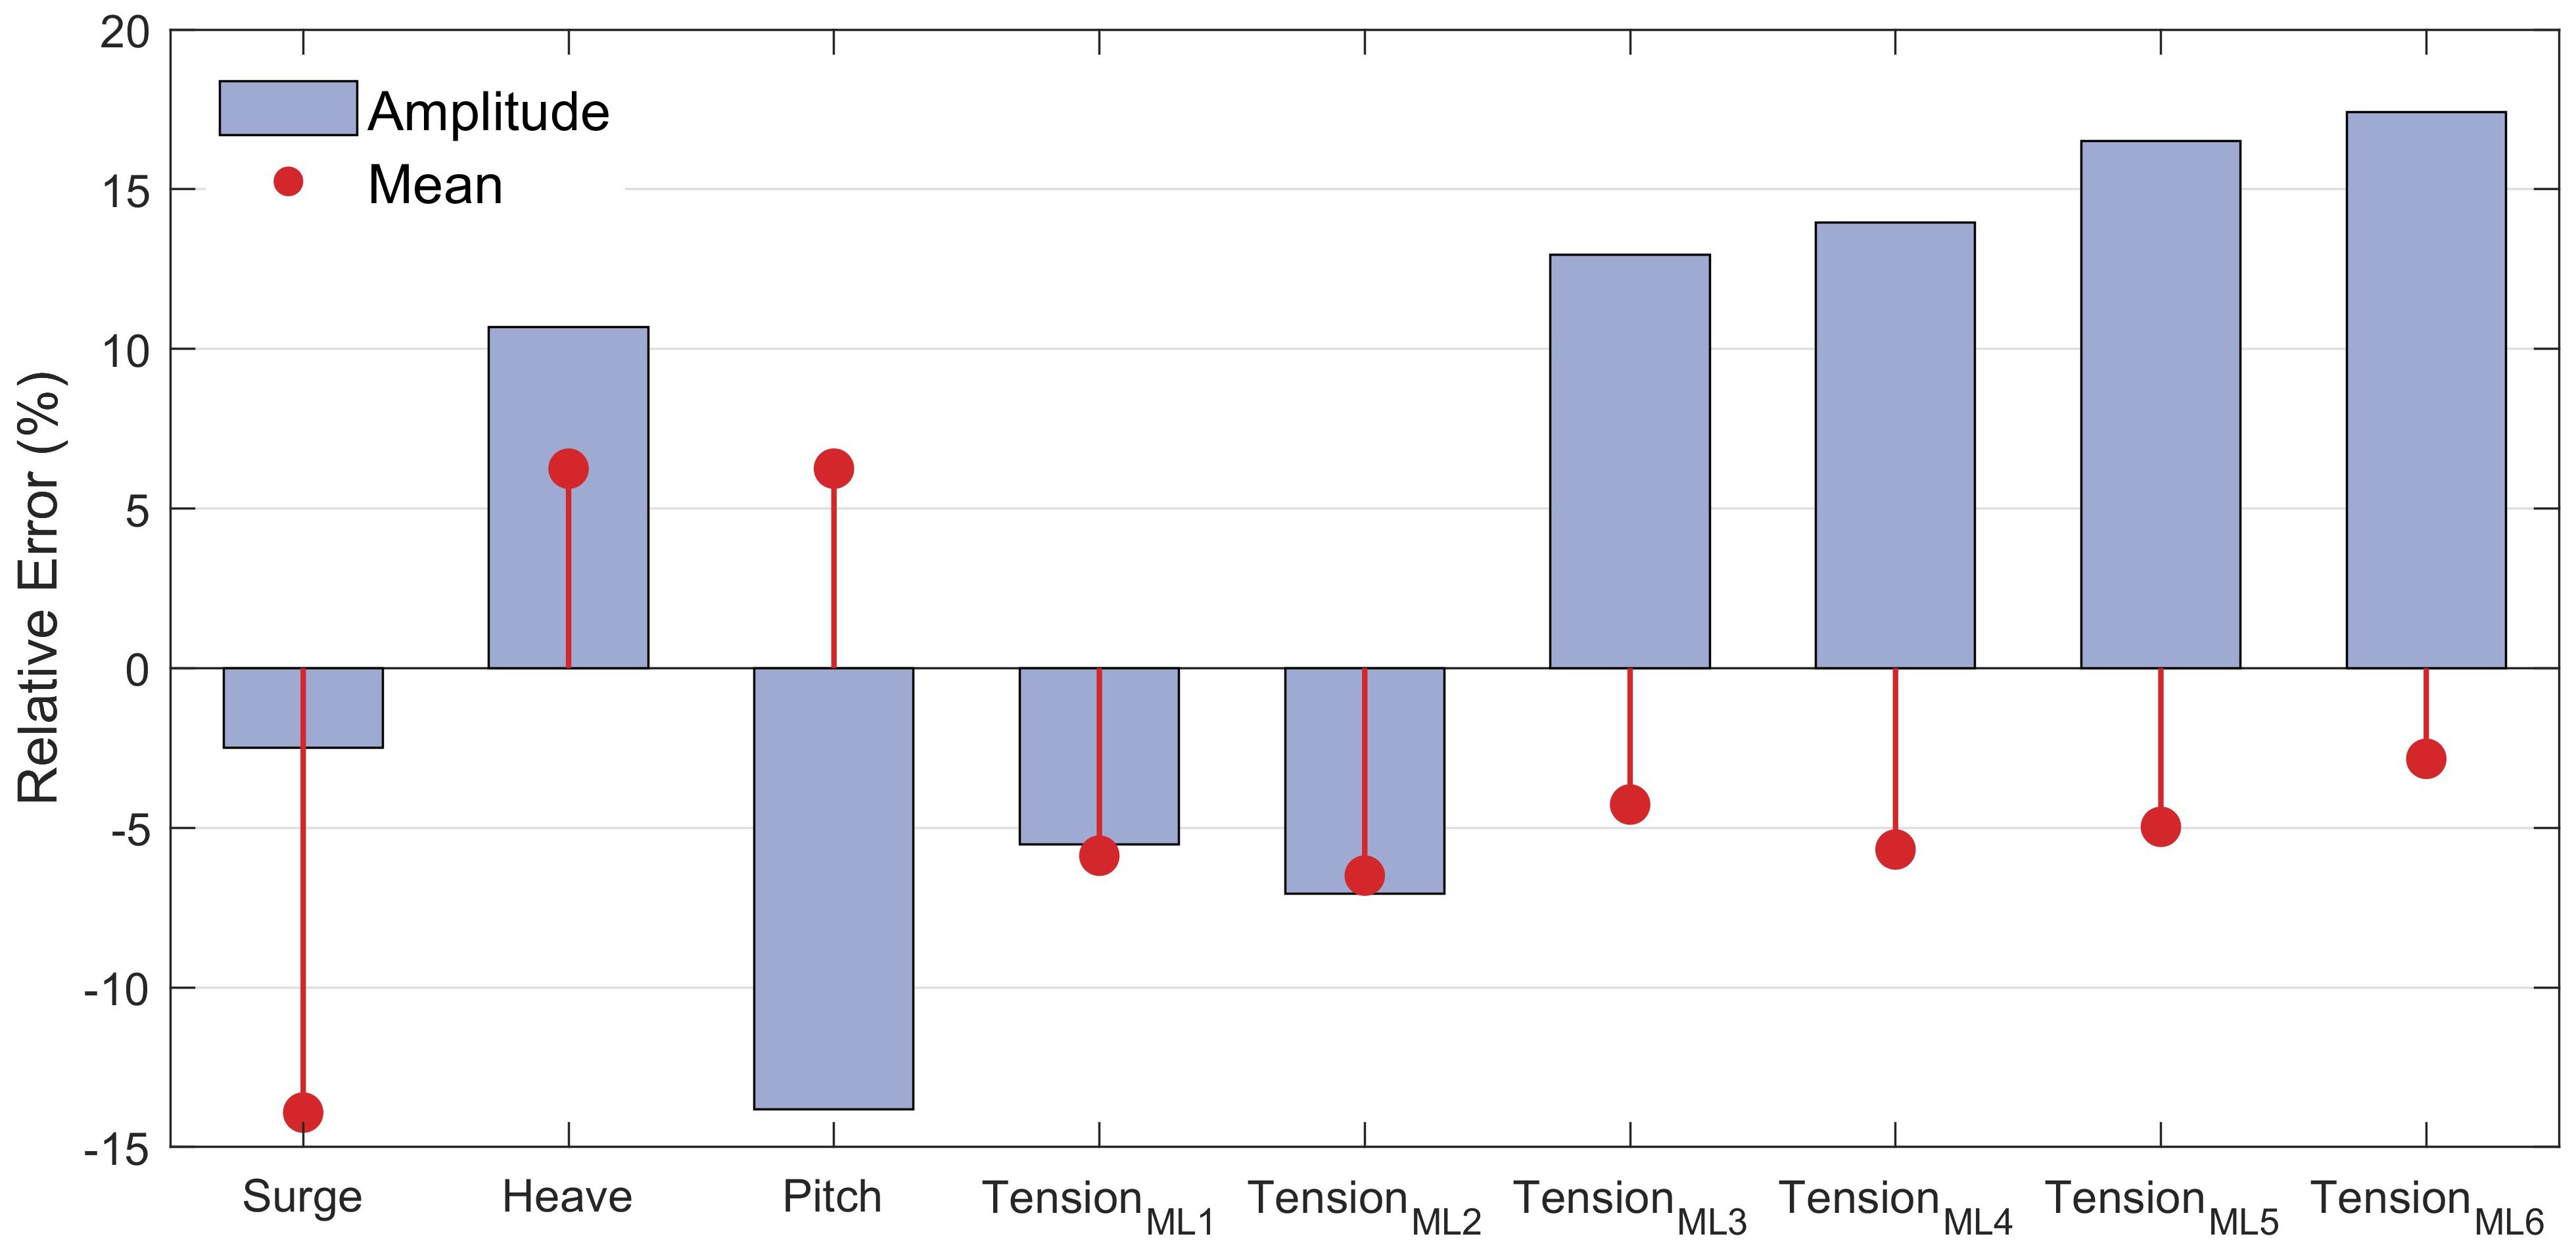
Figure 5. The analysis of the error between the experimental and numerical results.
where is the relative error, is the value calculated numerically and is the actual value measured by experiments.
Figure 6 demonstrates the position and velocity of the 1:5 scale Wavestar under regular wave with linear PTO damping of 0 and 200 N.m.s, respectively. The wave height is 0.1 m and the period is 1.4 s. Comparison of the numerical simulation results with the experimental data provided by Windt et al. (2020) reveals a high degree of consistency, thus verifying the validity of the WEC numerical model. The results also show that the PTO damping has a significant limiting effect on the motion of the WEC. Compared with the case of 200 N.m.s damping condition, the position and velocity of the WEC at 0 N.m.s damping increase to about 4 times and 4.5 times, respectively.
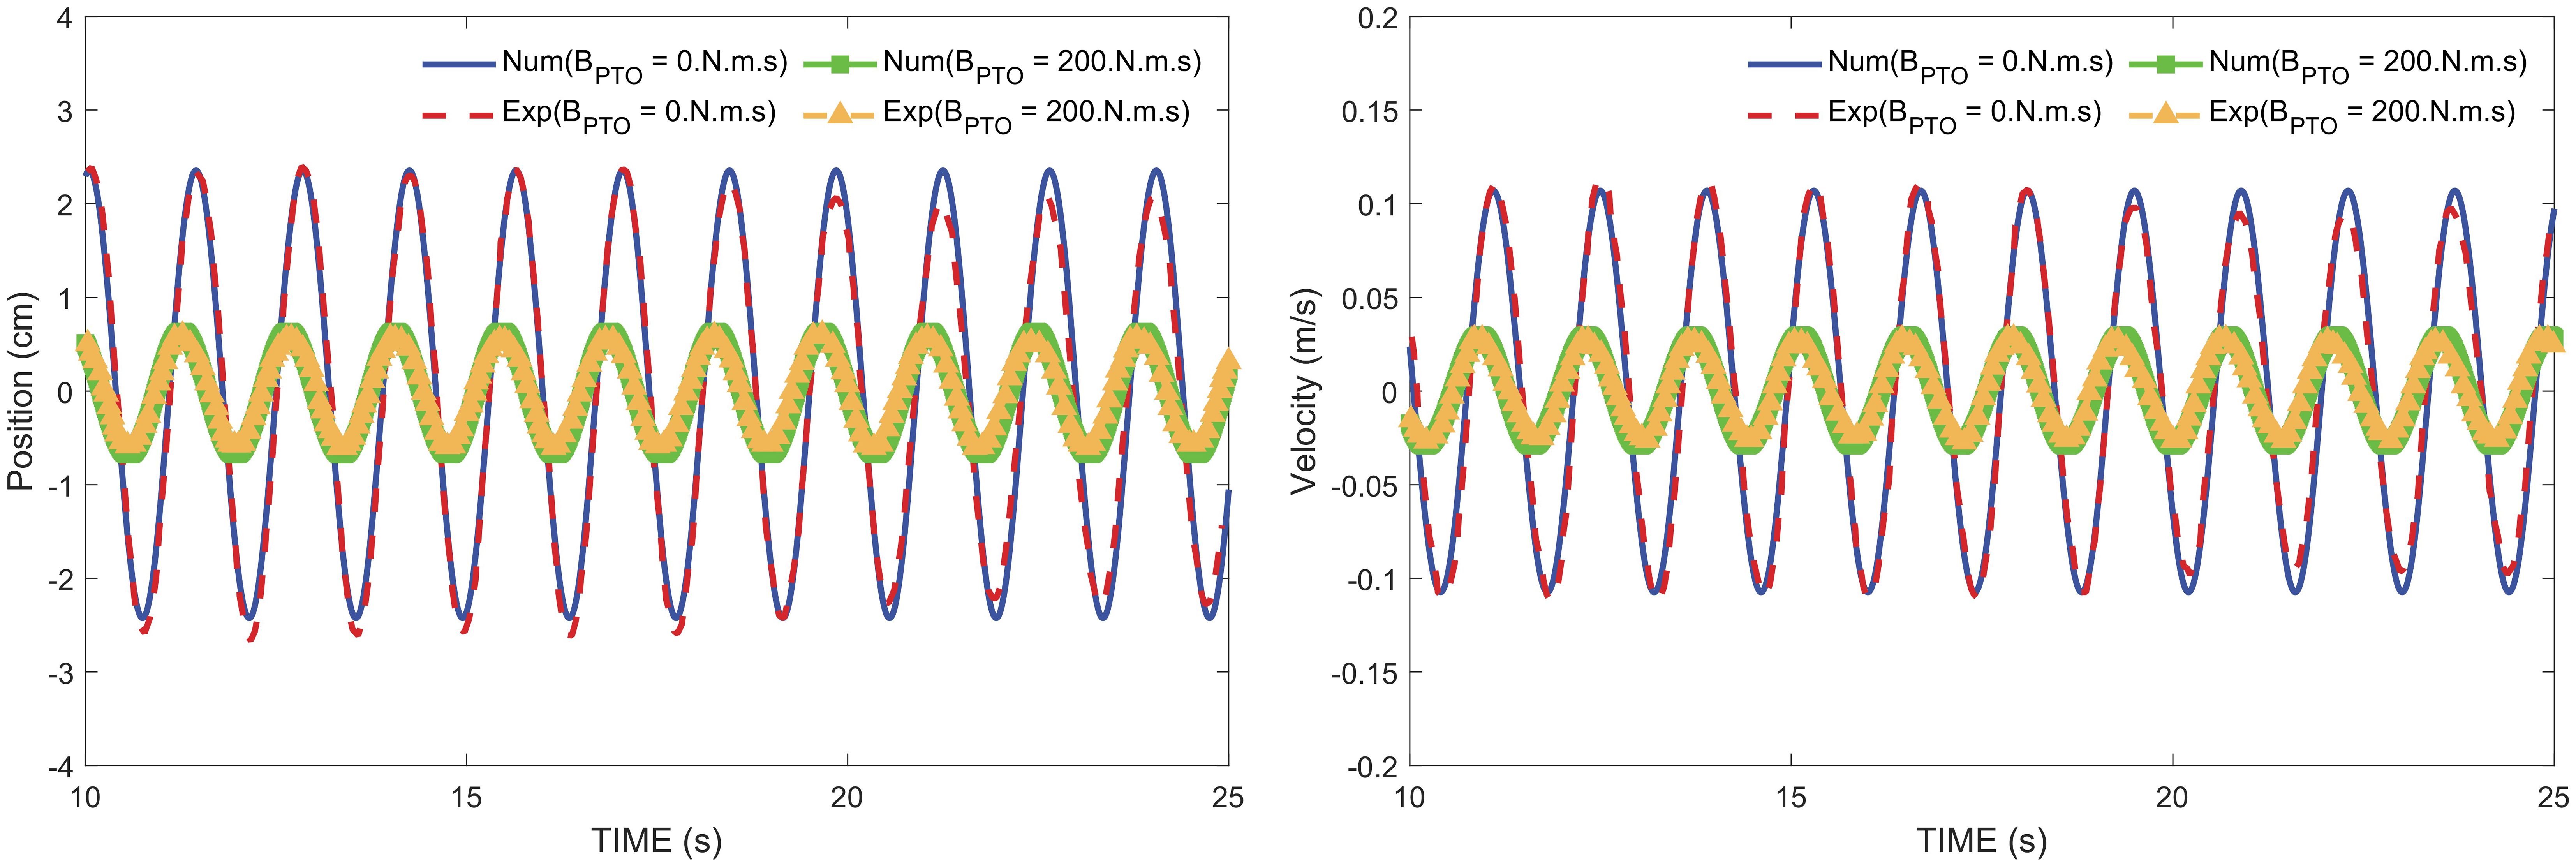
Figure 6. Comparison of values of Wavestar position and velocity with experimental results for damping of 0 and 200 N.m.s.
This section investigates the effects of WECs microarray layouts on wave elevation, motion response and absorbed power under two wave directions and five regular wave conditions.
The novel wind-wave hybrid system concept proposed in this study is expected to be deployed in the Yellow Sea of China in the future. Wan et al. (2020b) conducted calculations on the probability of occurrence of sea conditions in the Yellow Sea. The joint probability distribution of the annual mean effective wave height and the mean wave period is presented in Figure 7A, where the numbers indicate the annual average occurrence times for each wave condition. It can be seen that the dominant wave period is distributed between 3 and 8 seconds, while the average meaningful wave height is below 3.5 meters for the vast majority of sea conditions. The energy of the waves per unit width can be expressed as follows:
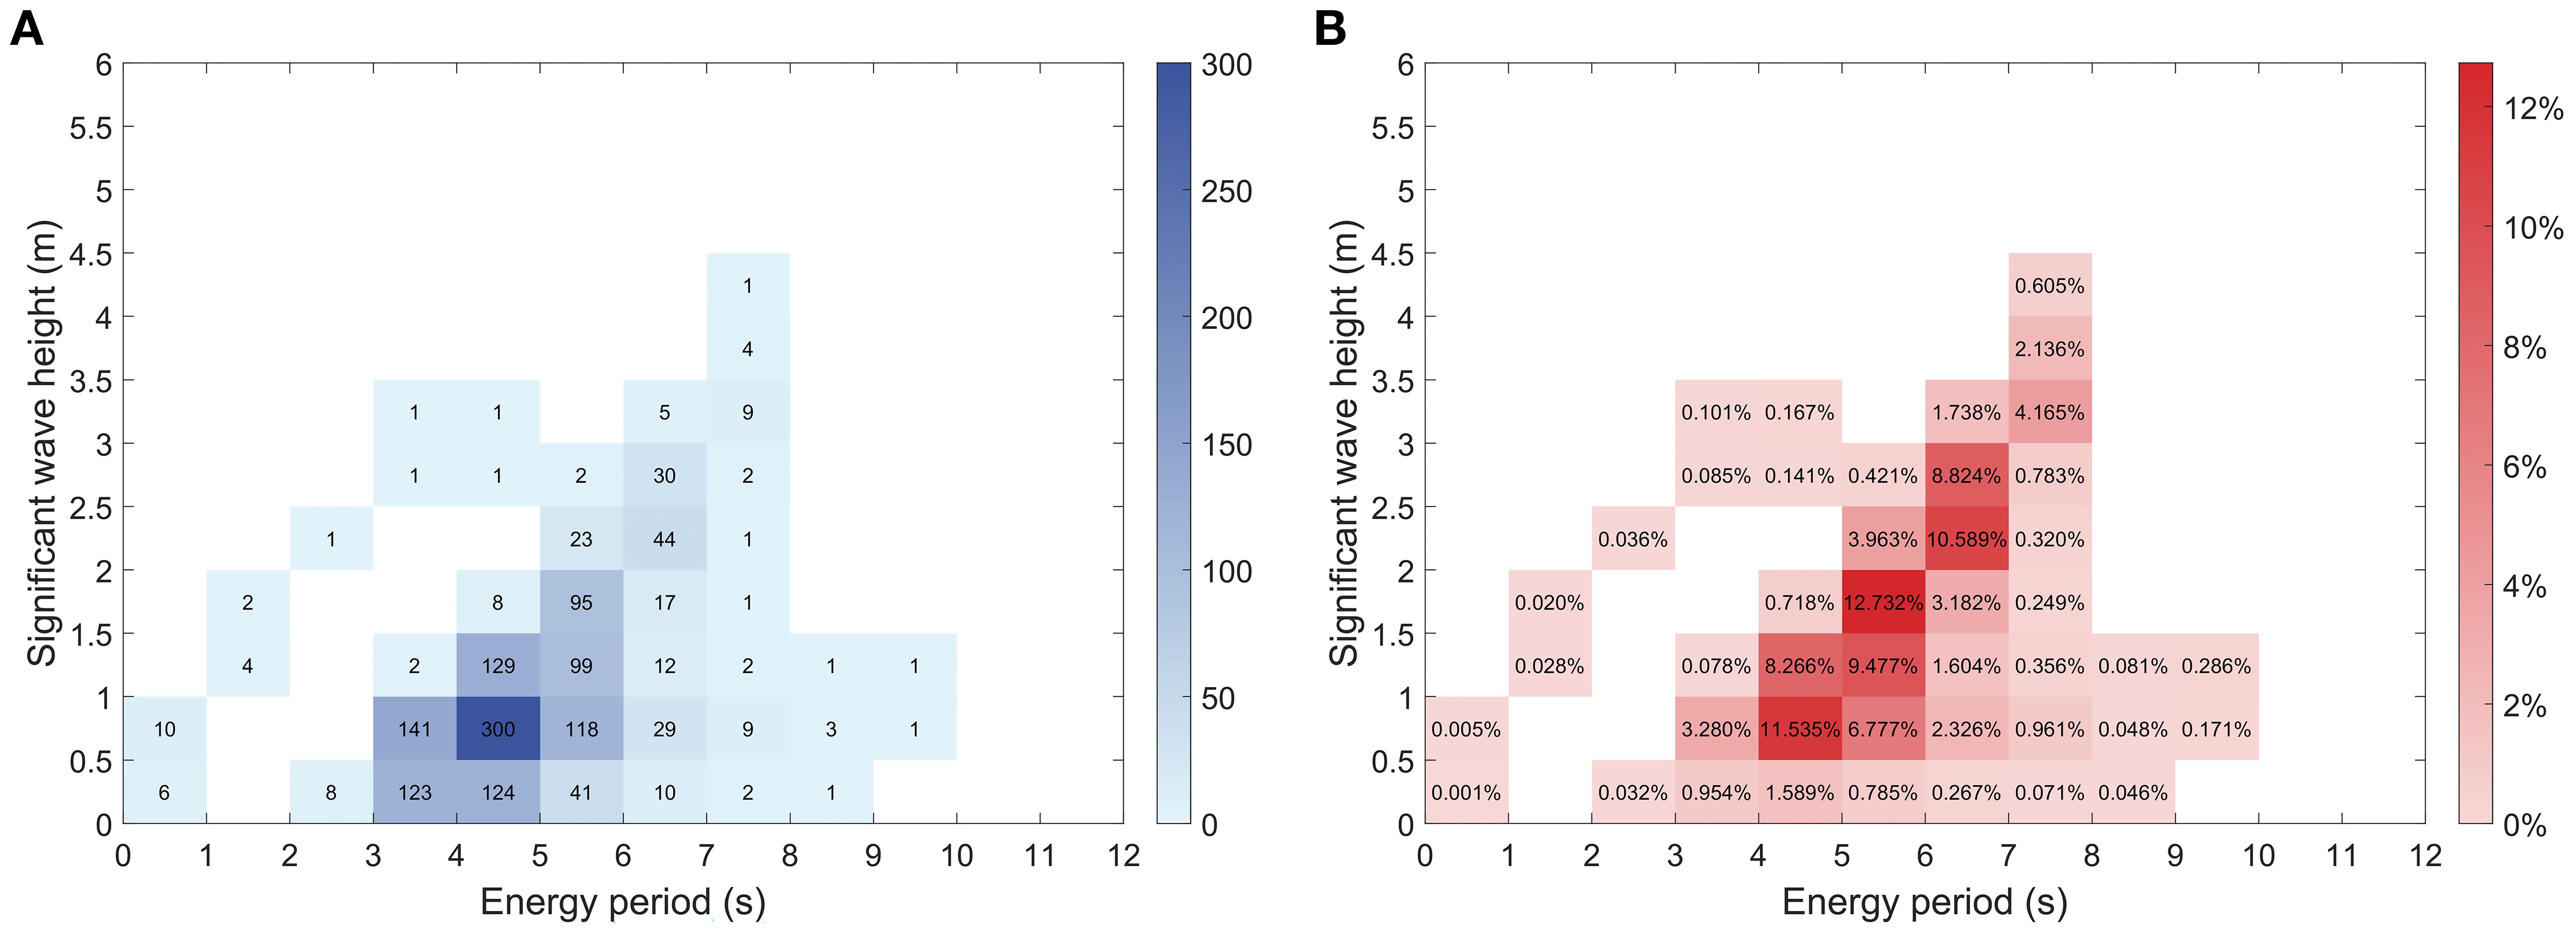
Figure 7. Wave energy distributions according to the wave conditions at Yellow Sea station. (A) Average annual occurrence times. (B) Wave energy contribution ratio.
Using the midpoint values of period and wave height for each interval in Figure 7A in combination with Equation 15, the wave energy contribution ratio for each sea state is estimated, and the results are presented in Figure 7B. Based on the joint distribution of wave height and period, as well as the distribution of the percentage of energy contribution, five groups of representative environmental conditions with regular wave types are identified comprehensively, with their specific parameters detailed in Table 3. From Figure 7B, it can be seen that the RLC3 environmental condition has the largest percentage of energy contribution and is therefore selected as the representative regular wave.

Table 3. Environmental conditions.
In order to maximize the wave capture power of the WEC, Figure 8 illustrates the power capture of a single WEC under the representative regular wave RLC3 with 11 different damping coefficients. The values at the ends are taken at large intervals to ensure the uniqueness of the power extreme, and the values in the middle are taken at smaller intervals with the aim of finding the optimal damping coefficient. The results clearly demonstrate the PTO damping coefficient has a significant effect on the power capture of the WEC. The power of the WEC tends to increase at damping coefficients from 1e5 to 1.3e6 N.m.s, and decreases at damping coefficients from 1.3e6 to 4e6 N.m.s. At a damping coefficient of 1.3e6 N.m.s, the WEC achieves its peak performance, capturing a power of 47.9 kW. Therefore, the damping coefficient of the WEC is kept constant at 1.3e6 N.m.s in all subsequent studies.
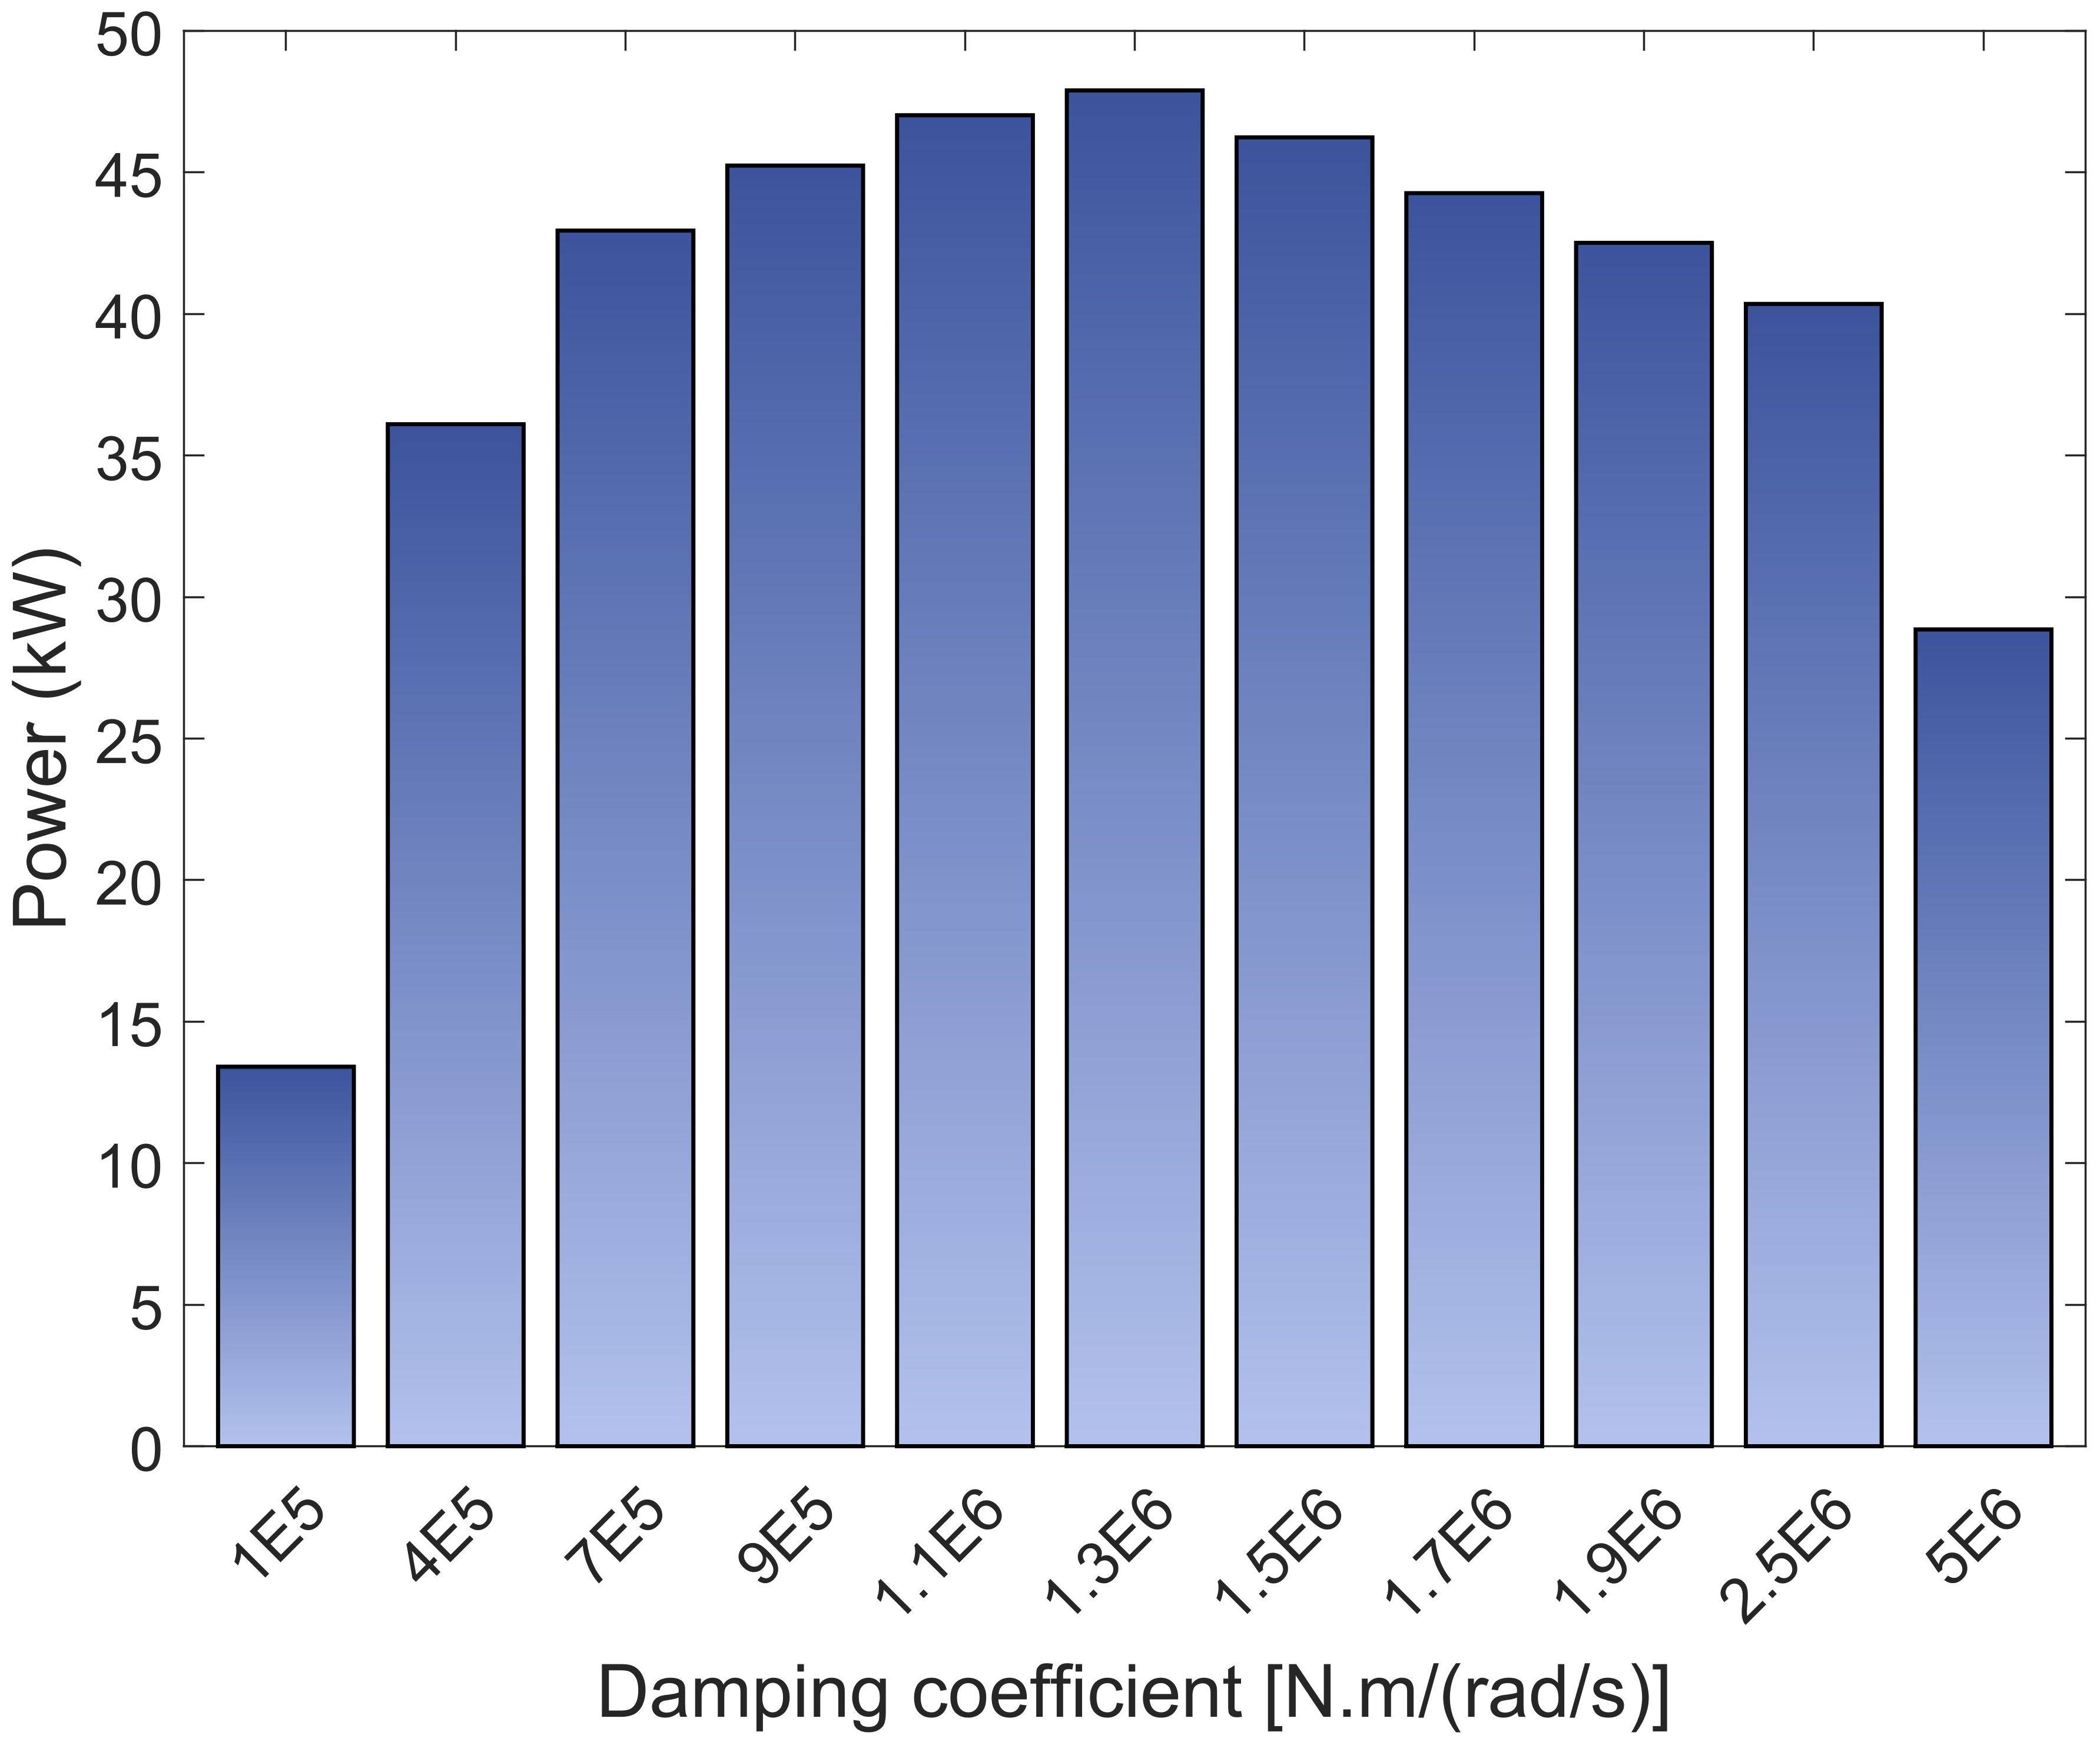
Figure 8. Power generation by a single Wavestar at different damping coefficients.
The motion of WECs and platforms generates radiation and diffraction, resulting in pronounced wave-structure interaction. These interactions alter the wave elevation and significantly influence the wave propagation direction. As a result, the local wave characteristics within the flow field can be changed by different structural layouts. In order to investigate the effect of different microarrays on the wave elevation around the systems, Figures 9–11 depict the wave contours under three regular wave conditions (RLC1, RLC3 and RLC5). Combining the results under the three regular wave conditions, it is clear that the difference in microarray forms exerts minimal impact on the flow field around the hybrid system. However, the disparity in maximum wave amplitude between the two wave directions is more pronounced for the hybrid system compared to the without microarray, indicating that the presence of WECs microarrays improves the sensitivity of the flow field around the hybrid system to the wave direction.
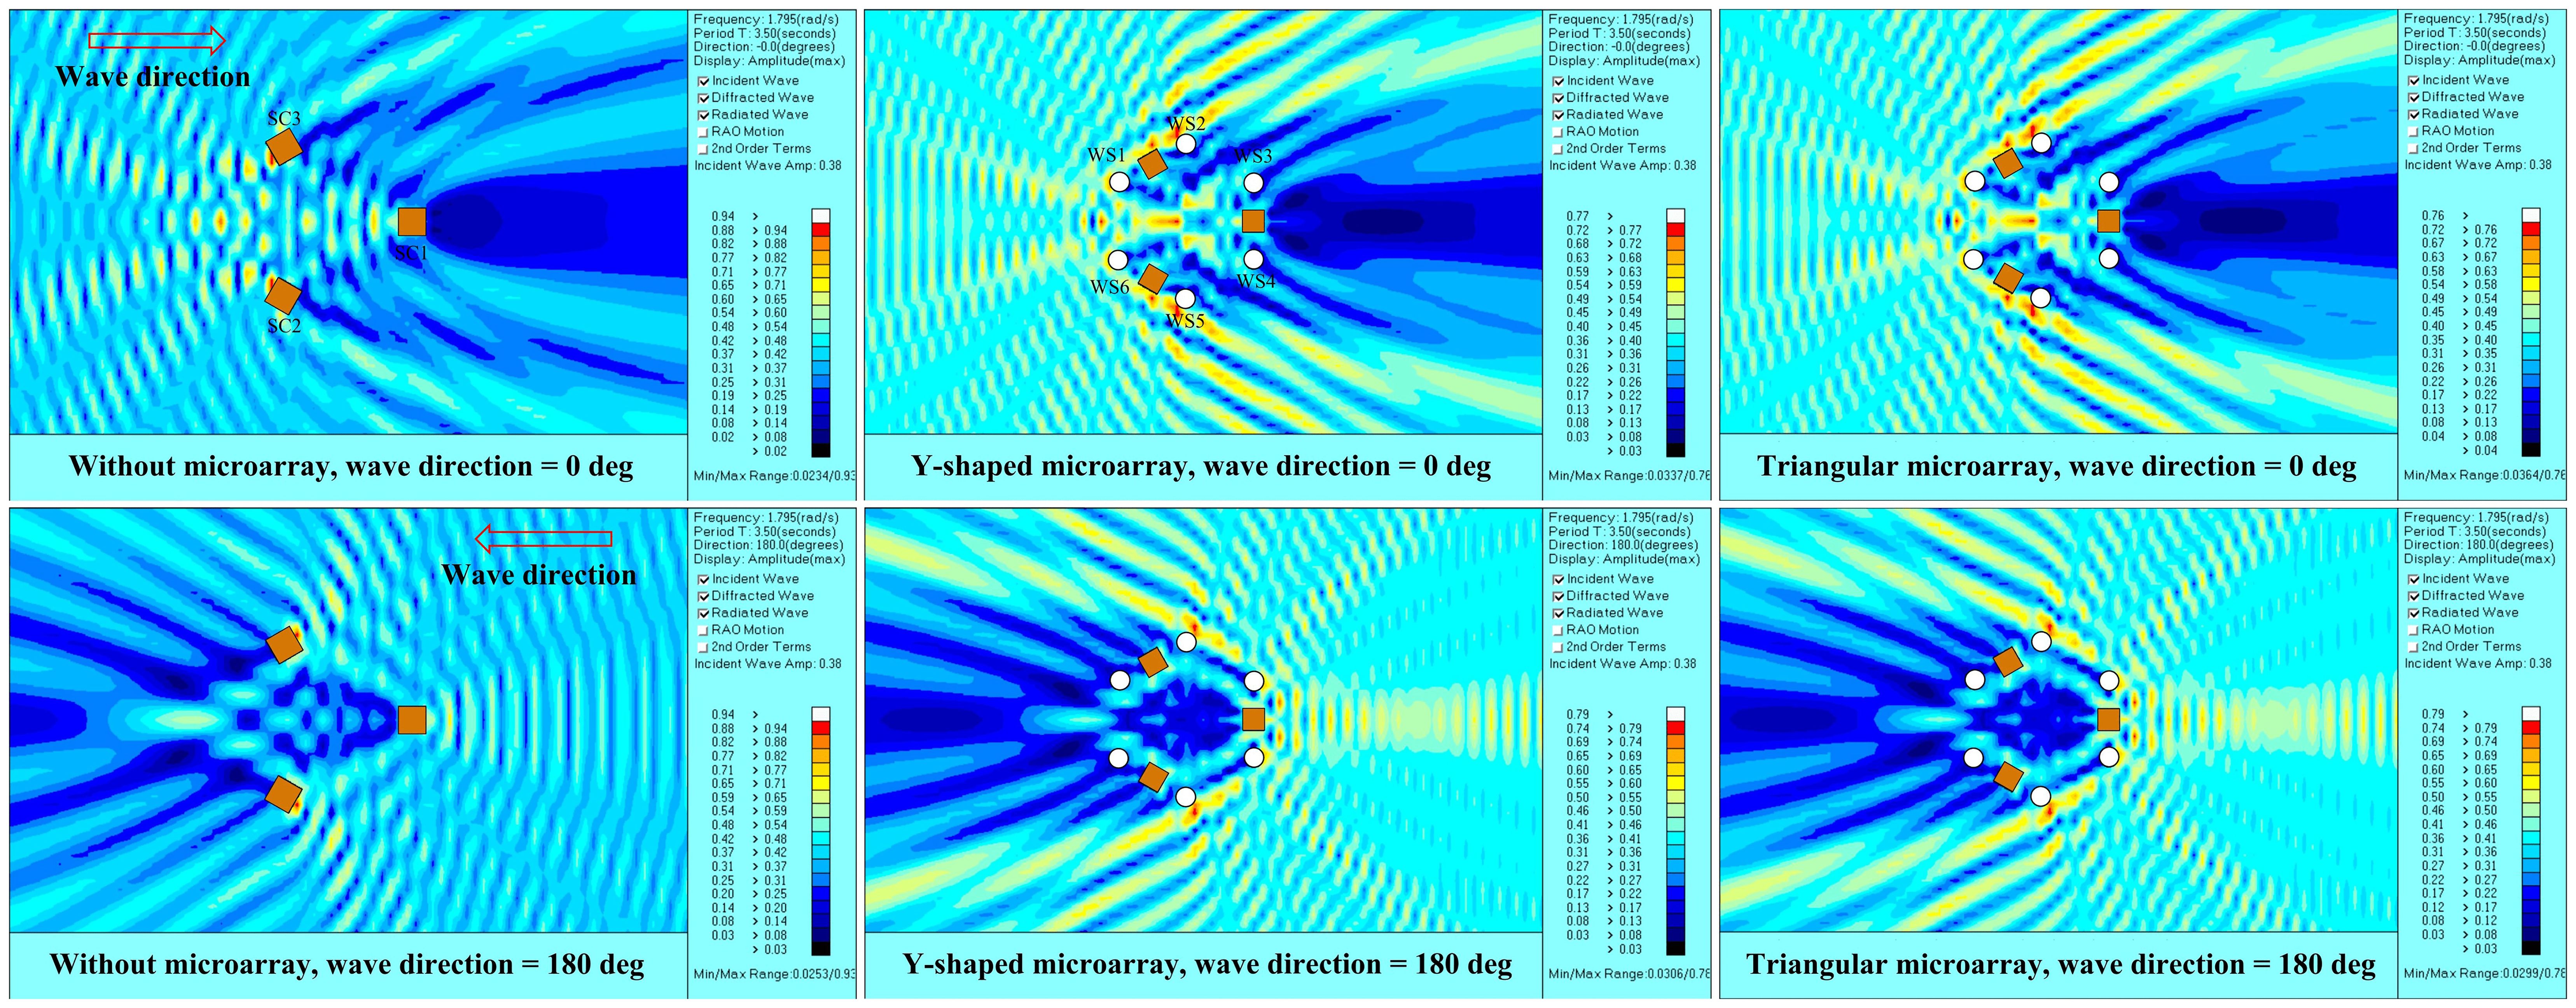
Figure 9. Wave contours of three microarray systems under RLC1 regular wave.
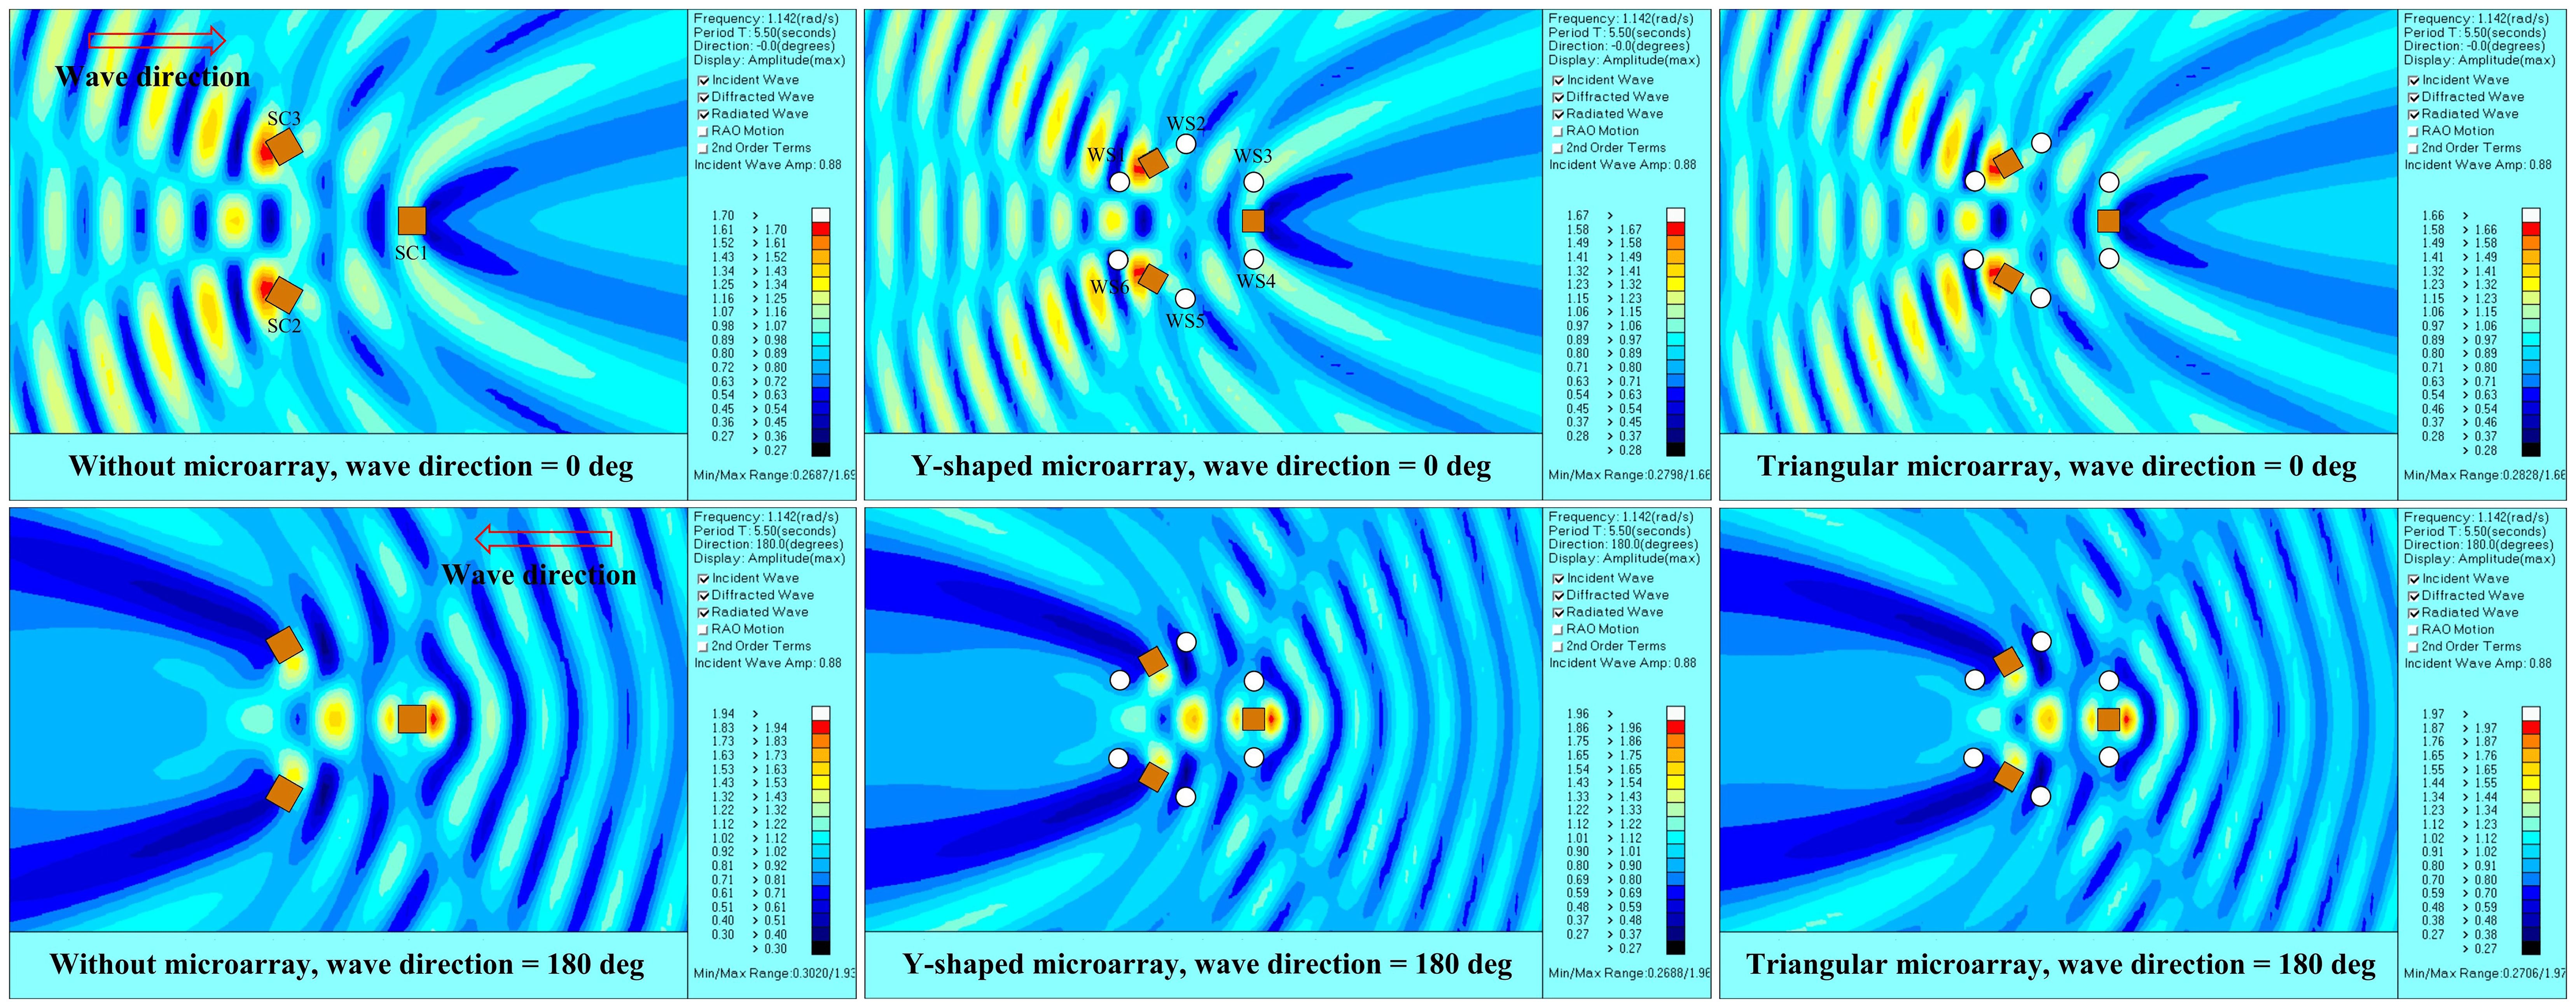
Figure 10. Wave contours of three microarray systems under RLC3 regular wave.
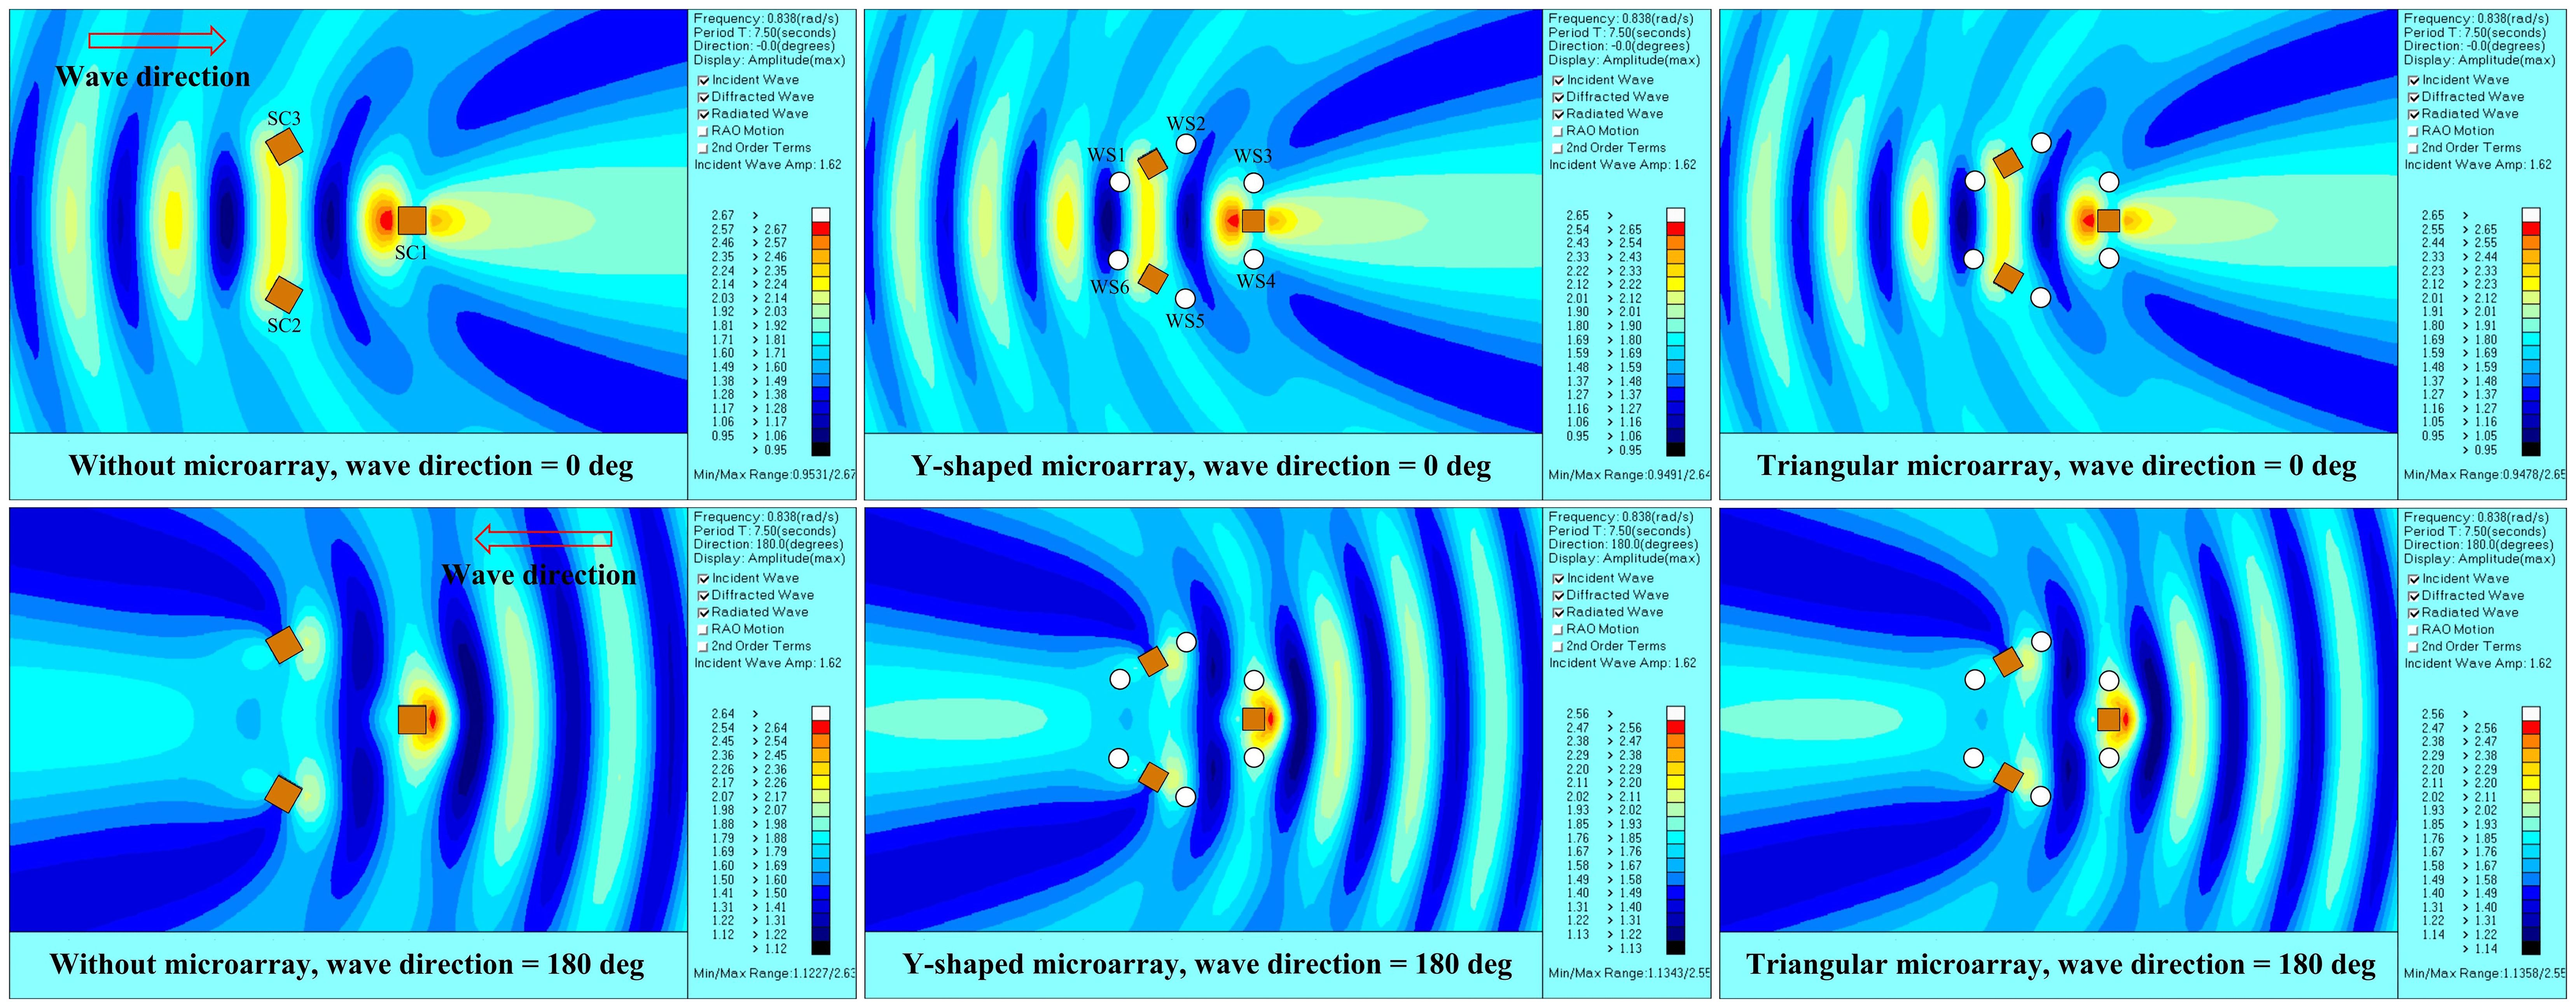
Figure 11. Wave contours of three microarray systems under RLC5 regular wave.
Under the RLC1 environmental condition with a 0° wave incidence, the high wave elevations for the without microarray are observed on the weather side of side columns 2 and 3 (SCs 2 and 3). For the hybrid system, the high wave elevations appear on the weather side of WECs 2 and 5 as well as on the weather side of SCs 2 and 3. In addition, the distribution areas of high wave elevations near the WECs are significantly larger than those near the side columns. This phenomenon is more pronounced when the wave direction is 180°. The high wave elevations for the without microarray system still appear on the weather side of SCs 2 and 3, while for the hybrid system, the high wave elevations are concentrated only on the weather sides of WECs 2 and 5. This observation suggests that the hybrid system can effectively reduce the wave amplitudes near the FOWT and amplify the wave amplitudes near the WECs under short waves, which is beneficial for both system motion response and absorbed power.
Under RLC3 and RLC5 environmental conditions, it can be observed from the figure that the differences in flow fields between the without microarray and the hybrid system are negligible. This is mainly due to the fact that under long period wave conditions, the wave-structure interactions are predominantly governed by the size of the structure. In the hybrid system, the stiffness and size of the WEC are significantly smaller than those of the FOWT, resulting in a much weaker influence on the wave contours compared to the FOWT platform. Under the RLC3 regular wave with a 0° wave incidence, high wave elevations are observed on the weather sides of both SCs 2 and 3. When the wave direction is 180°, the high wave elevations all appear in the weather side of SC1 and within the flow field surrounded by the three side columns. However, for the hybrid system, the wave elevations around the WECs are all lower than the incident wave amplitude. Under the RLC5 regular wave, the high wave elevation distributions are located on the weather side of SC1 for both wave incident directions. A significant portion of the flow field between the three side columns exhibits a low wave elevation distribution due to mutual interference of the structures. Most of the WECs are positioned to avoid the low wave elevation flow field and are surrounded by wave elevations exceeding the incident wave amplitude.
To examine the effect of microarrays on the motion of the platform, Figures 12–14 show the FOWT motion response spectra of the three systems under three constant regular waves (RLC1, RLC3 and RLC5) with the incidence directions of 0° and 180°, respectively. Owing to the symmetry of the structure and loads, the motion amplitudes of the sway, roll and pitch degrees of freedom are very small. Consequently, this section only discusses the surge, heave and roll degrees of freedom.
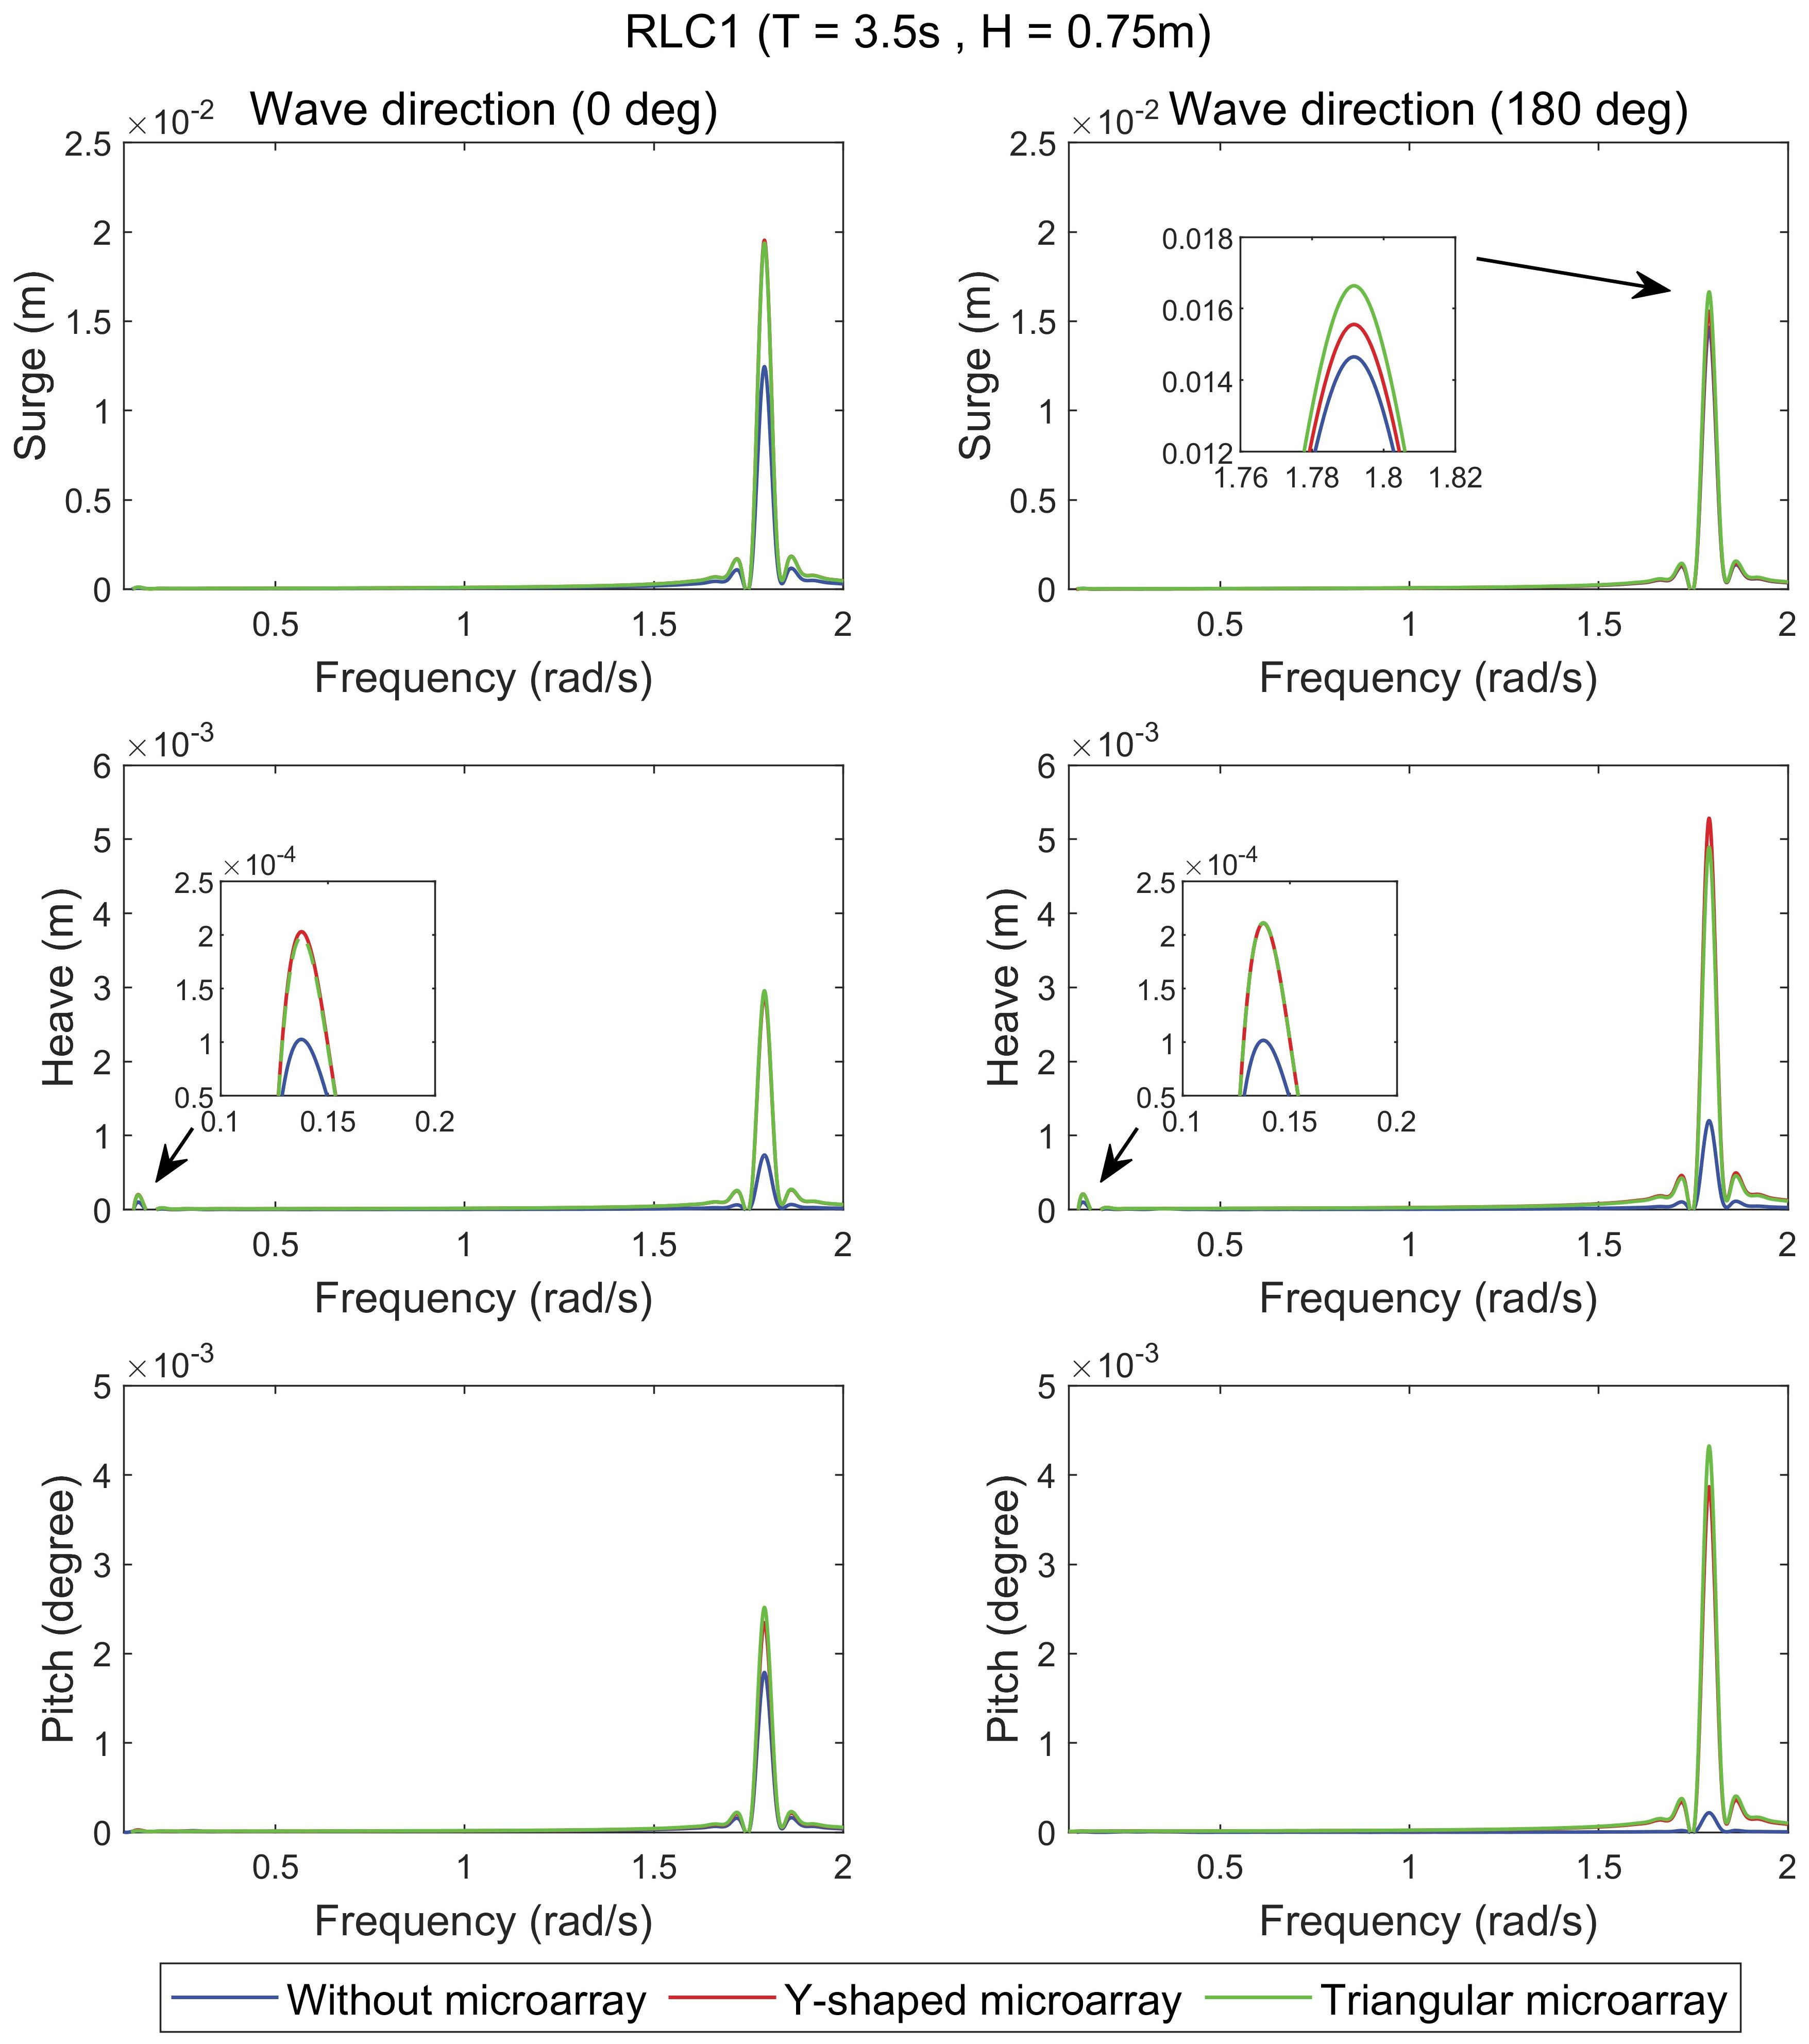
Figure 12. FOWT motion response spectrum under RLC1 regular wave.
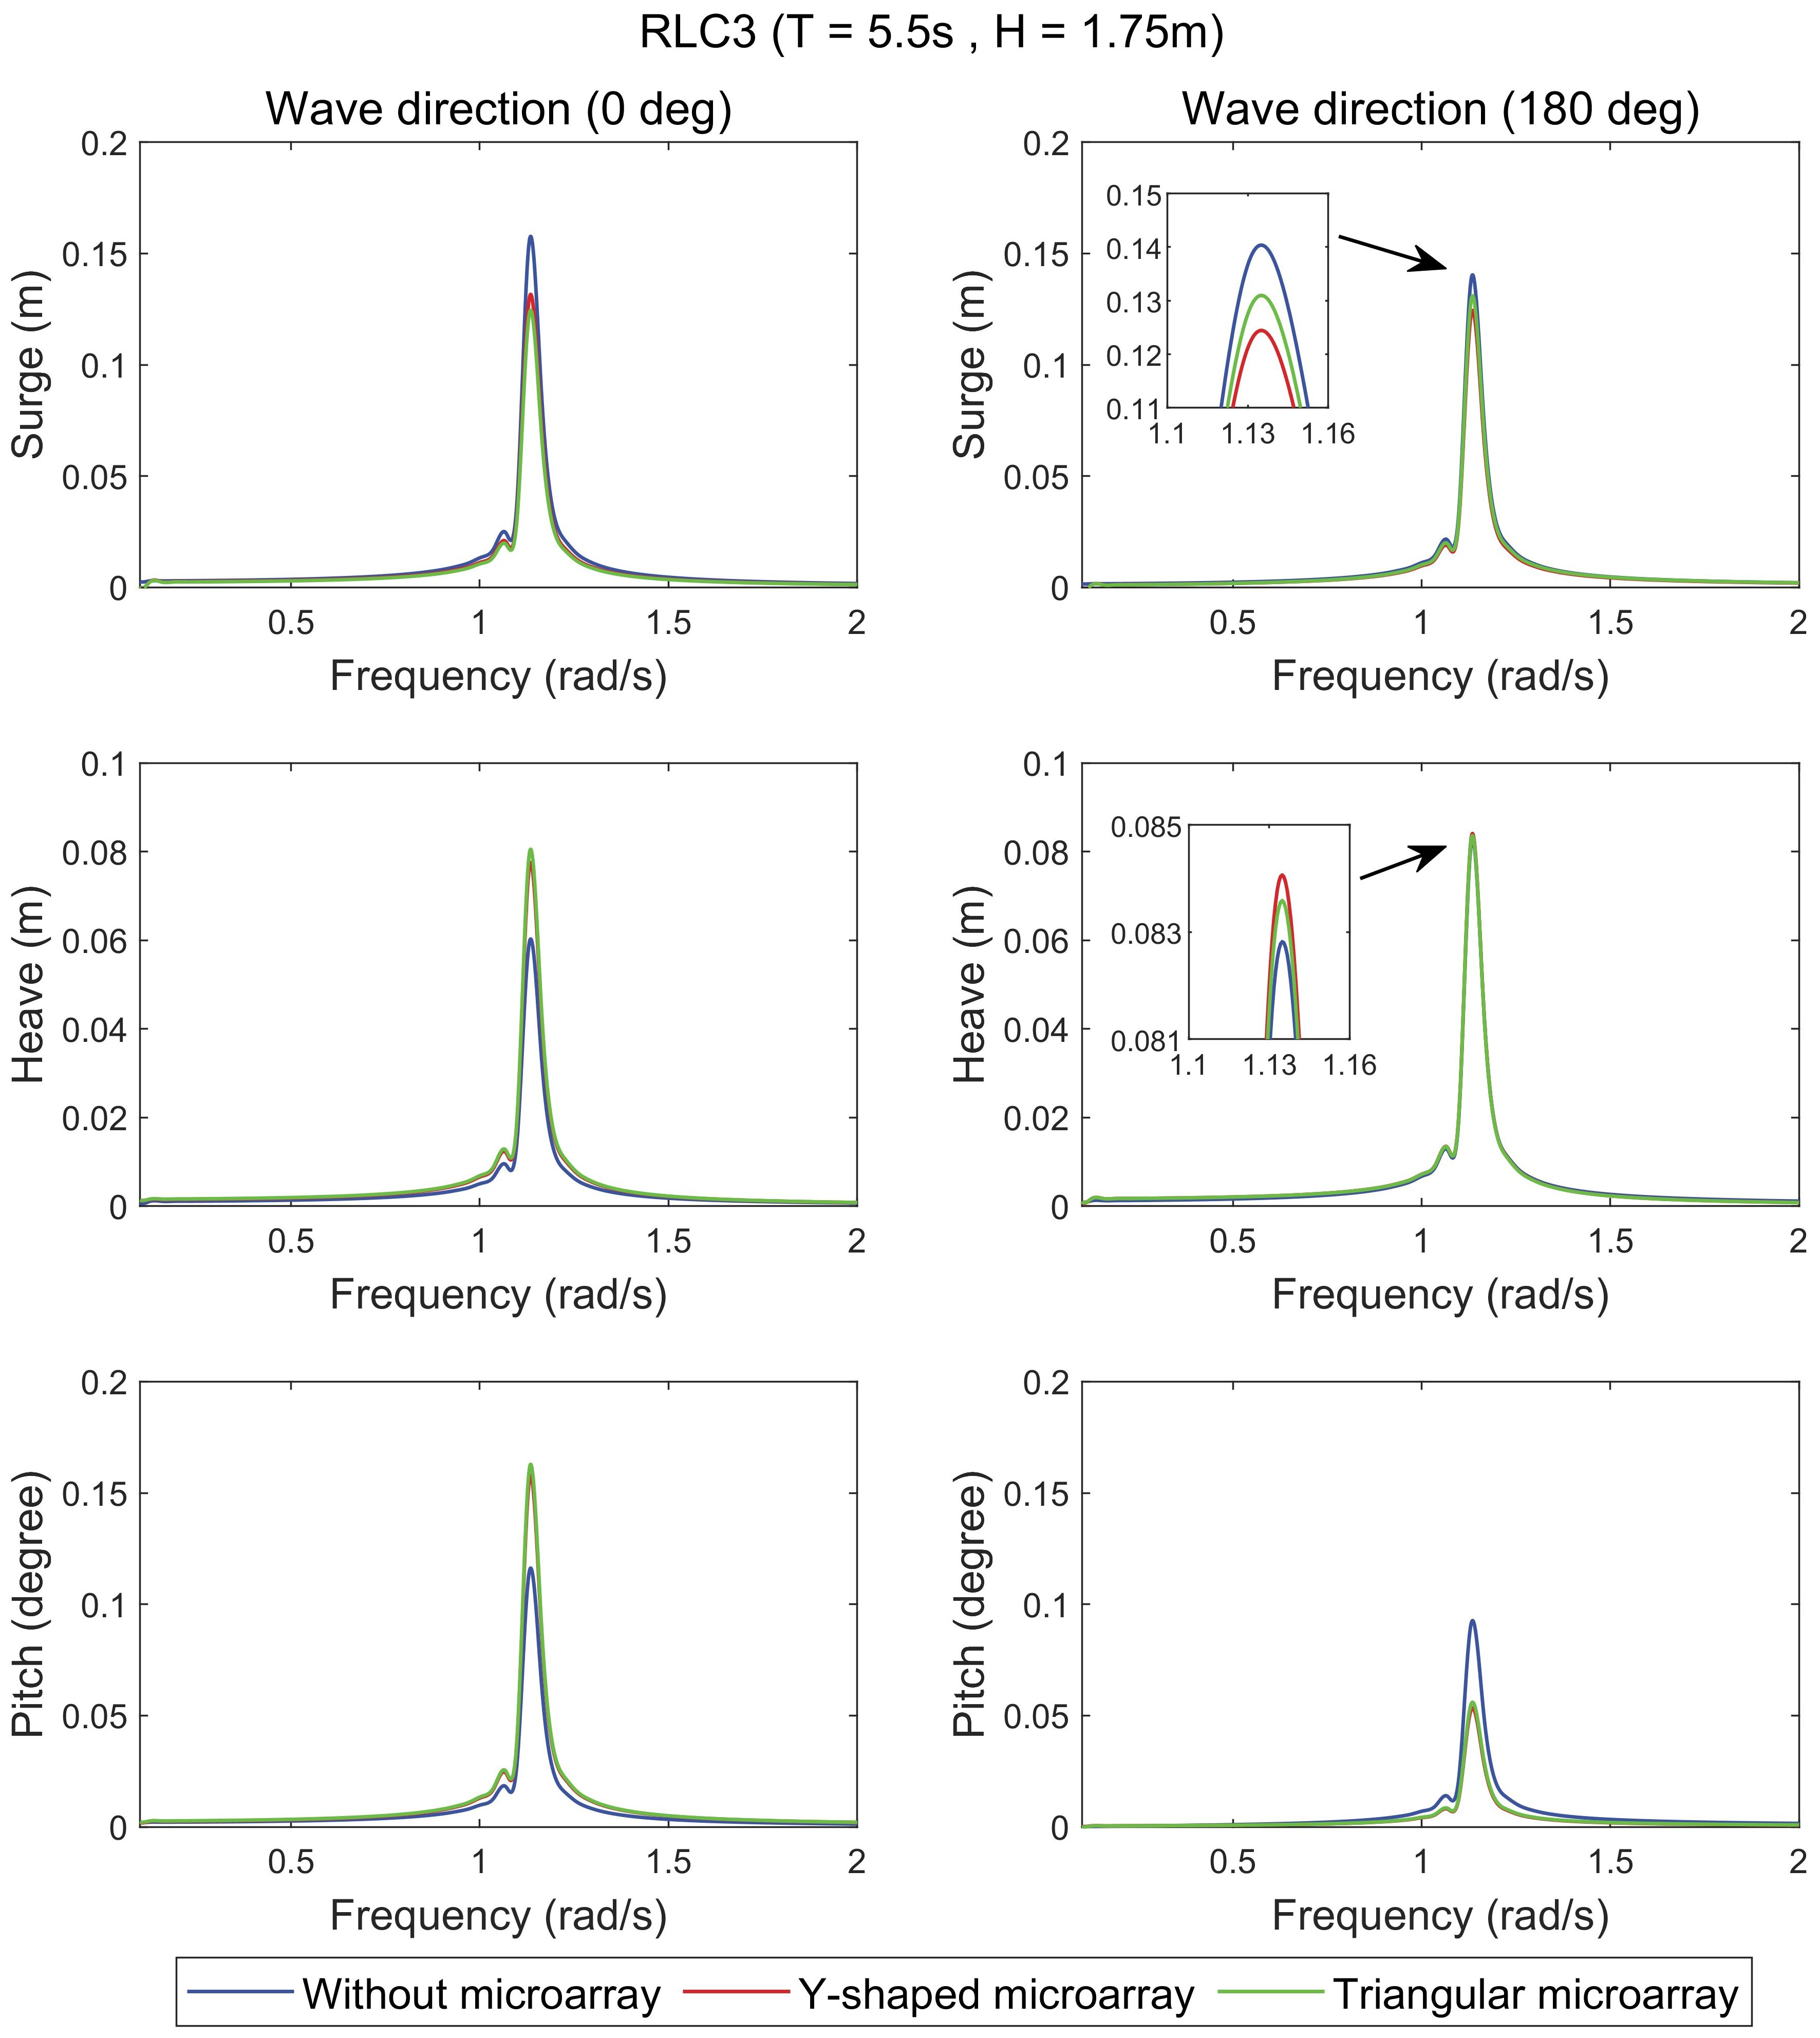
Figure 13. FOWT motion response spectrum under RLC3 regular wave.
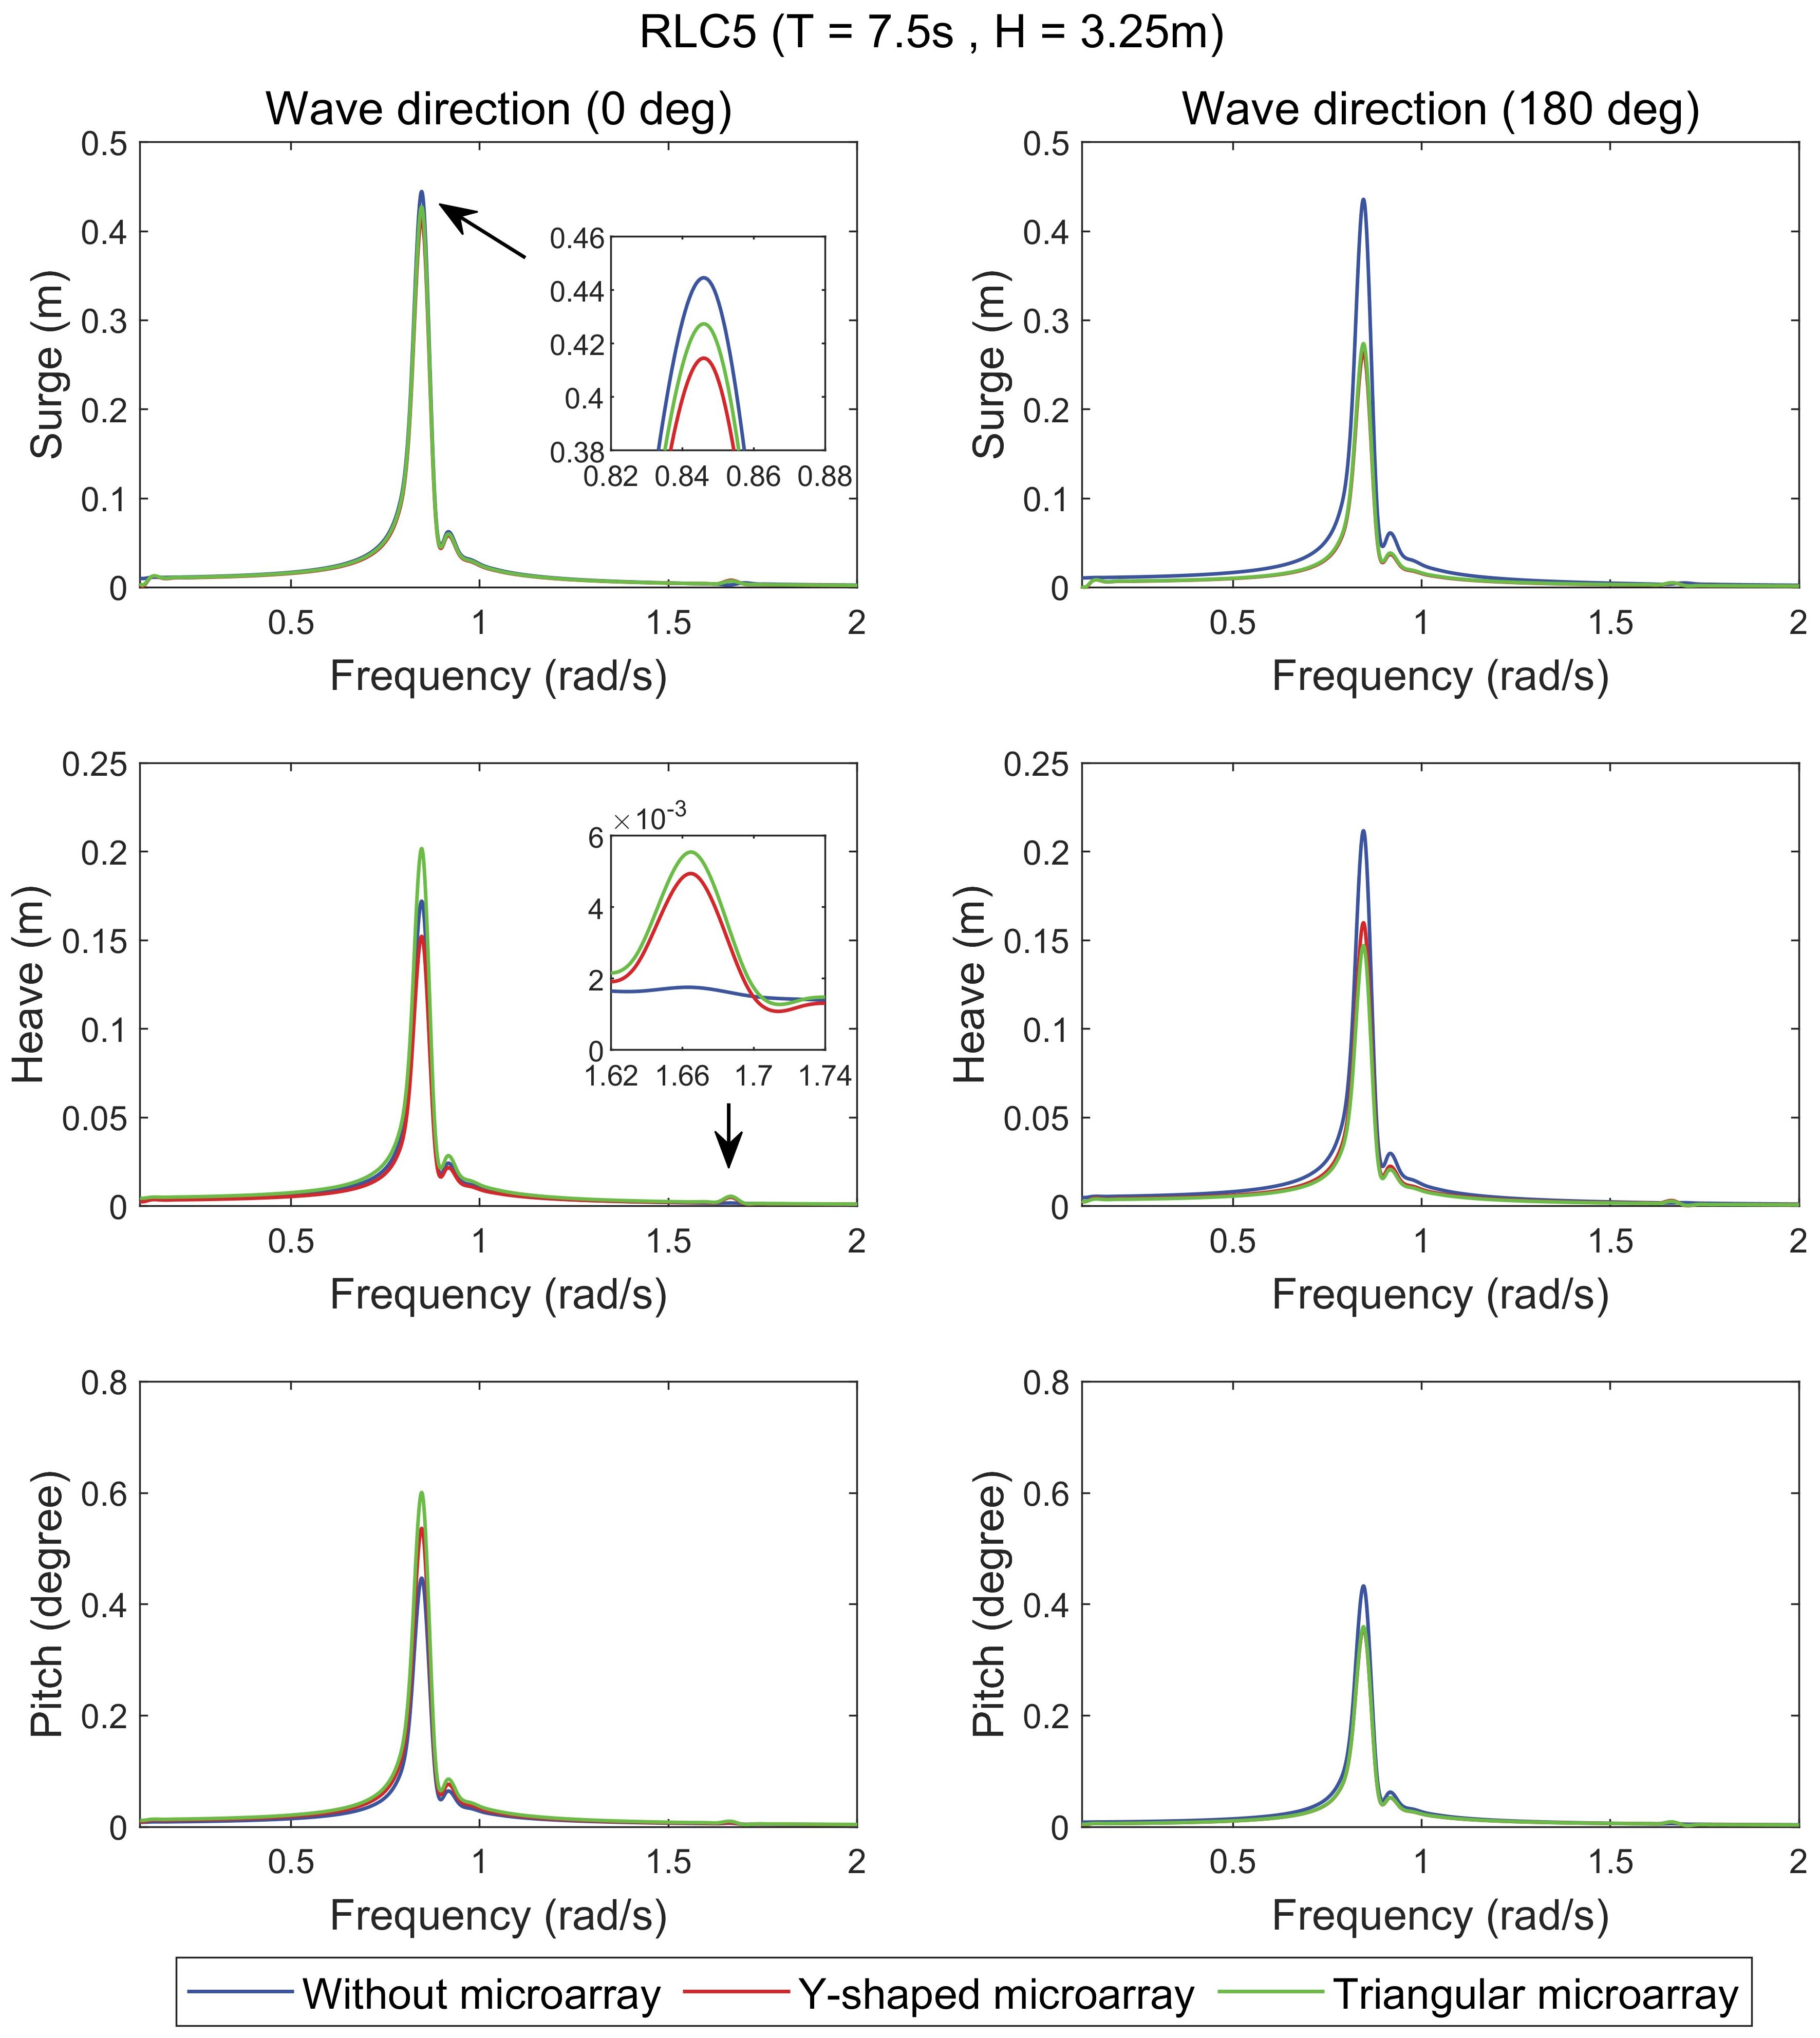
Figure 14. FOWT motion response spectrum under RLC5 regular wave.
Regarding the surge response, it can be observed from the figures that the WECs microarray under the RLC1 condition led to an increase in the response amplitude, whereas the response amplitude of the hybrid system is smaller than that of the without microarray under the RLC3 and RLC5 conditions. Figure 15 demonstrates the percentage increase or decrease in the maximum wave excitation force experienced by the FOWT in the hybrid system relative to the without microarray. It can be seen from the figure that both hybrid systems increase the wave excitation force experienced by the FOWT under the RLC1 condition. However, under the RLC3 and RLC5 conditions, the presence of the WECs microarray decreases the wave excitation force acting on the FOWT. Additionally, under the RLC1 and RLC3 conditions, the maximum wave excitation forces experienced by the FOWT in both hybrid systems show minimal difference. Under the RLC5 condition, the hybrid system with a lower maximum wave excitation force also exhibits a smaller surge response. It can be inferred that the WECs microarray influences the surge motion characteristics by altering the magnitude of the wave excitation force experienced by the FOWT. Notably, when the wave is incident at 180°, the Y-shaped microarray exhibits a lower surge amplitude than the Triangular microarray under all regular wave conditions.
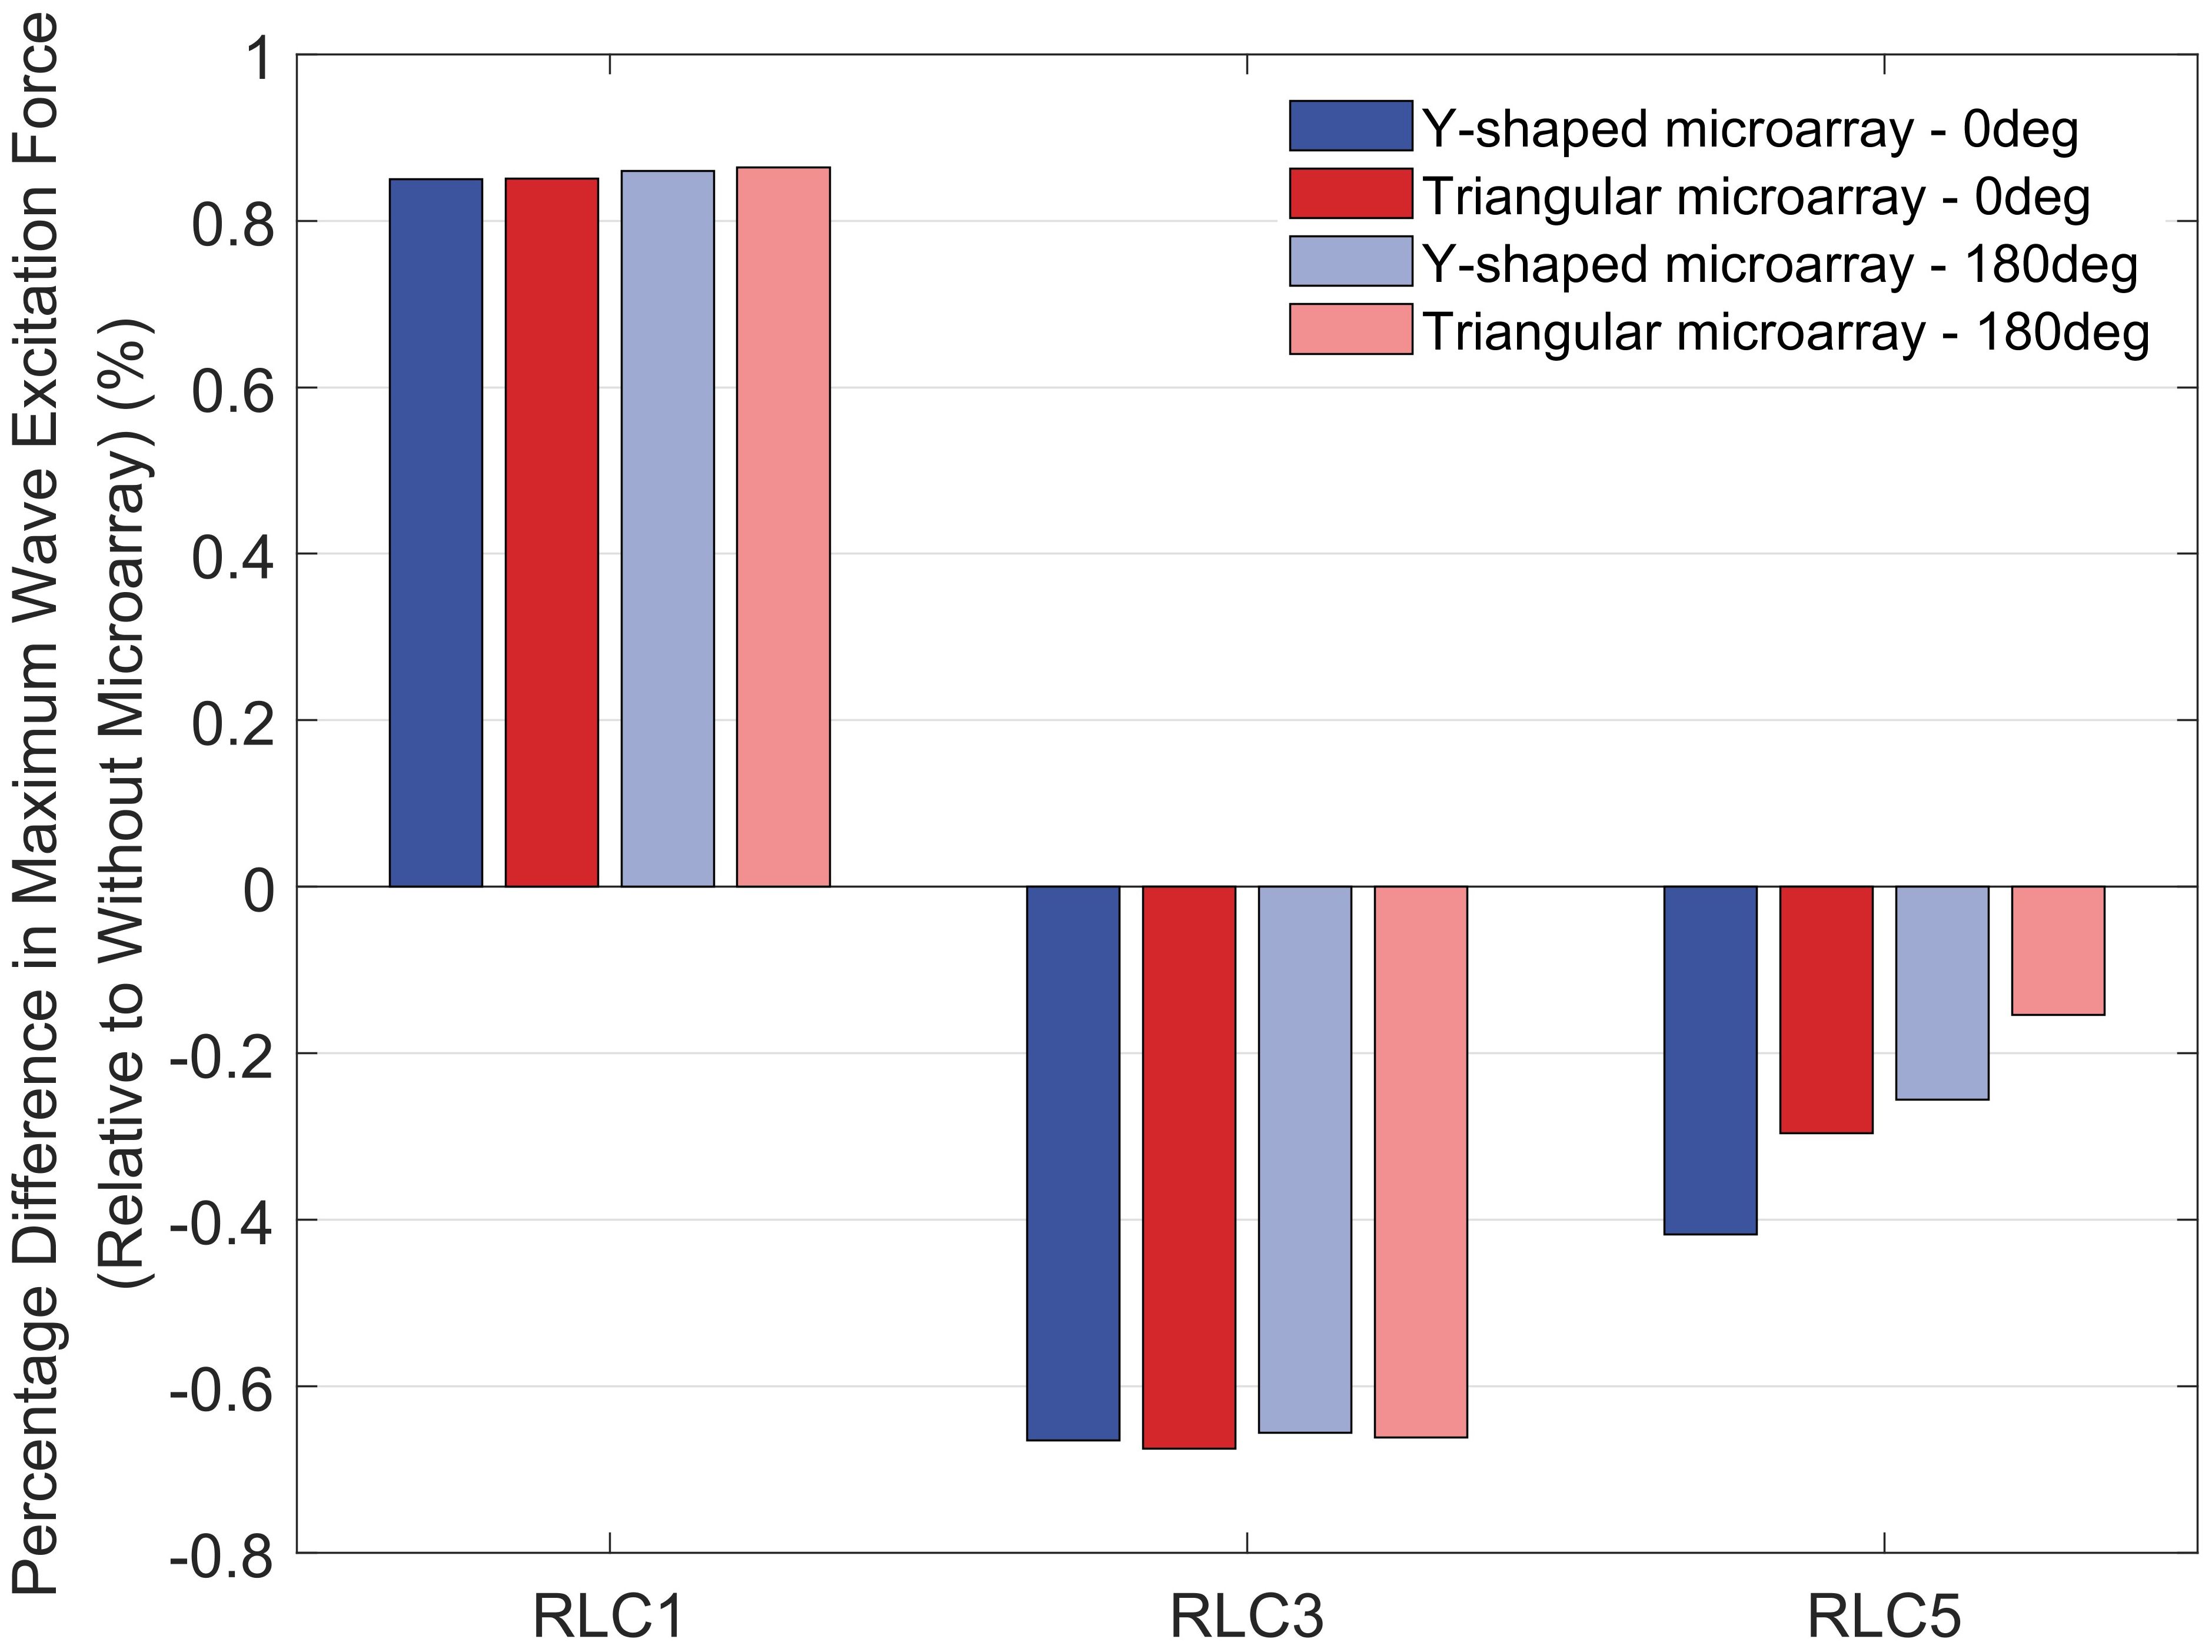
Figure 15. Percentage increase or decrease in maximum wave excitation force.
Regarding the heave response, it can be observed from the figures that a slight low-frequency component appears under the RLC1 condition, with the amplitudes of both hybrid systems being identical and larger than that of the without microarray. Under RLC5 conditions at 0° wave incidence, a slight high-frequency component appears in the hybrid system, with the amplitude of the Triangular microarray being greater than that of the Y-shaped microarray, while no such component is observed in the without microarray. The heave amplitude of the FOWT in the hybrid system is larger than that in the without microarray under both the RLC1 and RLC3 conditions. When comparing the two hybrid systems, the Y-shaped microarray exhibits a more stable heave response at 0° wave incidence, while the Triangular microarray has a smaller heave amplitude at the 180° wave direction. Interestingly, under the RLC5 condition at 0° wave incidence, the amplitude of the without microarray lies between those of the Y-shaped microarray and the Triangular microarray, a phenomenon not observed under any other loading conditions.
Regarding the pitch response, it can be observed from the figures that the Y-shaped microarray exhibits more stable motion characteristics, with response amplitudes smaller than those of the Triangular microarray under all loading conditions. The WECs microarray increases the response amplitude under RLC1 condition, however, differences in the performance of the hybrid system are found under different wave incidence directions under RLC3 and RLC5 conditions. Figure 13, Figure 14 indicate that under RLC3 and RLC5 conditions, the hybrid system reduces the pitch amplitude of the FOWT at 180° wave incidence. Figures 16 demonstrates the pitch motions of WECs and FOWT in the time domain under RLC3 and RLC5 conditions. Since the structure is symmetric and the waves are incident along the symmetry axis, only WECs1, 2 and 3 among the WECs are analyzed. The motion direction of WEC3 in the Y-shaped microarray is perpendicular to the incident wave directions, causing its pitch motion curve to nearly coincide with that of the FOWT. It can be inferred from the figures that a restoring moment is generated when the pitch motion phase difference between the WECs with large amplitudes and the FOWT exceeds 1/4π. Taking the RLC3 condition as an example, at 0° wave incidence, the phase difference between the pitch motion of all WECs and the FOWT is less than 1/4 π. When the wave direction is 180°, the phase difference between the pitch motions of WECs 1 and 2 in the Y-shaped microarray, and WECs 1 and 3 in the Triangular microarray relative to the FOWT exceeds 1/4π. Under these conditions, the pitch amplitude of the FOWT in the hybrid system is smaller than that in the without microarray. Although the phase differences in pitch motion between WEC2 in the Y-shaped microarray and the FOWT, as well as between WEC3 in the Triangular microarray and the FOWT, are less than 1/4π, their pitch-increasing effects are outweighed by the combined pitch-reducing effects of the other WECs on the FOWT. The same pattern is observed under the RLC5 regular wave condition.
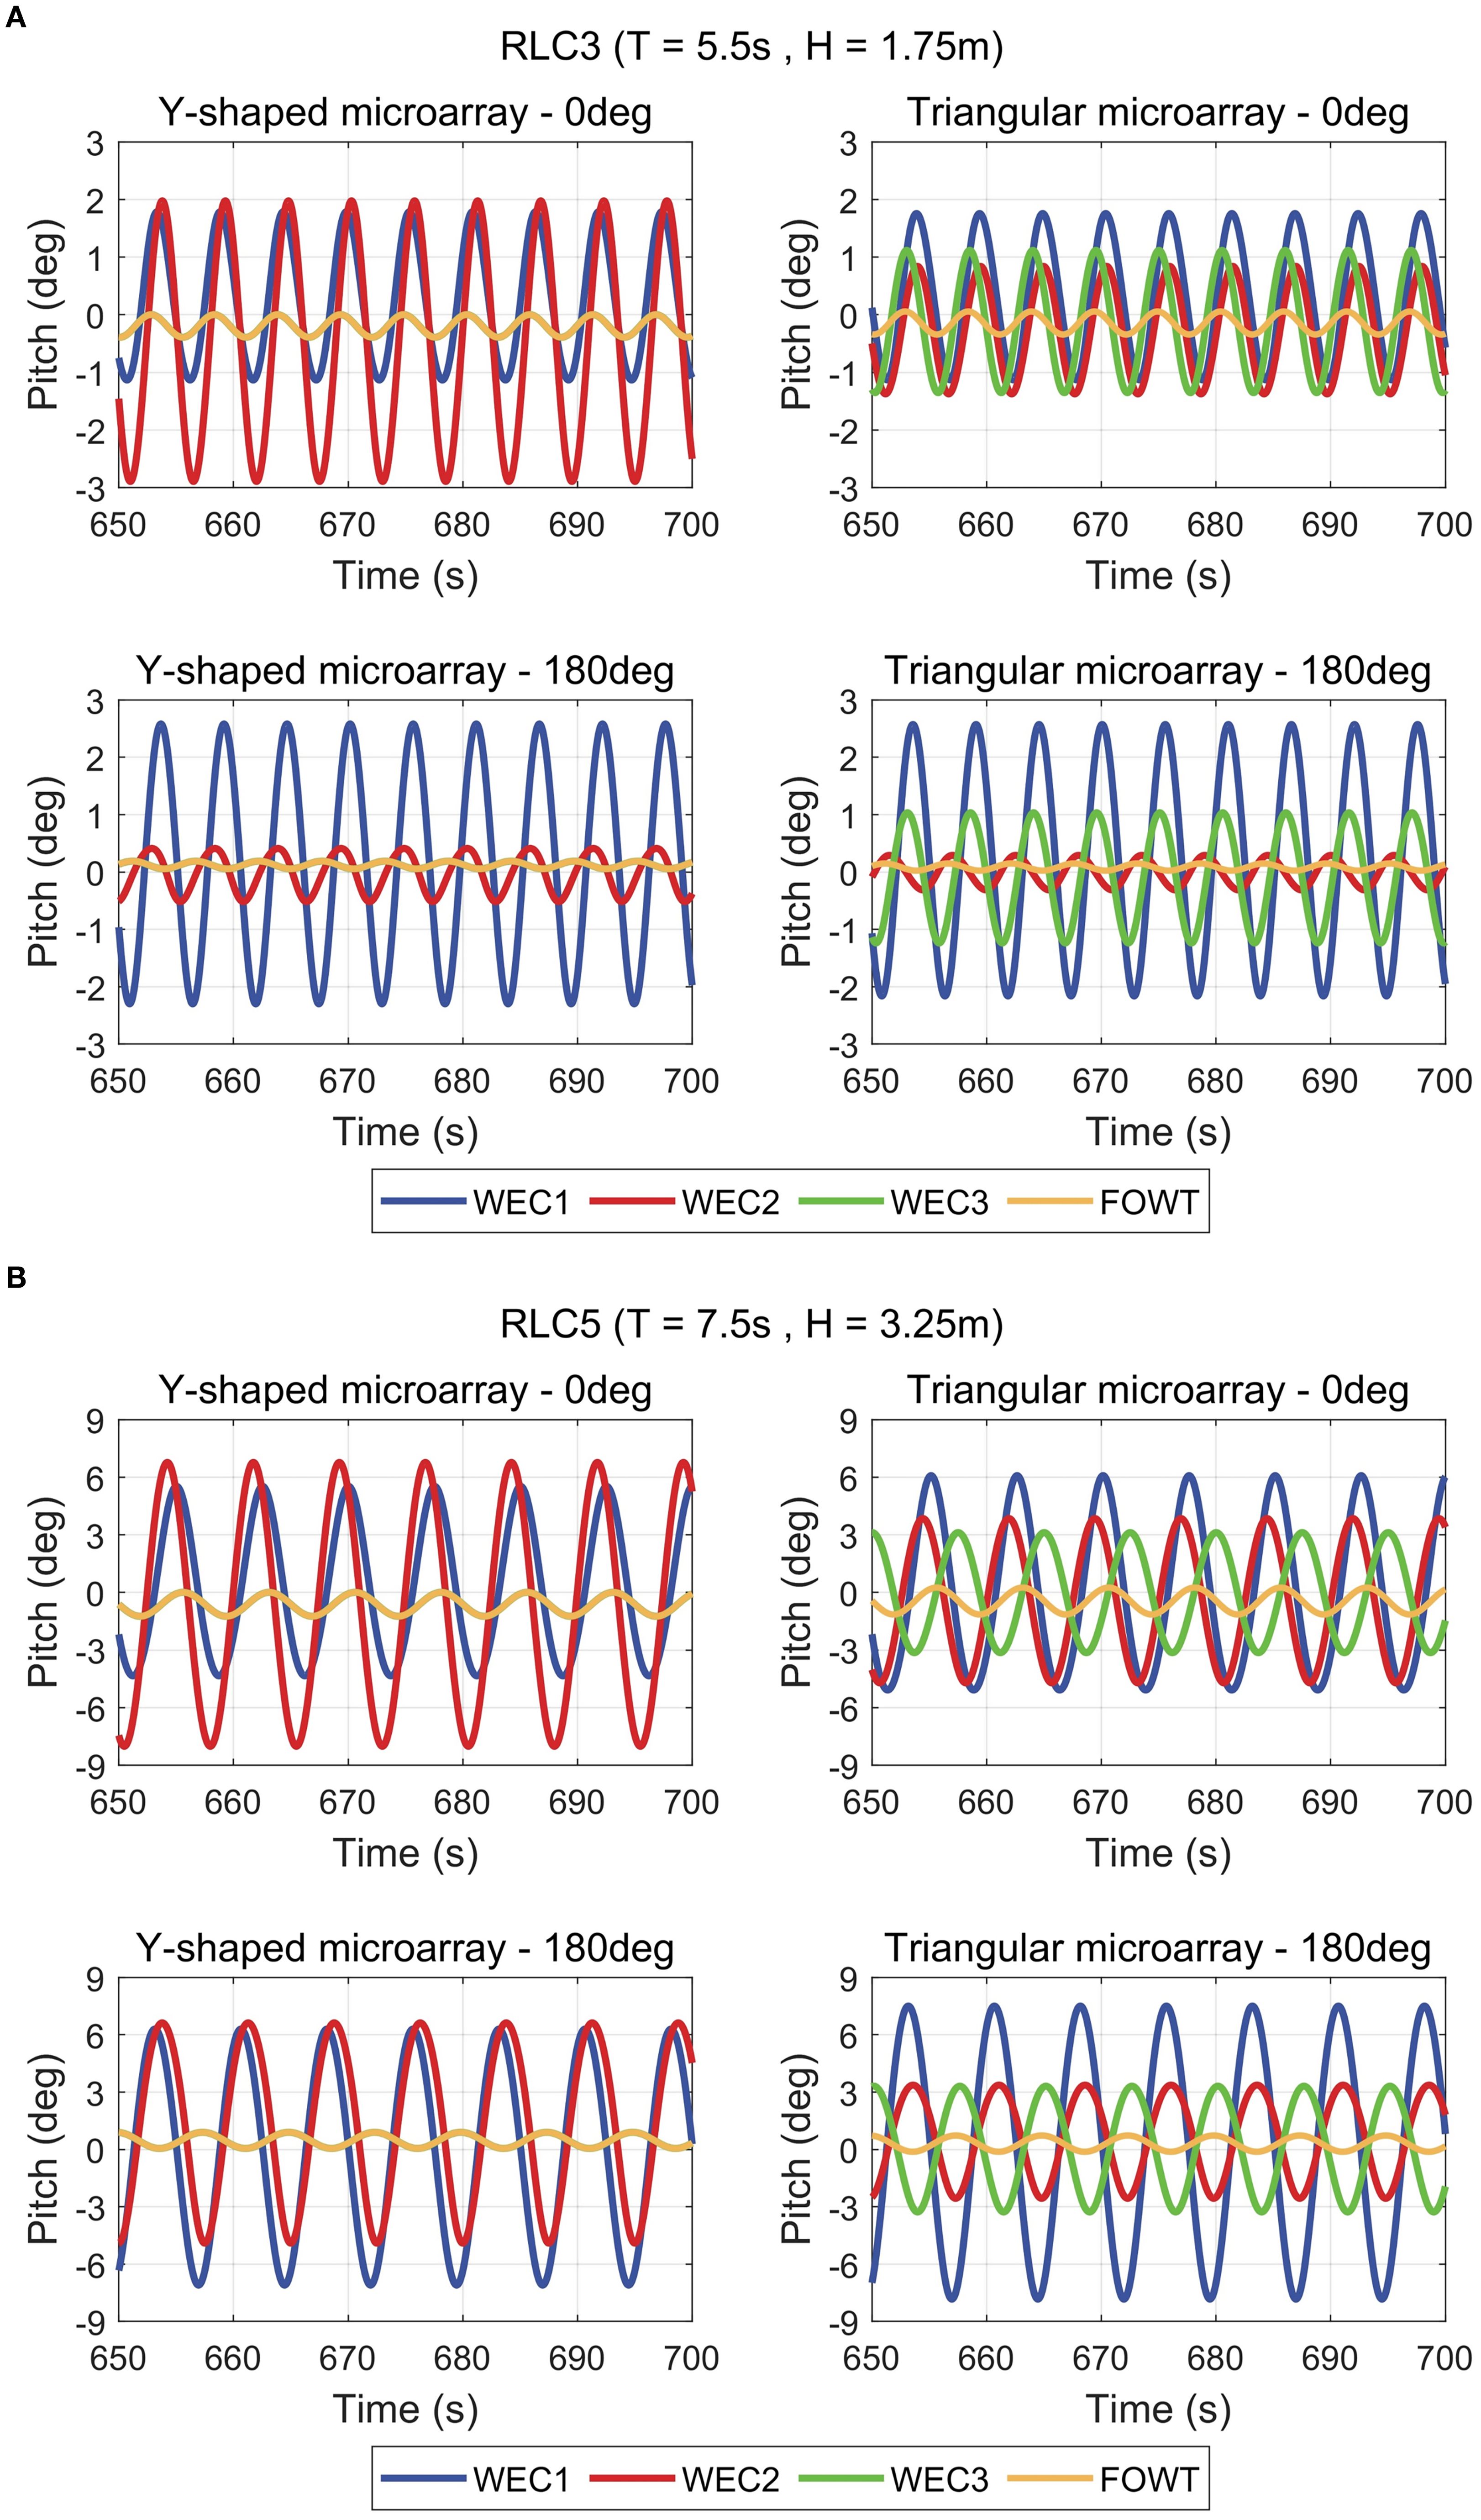
Figure 16. Pitch motions of WECs and FOWT in the time domain under different regular waves. (A) RLC3 regular wave. (B) RLC5 regular wave.
In summary, the WECs microarray has an effect on the motion response of the FOWT, with more effective motion suppression observed under long wave conditions, which enhances the survivability of the hybrid system in complex sea states. The primary contribution to the motion of the FOWT across all three degrees of freedom originates from the wave-frequency component. When comparing the two hybrid systems, the Y-shaped microarray proves to be more favorable for enhancing the stability of the FOWT. In particular, under the large amplitude RLC5 regular wave condition, the motion responses across all the counted degrees of freedom are reduced, except for the heave degree of freedom at 180° wave incidence.
In order to investigate the effect of WECs microarray on the mooring tension, Figures 17 shows the maximum tension responses of mooring lines 1 (L1), L5, and L6 for the three systems under 0° and 180° wave directions, respectively. Due to the symmetry of the systems relative to the wave incidence direction, analyzing half of the mooring lines suffices to reflect the overall trend. It can be found from the figure that the difference in microarray form has minimal effect on the tension response. The maximum tension responses in each system at 0° wave incidence are generally smaller than those at 180° wave incidence. This is primarily because, at 0° incidence, more mooring lines are located upstream of the wave incidence direction, providing greater mooring recovery for the FOWT and thereby reducing the concentration of mooring tension responses. The difference in tension responses between mooring lines in the without microarray is small under all environmental conditions. However, the presence of WECs microarray disrupts the balance of mooring tensions, particularly under long wave conditions, as the transfer of larger wave forces through WECs to the mooring lines exacerbates this imbalance. Consequently, some mooring lines exhibit an increase in the peak tension response. Furthermore, the WECs microarray enhances the sensitivity of the mooring tension responses to the wave directions, resulting in a larger difference in mooring tension between two different wave directions in the hybrid system.
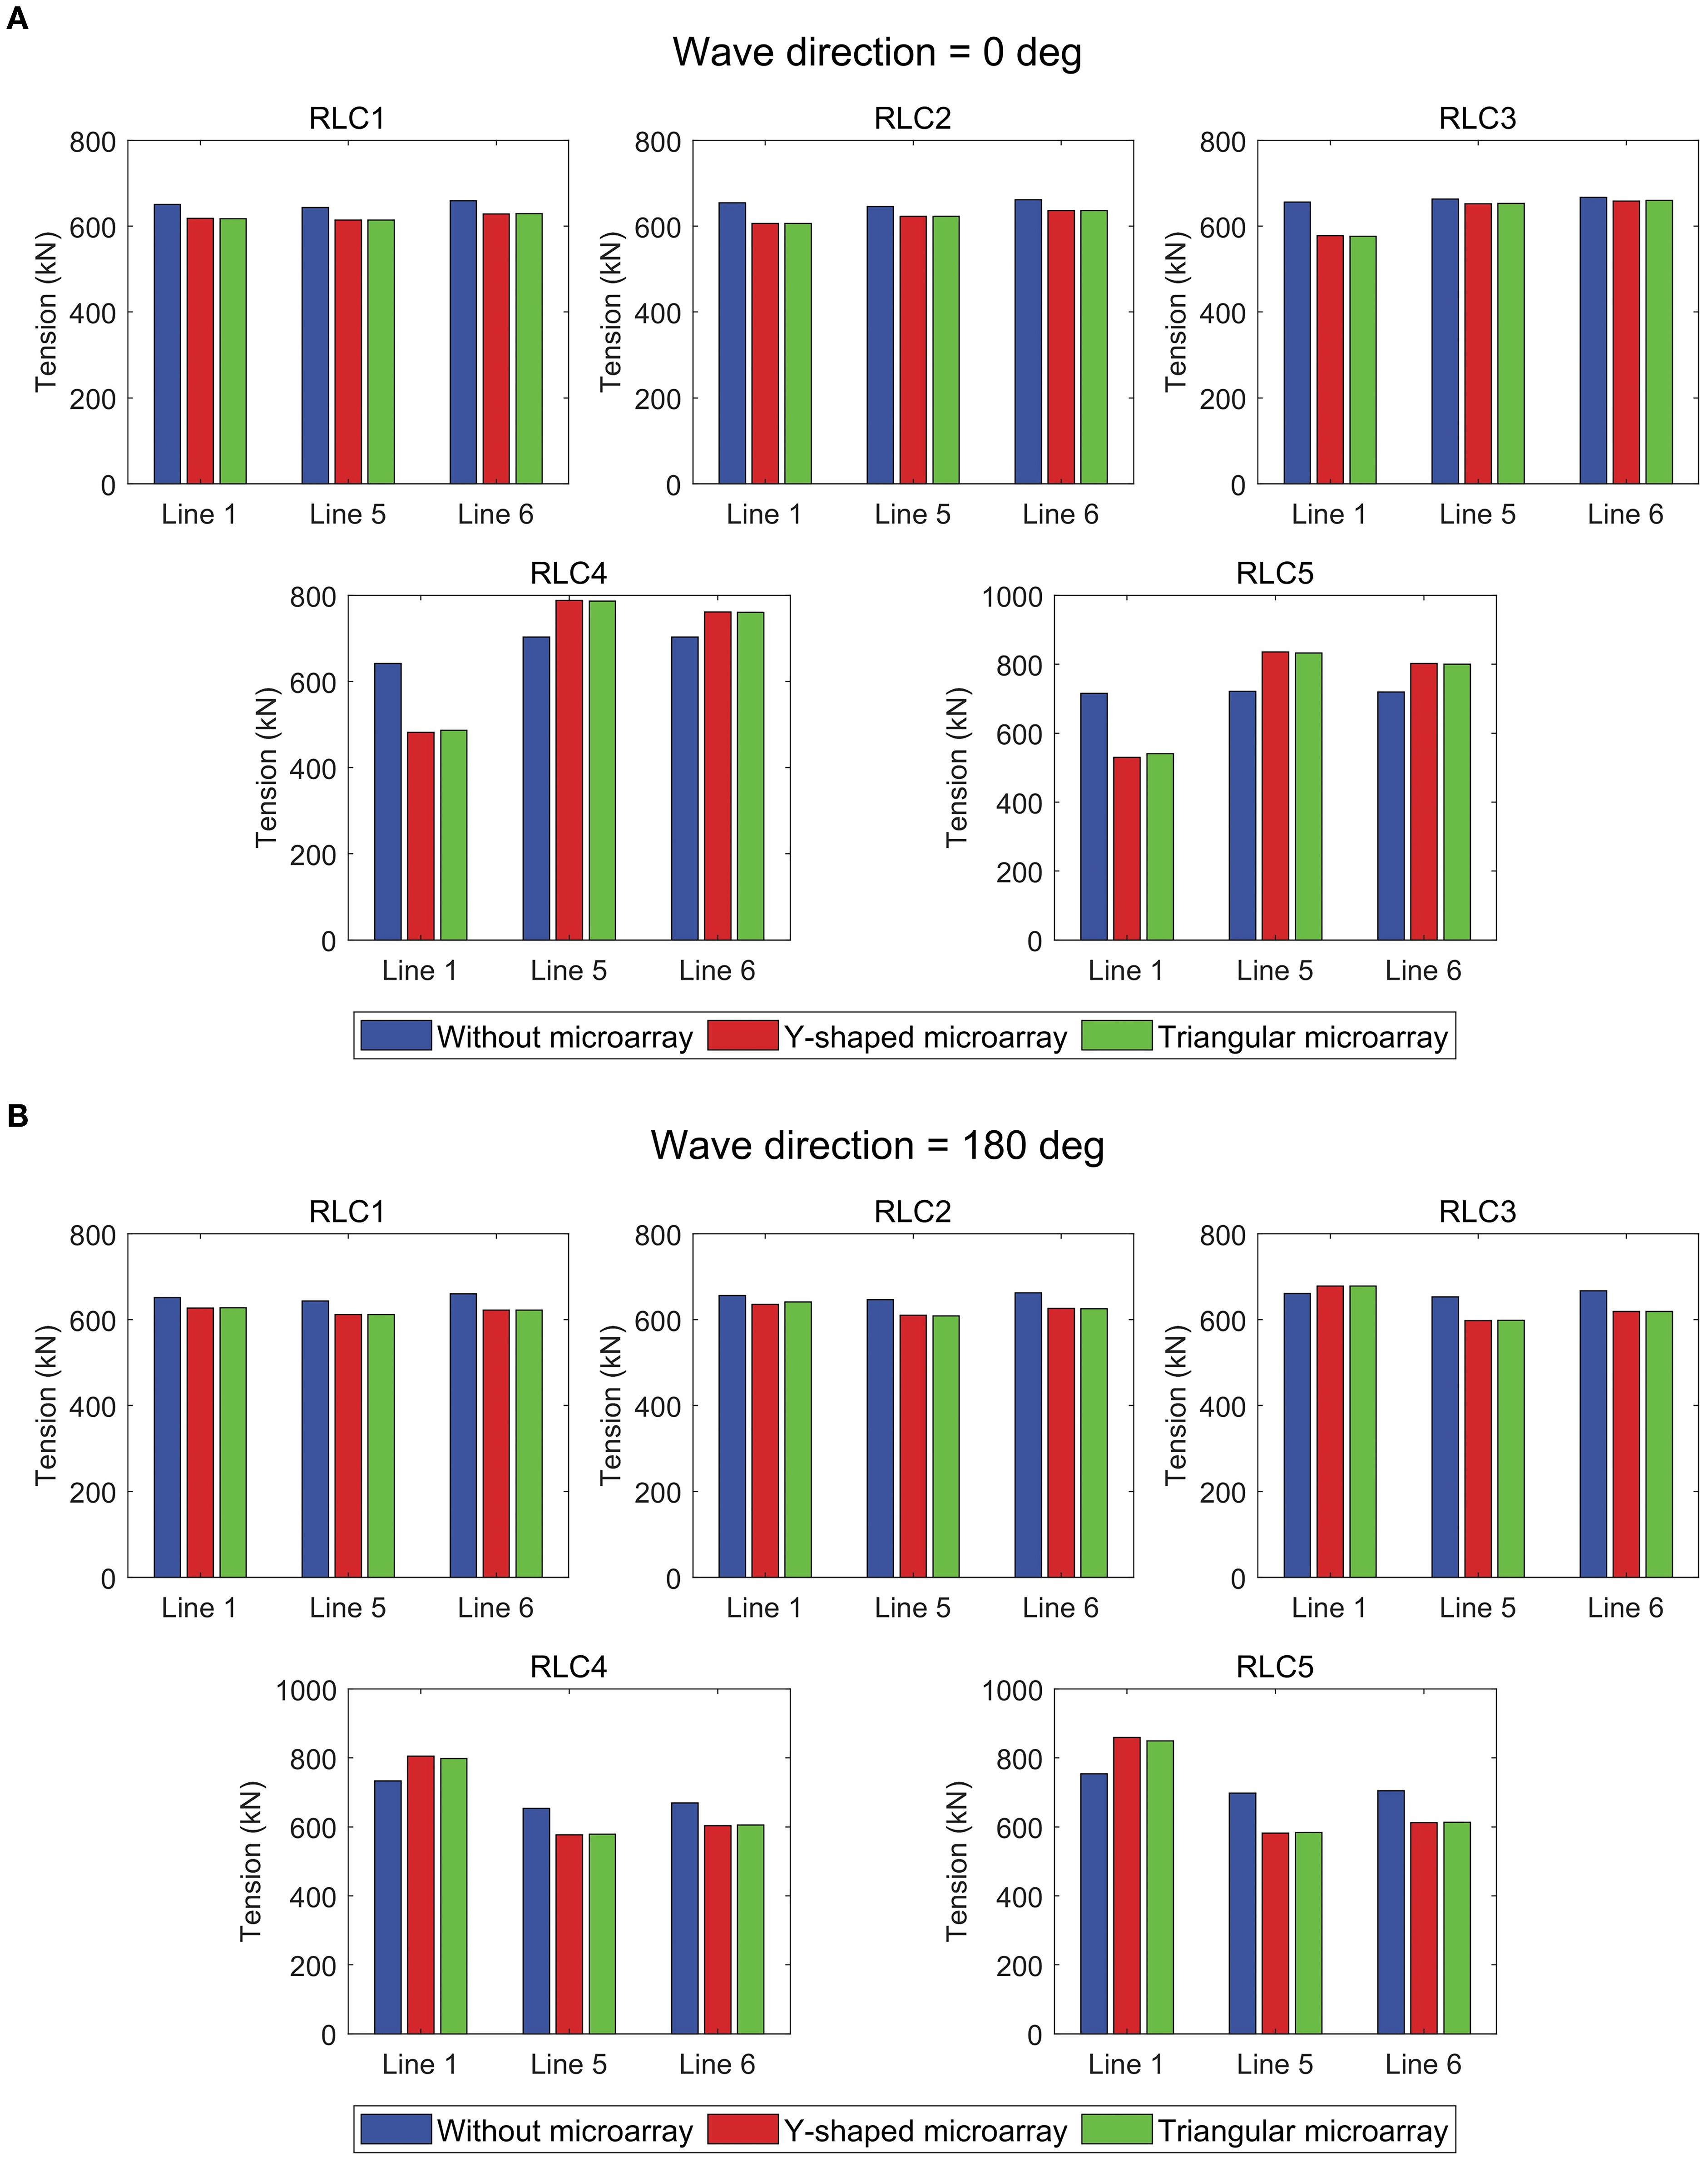
Figure 17. Tension response of the three systems under different wave directions. (A) 0° wave direction. (B) 180° wave direction.
Regarding the 0° wave direction, under RLC1-3 conditions, the tension response of L6 is the highest among all systems, and it is lower in the hybrid system than in the without microarray. Under RLC4-5 conditions, L5 consistently exhibits the highest tension response in all systems, but it is greater in the hybrid system than in the system without microarray. Regarding the 0° wave direction, the impact of the WECs microarray on the tension responses follows a similar trend to that at 0°, but with more pronounced differences under certain conditions. Under RLC1-3 conditions, the highest tension response in the hybrid system occurs at L1, while in the without microarray, it occurs at L6, indicating that the highest tension response is not always at the upstream position. Under RLC4-5 conditions, L1 consistently exhibits the highest tension response across all systems. The maximum tension response in the hybrid system is lower than that in the without microarray under the RLC1-2 conditions. Considering both wave directions, the hybrid system demonstrates superior performance in tension responses under short waves compared to the without microarray.
Due to the symmetry of the hybrid systems relative to the wave incidence direction, only half of the WECs are analyzed, with their numbering consistent with Figure 3. Figures 18 shows the absorbed power results of the WECs in the two hybrid systems under the five regular wave conditions with wave directions of 0° and 180°. Combining with Figures 9–11, it can be found that the wave elevation around the WECs does not directly determine their absorbed power. The power distributions of WECs in the two hybrid systems show significant similarity under the RLC3–5 conditions, while some differences are observed under the RLC1–2 conditions. This suggests that the different connection methods between the WECs and the FOWT influence the power distribution of WECs under short wave conditions. While under long wave conditions, the power distribution of the WECs depends more on their position relative to the FOWT. In addition, in both hybrid systems, each WEC becomes the most powerful device in the system under at least one regular wave condition. This characteristic ensures that each WEC can perform optimally under specific conditions, enhancing the capacity of the entire system to adapt to varying sea states for efficient energy capture.
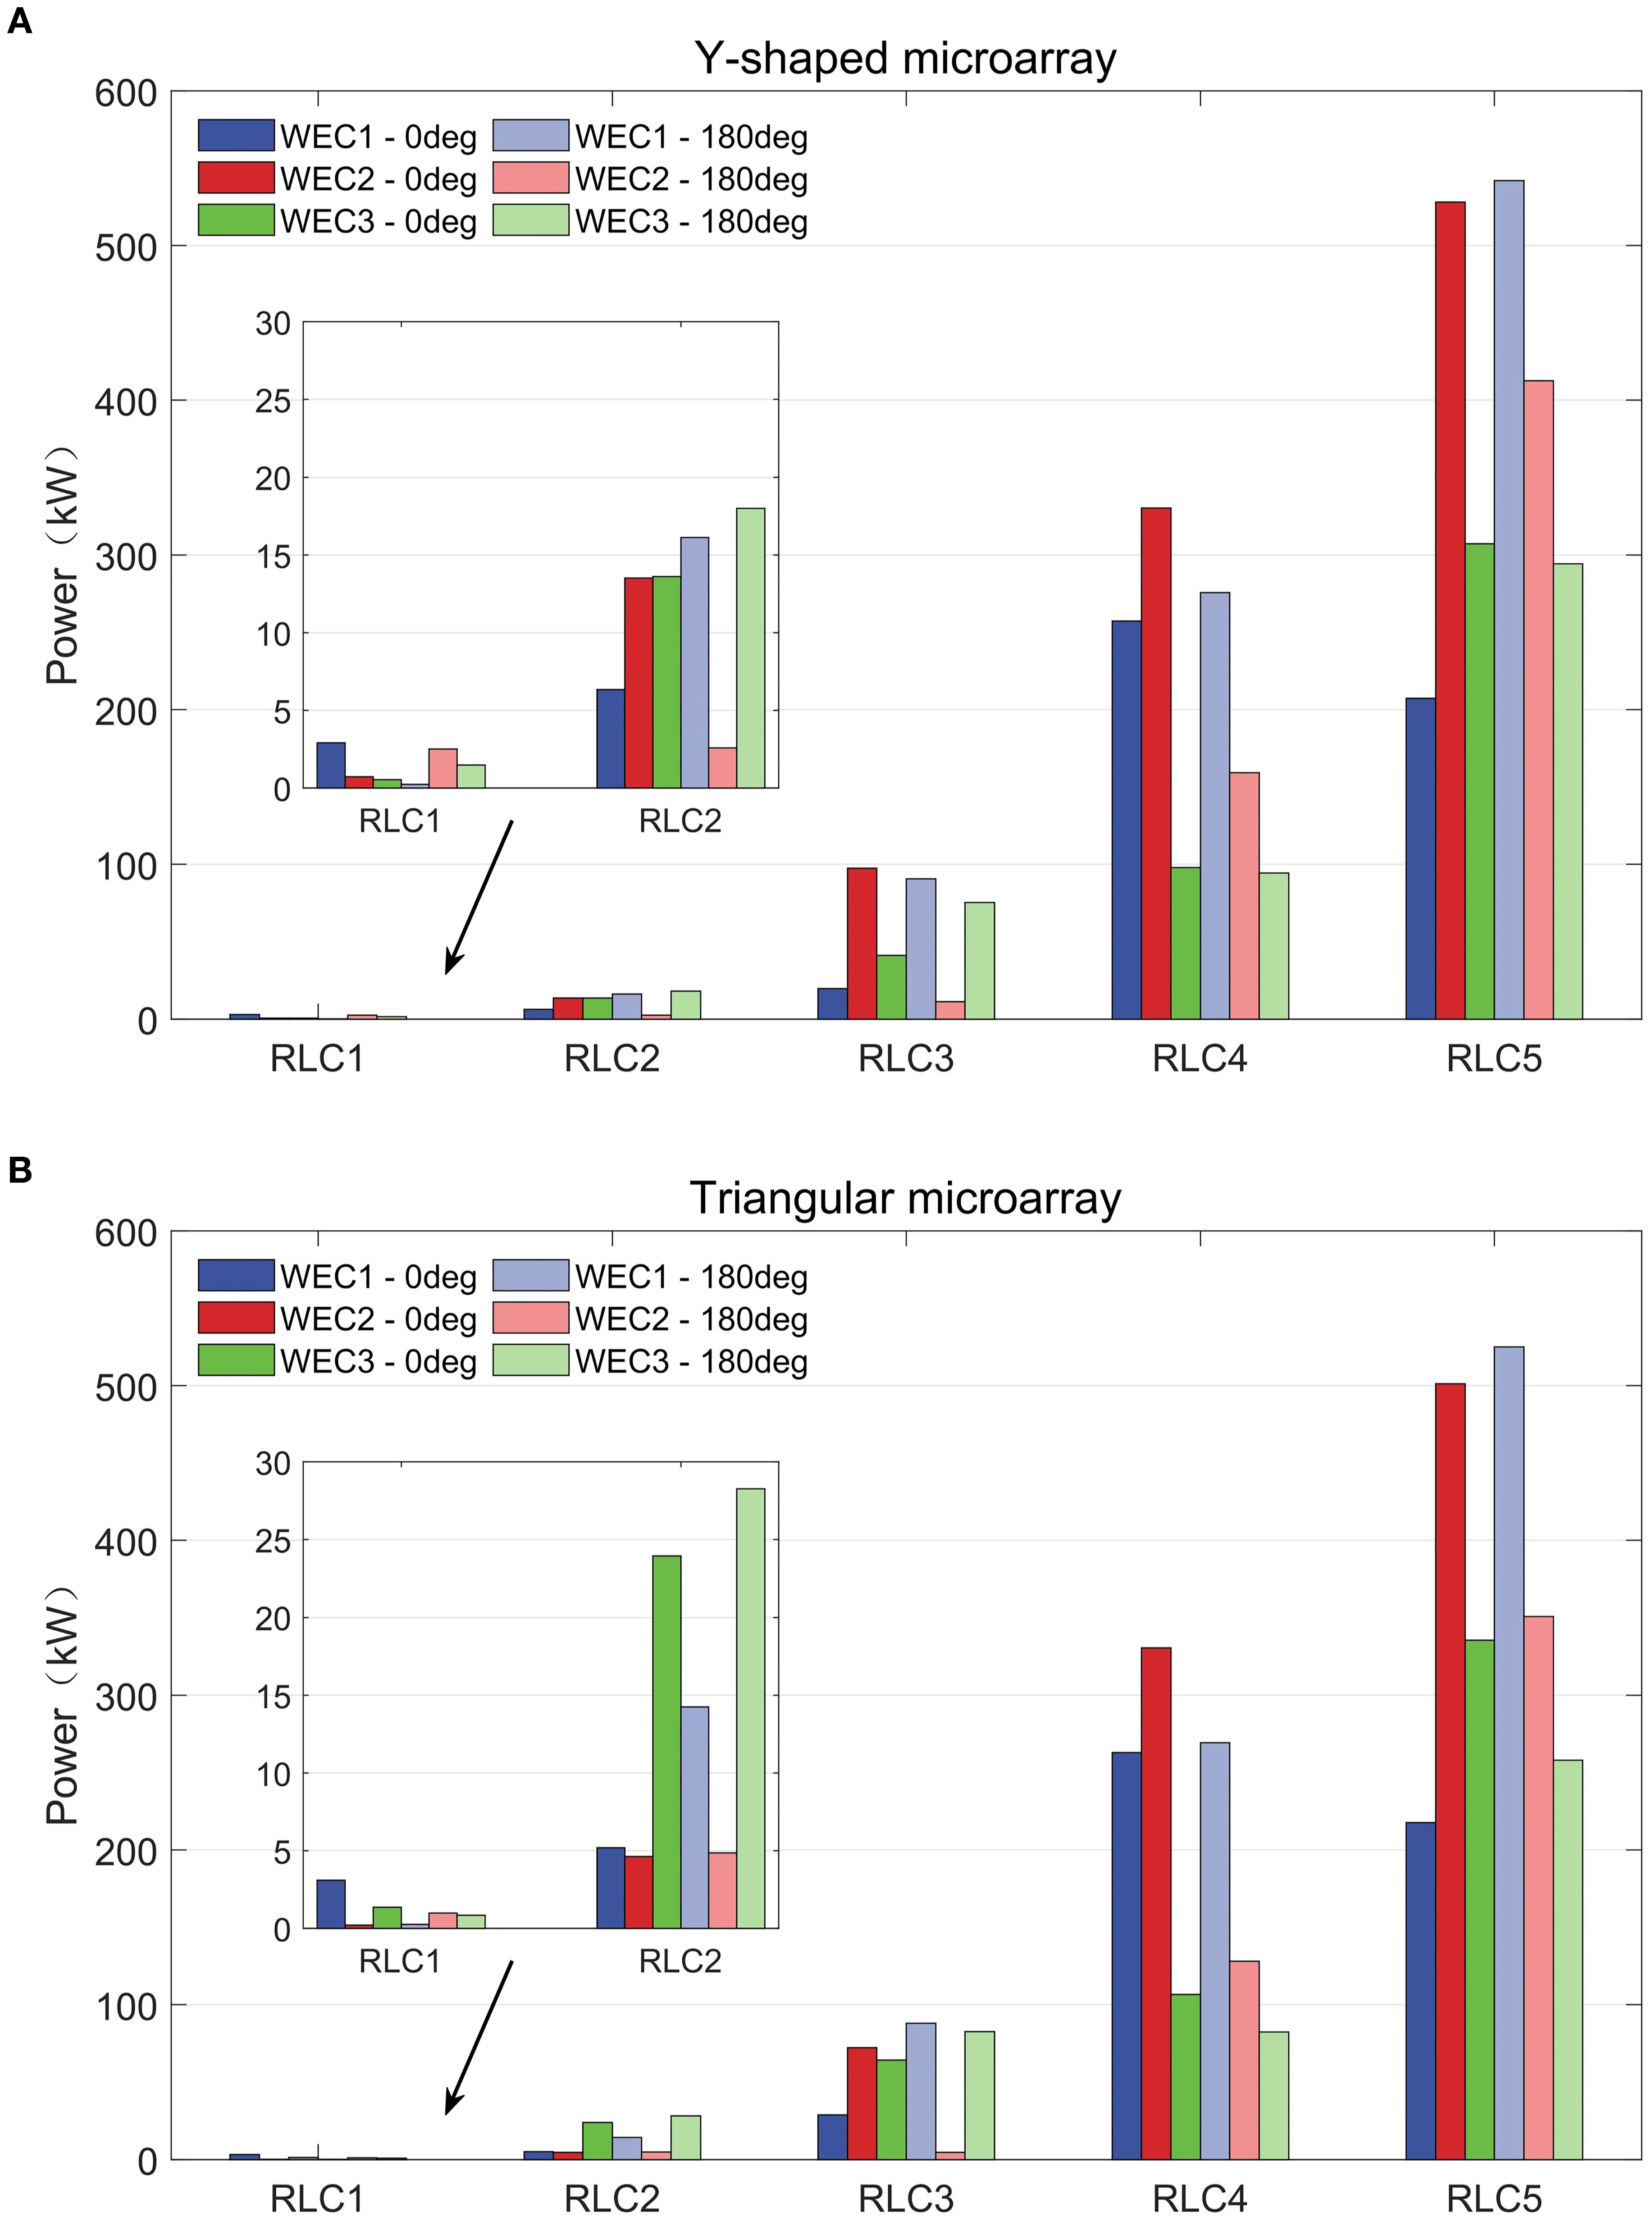
Figure 18. Absorbed power of WECs in microarray under various wave conditions. (A) Y-shaped microarray. (B) Triangular microarray.
Based on the data in Figure 18, the total and average power generated by all WECs in the hybrid system under different regular waves and two wave directions are shown in Figure 19. When analyzing the microarray forms, the total power of the Triangular microarray exceeds that of the Y-shaped microarray under all regular waves at 0° wave incidence. At 180° wave incidence, the Y-shaped microarray generates more total power under all regular waves except for the RLC2 condition. When analyzed by wave incidence direction, the total power is higher at 0° under RLC1 and RLC4 conditions, whereas it is higher at 180° wave incidence under the RLC2, RLC3 and RLC5 conditions.
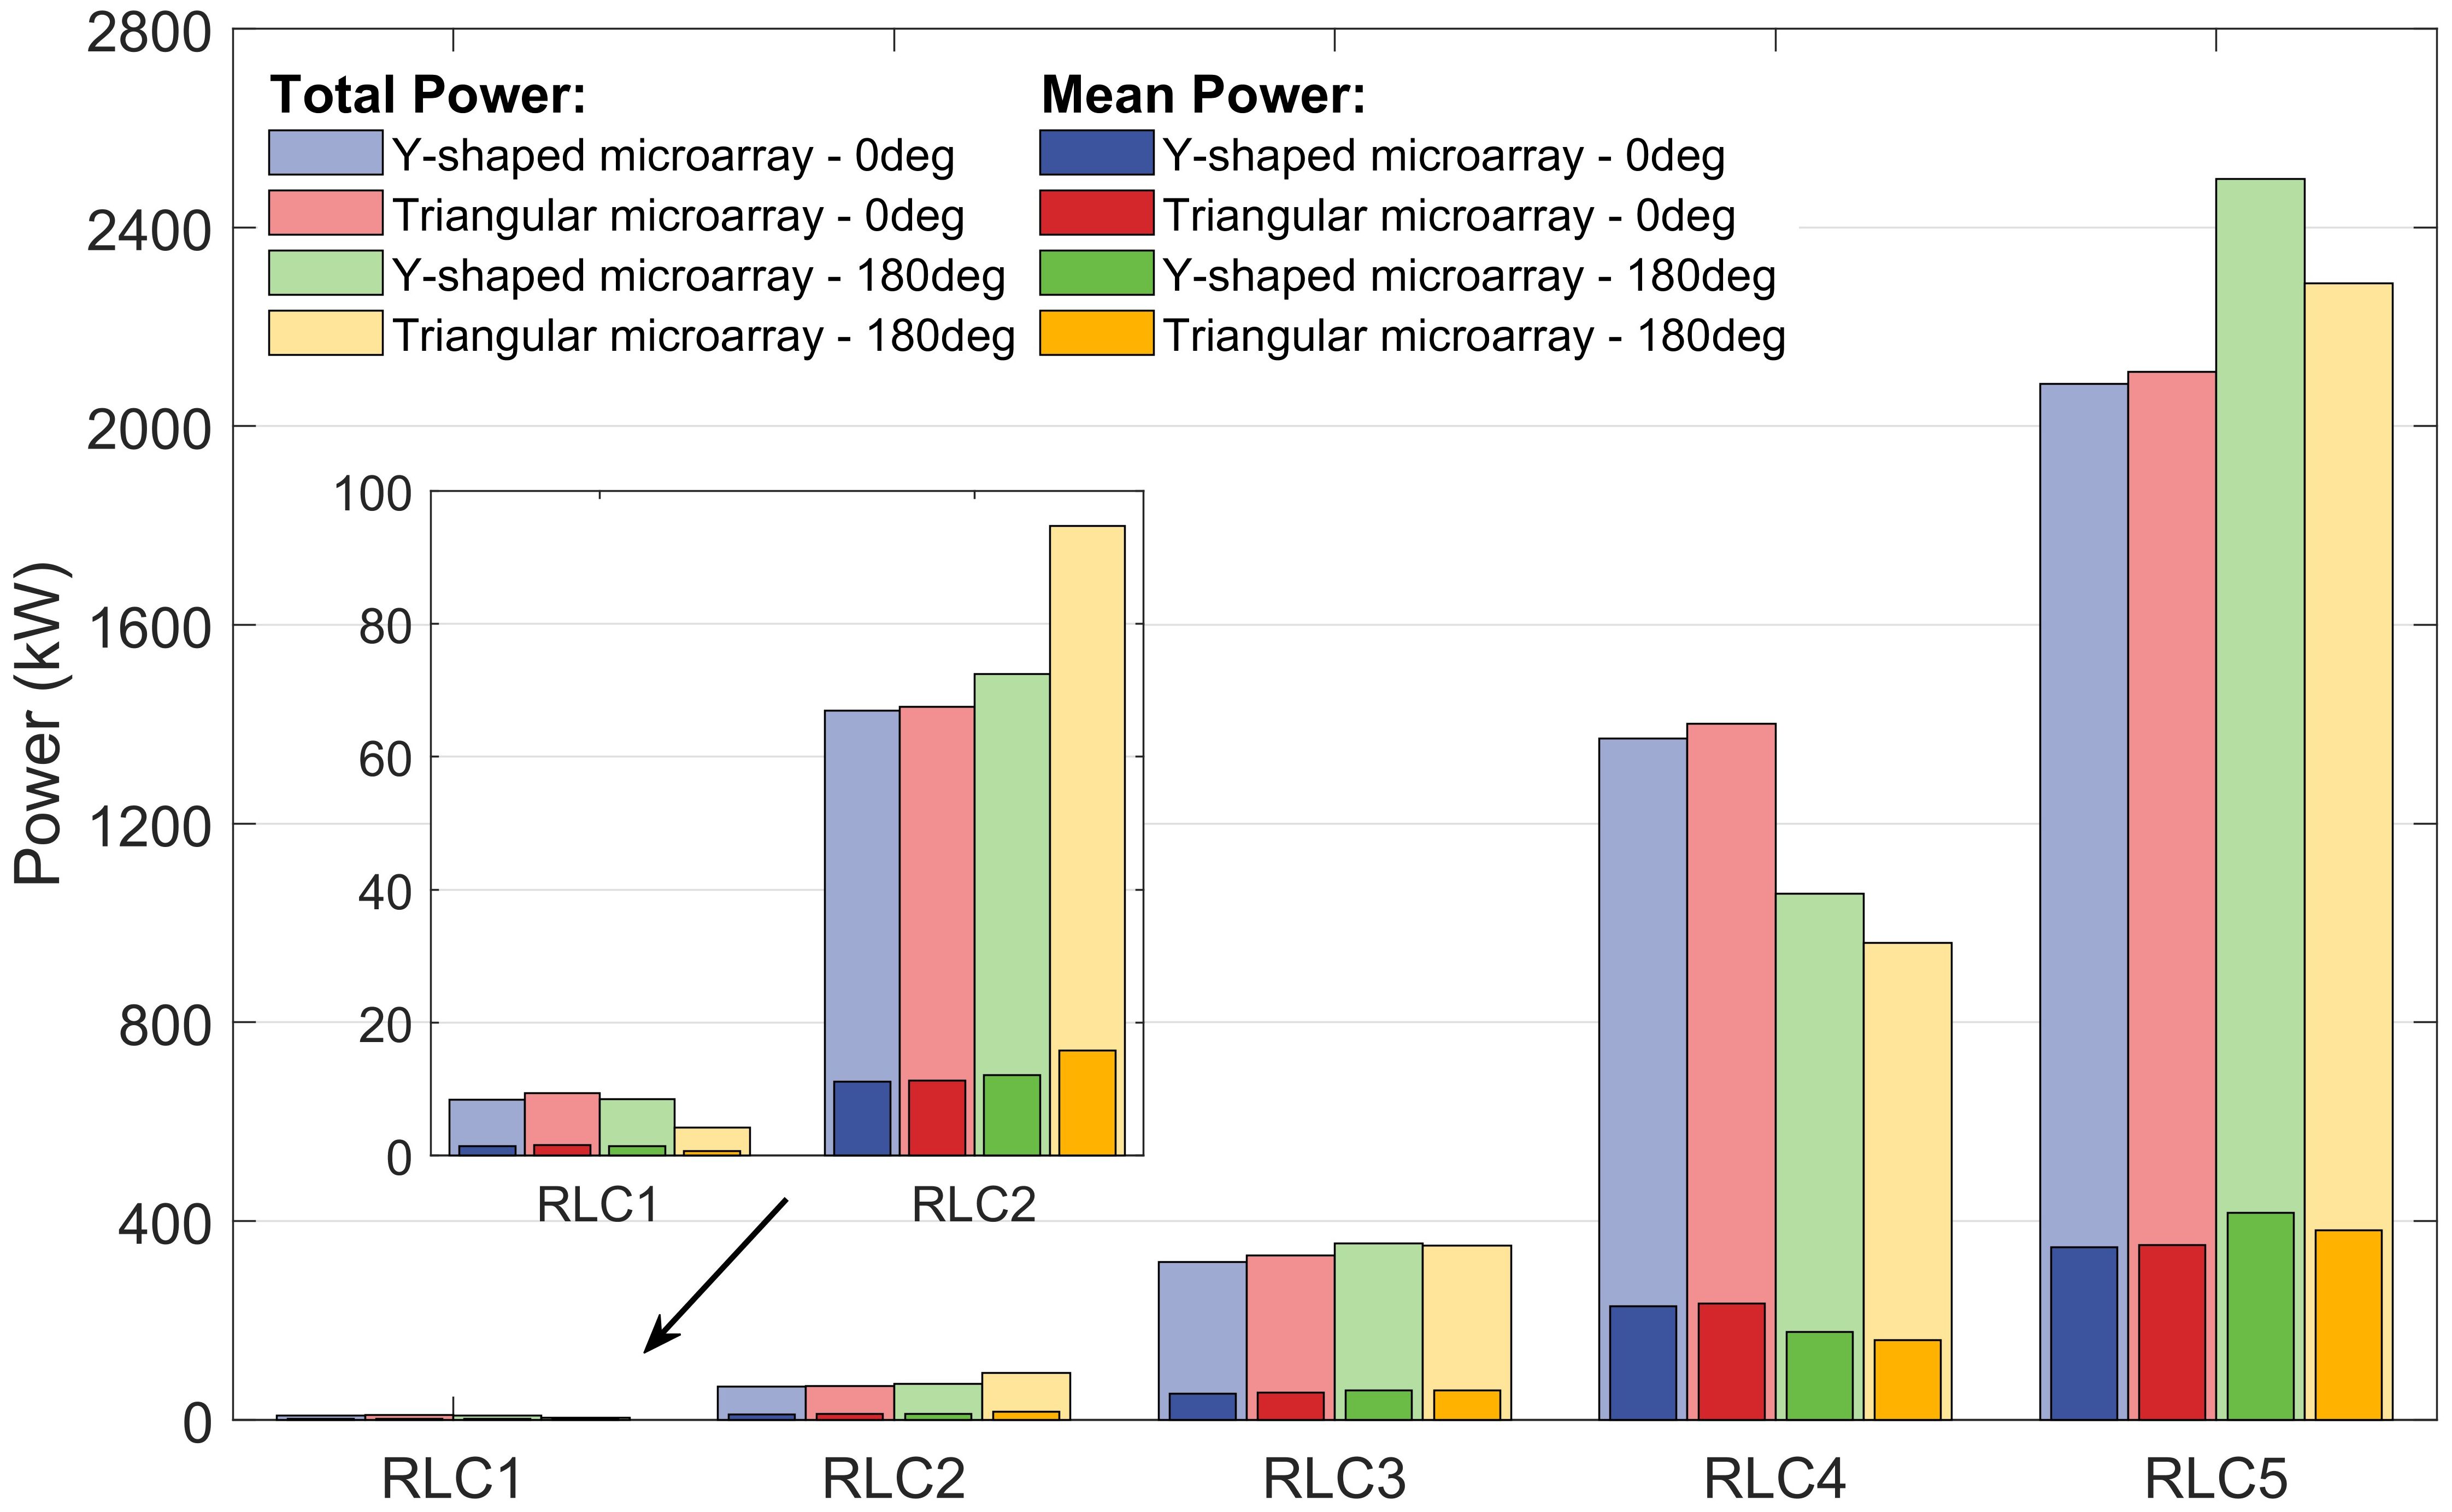
Figure 19. Total and average absorbed power of WECs in two hybrid systems under various wave conditions.
To thoroughly investigate the energy conversion efficiency of WECs in microarray form, the concept of capture width ratio (CWR) is introduced in this study, which is shown in Equation 16:
where denotes the energy absorbed by the WEC, denotes the energy per unit width of the wave, and denotes the diameter of the WEC.
Figure 20 shows the CWR of each WEC under various regular waves and wave directions, with a heatmap visualizing the magnitude of the CWR values through a color gradient. It can be observed from the figure that the CWR of the WECs in the hybrid system is closely associated with the wave direction and their layout within the microarray. Under RLC1–3 conditions, the CWR of WECs in both hybrid systems are at low values. In contrast, the CWR values significantly increase to higher levels under RLC4–5 conditions, indicating that WECs capture energy more efficiently under long waves. Furthermore, the wave loading parameter has a more pronounced influence on energy capture efficiency compared to the wave direction. The maximum CWR values for both hybrid systems occur at WEC2 under RLC4 conditions at 0° wave direction, recorded as 0.971 and 0.972, respectively. The minimum CWR value for the Y-shaped microarray is observed at WEC1 under RLC1 condition at 180° wave incidence, whereas the minimum CWR for the Triangular microarray is recorded at WEC2 under RLC1 condition at 0° wave incidence.
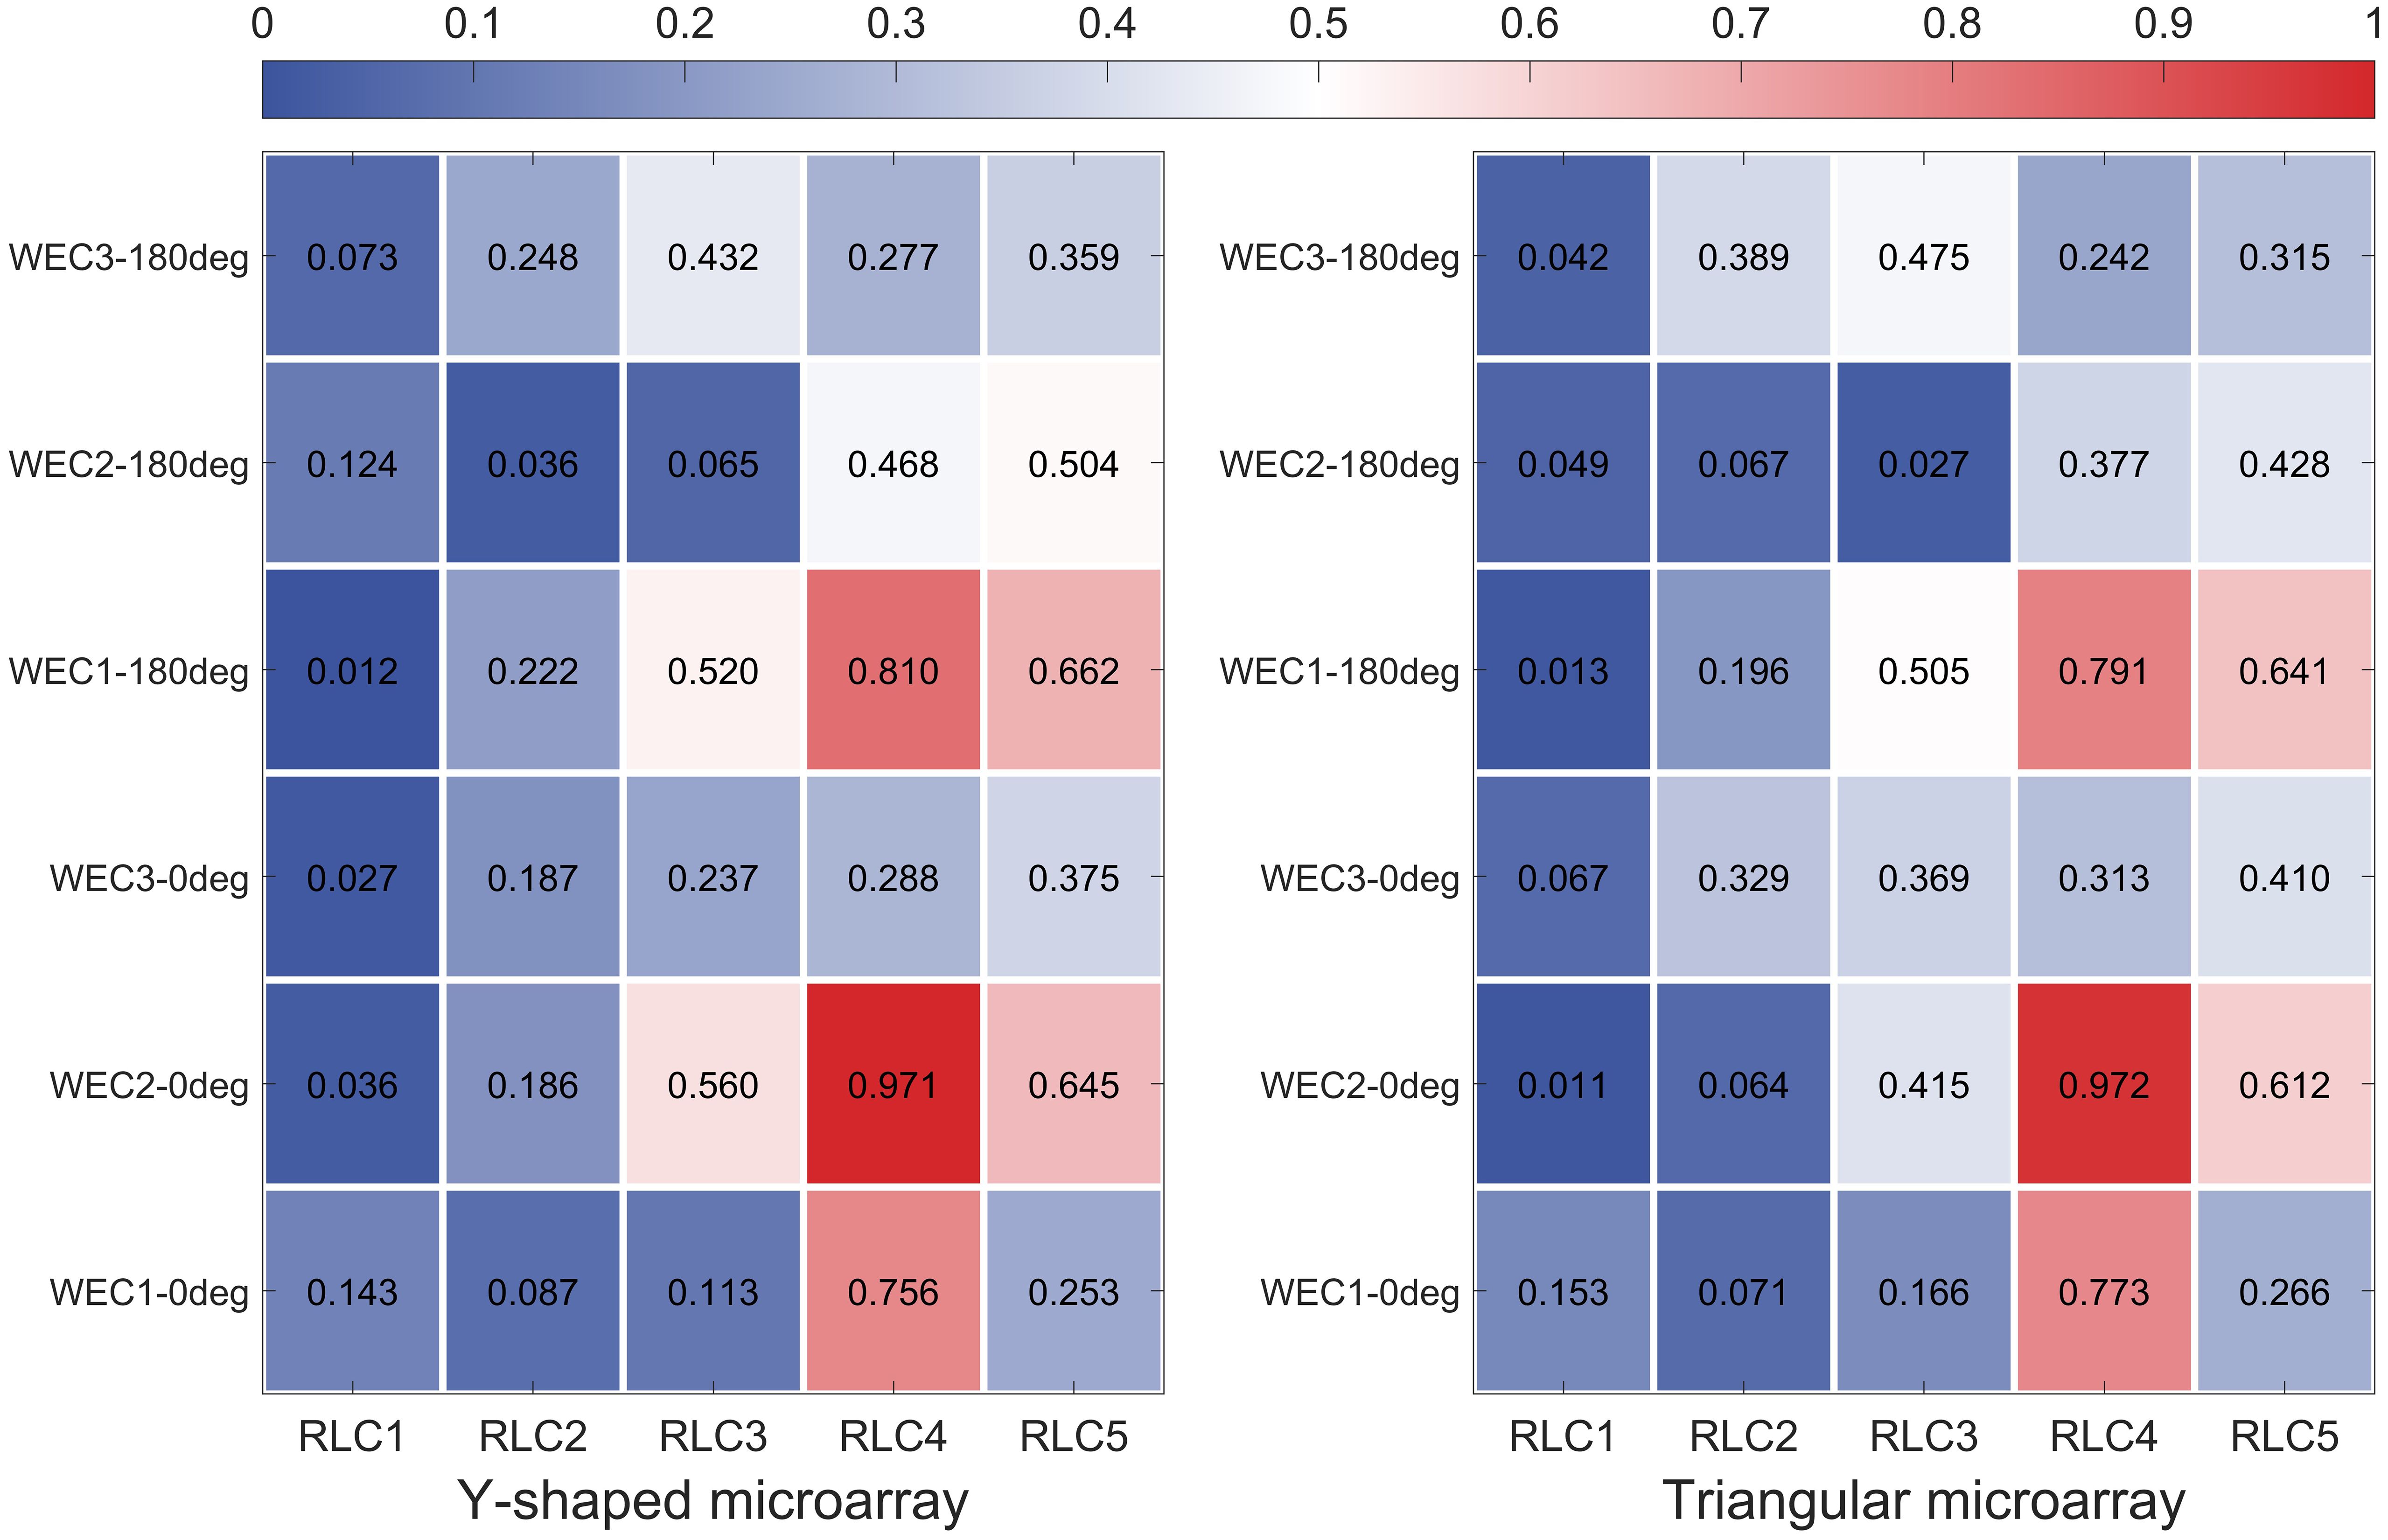
Figure 20. CWR of WECs in two hybrid systems under various wave conditions.
Figure 21 shows the average CWR values of the WECs in the hybrid systems. For both hybrid systems, the highest average CWR values are observed under the RLC4 conditions for both wave directions and exhibiting a trend of initially increasing and then decreasing with changes in regular waves. Whereas, when the wave direction is 180°, the average CWR value is somewhat influenced by the method of connecting the WECs to the FOWT.
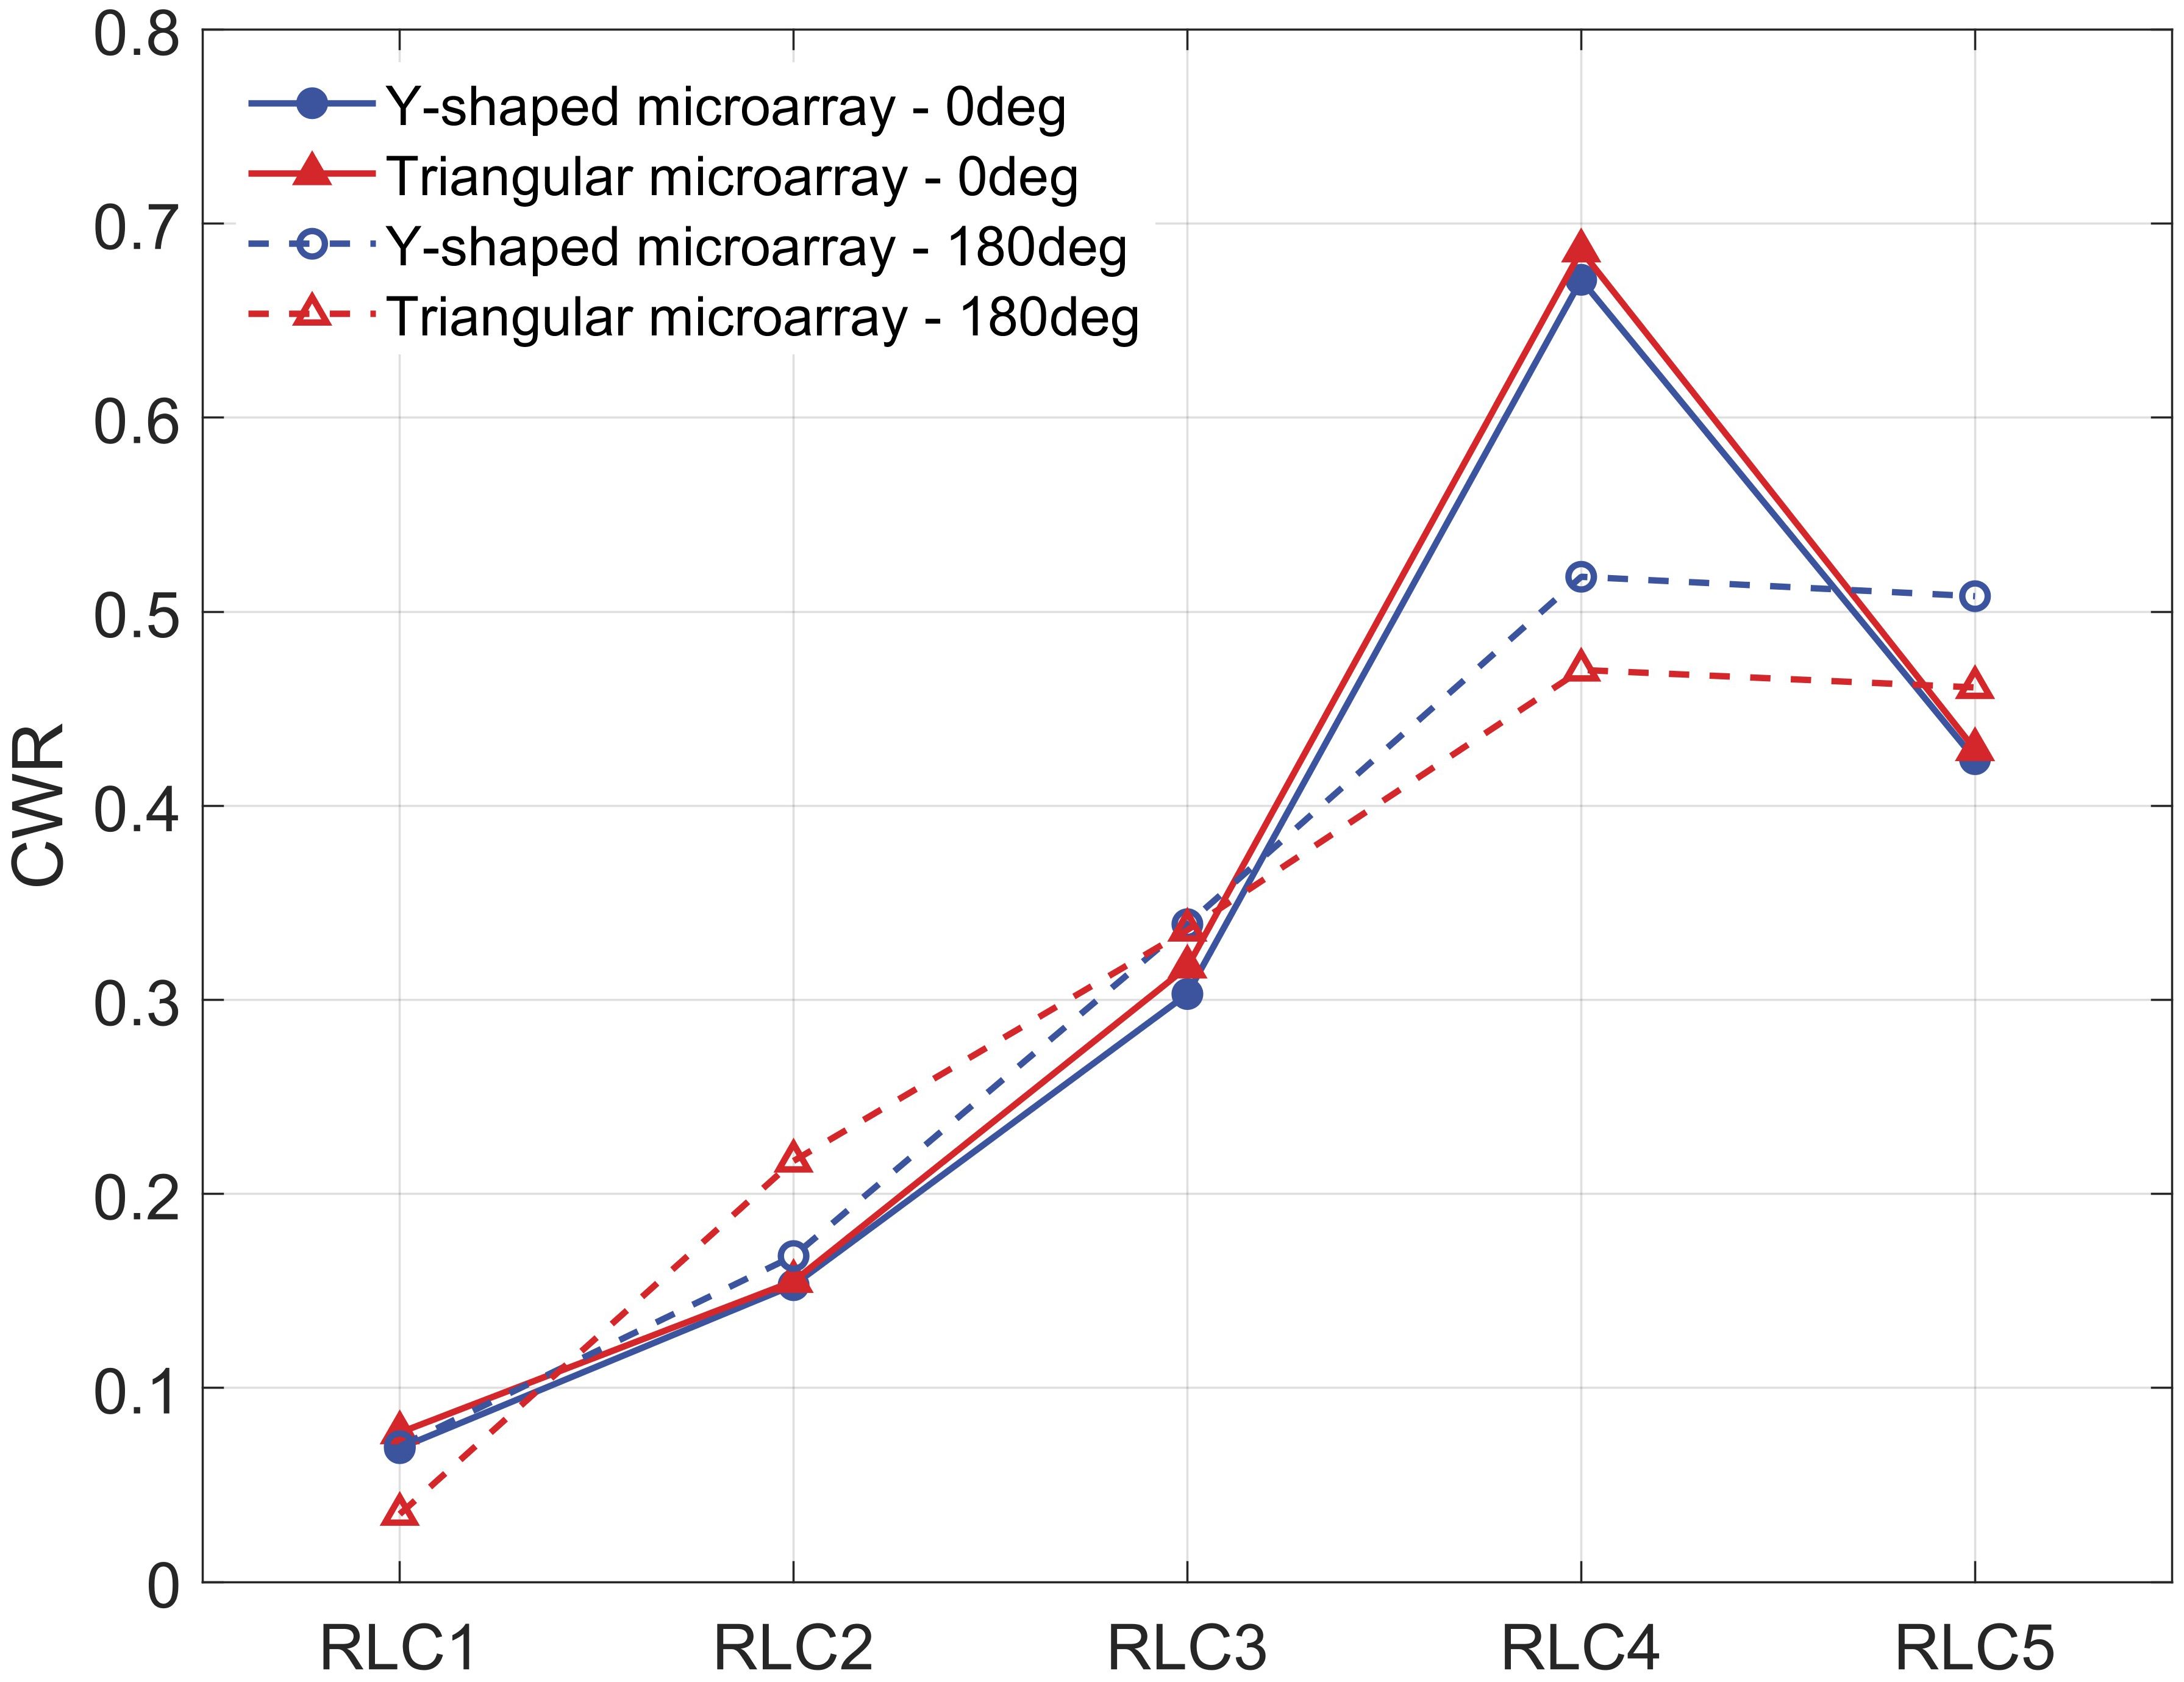
Figure 21. Average CWR values of WECs in two hybrid systems under various wave conditions.
For the purpose of quantifying the effects of multi-body hydrodynamic interactions on the performance of WECs microarray, this study introduces an interaction factor (q), defined as follows:
Where is the power captured by the -th WEC, is the power captured by a single WEC, and is the number of WECs in the hybrid system.
After calculating the captured power of a single WEC under different regular waves, the q factor for the two hybrid systems is derived using Figure 19 and Equation 17, as shown in Figure 22. It can be observed from the figure that the q factor exhibits significant fluctuations across the regular waves. The Triangular microarray achieves the highest q-factor value among the hybrid systems under the RLC2 condition with 180° wave incidence. Except for the Triangular microarray under the RLC1 condition with 180° wave incidence, where the q-factor value is less than 1, the q-factor values for both hybrid systems exceed 1 under all other wave conditions. This indicates that the hydrodynamic interactions effectively enhance the power capture of the WECs, and the absorbed power of the hybrid systems significantly exceeds that of a single WEC combination.
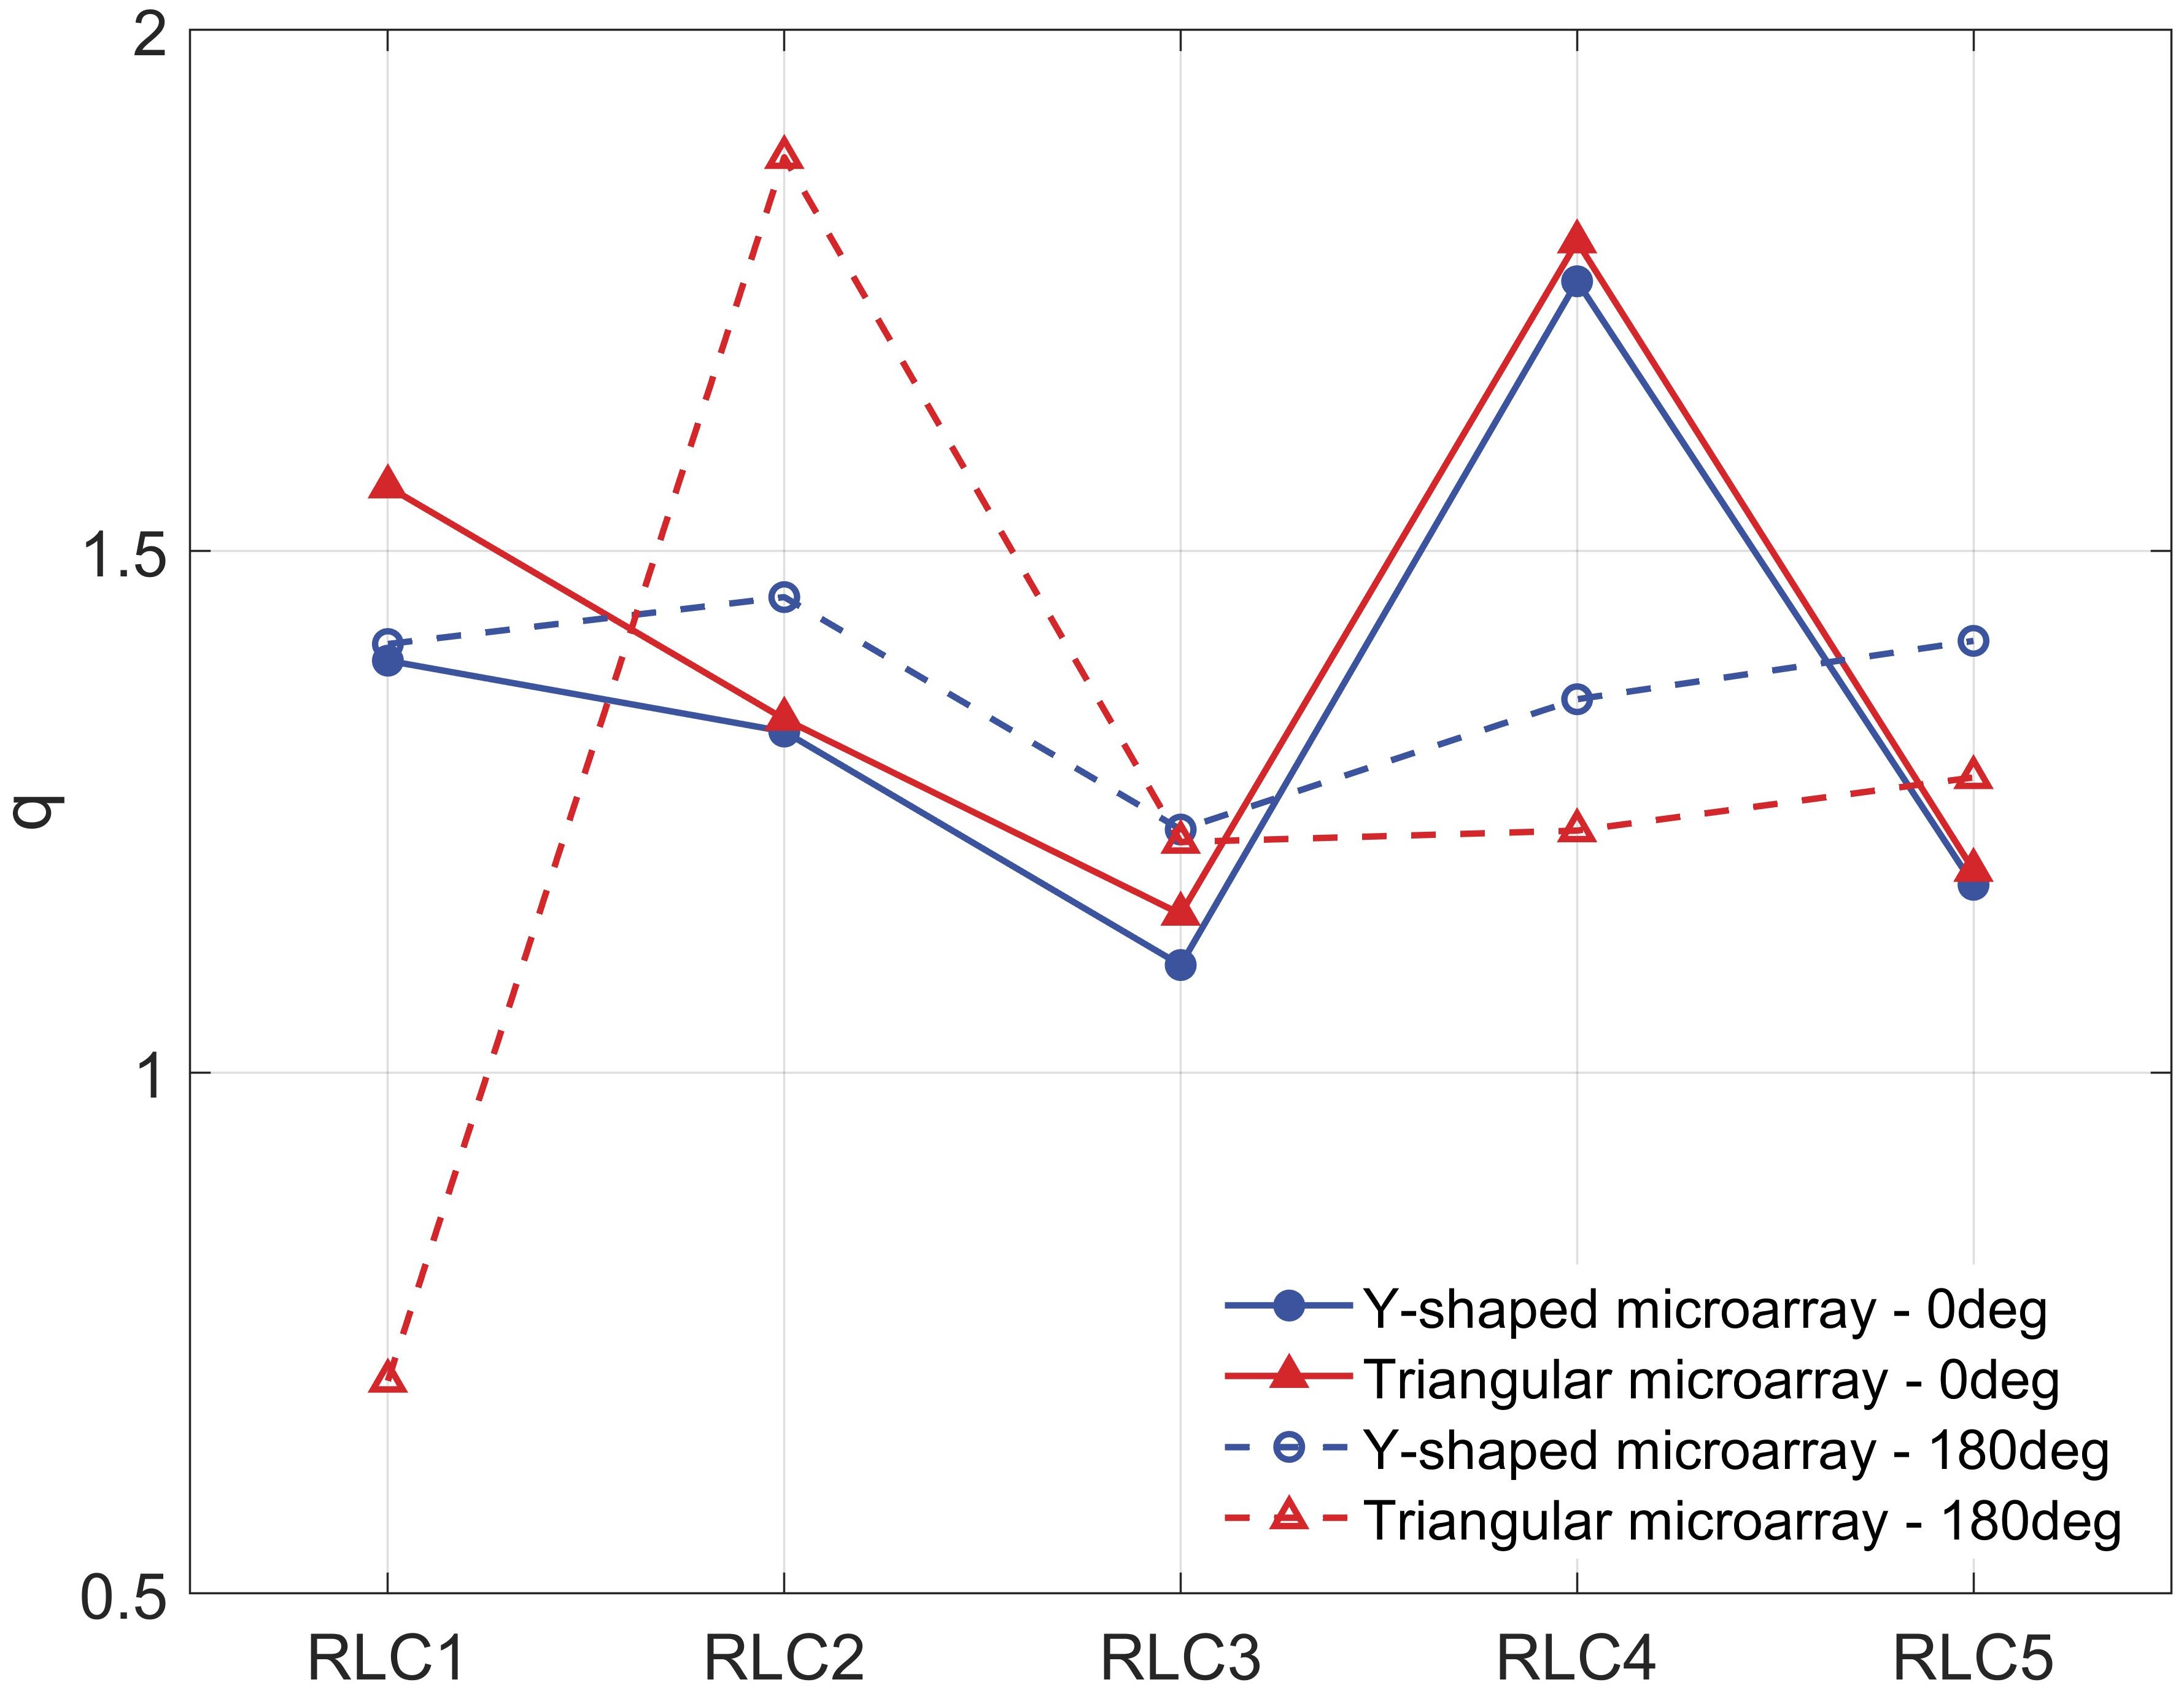
Figure 22. q-factor of two hybrid systems under various wave conditions.
This study proposes a novel wind-wave hybrid system concept comprising a TGL semi-submersible floating platform combined with point absorption WECs. In order to solve the multi-body hydrodynamic interaction problem, the analysis program AQWA, based on three-dimensional potential flow theory, is employed for frequency and time domain analysis. Using available experimental data, the numerical models of the TGL platform and WEC are separately validated to ensure their reliability. Two microarray forms, differing in the connection methods between the WECs and the FOWT, are designed in this study. Through numerical simulations, the effects of the WECs microarray forms on the hybrid system’s performance under two wave directions in the Yellow Sea environmental conditions are investigated. The main conclusions are summarized as follows:
(1) Different WECs microarray forms have minimal influence on the distribution of the flow field around the hybrid systems, and the presence of WECs microarray affects the system’s sensitivity to the wave direction. Under short waves, the hybrid system effectively reduces the wave elevations around the FOWT while increasing them around the WECs. Under long waves, the presence of WECs microarray has a negligible effect on the flow field.
(2) The WECs microarray influences the motion response of the FOWT, with more effective suppression of FOWT motion observed under long waves. Compared to the Triangular microarray, the Y-shaped microarray offers greater stability of the FOWT, particularly under long waves, where the motion response amplitudes are smaller across most degrees of freedom.
(3) The presence of WECs microarray can reduce the maximum mooring tension response in the entire system under short waves. Under long waves, however, it increases the variation in tension responses between different mooring lines.
(4) Under short waves, the microarray form has a significant effect on the power distribution of WECs. Conversely, under long waves, the power capture mainly depends on the position of the WECs relative to the FOWT. The Triangular microarray achieves greater total power across all regular waves at 0° wave incidence, whereas the Y-shaped microarray captures energy more efficiently at 180° wave incidence.
(5) The hybrid system’s average wave energy conversion efficiency reaches its peak under RLC4 conditions. Multi-body hydrodynamic interactions significantly enhance the WECs’ power absorption capacity, with the hybrid system’s energy capture efficiency obviously surpassing that of a single WEC.
All in all, this study can provide some references for the design and research of other wind-wave energy hybrid systems. In future work, we plan to further optimize this hybrid system by adjusting the location and number of WECs. These optimizations are expected to further enhance the overall performance of this hybrid system.
The raw data supporting the conclusions of this article will be made available by the authors, without undue reservation.
ML: Conceptualization, Data curation, Formal Analysis, Investigation, Methodology, Software, Validation, Visualization, Writing – original draft, Writing – review & editing. CW: Investigation, Methodology, Writing – review & editing. LL: Software, Validation, Writing – review & editing. ZY: Formal Analysis, Validation, Writing – review & editing. YL: Funding acquisition, Project administration, Resources, Supervision, Writing – review & editing. GX: Funding acquisition, Project administration, Writing – review & editing.
The author(s) declare that financial support was received for the research and/or publication of this article. This research was funded by the National Natural Science Foundation of China (U22A20242, 52171265, 52471331), the National Key Research and Development Program of China (2023YFB4204103, 2023YFC2810100), the Guangdong Basic and Applied Basic Research Foundation (2024A1515240063), the Natural Science Foundation of Shandong Province (ZR2021ZD23).
The authors declare that the research was conducted in the absence of any commercial or financial relationships that could be construed as a potential conflict of interest.
The author(s) declare that no Generative AI was used in the creation of this manuscript.
All claims expressed in this article are solely those of the authors and do not necessarily represent those of their affiliated organizations, or those of the publisher, the editors and the reviewers. Any product that may be evaluated in this article, or claim that may be made by its manufacturer, is not guaranteed or endorsed by the publisher.
The Supplementary Material for this article can be found online at: https://www.frontiersin.org/articles/10.3389/fmars.2025.1563310/full#supplementary-material
Barltrop N. (1998). Floating structures: a guide for design and analysis. Available online at: https://pureportal.strath.ac.uk/en/publications/floating-structures-a-guide-for-design-and-analysis (Accessed January 8, 2025).
Bhuiyan M. A., Hu P., Khare V., Hamaguchi Y., Thakur B. K., Rahman M. K. (2022). Economic feasibility of marine renewable energy. Front. Mar. Sci. 9, 988513. doi: 10.3389/fmars.2022.988513
Cao F., Yu M., Han M., Liu B., Wei Z., Jiang J., et al. (2023). WECs microarray effect on the coupled dynamic response and power performance of a floating combined wind and wave energy system. Renewable Energy 219, 119476. doi: 10.1016/j.renene.2023.119476
Castro-Santos L., Martins E., Soares C. G. (2017). Economic comparison of technological alternatives to harness offshore wind and wave energies. Energy 140, 1121–1130. doi: 10.1016/j.energy.2017.08.103
Chozas J. F., Sørensen H. C., Jensen N. E. H. (2012). Economic Benefit of Combining Wave and Wind Power Productions in Day-Ahead Electricity Markets. Available online at: https://xueshu.baidu.com/usercenter/paper/show?paperid=59d24a8931accb6ec877afbc0c97e8f3 (Accessed February 15, 2025).
Contestabile P., Crispino G., Di Lauro E., Ferrante V., Gisonni C., Vicinanza D. (2020). Overtopping breakwater for wave Energy Conversion: Review of state of art, recent advancements and what lies ahead. Renewable Energy 147, 705–718. doi: 10.1016/j.renene.2019.08.115
Cummins W. E. (1962). The Impulse Response Function and Ship Motions (No. DTMB1661). Washington DC: Navy Department, David Taylor Model Basin.
Falcão A. F., Henriques J. C. (2016). Oscillating-water-column wave energy converters and air turbines: A review. Renewable Energy 85, 1391–1424. doi: 10.1016/j.renene.2015.07.086
Felix A., Hernández-Fontes J. V., Lithgow D., Mendoza E., Posada G., Ring M., et al. (2019). Wave energy in tropical regions: Deployment challenges, environmental and social perspectives. J. Mar. Sci. Eng. 7, 219. doi: 10.3390/jmse7070219
Ghafari H., Dardel M. (2018). Parametric study of catenary mooring system on the dynamic response of the semi-submersible platform. Ocean Eng. 153, 319–332. doi: 10.1016/j.oceaneng.2018.01.093
Ghafari H. R., Ghassemi H., Abbasi A., Vakilabadi K. A., Yazdi H., He G. (2022a). Novel concept of hybrid wavestar-floating offshore wind turbine system with rectilinear arrays of WECs. Ocean Eng. 262, 112253. doi: 10.1016/j.oceaneng.2022.112253
Ghafari H. R., Ghassemi H., He G. (2021a). Numerical study of the Wavestar wave energy converter with multi-point-absorber around DeepCwind semisubmersible floating platform. Ocean Eng. 232, 109177. doi: 10.1016/j.oceaneng.2021.109177
Ghafari H. R., Ghassemi H., Neisi A. (2022b). Power matrix and dynamic response of the hybrid Wavestar-DeepCwind platform under different diameters and regular wave conditions. Ocean Eng. 247, 110734. doi: 10.1016/j.oceaneng.2022.110734
Ghafari H. R., Neisi A., Ghassemi H., Iranmanesh M. (2021b). Power production of the hybrid Wavestar point absorber mounted around the Hywind spar platform and its dynamic response. J. Renew. Sustain. Energy 13, 033308. doi: 10.1063/5.0046590
Guo B., Wang T., Jin S., Duan S., Yang K., Zhao Y. (2022). A review of point absorber wave energy converters. J. Mar. Sci. Eng. 10, 1534. doi: 10.3390/jmse10101534
Hall M., Goupee A. (2015). Validation of a lumped-mass mooring line model with DeepCwind semisubmersible model test data. Ocean Eng. 104, 590–603. doi: 10.1016/j.oceaneng.2015.05.035
Homayoun E., Ghassemi H., Ghafari H. (2019). Power performance of the combined monopile wind turbine and floating buoy with heave-type wave energy converter. Polish Maritime Res. 26, 107–114. doi: 10.2478/pomr-2019-0051
Kamarlouei M., Gaspar J. F., Calvario M., Hallak T. S., Mendes M. J., Thiebaut F., et al. (2020). Experimental analysis of wave energy converters concentrically attached on a floating offshore platform. Renewable Energy 152, 1171–1185. doi: 10.1016/j.renene.2020.01.078
Legaz M. J., Coronil D., Mayorga P., Fernández J. (2018).Study of a hybrid renewable energy platform: W2Power. In: International conference on offshore mechanics and arctic engineering (American Society of Mechanical Engineers). Available online at: https://asmedigitalcollection.asme.org/OMAE/proceedings-abstract/OMAE2018/51326/274189 (Accessed January 8, 2025).
Mahdy A., Hasanien H. M., Aleem S. H. E. A., Al-Dhaifallah M., Zobaa A. F., Ali Z. M. (2024). State-of-the-Art of the most commonly adopted wave energy conversion systems. Ain Shams Eng. J. 15, 102322. doi: 10.1016/j.asej.2023.102322
Michailides C., Luan C., Gao Z., Moan T. (2014).Effect of flap type wave energy converters on the response of a semi-submersible wind turbine in operational conditions. In: International Conference on Offshore Mechanics and Arctic Engineering (American Society of Mechanical Engineers). Available online at: https://asmedigitalcollection.asme.org/OMAE/proceedings-abstract/OMAE2014/45547/279003 (Accessed January 8, 2025).
Mork G., Barstow S., Kabuth A., Pontes M. T. (2010).Assessing the global wave energy potential. In: International conference on offshore mechanics and arctic engineering. Available online at: https://asmedigitalcollection.asme.org/OMAE/proceedings-abstract/OMAE2010/447/345942 (Accessed January 8, 2025).
Muliawan M. J., Karimirad M., Gao Z., Moan T. (2013a). Extreme responses of a combined spar-type floating wind turbine and floating wave energy converter (STC) system with survival modes. Ocean Eng. 65, 71–82. doi: 10.1016/j.oceaneng.2013.03.002
Muliawan M. J., Karimirad M., Moan T. (2013b). Dynamic response and power performance of a combined spar-type floating wind turbine and coaxial floating wave energy converter. Renewable Energy 50, 47–57. doi: 10.1016/j.renene.2012.05.025
Muliawan M. J., Karimirad M., Moan T., Gao Z. (2012).STC (Spar-Torus Combination): a combined spar-type floating wind turbine and large point absorber floating wave energy converter—promising and challenging. In: International Conference on Offshore Mechanics and Arctic Engineering (American Society of Mechanical Engineers). Available online at: https://asmedigitalcollection.asme.org/OMAE/proceedings-abstract/OMAE2012/667/270340 (Accessed January 8, 2025).
Mustapa M. A., Yaakob O. B., Ahmed Y. M., Rheem C.-K., Koh K. K., Adnan F. A. (2017). Wave energy device and breakwater integration: A review. Renewable Sustain. Energy Rev. 77, 43–58. doi: 10.1016/j.rser.2017.03.110
Newman J. N. (1979). The theory of ship motions. Adv. Appl. mechanics 18, 221–283. doi: 10.1016/S0065-2156(08)70268-0
Pérez-Collazo C., Greaves D., Iglesias G. (2015). A review of combined wave and offshore wind energy. Renewable Sustain. Energy Rev. 42, 141–153. doi: 10.1016/j.rser.2014.09.032
Rehman S., Alhems L. M., Alam M. M., Wang L., Toor Z. (2023). A review of energy extraction from wind and ocean: Technologies, merits, efficiencies, and cost. Ocean Eng. 267, 113192. doi: 10.1016/j.oceaneng.2022.113192
Soares-Ramos E. P., de-Oliveira-Assis L., Sarrias-Mena R., Fernández-Ramírez L. M. (2020). Current status and future trends of offshore wind power in Europe. Energy 202, 117787. doi: 10.1016/j.energy.2020.117787
Wan L., Moan T., Gao Z., Shi W. (2024). A review on the technical development of combined wind and wave energy conversion systems. Energy, 294, 130885. doi: 10.1016/j.energy.2024.130885
Wan L., Ren N., Zhang P. (2020a). Numerical investigation on the dynamic responses of three integrated concepts of offshore wind and wave energy converter. Ocean Eng. 217, 107896. doi: 10.1016/j.oceaneng.2020.107896
Wan Y., Zheng C., Li L., Dai Y., Esteban M. D., López-Gutiérrez J.-S., et al. (2020b). Wave energy assessment related to wave energy convertors in the coastal waters of China. Energy 202, 117741. doi: 10.1016/j.energy.2020.117741
Weinstein A., Roddier D., Banister K. (2012). WindWaveFloat (WWF): Final Scientific Report. Tech. Rep., Principle Power Inc. Available online at: http://www.osti.gov/servlets/purl/1057931/.
Windt C., Davidson J., Ransley E. J., Greaves D., Jakobsen M., Kramer M., et al. (2020). Validation of a CFD-based numerical wave tank model for the power production assessment of the wavestar ocean wave energy converter. Renewable Energy 146, 2499–2516. doi: 10.1016/j.renene.2019.08.059
Wu X., Hu Y., Li Y., Yang J., Duan L., Wang T., et al. (2019). Foundations of offshore wind turbines: A review. Renewable Sustain. Energy Rev. 104, 379–393. doi: 10.1016/j.rser.2019.01.012
Wu H., Zhu F., Yuan Z. (2024). Effects of the WEC shape on the performance of a novel hybrid WEC-FOWT system. Energy 288, 129907. doi: 10.1016/j.energy.2023.129907
Yu M., Cao F., Wei Z., Han M., Shi H., Chen P., et al. (2024). Hydrodynamic performance and energy redistribution characteristics of wind–wave hybrid system based on different WEC microarrays. Ocean Eng. 306, 118090. doi: 10.1016/j.oceaneng.2024.118090
Yue M., Liu Q., Li C., Ding Q., Cheng S., Zhu H. (2020). Effects of heave plate on dynamic response of floating wind turbine Spar platform under the coupling effect of wind and wave. Ocean Eng. 201, 107103. doi: 10.1016/j.oceaneng.2020.107103
Zhang Z., Chen X., Wu H., Liu W., Cui L. (2023). Numerical study of a novel hybrid system with the Wavestar wave energy converter array and a SPIC semi-submersible floating platform. J. Cleaner Production 407, 137178. doi: 10.1016/j.jclepro.2023.137178
Keywords: point absorption wave energy converter, WECs microarray, TGL semi-submersible floating platform, wind-wave hybrid system, platform motion, mooring line tension, absorbed power
Citation: Li M, Wei C, Li L, Yuan Z, Liu Y and Xue G (2025) Numerical study of hybrid systems combining different WECs microarrays based on the TGL semi-submersible floating platform. Front. Mar. Sci. 12:1563310. doi: 10.3389/fmars.2025.1563310
Received: 19 January 2025; Accepted: 19 February 2025;
Published: 13 March 2025.
Edited by:
Siming Zheng, Zhejiang University, ChinaReviewed by:
Carlos Pérez-Collazo, University of Vigo, SpainCopyright © 2025 Li, Wei, Li, Yuan, Liu and Xue. This is an open-access article distributed under the terms of the Creative Commons Attribution License (CC BY). The use, distribution or reproduction in other forums is permitted, provided the original author(s) and the copyright owner(s) are credited and that the original publication in this journal is cited, in accordance with accepted academic practice. No use, distribution or reproduction is permitted which does not comply with these terms.
*Correspondence: Yanjun Liu, bHlqMTExeWpzbHdAMTYzLmNvbQ==; Gang Xue, eHVlZ2FuZ3piQDE2My5jb20=
Disclaimer: All claims expressed in this article are solely those of the authors and do not necessarily represent those of their affiliated organizations, or those of the publisher, the editors and the reviewers. Any product that may be evaluated in this article or claim that may be made by its manufacturer is not guaranteed or endorsed by the publisher.
Research integrity at Frontiers
Learn more about the work of our research integrity team to safeguard the quality of each article we publish.