
95% of researchers rate our articles as excellent or good
Learn more about the work of our research integrity team to safeguard the quality of each article we publish.
Find out more
ORIGINAL RESEARCH article
Front. Mar. Sci. , 10 March 2025
Sec. Marine Fisheries, Aquaculture and Living Resources
Volume 12 - 2025 | https://doi.org/10.3389/fmars.2025.1545718
This article is part of the Research Topic Challenges in Fishery Assessment Methodologies View all 12 articles
 Mateo Barreiro1*
 Esther Abad1
 Luís T. Antelo2
 José Carlos Fernández1Carlos Pereira2
 Juan Carlos Ovalle2
 Ricardo Issac Pérez Martín2
 Julio Valeiras1
Long-term conservation of marine resources depends on the availability of data to adequately assess fish stocks, the environmental state and the impact of fishing activity on marine ecosystems. In recent years, electronic monitoring (EM) has developed significantly as a tool to provide data on fishing activity and catches. In this context, the question arises as to how these data can be utilized for scientific fisheries research, given the available EM systems and the wide variety of commercial fisheries. In our study, we tested four case studies in Spanish waters: otter bottom trawling targeting demersal fish, otter bottom trawling targeting mackerel, trammel net fishery and purse seining. To evaluate the utility of EM, in these case studies, we designed a comparative analysis based on two data sources: data from scientific human observers and data from an electronic camera system. Both methods were applied to the same hauls to assess the accuracy of the cameras, the system performance and the problems with adequate data collection for scientific purposes in each fishery studied. The results showed that the camera system recorded an average of 69% to 80% of the total captured species in trawling, full coverage (99%) in trammel nets, and 64% in purse seining. The number of detected individuals varied among the identified species. An 83% agreement was observed for retained Lepidorhombus spp. and 55% for retained Scomber scombrus in bottom trawl fisheries. Likewise, a 90% agreement was recorded for Sepia officinalis in the trammel net fishery. In terms of total estimated weight, a 75% agreement was achieved for retained Sardina pilchardus in the purse seine fishery. Additionally, the camera system was able to record bycatch species, including marine mammals and seabirds, and protected, endangered, and threatened (PET) species. This information provides an opportunity to gather more scientific data from small-scale fisheries, which are the most common type in Spain. Some possibilities are proposed to address several challenges to improve the accuracy of camera recordings in different fisheries so that they are useful for scientific data collection.
Fishing is a strategic sector in many coastal countries, both due to its economic significance and its provision of food and employment. However, the long-term viability of fishing activities faces two main threats: overfishing and discards. A significant portion of fishing grounds are overfished, endangering marine ecosystems and the sustainability of fishery resources. Currently, it is estimated that 33.1% of fishing grounds are overfished (FAO, 2018). Additionally, discards represent a major problem in fishing activities. This fraction of the catch, defined as “the part of the catch that is not retained on board during a fishing operation and is discarded at sea” (Kelleher and Food and Agriculture Organization of the United Nations, 2005), occurs for various reasons including lack of market demand and legal constraints related to fishery management, such as minimum legal sizes and quota limitations (Catchpole et al., 2005). To address these issues, the European Union (EU) implemented a reform in 2013 of the Common Fisheries Policy (CFP) with the objective of achieving sustainable exploitation of living aquatic resources and aquaculture, balancing environmental, economic, and social aspects (European Union, 2013).
In this context, and to ensure compliance with European regulations, it is essential to develop new solutions and technologies for scientific monitoring (data collection on catch, composition fishing effort, and bycatch species impact), control (regulations and legislation to prevent illegal discards and reduce bycatch), and surveillance (tools to ensure compliance with fisheries policies), collectively known as MSC (Monitoring, Surveillance, and Control) (Antelo et al., 2020). The effect of fisheries on species with conservation problems, protected, in danger or threatened (PETS) that are part of vulnerable marine ecosystems makes it necessary to record bycatch in order to have the necessary information for mitigation. Issues such as the bycatch ratio, stages of the fishing operation in which interaction occurs, mortality rates, manual handling of accidental catches (Chan et al., 2024), are key to comply with European requirements, about reducing bycatch and taking mitigation measures in the European fisheries (ICES, 2020). To date, the primary source of fishery data for commercial fishing vessels has been at-sea observer programs. These programs provide detailed biological and fishing data, record rare and protected species, and serve as a crucial link between the fishing sector, scientific bodies, and administrative institutions. Despite their importance, observer programs are costly, and their coverage is limited by poor weather conditions and the restricted working space on commercial vessels (James et al., 2018; Plet-Hansen et al., 2019). A technological solution that has gained interest in recent decades is the Electronic Monitoring (EM) system, which is currently used in numerous fisheries to obtain data on catch, bycatch, and discards for fisheries management (Van Helmond et al., 2020; Briand et al., 2022). In response to low compliance with the discard ban, the European Fisheries Control Agency (EFCA) has endorsed EM systems as a method of control and surveillance, defining technical standards for their use in the European fishing fleet (EFCA, 2019). Additionally, research institutes and companies have conducted numerous pilot trials to test different EM configurations in various fisheries (Van Helmond et al., 2020).
In Europe, EM systems began testing in the early 2000s. One of the first studies was conducted in Norway aboard a scientific vessel in the Barents Sea, where an electronic camera was tested to identify demersal fish species by using algorithms to calculate length and weight (White et al., 2006). Subsequent studies focused on catch quota management (CQM) and the observation of protected species, primarily in Denmark by the Technical University of Denmark (DTU Aqua), which tested an EM system designed by Archipelago Marine Research Ltd. on Danish vessels using trammel nets, purse seines, and trawls targeting cod. These studies aimed to analyze the potential of EM to record all catches and discards (Dalskov et al., 2009, 2011, 2012). In Germany, Archipelago Marine Research Ltd.’s EM system was also tested to evaluate its potential to record fishery discards, with findings indicating that EM could provide more accurate data than fishing logbooks and record all fishing events (Götz et al., 2015). In the Netherlands, the same system was tested in mixed demersal trawl fisheries, and data obtained from EM were compared with logbook data from studied vessels. The results showed that EM systems could achieve a fully documented fishery (FDF) of catches, discards, and bycatch with high correlation for large species. However, EM systems have limitations with mixed fisheries or high species diversity, particularly for small-sized species (Van Helmond et al., 2015, 2017).
In a similar line, Bergsson et al. (2017) tested an EM system designed by Anchor Lab k/s to ensure compliance with landing obligations. The system was evaluated in purse seine and gillnet fisheries, demonstrating that EM could reduce the frequency of discards and provide biological information such as species length distribution. Moreover, the studies by Dalskov et al. (2009) and Ulrich et al. (2015) detected a low frequency of discards when using EM systems on board. They concluded that the implementation of EM systems serves as a deterrent, encouraging the avoidance of areas with higher discard rate. Some authors have also explored the use of EM to record bycatch events (Kindt-Larsen et al., 2023; Puente et al., 2023), highlighting its robust capability to extend observation periods crucial for recording interactions with marine mammals, seabirds, and PET species. EM data can identify regions with higher bycatch rates, allowing for better management of fishing activities to avoid areas with high bycatch incidence.
As new EM systems are developed, studies have been conducted to evaluate their accuracy. In large tuna purse seine fisheries, Ruiz et al. (2013, 2015) tested two EM systems: EM system of Archipelago Marine research and the Electronic Eye developed by Marine Instruments. The goal of these studies was to verify their utility and reliability by comparing EM data with observer data for estimates of catches, discards, and bycatch. Both studies concluded that EM could accurately calculate fishing effort and evaluate total catches and bycatch at levels comparable to human observers. Similarly, a study of Briand et al. (2017) on French tuna purse seine fisheries evaluated EM data of Thalos company system for its capability to increase observation coverage, verifying that the system provided useful data on non-target catches and discards with species identification accuracy comparable to human observers. In another study, Legorburu et al. (2018) tested an EM system designed by Satlink Company to monitor fish aggregating devices (FADs) in tuna purse seine fisheries. The authors affirmed that results indicated that EM is a potentially reliable system for monitoring this activity. In the demersal fisheries of the Netherlands, an automatic system was developed by Wageningen University and Research, to identify captured species on a conveyor belt using an RGB camera and automatic counting and detection system. The precision of this system was compared with observer data, showing good accuracy except in situations of overlap and high catch volume (Van Essen et al., 2021). This situation was also observed in Ovalle et al. (2022), who developed an automatic identification system called iObserver to test in demersal Spanish fisheries. The authors concluded that using an EM system with automatic identification has the potential to obtain scientific data with resolution similar to that of human observers. However, in overlapping situations, the precision of the system is reduced.
These previous studies have the common characteristic to focus the develop of EM in large-scale fishery, as purse seine (Briand et al., 2017; Ruiz et al., 2013; Ruiz et al., 2015) or long-line (Ames et al., 2007) and gillnets (Emery et al., 2019). Some authors as Bartholomew et al. (2018) studied an EM system to record catches of elasmobranchs in artisanal fleets in Peru. In a similar line, Glemarec et al. (2020) studied the utility of EM to record the bycatch of seabirds in artisanal gillnets in Denmark. However, the application of EM in this type of fisheries is a challenge due to the limitations on board by technical issues of the fleet (Bartholomew et al., 2018). Therefore, continuing EM testing in this type of fishery is key to its implementation. Likewise, in Spain it is the most common type of fishing by number of vessels (Secretaría General de Pesca, 2024). In addition to this, the focus of EM technologies is aimed to MSC mainly. Nevertheless, research institutions and organizations as ICES (International Council of exploration of the Seas), needs this information to obtain more data to scientific proposes, and to know better the function of marine ecosystems.
Given the variety of EM systems available commercially and the specific requirements of each fishery and vessel configuration, a program of experimental trials was launched within a research project to validate the collection of scientific data through electronic monitoring of fishing vessels in Spanish fishing grounds. The main goal has been to design a suitable methodology to obtain data usable by scientists and compare it with data recorded by human observers, integrating MSC in the studied fisheries.
On board experimental trials on the sea were conducted to test our system cameras in different fisheries in northern Spain. using both cameras and human observers to compare the data collected by the cameras with those collected by the human observers.
The study focused on commercial fishing vessels across four fisheries that operate in Spanish national waters (ICES subdivision 8c). These fisheries have been defined as métiers, described as “a group of fishing operations that aim to catch similar species (or assemblages of species) with similar gear during the same period of the year or in the same area, and are characterized by similar fishing patterns” (European Union, 2008). The studied métiers included otter bottom trawl fishery (OTB_DEF), mackerel bottom trawl fishery (OTB_MPD), trammel net fishery (GTR_DEF), and purse seine fishery targeting small pelagic fish (PS_SPF) (Castro et al., 2011; Valeiras et al., 2014).
In the OTB_DEF fishery, the sampling area was the National fishing ground Cantabrian-Northwest (ICES subdivisions 8c and occasionally 8b). This métier is characterized by a wide variety of demersal species captured in a mixed fishery. Some of the main species include megrims (Lepidorhombus boscii, Lepidorhombus whiffiagonis), European hake (Merluccius merluccius), monkfish (Lophius spp.), blue whiting (Micromesistius poutassou), and horse mackerel (Trachurus trachurus), among others. Vessels operating in this métier use trawls with mesh sizes greater than 70 mm, trawl doors that are dragged along the bottom, and a vertical opening of the net mouth not exceeding 2.5 meters (Castro et al., 2011; Valeiras et al., 2014). These are vessels that carry out a fishery with little industrialization, keeping the catches cold (not frozen) and processing the fish minimally or not at all. Fishing trips last one to three days, in fishing grounds near the port, because the continental shelf is very narrow. In this case study, a total of 47 hauls (Figure 1A) were monitored with a camera system and human observers on two bottom trawl vessels over 14 days at sea in four experimental trials (Table 1). In the OTB_MPD fishery, the sampling area was also the National fishing ground Cantabrian-Northwest. This métier is practically monospecific, with mackerel (Scomber scombrus) as the main target species, and horse mackerel as a minor catch. The vessels used are the same as those in the OTB_DEF métier (Castro et al., 2011; Valeiras et al., 2014). In this case study, a total of 21 hauls (Figure 1B) were monitored with a camera systems and human observers on two bottom trawl vessels over 10 days at sea in six experimental trials (Table 1).
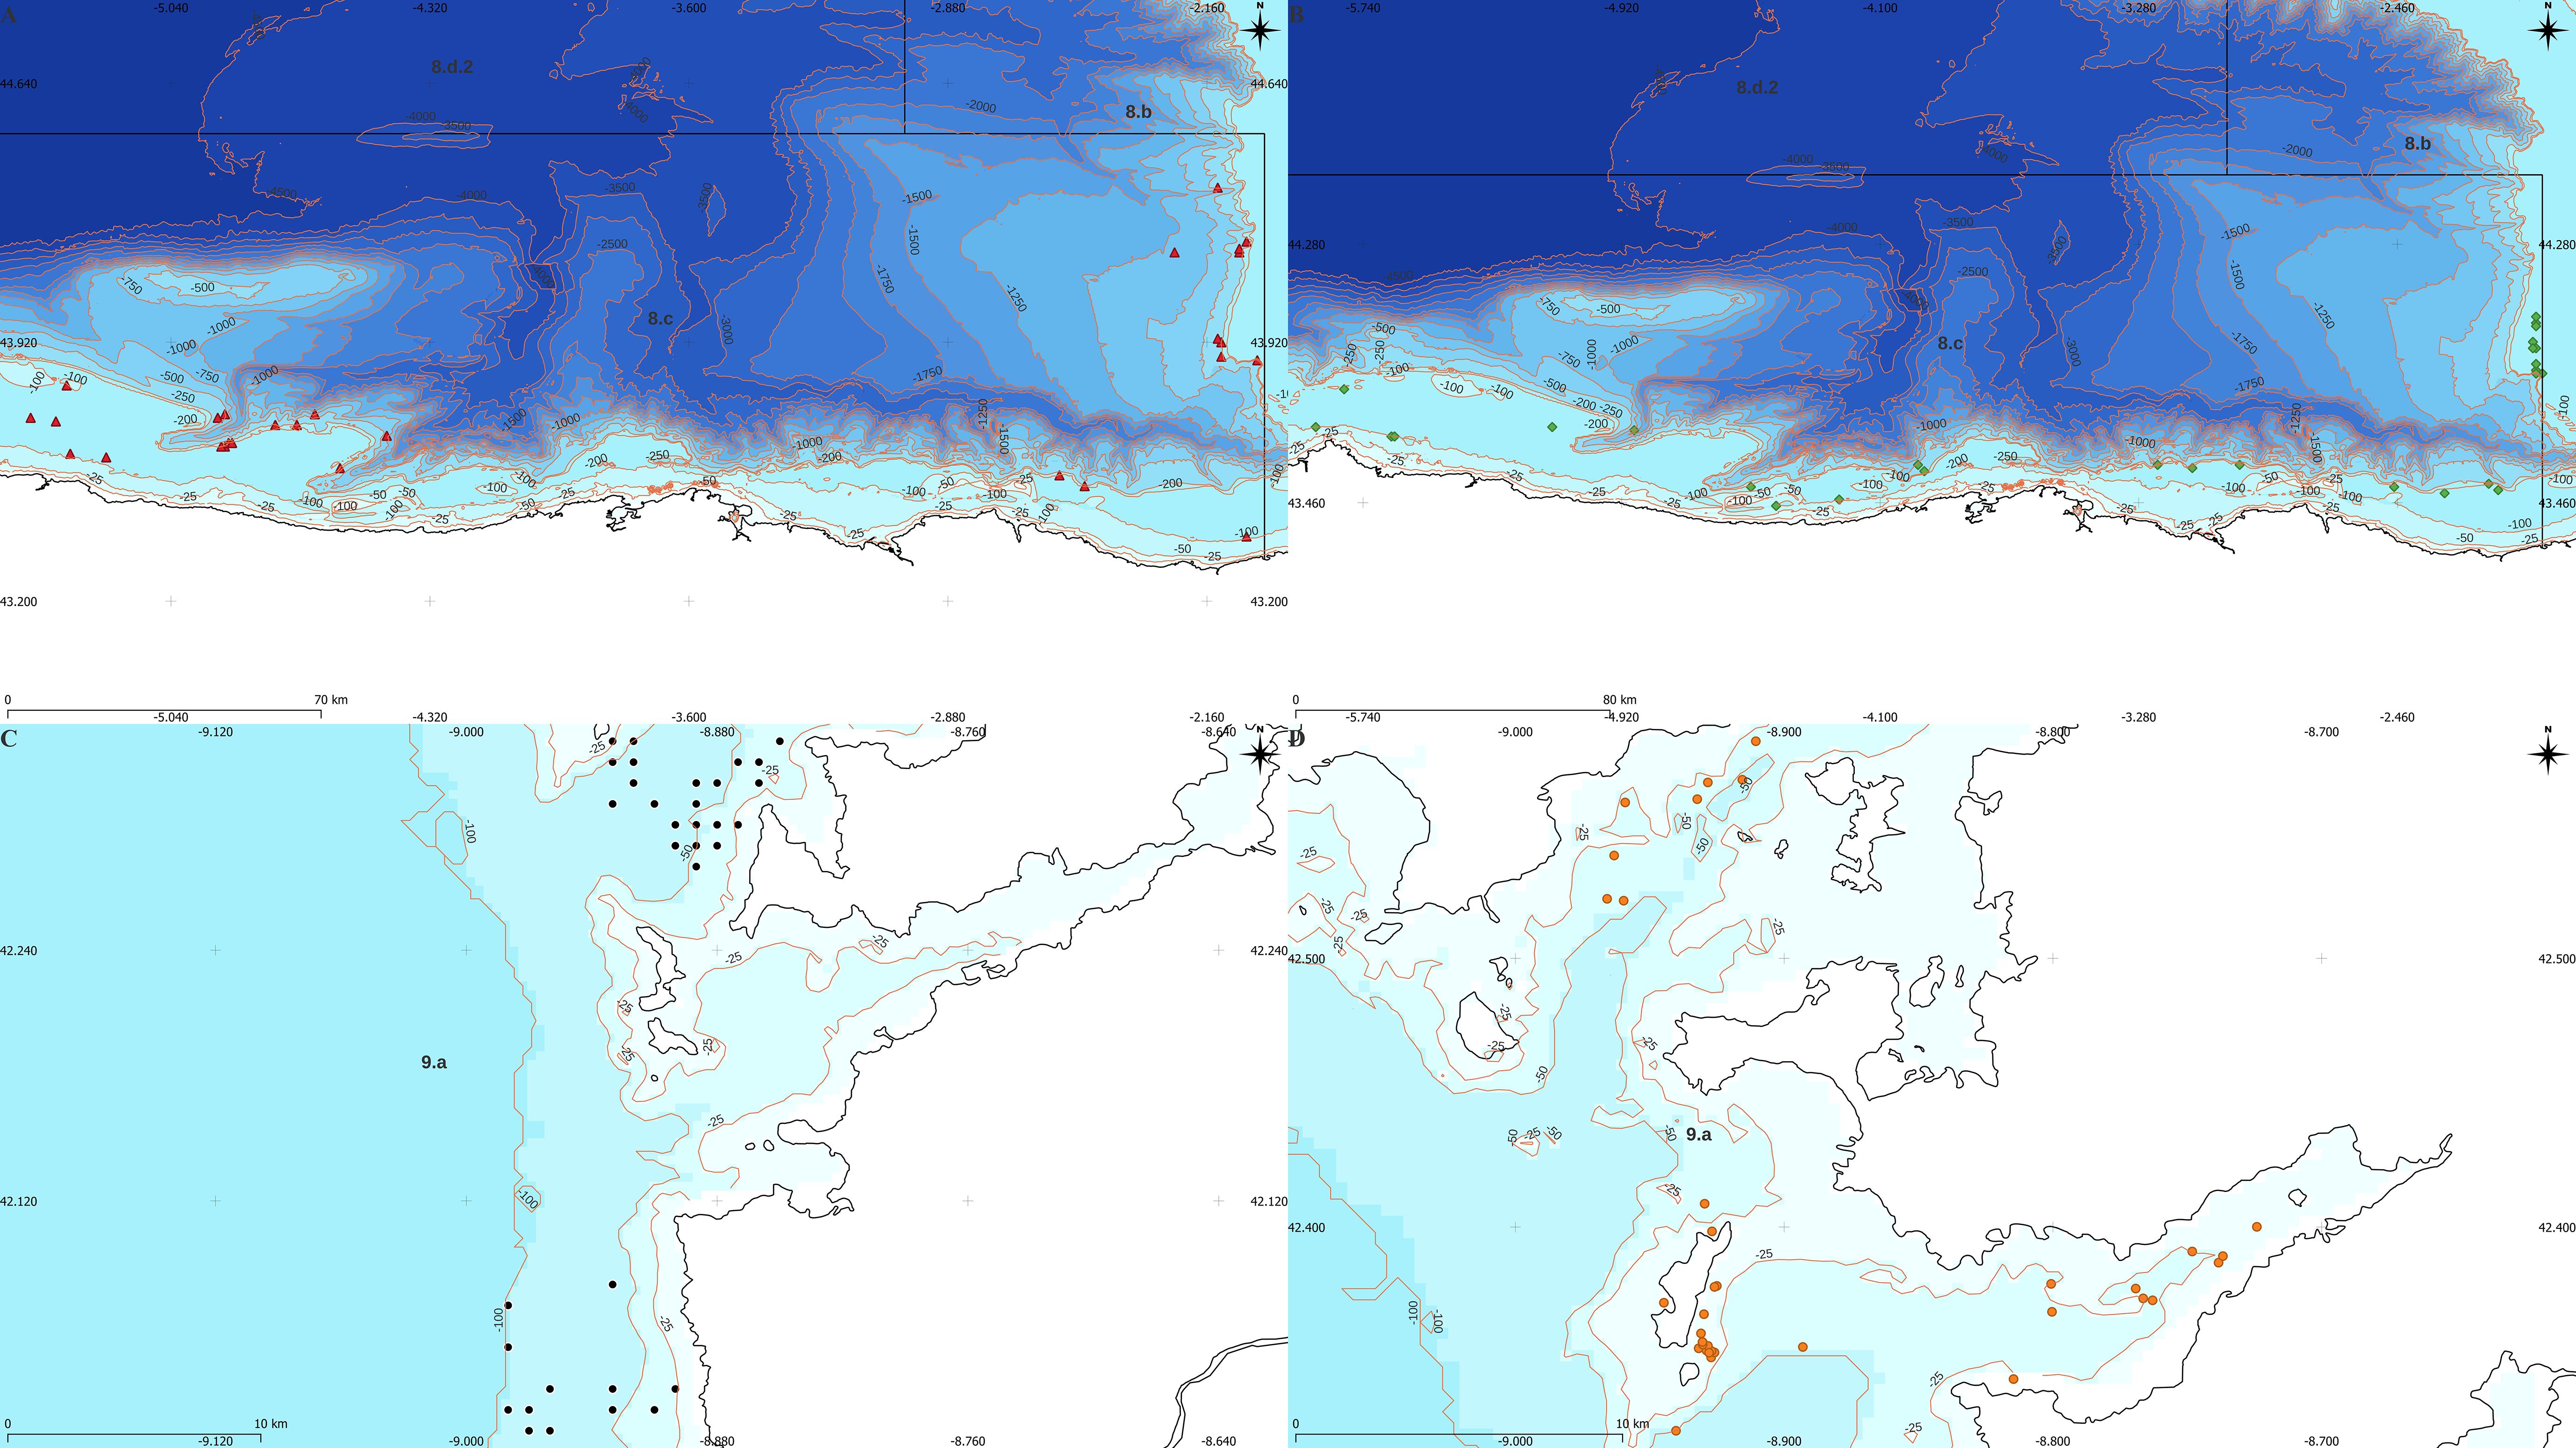
Figure 1. Spatial distribution of monitored hauls in (A) OTB_DEF, (B) OTB_MPD, in both métiers the surveys have been developed in north Spanish shore (Asturias, Cantabria and Basque Country). In the case of métiers (C) GTR_DEF and (D) PS_SPF have been carried out in northwest Spanish shore, in the “Rías Baixas” (Galicia). The maps have been created with the QGIS application.
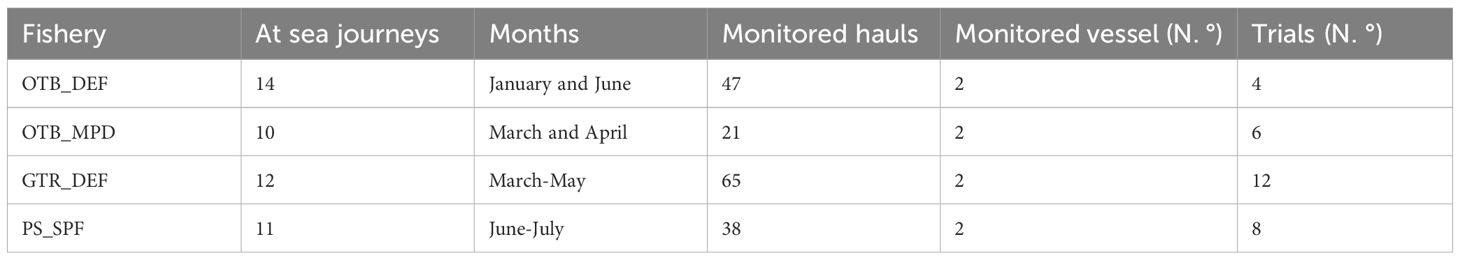
Table 1. Summary of total monitored hauls in the study by fishery and number of trials.
In the GTR_DEF fishery, the sampling area was the coastal region known as “Rías Baixas” on the northwest Spanish coast (ICES subdivision 9a). This métier is characterized by a wide biodiversity of captured demersal species in a mixed fishery. Some of the main species include cuttlefish (Sepia officinalis), ballan wrasse (Labrus bergylta), sole (Solea solea, Solea senegalensis, and Pegusa lascaris), skates (Rajidae), pout (Trisopterus luscus), spider crab (Maja brachydactyla), pollack (Pollachius pollachius), and European hake (Merluccius merluccius). Vessels operating in this métier are small boats with sizes ranging from 5 to 18 meters, artisanal fleet, and equipped with nets having a maximum length per piece of 50 meters and a height of 3 meters, with mesh sizes of 500 mm for the outer panel and 90 mm for the inner panel (Castro et al., 2011; Valeiras et al., 2014; Sea Council of Galicia, 2011). In this case study, a total of 65 hauls (Figure 1C) were monitored with a camera system and human observers on two trammel net vessels over 12 days at sea in twelve experimental trials (Table 1). In the PS_SPF fishery, the sampling area was also the “Rías Baixas” region on the northwest Spanish coast (ICES subdivision 9a). This métier targets small pelagic species, including sardine (Sardina pilchardus), horse mackerel (Trachurus trachurus), mackerel (Scomber scombrus), anchovy (Engraulis encrasicolus), Atlantic chub mackerel (Scomber colias), and bogue (Boops boops), among others. Vessels operating in this métier are small, with a minimum overall length of 11 meters, and cannot have auxiliary vessels. The gear used includes nets with a minimum mesh size of 14 mm, a maximum height of the purse seine netting of 130 meters, and a maximum length of 600 meters (Castro et al., 2011; Sea Council of Galicia, 2011). In this case study, a total of 38 hauls (Figure 1D) were monitored with a camera system and human observers on two purse seine vessels over 11 days at sea in eight experimental trials (Table 1).
During experimental trials on fishing vessels, an autonomous camera system was employed to record hauls and the manual handling of catches. Depending on the métier studied, one or two cameras were necessary to monitor the fishing events. In OTB_DEF and OTB_MPD, two cameras were used for each, as fishing events and handling manipulation occurred both on fishing deck and in processing deck (inside the trawlers) (Figures 2A, B), respectively. Conversely, in GTR_DEF and PS_SPF, only one camera was sufficient in each case (Figures 2C, D) since both fishing events and handling manipulation took place on deck. The cameras used were action cameras. This type of cameras is a small, rugged, waterproof digital cameras designed for capturing photographic shots or video. In this study two models were chosen: GoPro model Hero5 and COOAU model CU-SPC06. Both models are compact, lightweight, durable, and resistant to rain and seawater, and record 4K high-definition video through a wide-angle lens. Additionally, they can be placed in various locations on the vessel and adapted with great versatility to different fisheries. These cameras record 4K high-definition video through a wide-angle lens and can be configured to operate automatically with minimal intervention. They can also be controlled via remote control. Moreover, these cameras do not require modifications to the ship or any technical installation or wiring on board, and their installation and assembly costs are practically zero. However, it should be noted that camera systems have limitations collecting data due to a limiting factors as light conditions, since, there are night fishing or excess of light, that lower the video quality. The environmental factor as rain, wind, waves or clouds can be affected to recorded in external locations as the deck of boat. Moreover, the workers on-board can be an obstacle in the records. Finally, in hauls with a high volume of catches the overlap of individuals involves a reduction of the accuracy and quality of data.
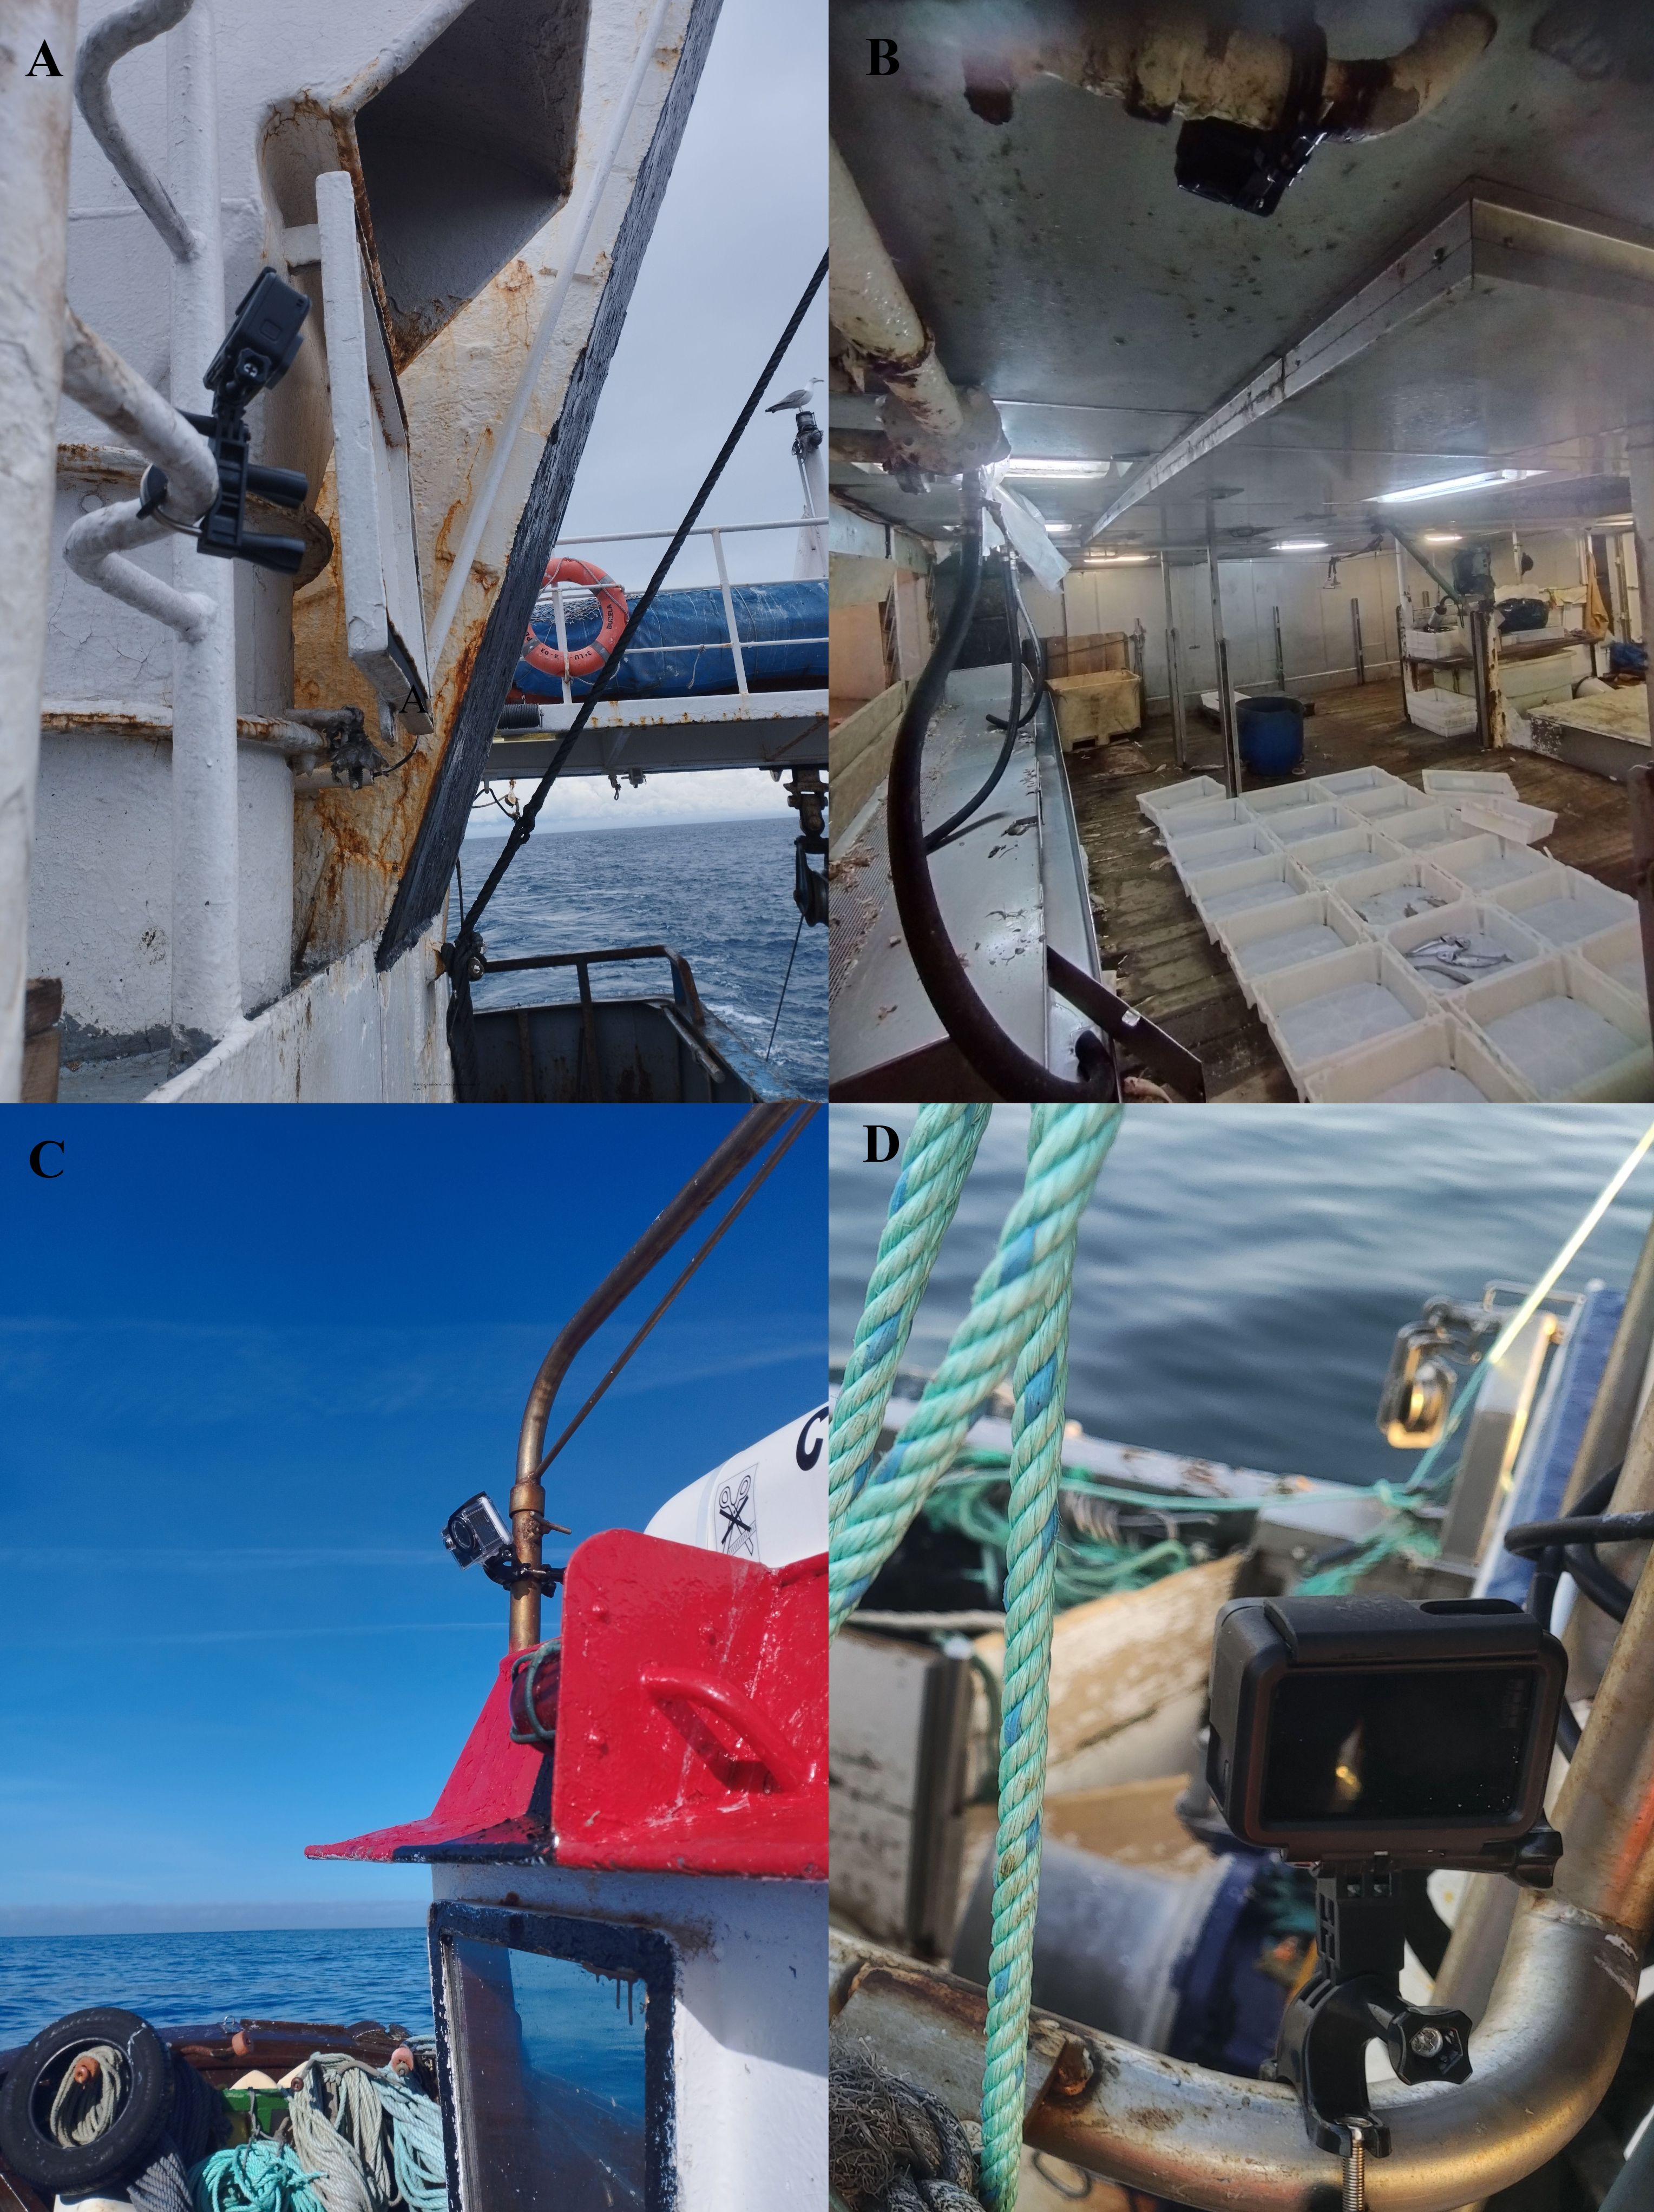
Figure 2. Camera system and locations. (A) deck camera used in OTB_DEF an OTB_MPD. (B) capture zone camera used in OTB_DEF an OTB_MPD. (C) deck camera used in GTR_DEF and (D) deck camera used in PS_SPF.
For on-board installation, accessories were used to attach the cameras to fixed structures based on the specific needs and chosen locations. The camera positions were determined by the sampling objectives, aiming for the best angles to provide a clear field of view of the areas where retained and discarded catches pass, onboard activities, fishing events, bycatch events, and interactions between the vessel and marine mammals. To select the optimal location for each camera, the following factors were considered to minimize potential obstacles:
✓ Objects in the camera’s angle of focus: Ensuring the field of view is free of obstacles.
✓ Light conditions: Avoiding low illumination, light sources, and sunlight reflections.
✓ Field of view: Ensuring it is wide and close enough for species identification and counting.
✓ Accessibility of cameras: Ensuring easy access for adjustments without interfering with fishing operations.
✓ Vessel operation: Adjusting the recording area and the number of cameras based on the métier.
During each haul, the autonomous camera is activated at the moment the fishing net is being hauled in and records until the entire gear is retrieved. The video number is noted, and the batteries are checked. For the cameras in the fishing processing area, the zone under the deck where the catches are processed, they are turned on when the catch arrives at the fishing processing area and continue recording until the catch process is complete.
In each fishing vessel, two onboard observers collected data simultaneously with the camera system during fishing hauls. This dual approach provided two sources of information for cross-validation. The human observers recorded technical data related to each fishing operation, including date, time, geographical position, and characteristics of the fishing gear deployed. They also documented the species composition of catches (both retained and discarded), captured biomass (both retained and discarded), and length distribution and frequency of target species within each catch fraction. Measurement of the length of the fish is done with a measuring board (so called ‘ichthyometer’). The weight of the fish is recorded by weighing it on a hand scale. It is important to note that in purse seine fisheries, the length distribution and frequency of species could not be measured due to operational constraints aboard the vessel. For the other studied fisheries, the onboard sampling and data collection were utilized to gather information on total weight, species composition (target species), and catch fraction (retained and discarded). In purse seine fisheries, the observers’ data provided total estimated weight and species composition information, but not total frequency. Additionally, the onboard observers were responsible for installing and operating the camera system on each vessel, ensuring the collection of video footage for subsequent analysis.
The videos were analyzed using VLC media player for Windows 10. Prior to analysis, the quality of the videos was assessed to discard those with poor image quality, significant lighting issues, or critical cuts. Each video captured detailed technical and qualitative information about the fishing activity. This included the number of fishing events, whether they occurred during day or night, the type of fishing gear used, date and time of the operation, video duration, and duration of the fishing operation itself. Additionally, in some cases, weather conditions and any bycatch events or interactions captured by deck cameras were noted. Quantitative data on species composition were also recorded, identifying species in both retained and discarded catches (Figure 3). The taxonomic reference level for identification was species; however, for species that could not be identified at this level, assignments were made at the genus, family, or order level, depending on the minimum taxonomic resolution possible. Furthermore, for each identified species, the frequency in number was documented. This data collection method was implemented in the OTB_DEF, OTB_MPD, and GTR_DEF fisheries. In the case of PS_SPF, individual counts per species were not feasible; instead, biomass estimates per species were derived based on the number of bailers and their respective weights.
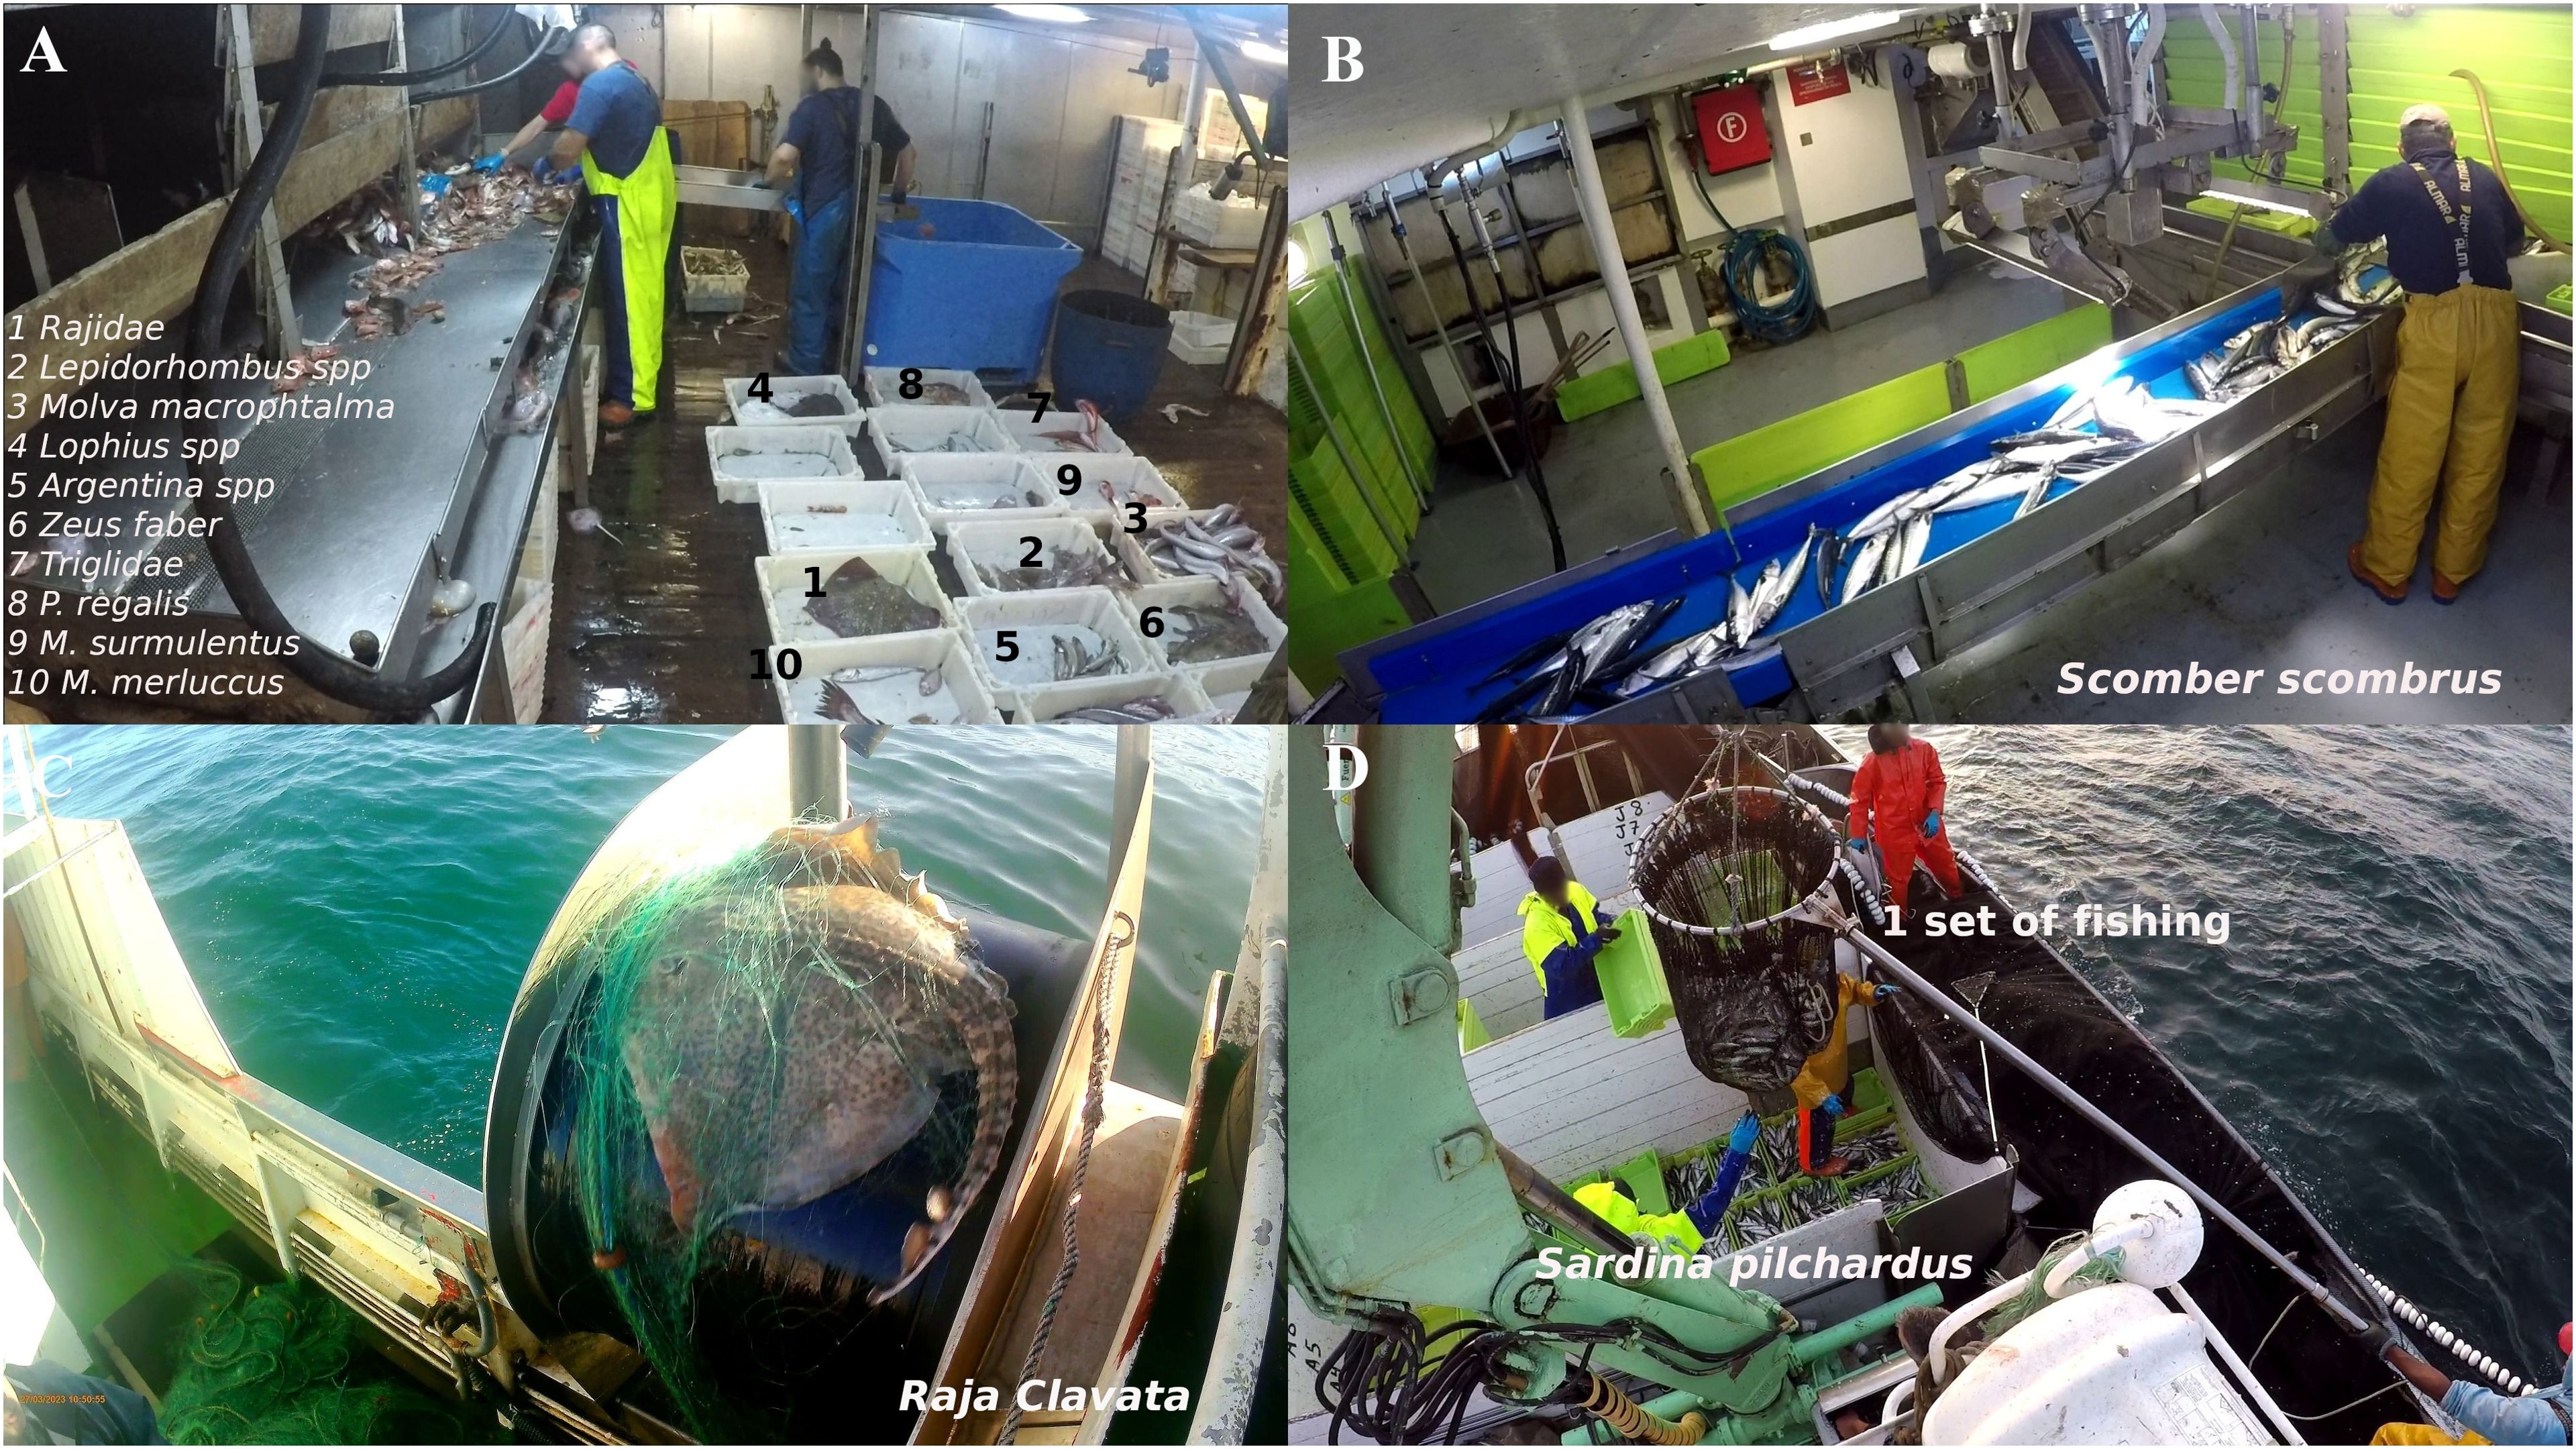
Figure 3. An example of obtained images of revised videos by métier in (A) OTB_DEF. (B) OTB_MPD. (C) GTR_DEF and (D) PS_SPF.
In the review of OTB_DEF and OTB_MPD fishery’s videos, a sampling strategy was adopted to enhance cost-efficiency. Given the extended duration of videos in these fisheries, which increased the costs associated with their review, representative time segments (beginning, middle, and end) were sampled. The total number of individuals per species observed in both retained and discarded catches was then weighted (Equation 1), following a methodology similar to that used by Briand et al. (2023). A sampling velocity of x0.4 was selected to improve the reliability of species identification in these fisheries. It is important to note that while sampling was used to determine individual frequencies, the entire video footage was reviewed at a faster velocity (x2) to ensure that important events were recorded. In contrast, the videos from GTR_DEF and PS_SPF fisheries were entirely reviewed due to their shorter duration, and the cost-efficiency of their revision was comparable to that achieved through sampling in other fisheries.
Where Npondered is the total frequency of one species in one haul, Nsampled is the number of individuals counted during de Tsampled which is the time between the first caught individual enter on board and the last one. Finally, Tprocessing is the total time of duration of catches manipulation.
First, the video data obtained were used to characterize the catches in each fishery. The species composition in each fraction of the catches was determined by fishery. Second, the catches were defined by the frequency (number of individuals) of the main species in both the retained and discarded fractions. The total frequency (TNcameras) for each species and catch fraction was calculated as the sum of the total frequency of each haul (Npondered) recorded in the videos across all métiers in the experimental trials (Equation 2). This calculation was performed for the fisheries OTB_DEF, OTB_MPD, and GTR_DEF. For the fishery PS_SPF, the composition of the catch was defined by the total estimated biomass (TWcameras) for each species and catch fraction. TWcameras was calculated as the sum of the estimated biomass (EW) recorded in the videos across all experimental trials (Equation 3). Using this information, the species caught were analyzed to identify the main species representing each métier, and to categorize them into taxonomic groups or species based on their importance in both the retained and discarded catches. Finally, R software (R Core Team, 2023) and the ggplot2 package (Wickham, 2009) were used to create graphics to represent and describe the fishery.
In Equation 2, TNcameras represents the total frequency of a species caught in each métier and within each fraction of the catch detected by the camera system. Npondered denotes the total frequency of a species in a single haul, aggregated from the first occurrence of that species to the last haul. In Equation 3, TWcameras signifies the total estimated biomass of a species caught across all hauls within a métier, as estimated by the camera system. EW represents the estimated biomass of a species in a single haul, aggregated from the first occurrence to the last haul. For the data on bycatch, hauls where bycatch events involving marine mammals, seabirds, or PET species occurred were recorded using deck-mounted cameras. This information was also visualized using ggplot2 to illustrate which métier recorded a higher quantity of these events and to demonstrate the system’s utility for this purpose. Human observers collected information on bycatch on board, including sharks, rays, marine mammals and other species. Observers mainly recorder bycatch when the vessel retrieves the fishing net, so it is necessary to be on the fishing deck at that time. On trawlers vessels, observers may not be present at that time or cannot observe if any bycatch is returned to the sea without reaching the processing deck. In this case, the footage captured by the cameras are key. Additionally, the bycatch events are rare and the records are not enough to obtain a statically power and the results be significantly as in the rest catches. Therefore, is also the reason why the results in the detection of bycatch (namely marine mammals) between cameras and a human observer may not be comparable.
The data from cameras and human observers were compared to assess their similarity in approach. To validate the accuracy of camera-derived information against human observer data, the following analyses were conducted across all fisheries and trial fractions: In each fishery, the number of detected species (TNspp) was calculated from all trials and catch fractions. Additionally, for OTB_DEF, OTB_MPD, and GTR_DEF métiers, the frequency of individuals (F) per species and catch fraction was computed for each trial. For PS_SPF, the total estimated weight (TW) was calculated per trial and catch fraction. These metrics were obtained from both camera and human observer data:
✓ For cameras: TNspp (detected species) was the sum of all species detected in all hauls of a trial (Equation 4), applied across all métiers or fisheries. F (frequency) per species and catch fraction was the sum of all Npondered (individuals) per species and haul in OTB_DEF, OTB_MPD, and GTR_DEF métiers (Equation 5). In PS_SPF, TW (estimated weight) was the sum of all EW (estimated weight) per species and haul (Equation 6).
✓ For human observers: TNspp (detected species) was calculated similarly to camera data (Equation 4), applied across all fisheries. However, to obtain F for each trial, it was calculated based on on-board samplings per species conducted by the human observer (Equation 7), where Wcatch is the total weight of a species caught, and Nsampled is the number of individuals sampled by the observer, based on the weight collected (Wsampled). This method was applied in OTB métiers due to the high volume of catches. For PS_SPF, TW (estimated weight) from human observers was obtained similarly to camera data (Equation 6).
These comparisons and calculations were crucial in evaluating the reliability and accuracy of data obtained from both camera systems and human observers across different fishing métiers.
In each fishery and trial, parameters were obtained to assess the accuracy of cameras against human observers. This assessment was based on a parameter known as the Level of Agreement (LA), inspired by a method similar to that used by Moncrief-Cox et al. (2020) for bycatch species. The LA parameter is determined by dividing camera data by observer data for each species and catch fraction within each trial of the métiers, with a reference value of LA=1.00 indicating identical values (Equation 8). Since there are three types of data, the level of agreement was calculated using three approaches:
✓ Level of agreement in detected species (LAspp) across all métiers.
✓ Level of agreement in frequency (LAF) for OTB_DEF, OTB_MPD, and GTR_DEF métiers.
✓ Level of agreement in estimated weight (LATW) for PS_SPF.
These parameters were computed to evaluate the consistency and reliability of camera data compared to human observer data across different fisheries.
The LA value was used to assess the accuracy of the camera system in each fishery for both commercial and non-commercial species, focusing on the number of detected species. It was also utilized to compare the effectiveness of cameras in recording this information across the studied métiers. Accuracy between the two methods was calculated for frequency, species detection, and estimated weight (specifically for purse seining). At a statistical level, diagnostic variables (TNspp, F, and TW) were graphically represented to compare results between the two methods using the ggplot2 package in R software (Wickham, 2009). This analysis focused on detected species and the main species within each studied métier for assessment variables. Furthermore, a statistical analysis was conducted to compare the tested parameters between the two methods for detected species and the variables (F and TW) for each main species. Initially, the normality distribution of the two data sources was examined using Q-Q plots in R software, alongside the Kolmogorov-Smirnov-Lilliefors normality test for samples exceeding 50 observations, using the nortest package (Gross and Ligges, 2015). Once confirming the distribution type of the datasets, the Wilcoxon signed-rank test for paired samples was chosen due to non-normality, utilizing the coin package in R software (Hothorn et al., 2006). Prior to applying the Wilcoxon test, tests for equality of variances (Levene and Fligner-Killeen tests, based on medians) were conducted using the car package in R software (Fox and Weisberg, 2019) to ensure the conditions were met. Finally, for datasets with normal distribution, a two-sample t-test comparing means between groups was performed using the t-test function in R software (R Core Team, 2023). Finally, it was calculated the statistical power ad hoc of performed comparisons between two methods, in each fishery, with for the whole species and catches. Thus, it evaluated the utilized sample sizes were enough to detected the significant discrepancies. For this purpose, it was converted raw statistician of Wilcoxon paired test to normalize statistician (Z) and effect size was estimated as , where N is number of paired observations. The statistical power was calculated using the effect size and sample sizes in R software (R Core Team, 2023). Results showed high values of power: OTB_DEF (0.961), OTB_MPD (0.745), GTR_DEF (1.000) and PS_SPF (0.984), which indicates enough samples size to detect discrepancies and generalize results. However, the number of vessels was limited due to the availability of vessels and the space on board for observers. To minimize bias, vessels were selected to represent the types of vessels found in each fishery and to operate in the typical areas of each fishery.
One of the primary objectives of this study was to evaluate the utility of camera systems in quantifying catch composition. Accordingly, graphical representations were created to depict the total catches of the main species or groups captured across all trials within each fishery, aiming to describe the fisheries. The results were categorized into two groups: demersal and mackerel fisheries for bottom trawls, and artisanal fisheries for trammel nets and purse seines.
Starting with OTB_DEF (Table 2), in the retained fraction, the predominant species included the group of other fishes (mainly Scyliorhinus canicula, Capros aper, Boops boops, Molva macrophtalma, Helicolenus dactylopterus, among others) totaling 16,248 individuals, megrims (Lepidorhombus boscii and Lepidorhombus whiffiagonis) with 12,559 individuals, Merluccius merluccius with 6,359 individuals, Micromesistius poutassou with 5,881 individuals, Phycis blennoides with 3,252 individuals, and Eledone cirrhosa and monkfishes (Lophius piscatorius and Lophius budegassa) with 1,600 and 1,593 individuals, respectively. This indicates a diverse representation of species caught in the fishery (approximately 40 species detected in this fraction) including commercial target species. In the discarded fraction, the main species included Capros aper with 13,139 individuals, followed by a variety of invertebrates (mainly Actinauge richardi, Ophiuroidea, Asteroidea, Gastropoda, Parastichopus tremulus, among others) with 11,636 individuals. Bottom sharks such as Scyliorhinus canicula with 10,978 individuals and Galeus spp. with 10,616 individuals were also significant components. Echinoderms, particularly sea urchins (Echinoidea), accounted for 7,519 discarded individuals. Additionally, various species contributed to the group of other fishes (including Chimaera monstrosa, Micromesistius poutassou, and Molva macrophthalma, among others) with 5,912 individuals. Furthermore, the Triglidae family, marine skates (Rajidae), and megrims (Lepidorhombus spp.) represented important components of discarded species with 4,430, 2,000, and 1,579 individuals, respectively. This information illustrates the biodiversity of discarded species typical of demersal fisheries.
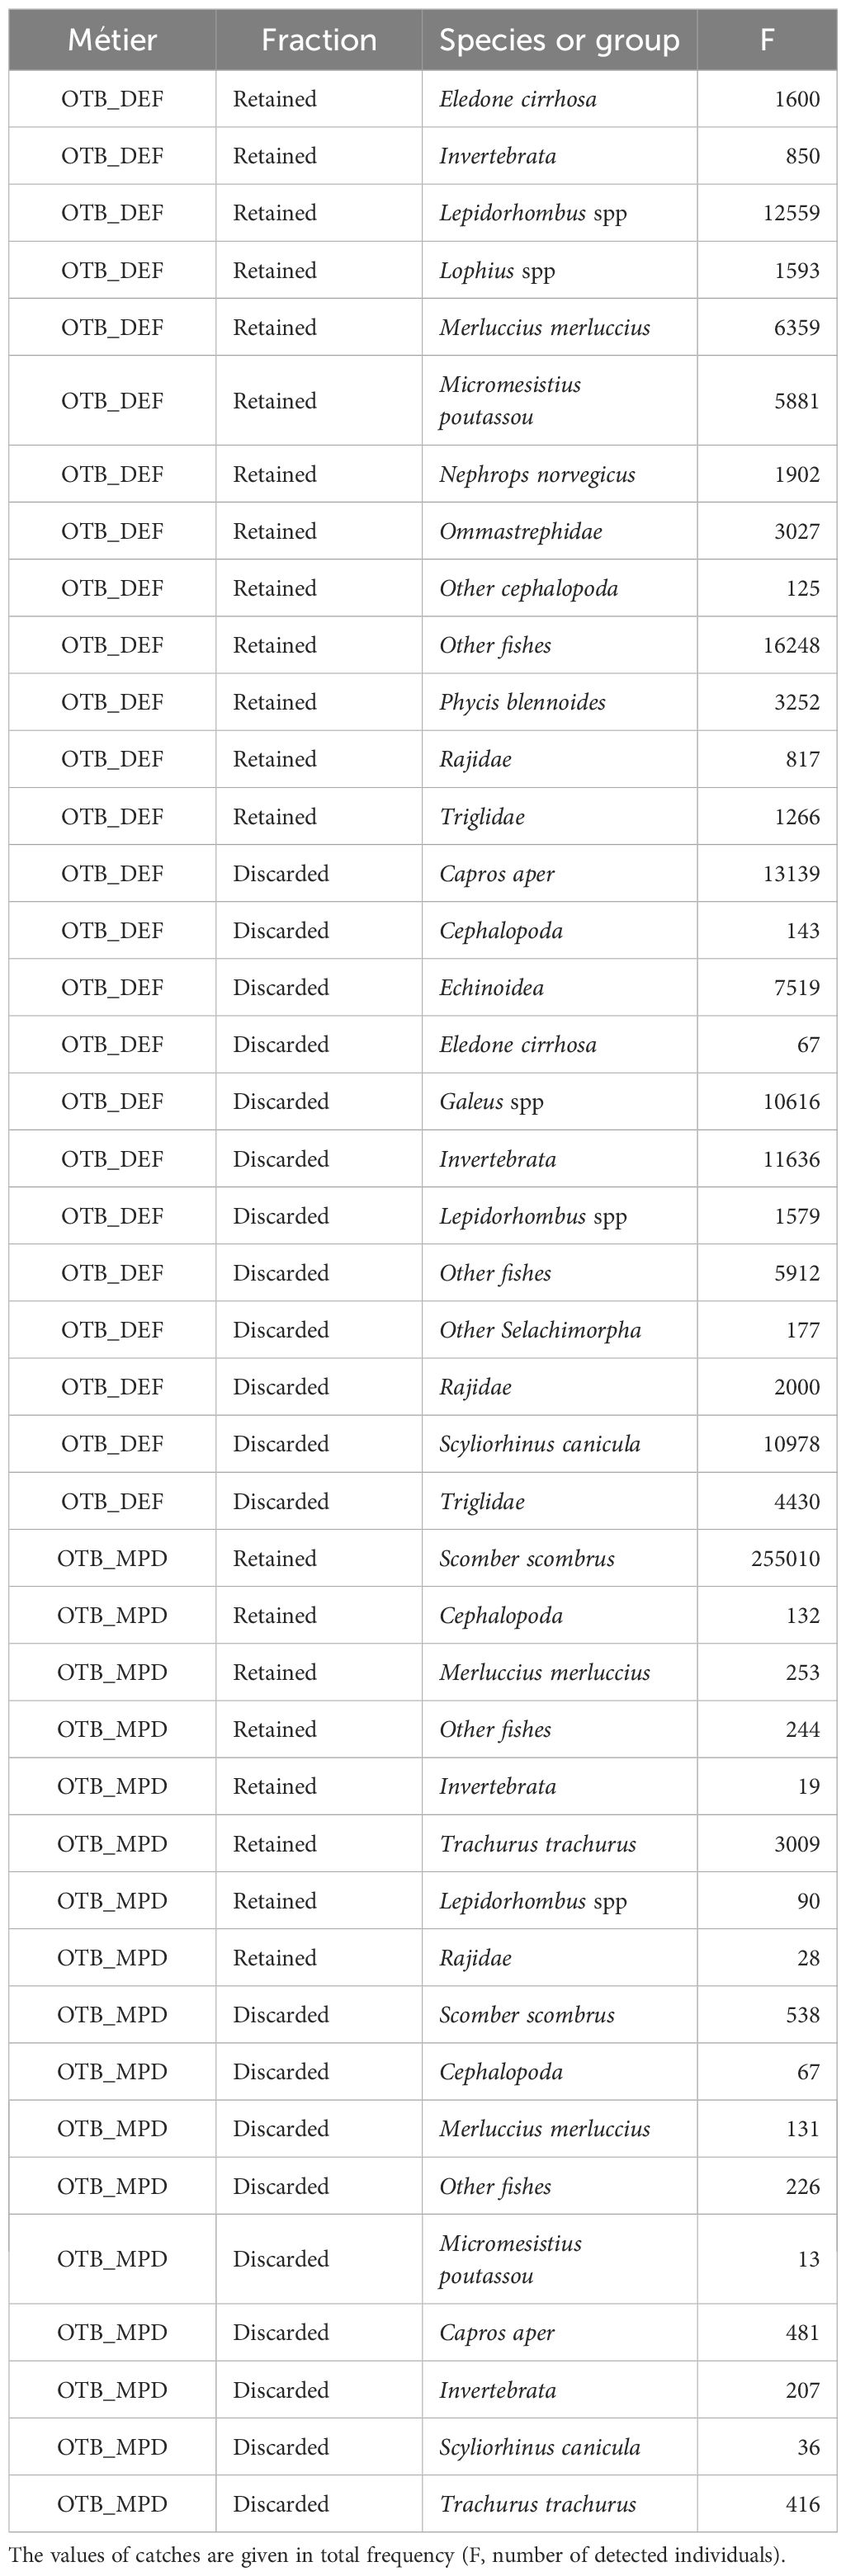
Table 2. Catches composition obtained with cameras system in demersal trawl bottom fishery and mackerel bottom trawl fishery, in retained and discarded catch fraction.
Conversely, in OTB_MPD (Table 2), the retained catches primarily consisted of mackerel (Scomber scombrus) with 255,010 individuals, while other captured species had lower abundances, with horse mackerel (Trachurus trachurus) being the only other notable species with 3,009 individuals. These camera system results clearly indicate that this fishery is characterized by a single-species focus and represents the reality of the fishery. In the discarded fraction, there were fewer species and lower frequencies of specimens captured. Mackerel (similar to retained catches) was among the main species with 538 individuals, alongside Capros aper with 481 individuals and horse mackerel with 416 individuals, all pelagic species. Additionally, the group of other fishes (including Triglidae, Rajidae, and Lepidorhombus spp., among others) contributed 226 individuals to discards. Invertebrate species (primarily Echinoidea and Parastichopus regalis) accounted for 207 discarded individuals. There were also small numbers of Merluccius merluccius (131 individuals), Scyliorhinus canicula (36 individuals), and Micromesistius poutassou (13 individuals) discarded. These results indicate a low discard rate of target species and a limited biodiversity in both retained and discarded catches, highlighting this métier as predominantly single-species focused.
Moving on to artisanal fisheries (Table 3), in GTR_DEF, a high biodiversity of catches was observed. In the retained fraction, major species included soles (Soleidae, including Solea solea, Solea senegalensis, and Pegusa lascaris) with 457 individuals, followed by a group of other fishes (including Microchirus variegatus, Trisopterus minutus, Triglidae, and Lepidorhombus spp.) with 435 individuals. Pouting (Trisopterus luscus) was another significant species with 362 individuals, followed by white sea bream (Diplodus spp., including Diplodus sargus and Diplodus vulgaris) with 150 individuals. European hake (133 individuals) and cephalopods (mainly Sepia officinalis and Octopus vulgaris) totaling 100 individuals were also notable. Marine skates (Rajidae, primarily Raja brachyura and Raja clavata) were targeted species with 89 individuals. Crustaceans, primarily Maja brachydactyla, were recorded at 40 individuals, and the shark Scyliorhinus canicula at 53 individuals, with other species in lesser quantities. These data demonstrate a wide range of typical demersal mixed fishery species, albeit with lower catches due to the artisanal nature of this fishery. In the discarded fraction, marine invertebrates were predominant, with sea urchins (Echinoidea) accounting for 429 individuals, followed by mollusks (including Neptunea contraria and Galeodea rugosa) with 126 individuals, starfish (Asteroidea) with 94 individuals, and crustaceans (Maja brachydactyla and Cancer pagurus) totaling 46 individuals. Fish species such as Boops boops with 84 individuals and Sardina pilchardus with 79 individuals were also discarded, along with the group of other fishes (including Labrus mixtus and Triglidae) totaling 39 individuals. Elasmobranchs were represented by 33 individuals of Rajidae (mainly Raja undulata) and 20 individuals of Scyliorhinus canicula. These results indicate that discards in this fishery primarily consist of a wide range of benthic invertebrates, along with some fish and elasmobranch species.
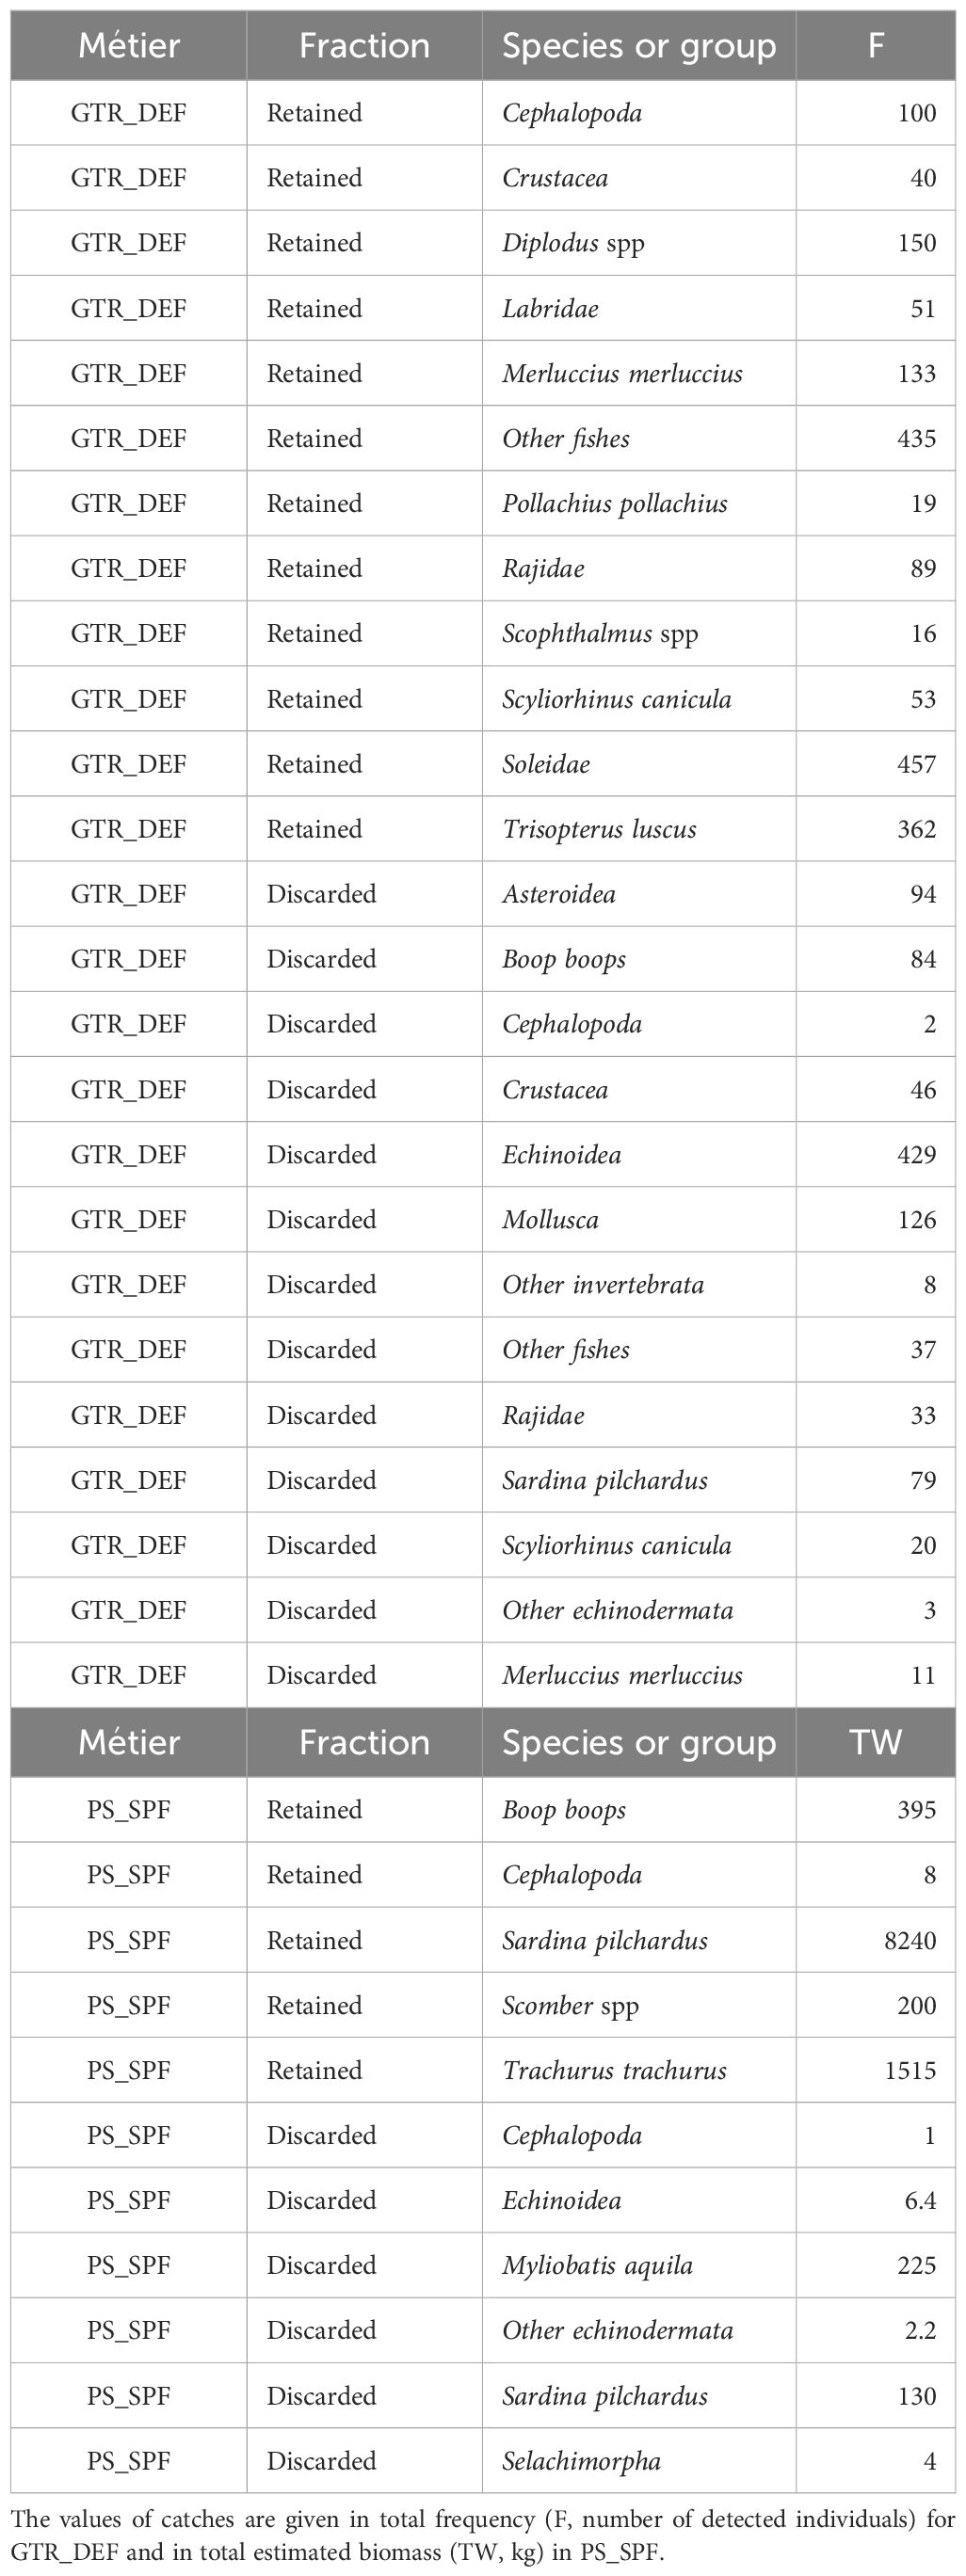
Table 3. Catches composition obtained with cameras system in demersal trammel net fishery (GTR_DEF) in purse seine of little pelagic fishery (PS_SPF) in retained and discarded catch fraction.
In PS_SPF, catch composition is described in terms of estimated biomass obtained using the camera system. The major retained species (Table 3) included sardine with 8,240 kg, making it the most important target species in this fishery. Horse mackerel followed with 1515 kg, and Boops boops with 395 kg, along with genus Scomber spp. contributing 200 kg. This fishery shows a limited species composition focused on targeted species due to directed fishing practices. In the discarded fraction), eagle ray (Myliobatis aquila) was the most discarded species with 225 kg, followed by sardine with 130 kg. Other species had minimal captures totaling 13.6 kg, indicating a low discard rate recorded by the camera system in this fishery.
During experimental trials, the deck camera system monitored 57 hauls across fisheries where bycatch events were recorded (Figure 4A) during a total of 47 days at sea across all four fisheries. In the trawl bottom fisheries (OTB_MPD and OTB_DEF), significant bycatch events were observed primarily in OTB_MPD, with a total of 10 hauls recording bycatch events out of 15, predominantly in March. The bycatch species in this fishery (Figure 4B) included the northern gannet (Morus bassanus), with a total of 61 individuals captured, and one pilot whale (Globicephala melas). Bycatch incidents occurred when these animals attempted to feed on mackerels escaping from the fishing net during its retrieval. In OTB_DEF, out of a total of 31 monitored hauls (Figure 4A), only one haul recorded a bycatch event of a sunfish (Mola mola) with one individual (Figure 4B), observed during a sea trial in June. This pelagic species was captured during the net’s ascent to the sea surface.
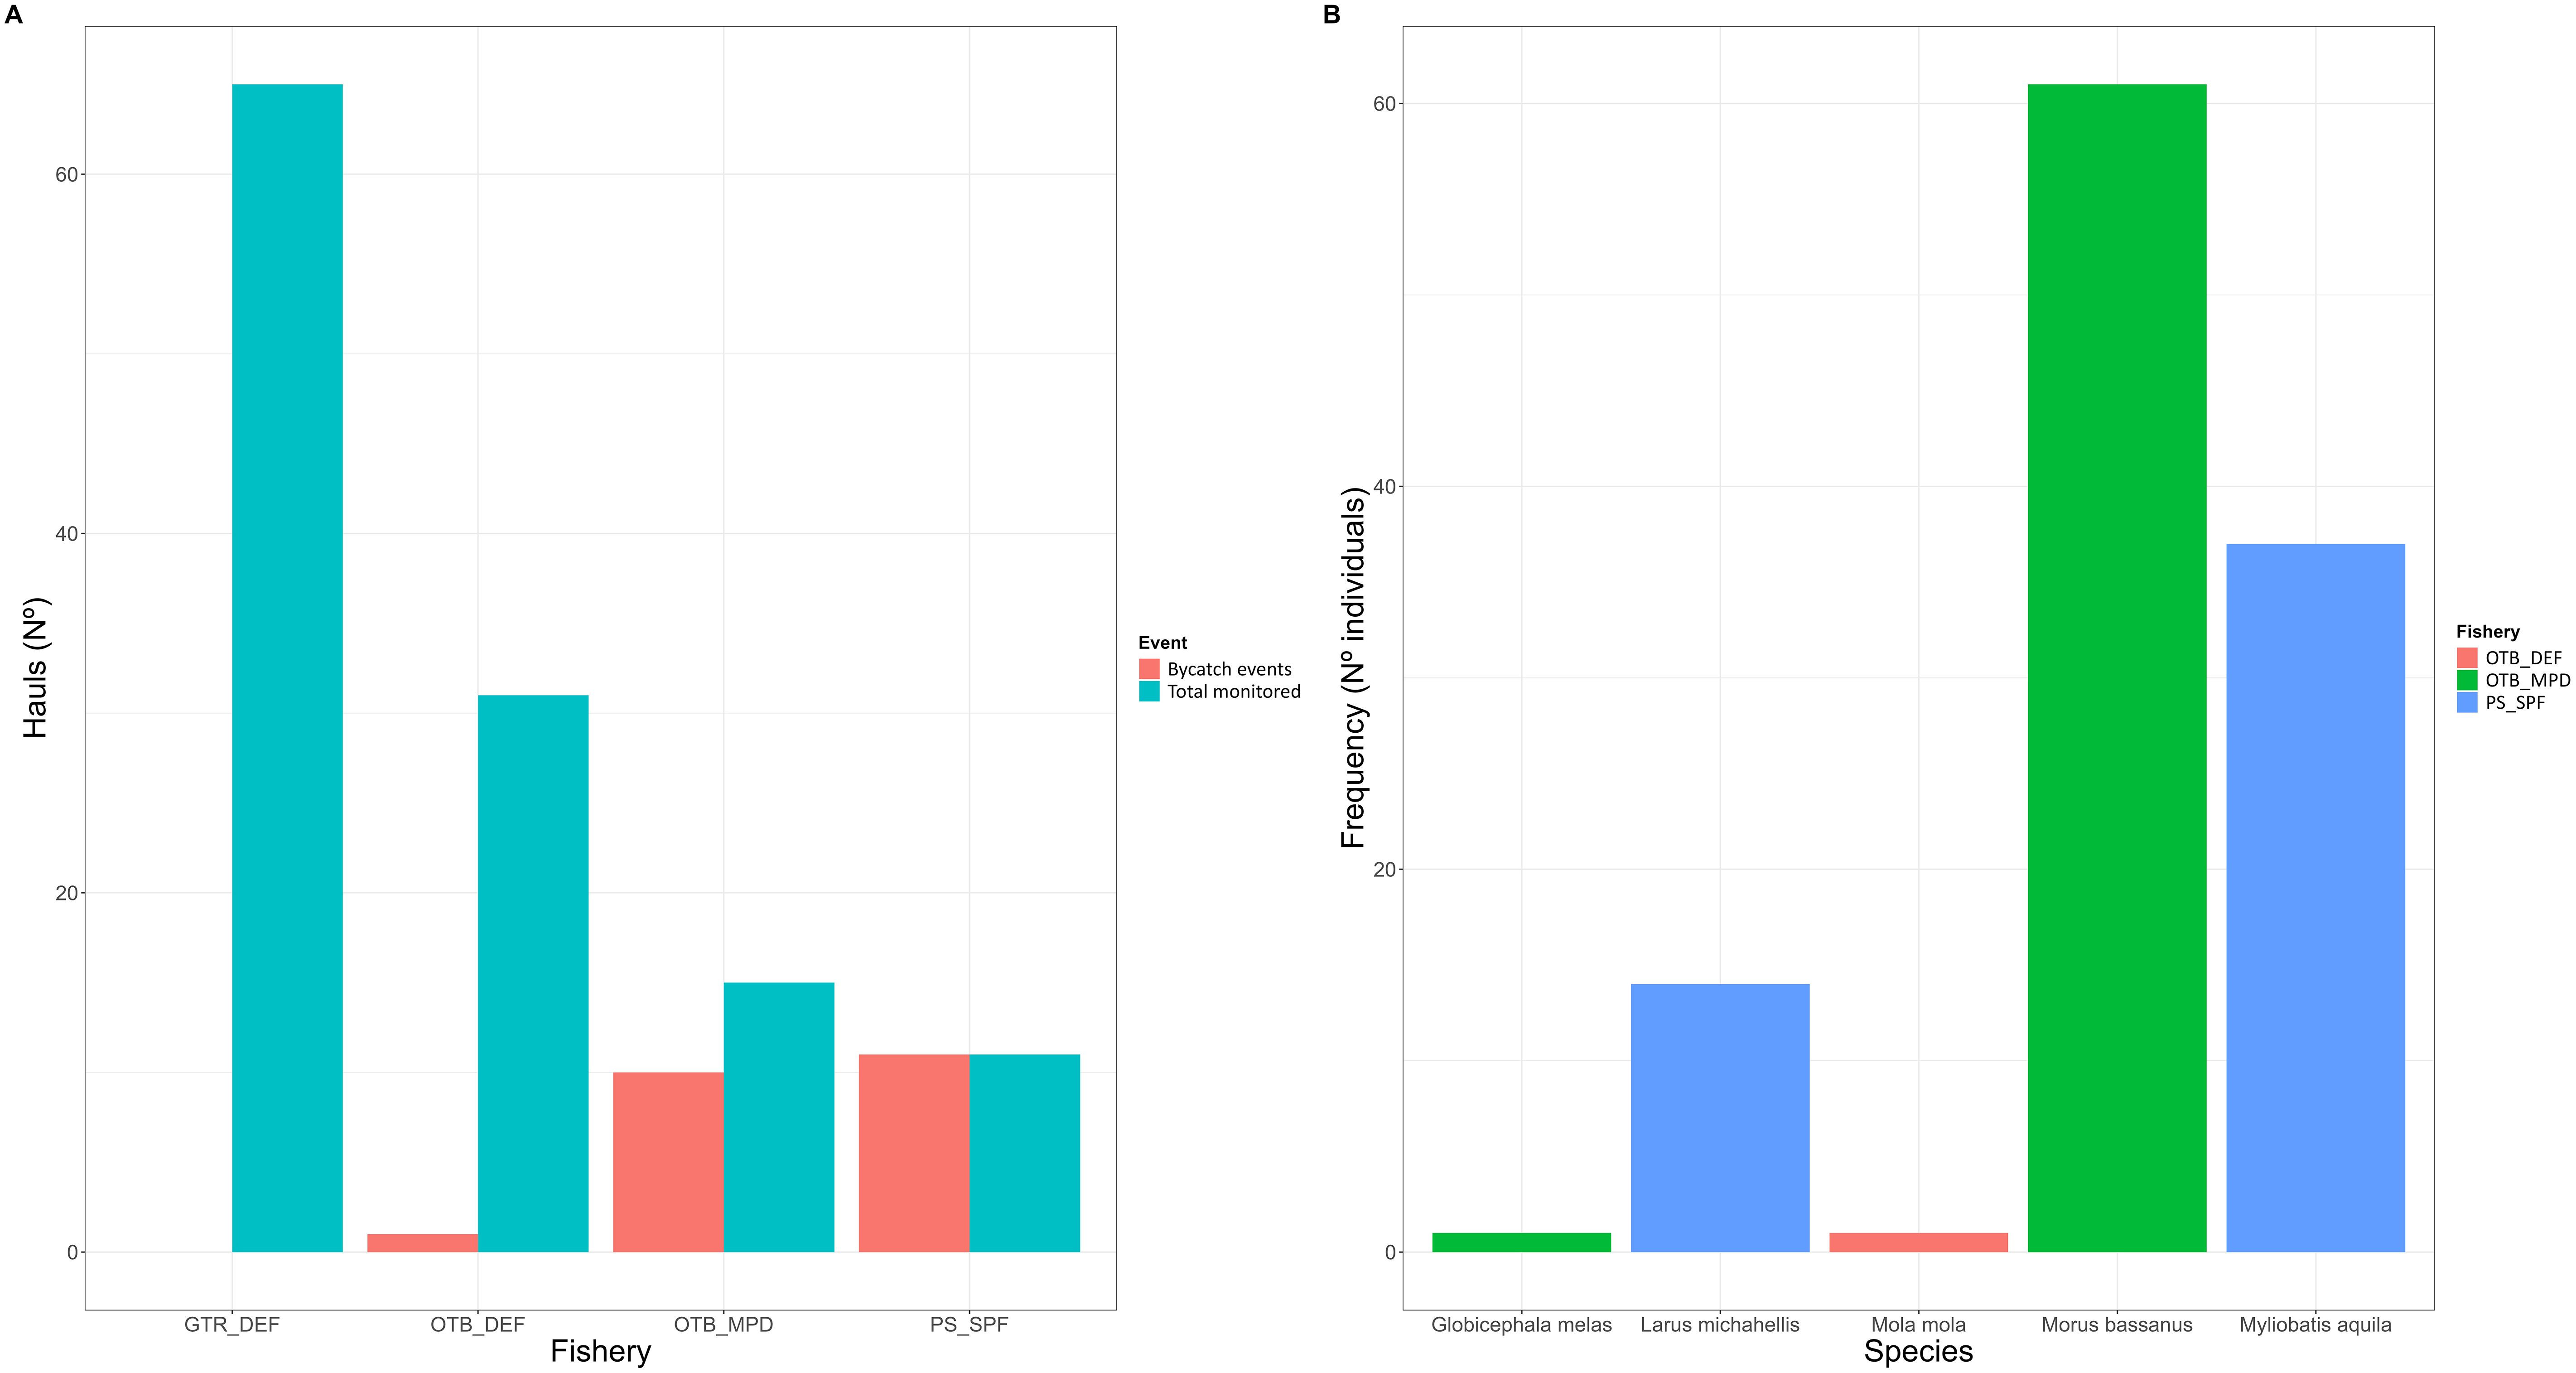
Figure 4. Recorded of bycatch events with cameras system of (A) monitored hauls and bycatch hauls by métier and (B) detected bycatch species by métier. The values of hauls are given in number and the values of bycatch species are given in total frequency (number of individuals).
In artisanal fisheries cameras system have not recorded any bycatch events in the fishery GTR_DEF in the 65 monitored hauls (Figure 4A). While, In PS_SPF, bycatch events were detected in all monitored hauls (Figure 4A), when lighting conditions permitted, occurring in June and July. Two species were recorded as bycatch: the common eagle ray, with a total of 37 individuals recorded, and the Yellow-legged gull (Larus michahellis), with a total of 14 individuals (Figure 4B). It is noteworthy that common eagle rays were caught at night, whereas Yellow-legged gulls were caught during daylight and during the retrieval of the fishing net.
The validation of camera data has been conducted to verify the accuracy of the cameras in detecting species and specimens, focusing on the primary species within each fishing method, and in the case of PS_SPF, the biomass of the main species (Figure 5). This validation utilizes observer data and the Level of Agreement (LA) as described in section 2.5.2. The analysis includes graphical representation of mean values, comparison of diagnostic values using boxplots, and several statistical tests to determine significant differences between the two methods described in the aforementioned section.
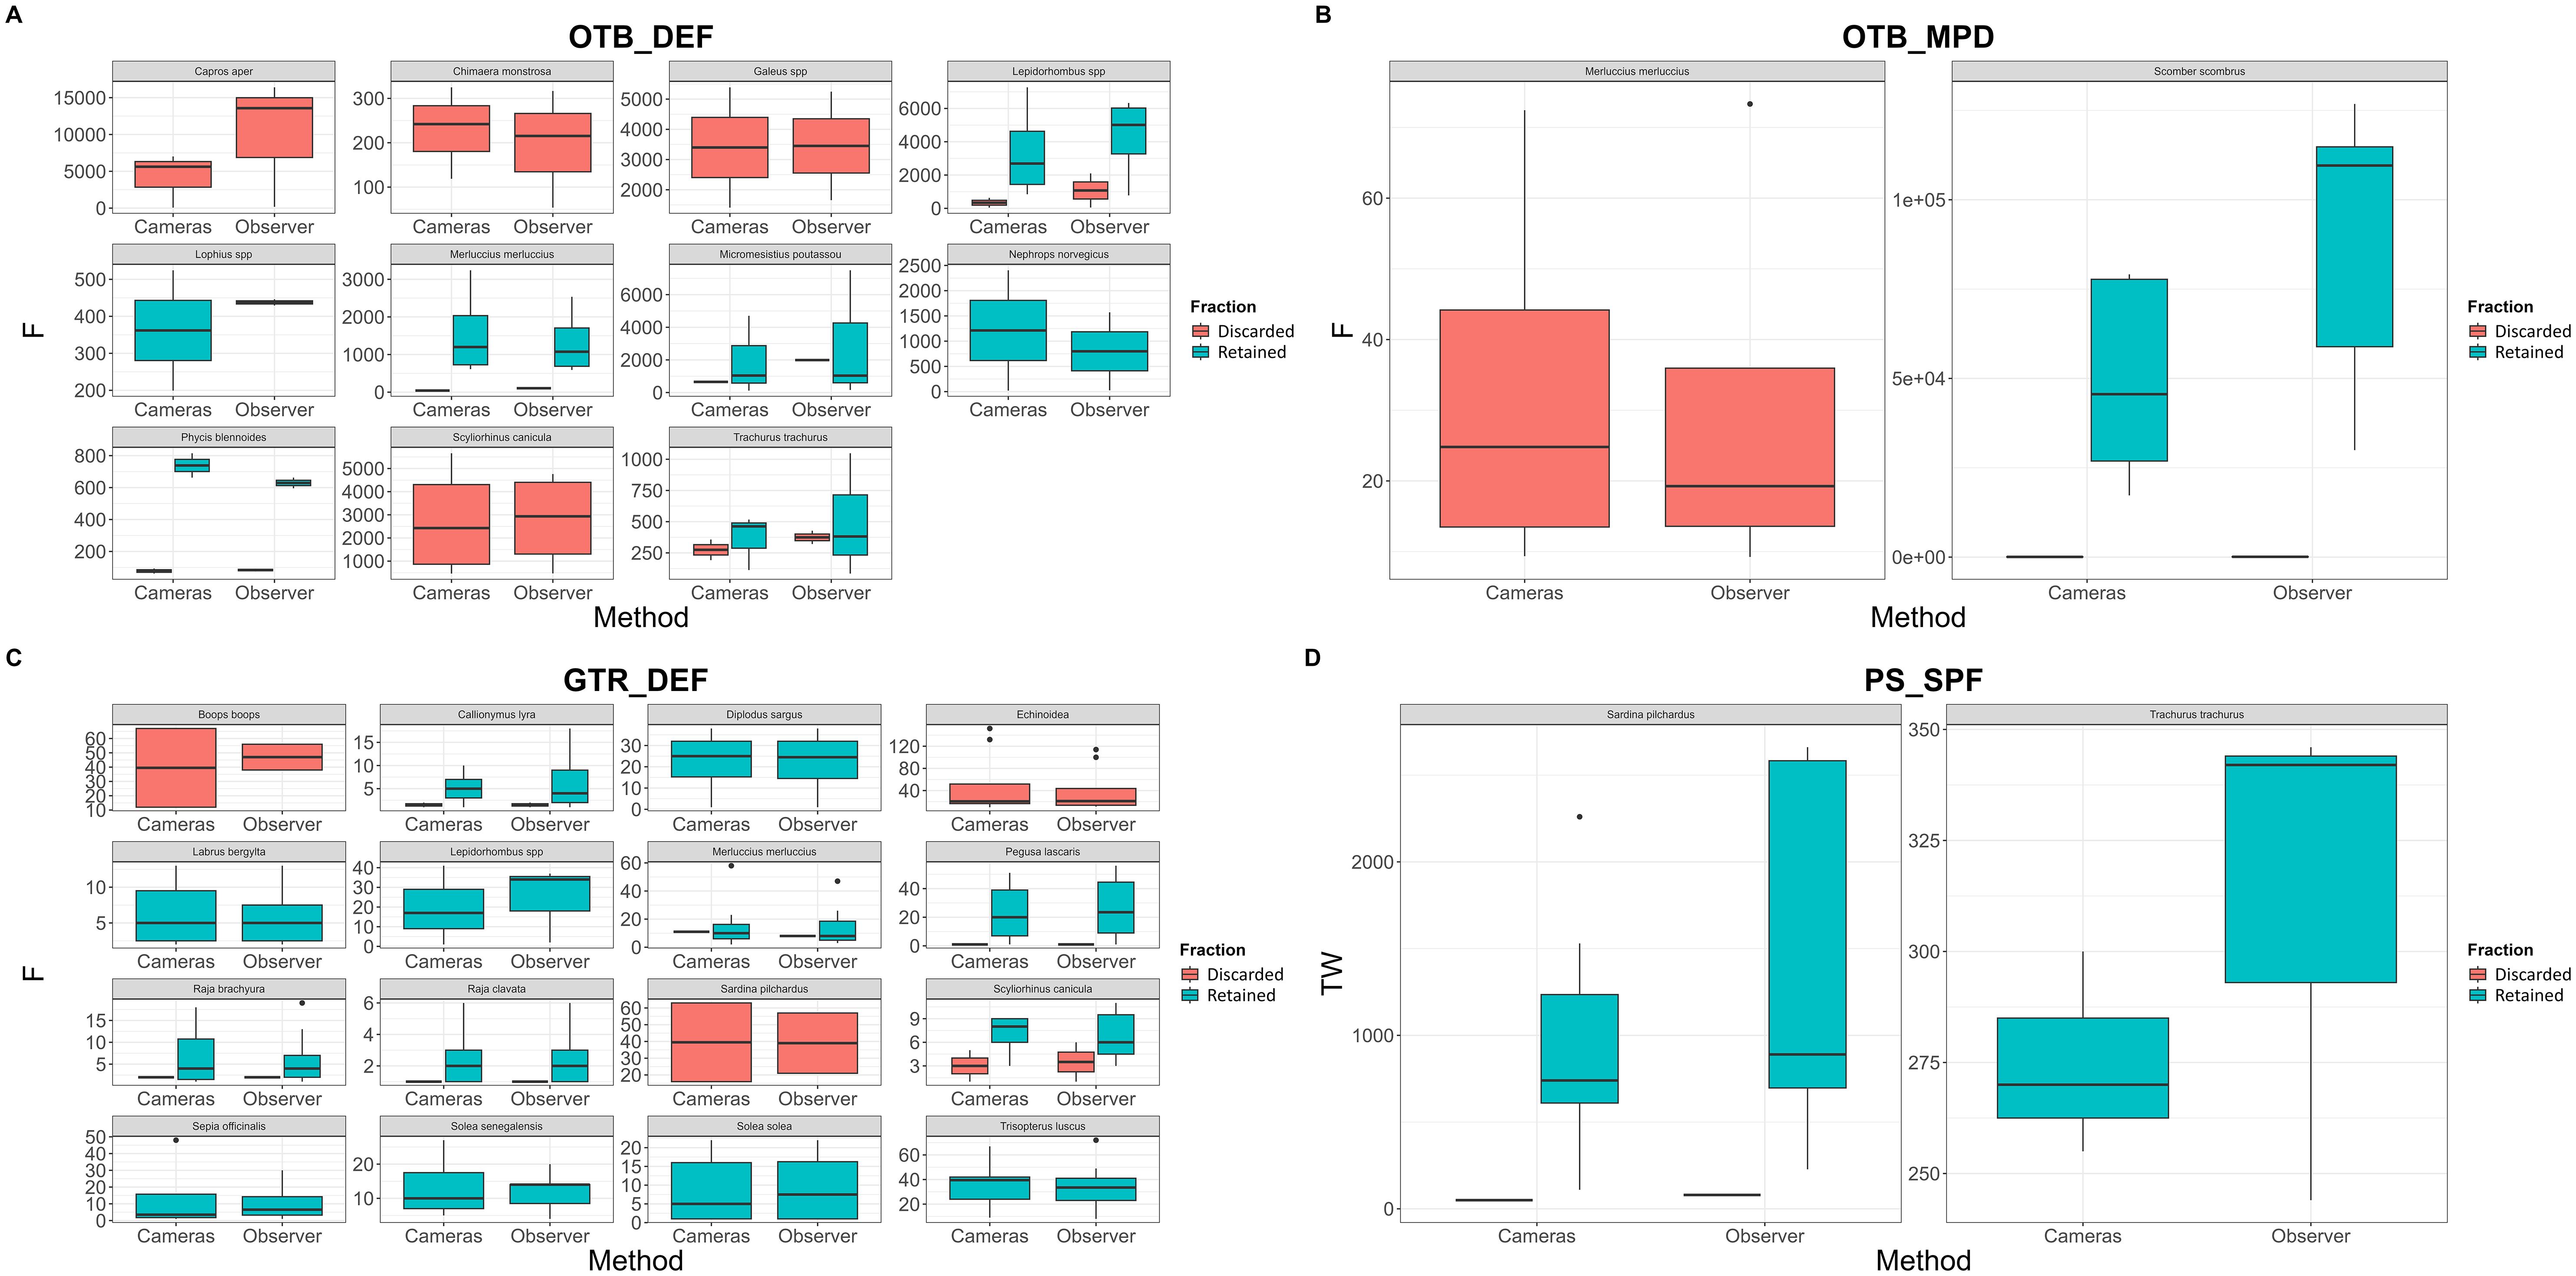
Figure 5. Comparison with boxplot of obtained catches between cameras and observers by catch fraction in OTB_DEF (A), in OTB_MPD (B), in GTR_DEF (C) and in PS_SPF (D) in the main species of each métier. The frequency (F) is given in number of individuals recorded with one method and total estimated weight (TW) is given in kilograms.
The analysis initially focused on the Level of Agreement in species (LAspp) by fishery and catch compartment (retained, discarded, and total catch), visually represented in Figure 6, to assess the efficacy of camera systems in species detection compared to observer records. In trawl fisheries, specifically the OTB_DEF fishery (Figure 6A), the average LAspp was consistently high across all capture fractions: 0.80 ± 0.16 for total catch, 0.82 ± 0.08 for retained catch, and 0.82 ± 0.08 for discarded catch. The mean of number of detected species showed comparable values between observers and camera systems: 59.00 ± 13.88 versus 46.75 ± 13.60 in total catch, 33.00 ± 7.07 versus 27.25 ± 7.93 in retained catch, and 47.00 ± 17.00 versus 38.00 ± 11.36 in discarded catch. For OTB_MPD (Figure 6B), the average LAspp was lower in some catch fractions, reflecting medium to high values across capture fractions: 0.69 ± 0.14 for total catch, 0.96 ± 0.10 for retained catch, and 0.64 ± 0.14 for discarded catch. The main species, mackerel, predominantly influenced high values in the retained catch fraction, whereas the lowest values were observed in the discarded fraction. The mean of number of detected species also varied between methods: 16.50 ± 12.77 versus 12.50 ± 11.80 in total catch, 6.33 ± 12.58 versus 5.00 ± 9.32 in retained catch, and 10.00 ± 4.58 versus 6.00 ± 2.00 in discarded catch, highlighting significant variability between hauls and trials. The high catch volumes in this fishery represent a limiting factor for obtaining better data quality on the discarded fraction, due to species overlap and the low number of discarded species present.
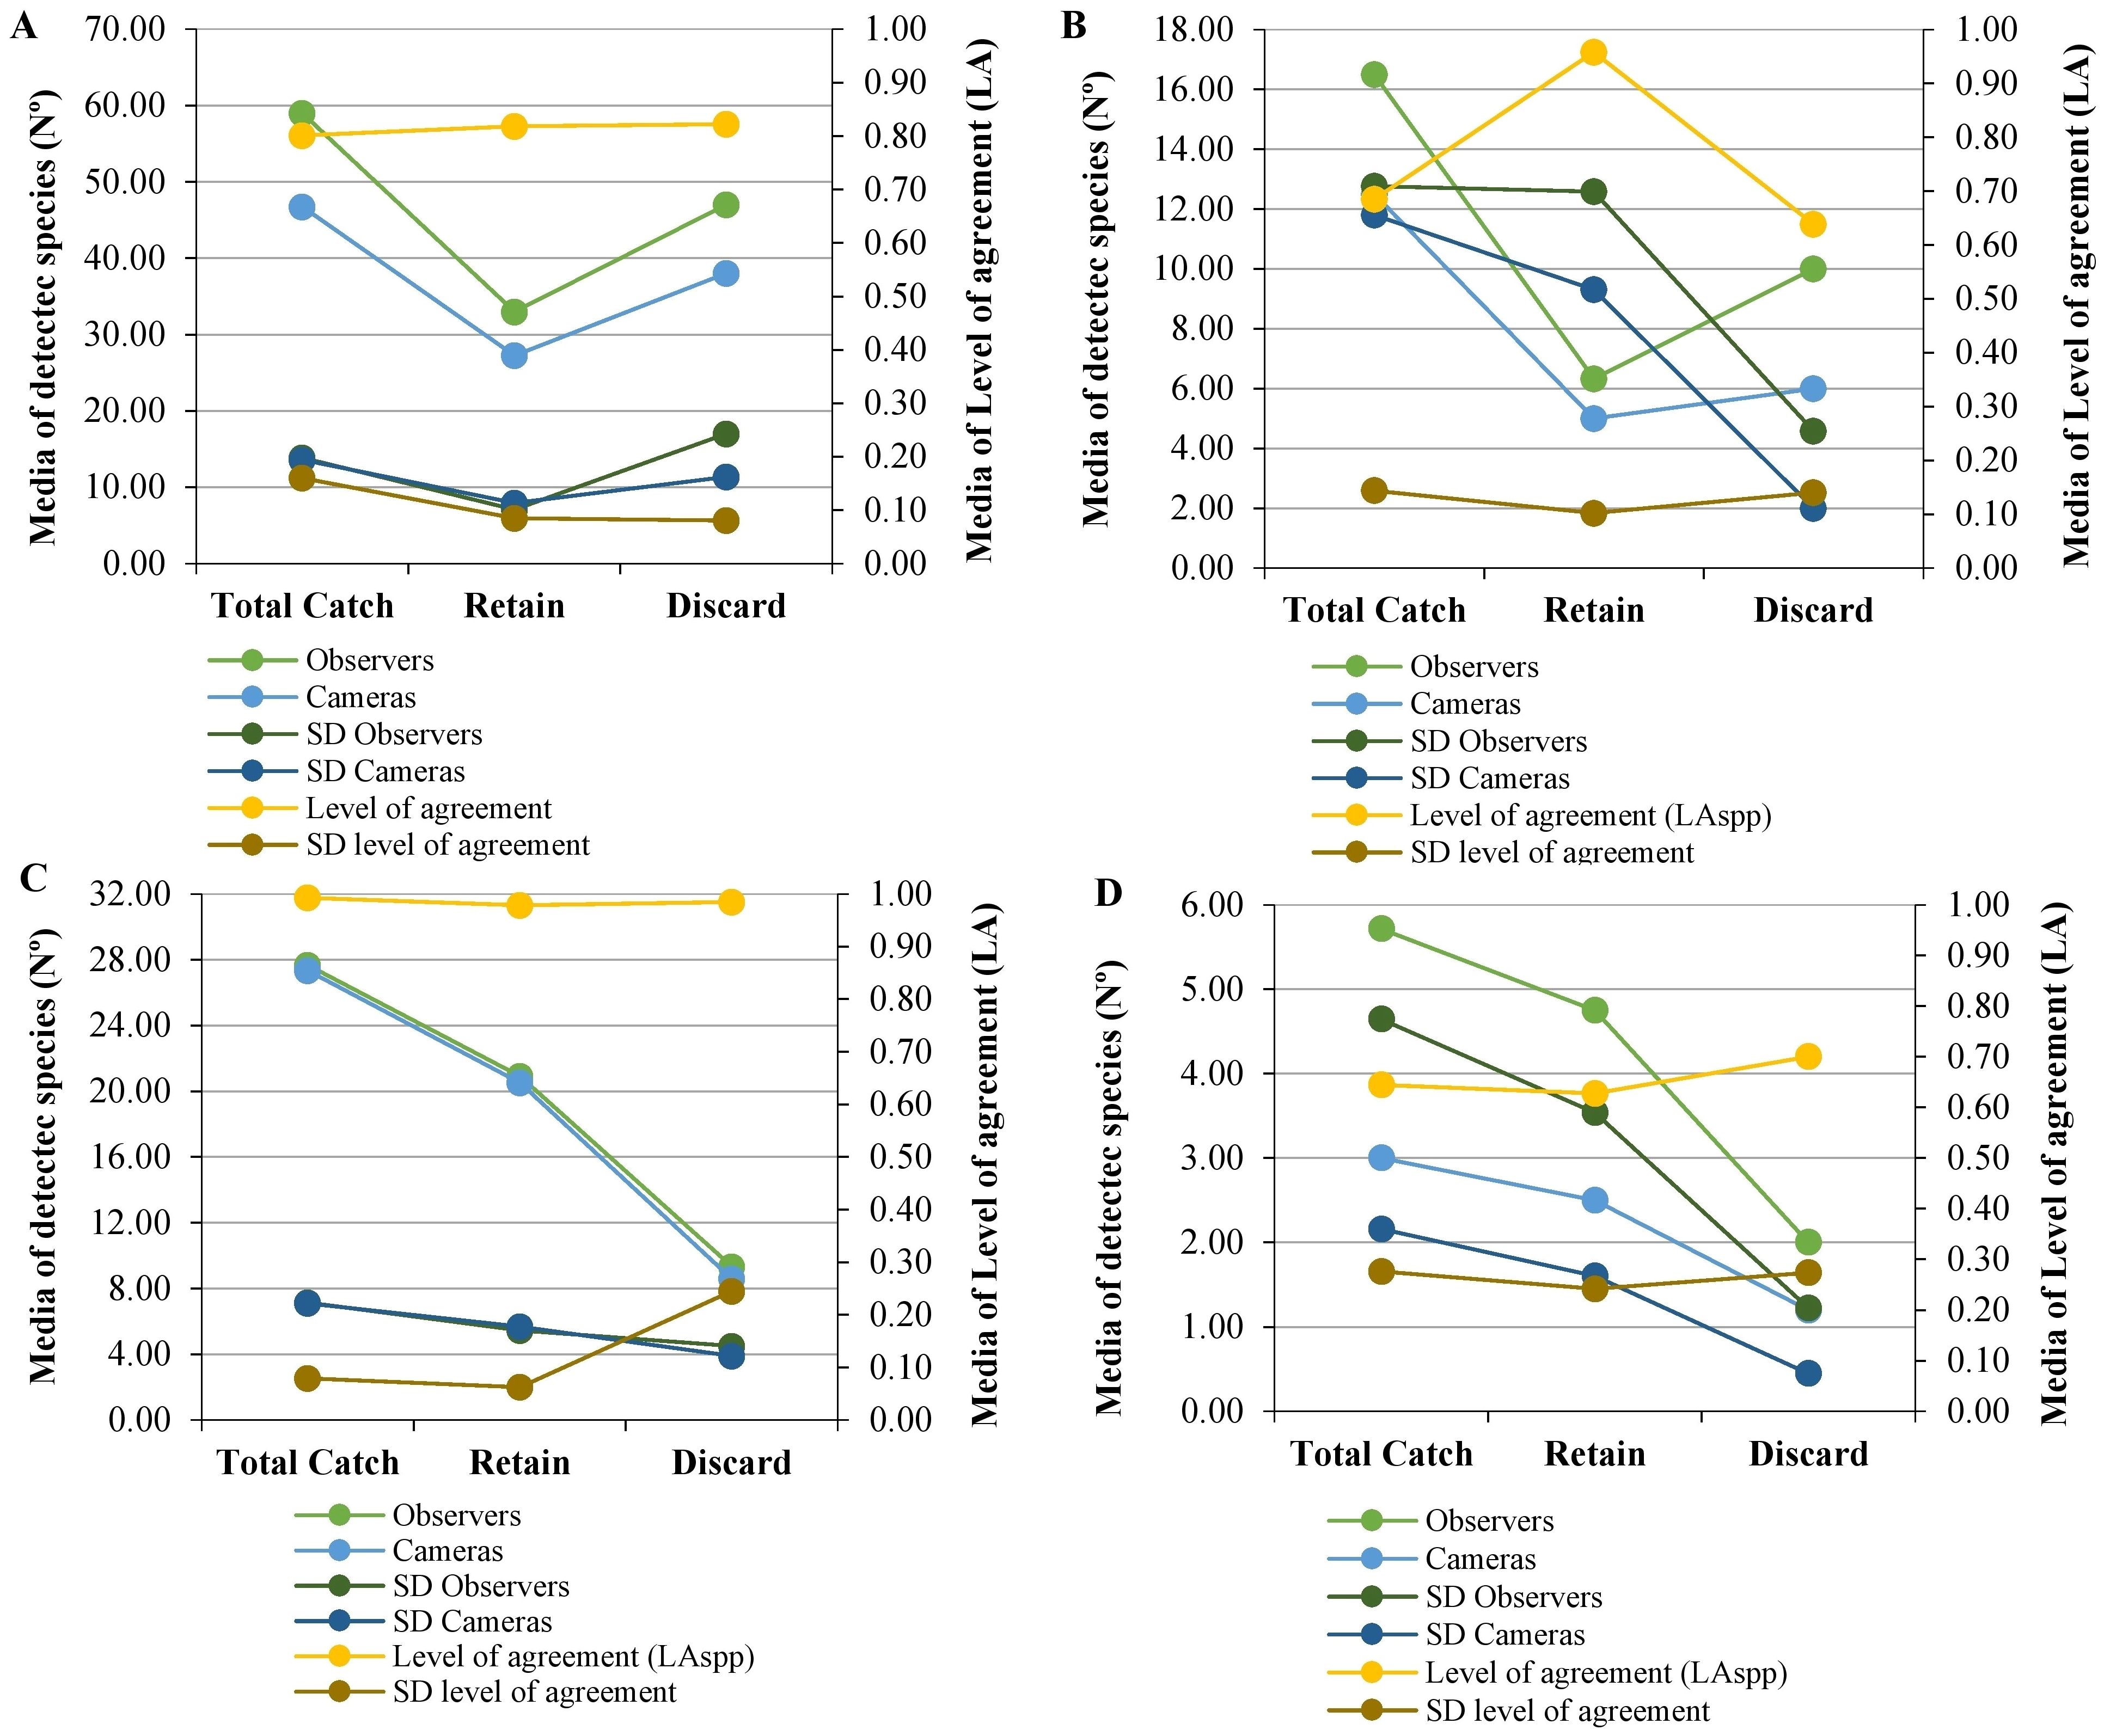
Figure 6. Number of detected species and level of agreement in species (LAspp) in métiers (A) OTB_DEF. (B) OTB_MPD. (C) GTR_DEF and (D) PS_SPF. In Y axis on the left are represented the media of number of detected species and in Y axis on the right are represented the media of LAspp. Finally, in X axis is represented each fraction of catch. Each value is represented with the standard deviation (SD).
In artisanal fisheries such as GTR_DEF (Figure 6C), exceptionally high average LAspp values indicated a near-perfect agreement between camera data and observer reports across all capture fractions: 0.99 ± 0.08 for total catch, 0.98 ± 0.06 for retained catch, and 0.99 ± 0.24 for discarded catch. Similarly, the mean of number of detected species closely mirrored observer records: 27.67 ± 7.14 versus 27.33 ± 7.09 in total catch, 20.92 ± 5.43 versus in retained catch, and 9.33 ± 4.50 versus 8.58 ± 3.90 in discarded catch, demonstrating high accuracy and reliability in this métier. Conversely, in the PS_SPF (Figure 6D), the average LAspp was the lowest among all studied fisheries, with medium values observed across all capture fractions: 0.64 ± 0.28 for total catch, 0.63 ± 0.24 for retained catch, and 0.70 ± 0.27 for discarded catch. Differences in the mean of number of detected species between observers and cameras were more pronounced and less accurate compared to previous fisheries: 5.71 ± 4.64 versus 3.00 ± 2.16 in total catch, 4.75 ± 3.54 versus 2.50 ± 1.60 in retained catch, and 2.00 ± 1.22 versus 1.20 ± 0.45 in discarded catch. In this fishery, the limiting factors have been light conditions, the type of fishing operation, and the number of cameras. These factors combined have resulted in poor species detection and reduced the effectiveness of video review for monitoring hauls.
The following parameters (F and TW) were used to validate the camera system in catches. To trawl fisheries (OTB_DEF and OTB_MPD) and GTR_DEF has been used the level of agreement in frequency (LAF). Whereas to PS_SPF has been used the level of agreement in weight (LATW). These ratios have been calculated in the main species which are representative in each fishery (Table 4).
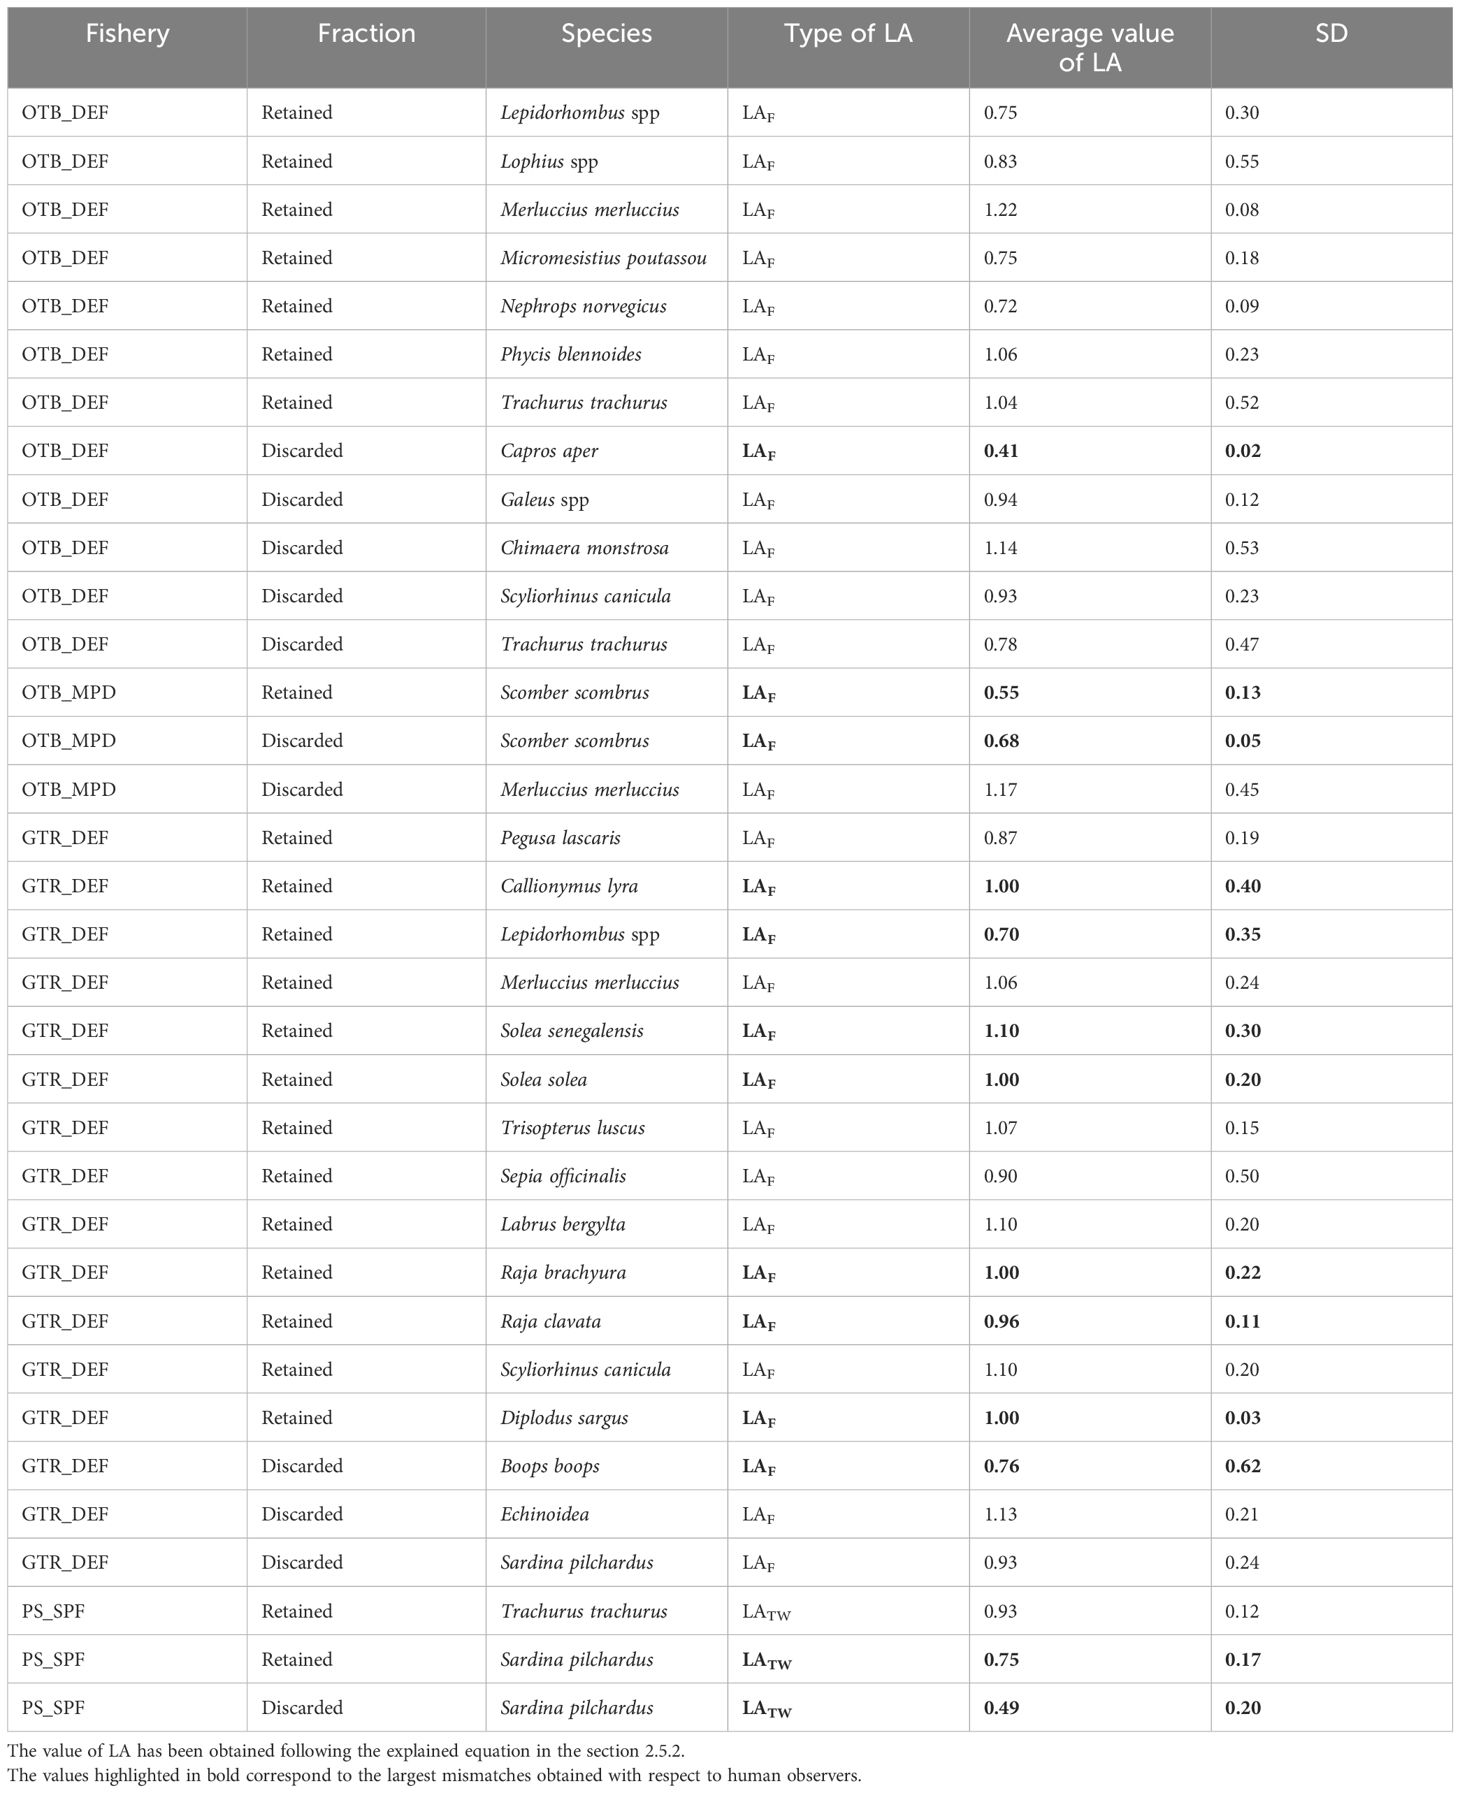
Table 4. Average level of agreement in frequency (LAF) and in total estimated biomass (LATW) in the main representative species in each fishery, in retained and discarded fraction of capture.
In trawl fisheries, starting with the OTB_DEF (Table 4), medium to high values of average LAF have been obtained for the main species of the fishery. In the retained fraction, all average values are above LAF=0.70, indicating that the camera system can detect almost three-quarters of individuals of these species with moderate data consistency, as indicated by the standard deviation (SD) values. However, accuracy decreases in the discarded fraction; for instance, the species Capros aper has an average LAF=0.41 ± 0.02 (less than half). In this species, the low quality of detection was due to the high volume of catch produces high levels of overlap between captured individuals. Other species exhibit high LAF values above 0.70, but with significant variability between hauls and trials, as reflected in the SD values. In the case of OTB_MPD (Table 4), only the target retained species, mackerel, has been evaluated, obtaining an average LAF=0.55 ± 0.13. This indicates that approximately half of the retained individuals are detected with cameras, despite the high volume of capture and overlap during manual handling of fishing. Similar values were obtained in the discarded fraction of mackerel, with an average LAF=0.68 ± 0.05 and low data heterogeneity. In both fraction of catches, the high volume is limiting factor to obtain better accuracy. However, European hake showed an average LAF=1.17 ± 0.45, indicating high detection rates but with considerable variability in the data, as indicated by SD. In artisanal fisheries, specifically in the GTR_DEF (Table 4), the highest average values of LAF were obtained, all above 0.90 for each of the main retained species, with complete agreement in some species such as Raja brachyura, Diplodus sargus, and Solea solea. In this métier, catches are collected individually or in small groups to facilitate electronic monitoring. However, some species showed high standard deviation (SD) values, indicating variability between hauls and trials, particularly in discarded species where LAF values were also high (above 0.70 for all), but with increased variability due to weather conditions affecting result accuracy. Finally, in the PS_SPF (Table 4), the main retained species were evaluated using LATW, with values above 0.70 for each species and horse mackerel reaching LATW=0.93 ± 0.12, with moderate data variability according to SD. It is noteworthy that only these species could be evaluated onboard, as operational limitations with the camera system restricted visibility of other species. In the discarded fraction, only Sardina pilchardus was evaluated, showing a low average LATW=0.49 ± 0.20. This indicates that in this fishery, overall camera accuracy in recording catches is low across all fractions. In this fishery the system of cameras has had a low accuracy due to the following factors: type of fishing operation, light conditions, volume of catches and the number of cameras. Addressing these factors is crucial to achieve better detection in this type of fishing gear.
The accuracy assessment of the camera system within each métier and between them was conducted using graphical and statistical analyses. A boxplot graphical representation was employed for the variables F (frequency of individuals), TNspp (total number of detected species), and TW (estimated weight in purse seine) comparing both methods (cameras vs observers) for each fishery and main species. Additionally, statistical tests were applied to compare data from observers and cameras (using the same variables) across fisheries, particularly in total catch, to determine if there were significant statistical differences between the methods.
Initially, the comparison between the camera system and observers was studied in terms of detected species (TNspp) in each fishery, segmented by catch fraction (Figure 7). In the case of OTB_DEF (Figure 7A), the boxplots indicate some differences in the median values of TNspp between the cameras and observer methods. The median values for detected species with the camera method were 27.50, 43.00, and 48.00 in retained, discarded, and total catch, respectively. In contrast, with the observer method, these median values were 34.00, 47.00, and 60.50 in retained, discarded, and total catch, respectively. These central tendencies correspond with LAspp values, with the largest difference in detected species between methods occurring in the total catch fraction, while a total match exists in retained catch and the difference is smaller in discarded catch. In OTB_MPD (Figure 7B), the boxplots show significant differences in the detected species of discarded and total catch fractions between the two studied methods. The median values with cameras were 1.00, 6.00, and 7.50 in retained, discarded, and total catch, respectively, while with observers, these values were 1.00, 11.00, and 12.50 in retained, discarded, and total catch, respectively. In the GTR_DEF métier (Figure 7C), the boxplots indicate almost no differences in species detection between the methods. The median values with cameras were 21.00, 7.50, and 28.00 in retained, discarded, and total catch, respectively, while with observers, these values were 22.00, 8.50, and 29.50 in retained, discarded, and total catch, respectively. These results align with LAspp values, suggesting more successful results with the camera system in this fishery. Lastly, in PS_SPF (Figure 7D), substantial deviations and imbalances were observed in species detection between the two studied methods. In this fishery, the median values with cameras were 2.00, 1.00, and 2.00 in retained, discarded, and total catch, respectively, whereas with observers, these values were 4.50, 1.50, and 4.00 in the same catch fractions. Thus, the accuracy in this fishery was the lowest among the four case studies, consistent with the LAspp values obtained.
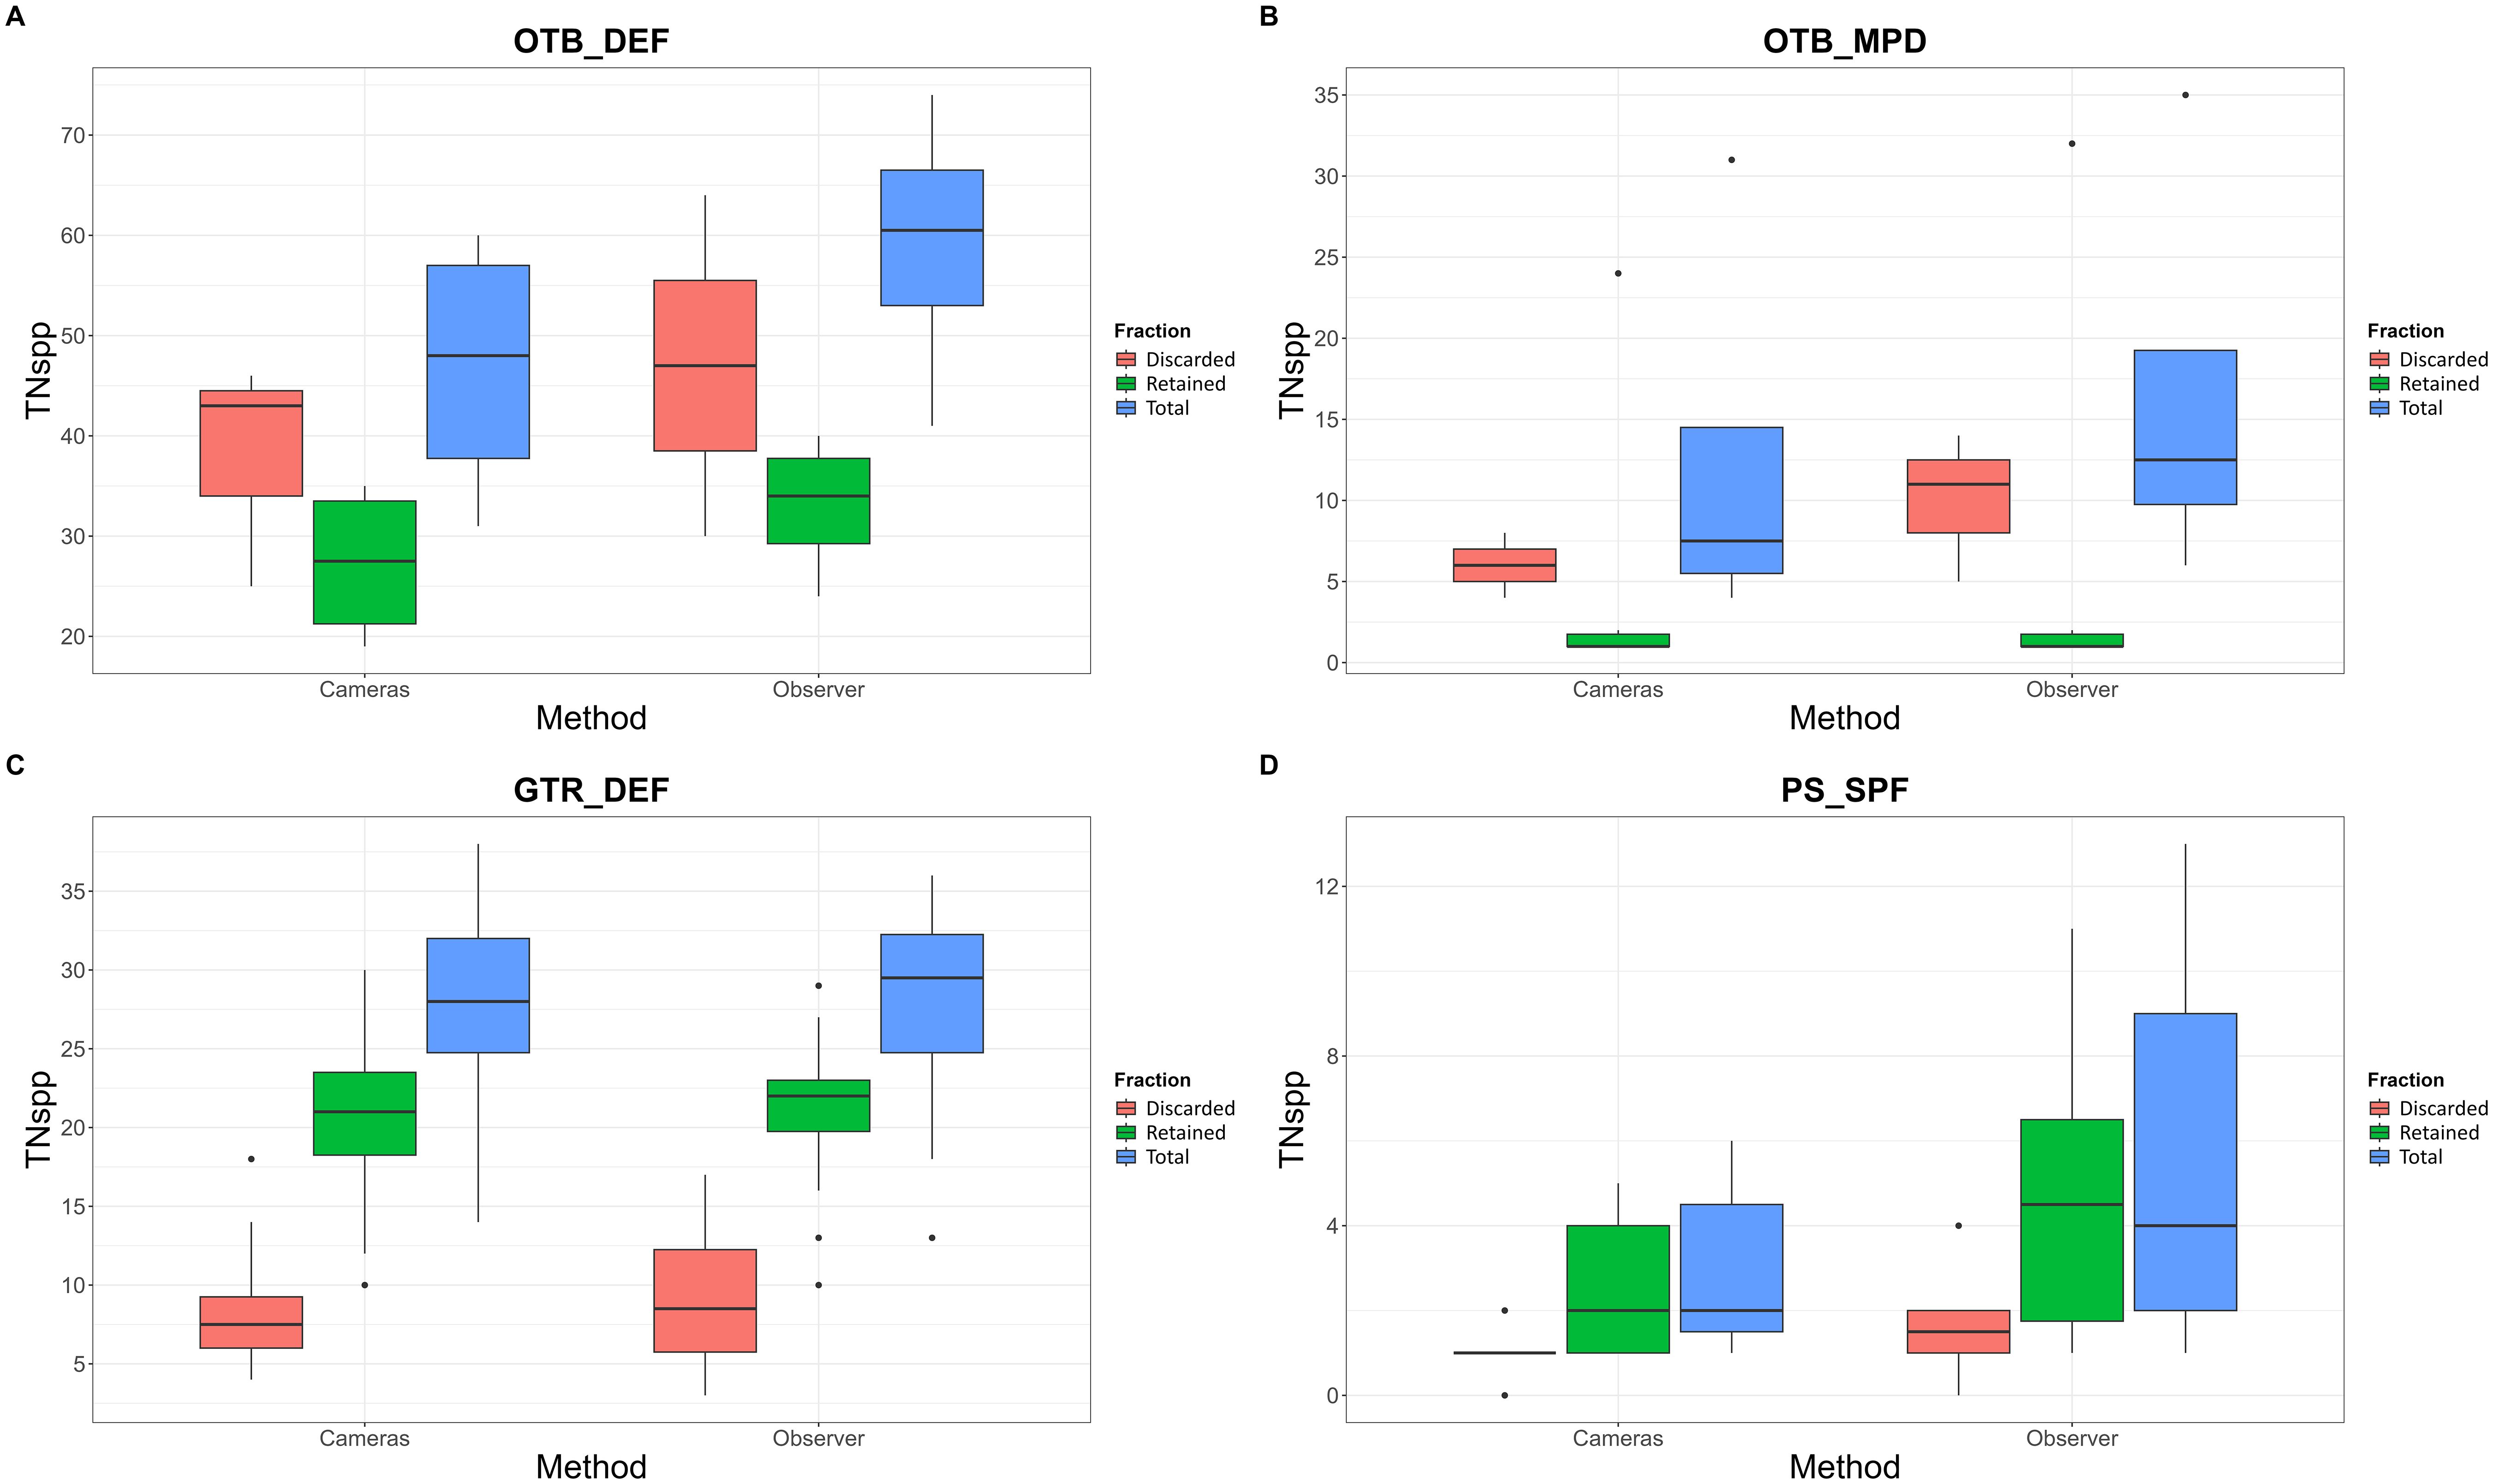
Figure 7. Comparison with boxplot of obtained species with camera systems and observers. In OTB_DEF (A), in OTB_MPD (B), in GTR_DEF (C) and in PS_SPF (D). The total number of detected species (TNspp) is given in number of recorded species with in each of method.
Next, differences in medians between the camera system and observers were analyzed using boxplots by catch fraction for the main species in frequency (number of detected individuals) in trawl fisheries and GTR_DEF, and in estimated weight (in kilograms) in PS_SPF (Figure 5). Each fishery’s main species were plotted separately to observe accuracy variations across capture fractions. In the first fishery (Figure 5A), a total of 11 species were studied, with 9 discarded and 7 retained. Significant median differences between cameras and observers were observed in discarded species such as Capros aper (5622.10 vs 13574.36), Lepidorhombus spp (337.20 vs 1074.30), Micromesistius poutassou (652.15 vs 1990.12), and Merluccius merluccius (41.92 vs 104.64), consistent with LAF values from the previous section. Variability in data distribution was notable, with considerable differences observed between trials. Conversely, species like Galeus spp (3399.64 vs 3451.71), Chimaera monstrosa (242.00 vs 215.30), Scyliorhinus canicula (2428.27 vs 2934.74), Phycis blennoides (76.80 vs 83.63), and Trachurus trachurus (274.50 vs 374.46) showed fewer discrepancies between cameras and observers. In the retained fraction, species with the closest median matches between cameras and observers included Lophius spp (361.85 vs 437.71), Merluccius merluccius (1199.63 vs 1074.69), Micromesistius poutassou (1041.40 vs 1035.31), and Trachurus trachurus (462.40 vs 381.38), aligning with LAF ratios. The largest discrepancies in medians between cameras and observers were observed in Lepidorhombus spp (2691.54 vs 5010.87), Nephrops norvegicus (1212.15 vs 798.91), and Phycis blennoides (738.61 vs 629.10), indicating greater differences than those observed with LAF. It’s important to note the wide variability in data. In the second fishery, OTB_MPD (Figure 5B), five species were assessed. Only Scomber scombrus was evaluated in the retained catch, as it is the main species caught. Significant discrepancies were noted for Scomber scombrus, with high differences between methodologies (45592.15 vs 109578.40) and wide data ranges, consistent with LAF values. In discarded species, notable discrepancies were observed in Scomber scombrus (56.72 vs 83.78), while Merluccius merluccius showed closer data (24.81 vs 19.26). These discrepancies reflect challenges due to overlap and high catch volumes, as indicated by LAF values in this métier.
For GTR_DEF (Figure 5C), a total of 16 commercial and non-commercial species were assessed. In retained species, there were many coincidences between the two methods used. The highest matches between cameras and human observers occurred in Diplodus sargus (25.00 vs 24.50), Labrus bergylta (5.00 vs 5.00), Raja clavata (2.00 vs 2.00), Raja brachyura (3.00 vs 4.00), Scyliorhinus canicula (8.00 vs 6.00), Callionymus lyra (5.00 vs 4.00), and Merluccius merluccius (10.00 vs 8.00), aligning with the LAF ratio, and in some cases, the matches were nearly perfect. However, there were slight overestimates or underestimates where discrepancies existed between humans and cameras. Some species showed greater discrepancies between the central values of both methods, but these were not excessively high: Lepidorhombus spp (17.00 vs 34.00), Pegusa lascaris (20.00 vs 22.00), Sepia officinalis (3.50 vs 6.50), Solea senegalensis (10.00 vs 14.00), Solea solea (5.00 vs 7.50), and Trisopterus luscus (39.50 vs 33.50). The range of data distribution was similar for both methodologies. In the discarded fraction, notable differences in medians were found in Boop boops (39.50 vs 47.00) with differing distribution ranges, followed by Merluccius merluccius (11.00 vs 8.00) and Echinoidea (20.50 vs 21.00), as observed in the LAF. For the rest of the species, the matches were high, with equal or nearly equal median values between the methods: Callionymus lyra (1.50 vs 1.50), Raja brachyura (2.00 vs 2.00), Sardina pilchardus (39.50 vs 39.00), and Scyliorhinus canicula (3.00 vs 3.50). In the last case study, PS_SPF (Figure 5D), a total of 2 species were evaluated. For retained species, there was generally low coincidence between the medians of cameras and observers, Sardina pilchardus (740.00 vs 890.00) and Trachurus trachurus (270.00 vs 342.00), similar to the LATW ratio results. The same pattern was observed in discarded species, with very high differences in the medians between cameras and observers: Sardina pilchardus (50.00 vs 80.00). Thus, it is clear that in this fishery, the detection of species and the estimation of biomass have low accuracy and high discrepancies between methods, primarily due to the work dynamics of the fishery itself.
To assess the statistical differences observed in boxplots for detected species (TNspp), frequency (F), and estimated weight (TW) in each fishery, statistical tests were applied to obtain p-values and evaluate evidence of significant differences. Non-parametric tests (Fligner, Levene, and Wilcoxon) were used. The Fligner and Levene tests were applied to confirm the criterion of homoscedasticity of variances. The criterion to interpret the p-values is as follows: the null hypothesis posits that the medians are equal, and the p-value is greater than 0.05, indicating that the differences are not statistically significant. The alternative hypothesis posits that the medians are different, and the p-value is less than 0.05, indicating that the differences are statistically significant. Therefore, when a test yields a p-value less than 0.05, the value is statistically significant, and the null hypothesis is rejected.
Table 5 summarizes the p-values obtained from these tests. Firstly, the differences in TNspp were evaluated and detected in the following cases: In OTB_DEF, only the global p-value (retained and discarded fraction) was significant, with a p-value of 0.0384, therefore in this case there are differences between both medians statistically, aligning with the LAspp value and the boxplot. In OTB_MPD, the total catch showed a significant statistically p-value of 0.01379, also consistent with previous results. In GTR_DEF, no p-values were significant statistically, matching the high LAspp values and the graphical representation. In PS_SPF, p-values were significant statistically in the total catch (p-value = 0.001003). Additionally, the p-value for Levene’s test was significant (0.04445). In the retained fraction, the Wilcoxon test yielded a p-value of 0.03552, indicating that the camera system had the least accuracy among the studied cases, since the detected a statistically significant imbalance.
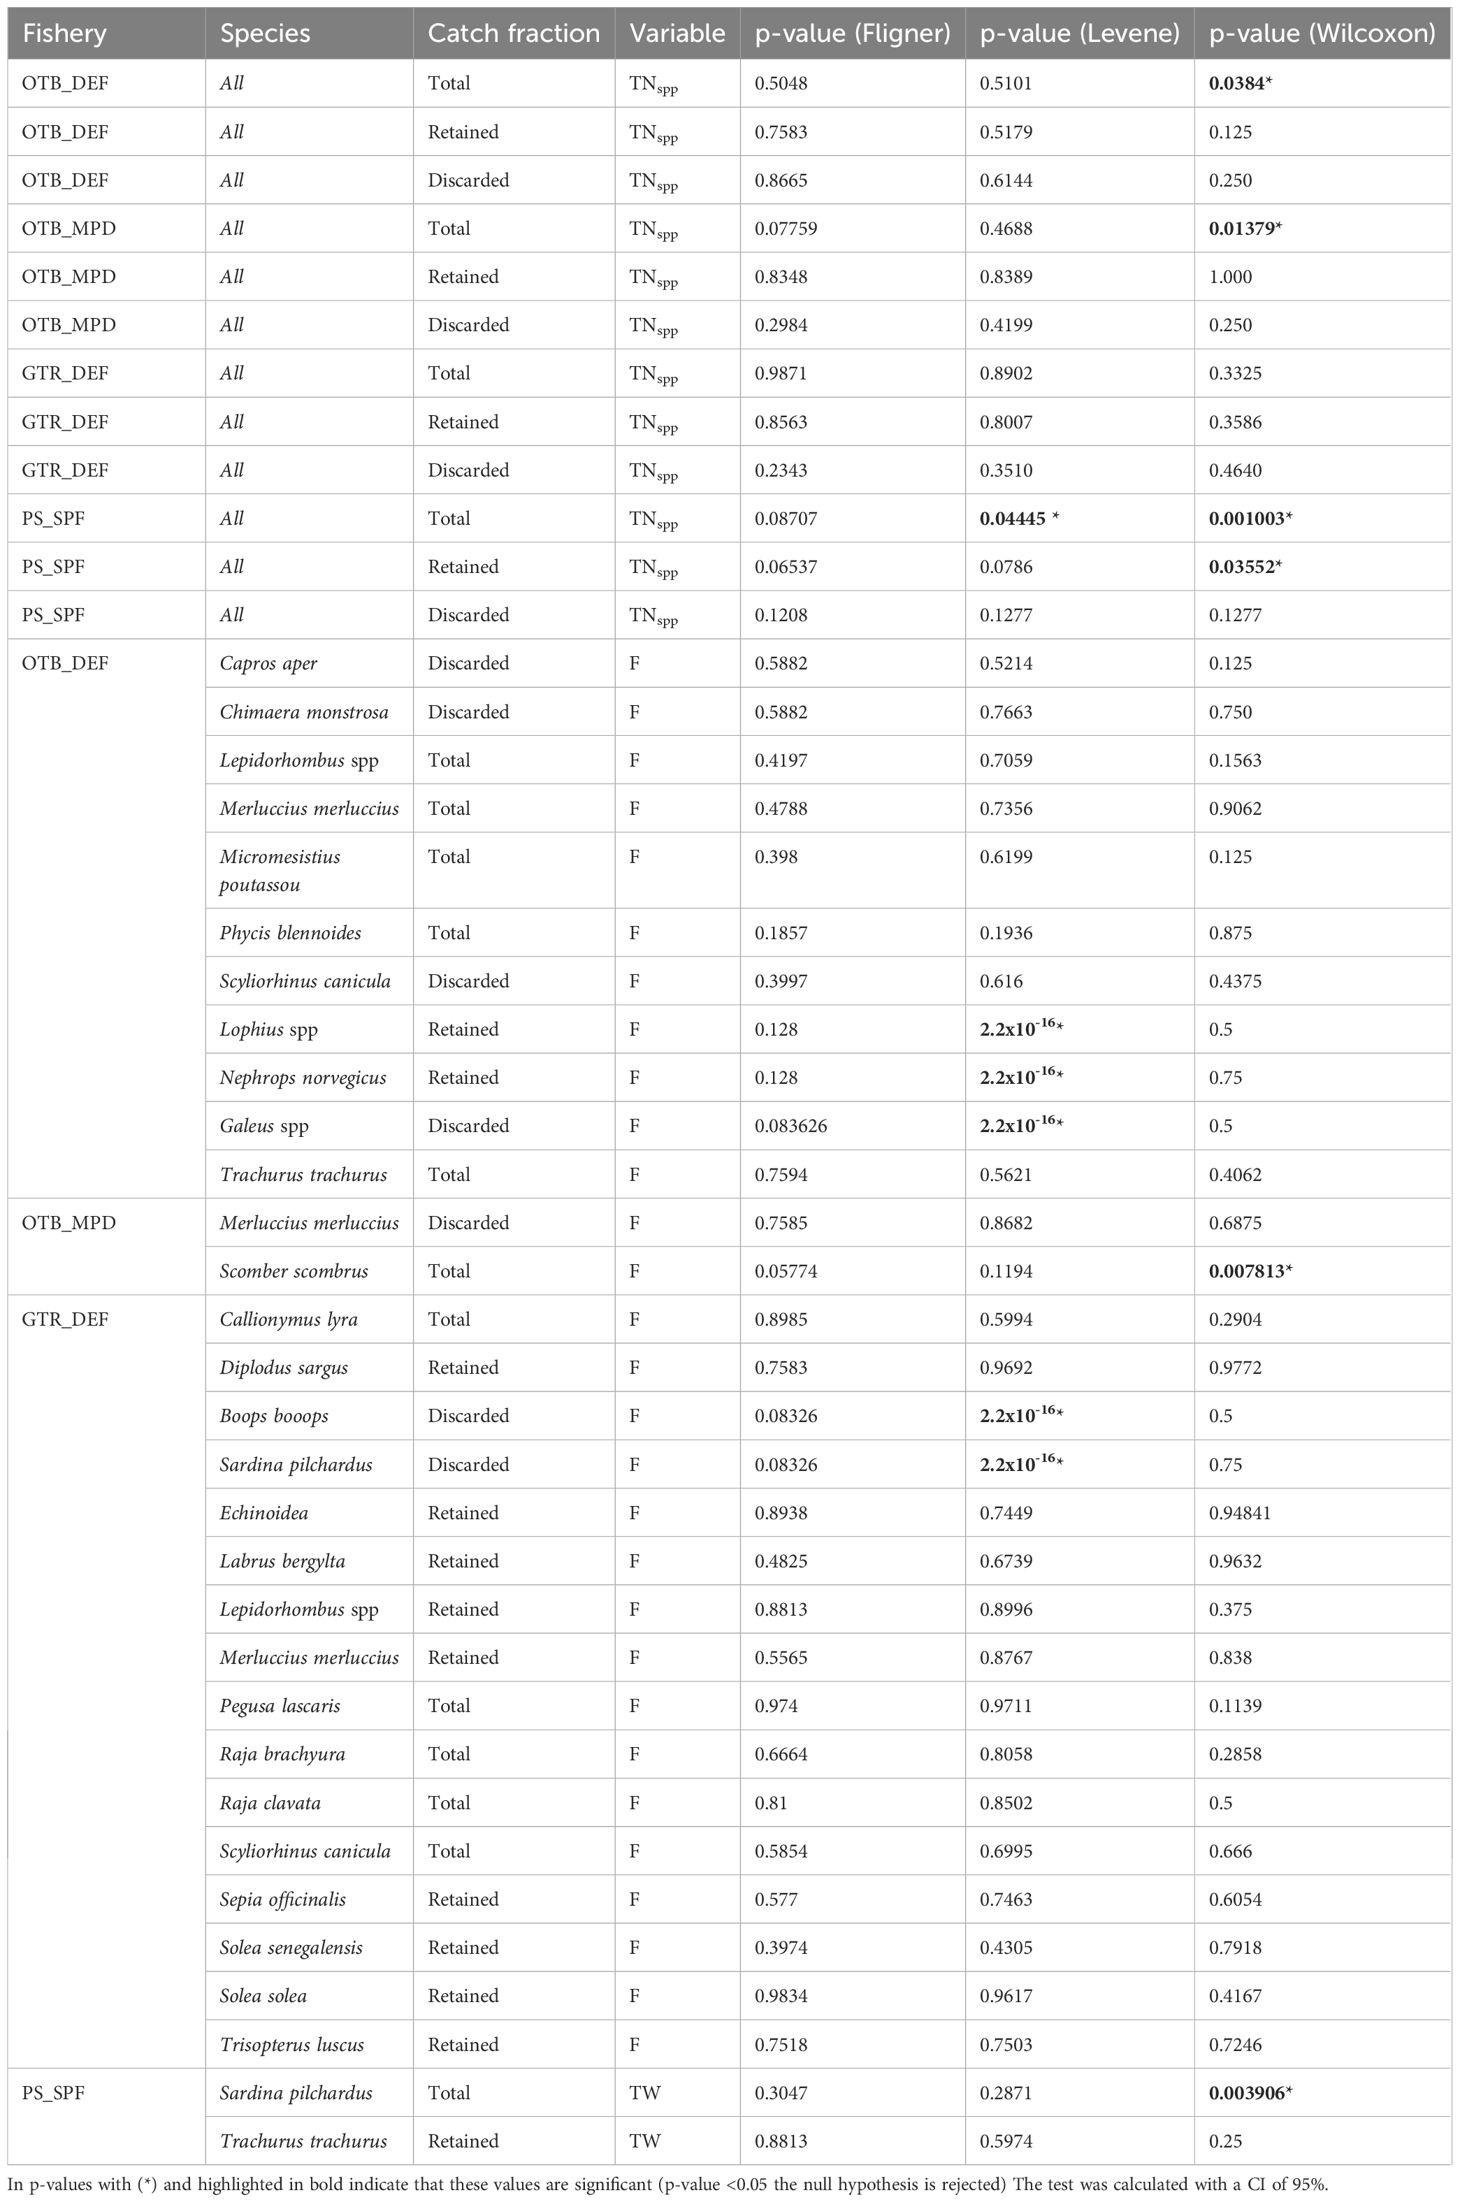
Table 5. Results of value of the statistic p-value of statistical test (Flinger, Levene and Wilcoxon) applicated to assess the statistical differences in detected species (TNspp), frequency (F) and estimated weight (TW), by catch fishery.
Returning to the captures (Table 5), in the first fishery (OTB_DEF), contrast tests were applied to a total of 11 species. All species met the criterion of homoscedasticity, except for Lophius spp, Nephrops norvegicus, and Galeus spp in Levene’s test (p-value = 2.2x10⁻¹⁶). However, in the Wilcoxon test, none of the species had p-values less than the significance value of 0.05, indicating no statistically significant differences were detected. This finding aligns with the LAF ratio for most species, although imbalances in Capros aper, Lophius spp, and Lepidorhombus spp were not detected by the test. Continuing with OTB_MPD, the Wilcoxon test detected statistically significant differences for Scomber scombrus (p-value = 0.007813), corroborating previous observations in the LAF ratio and graphical analyses. For this species and métier, the camera system has lower precision due to the high capture volume and the overlap between individuals, which avoid in better accuracy in the record of catches. Conversely, no significant differences were observed for Merluccius merluccius, consistent with previous sections. In the artisanal fisheries, specifically the GTR_DEF, no significant p-values were found using the Wilcoxon test, which supports the high precision values obtained in this métier, both in the LAF ratio and graphical analyses. However, Levene’s test indicated statistically significant p-values (2.2x10⁻¹⁶) for Boops boops and Sardina pilchardus. It was expected that Lepidorhombus spp would also show significant p-values. Finally, in the PS_SPF, a statistically significant indicated p-value of 0.003906 was obtained, confirming that Sardina pilchardus differs in estimated biomass values between the cameras and the observer. This finding aligns with previous observations and highlights the low precision of the camera system in this fishery due to the dynamics of the fishery, and the environmental conditions.
Electronic monitoring (EM) has emerged as a robust tool for enhancing the quantity of data available to assess marine ecosystems and understand the impact of environmental conditions on fisheries and stock statuses. In this study, we present a series of trials conducted in four fisheries of Spanish fishing grounds using EM. Furthermore, we assessed the accuracy of our camera systems primarily for these purposes: collecting information on catches and test the possibility to detect bycatch, and to evaluate the suitability of the data obtained of catches for scientific purposes. Our findings indicated that a simple camera system could be sufficiently to characterize the monitored fisheries, achieving comparable levels of detail to other studies in similar types of fisheries (Van Helmond et al., 2015; Bartholomew et al., 2018; Glemarec et al., 2020). Across all fisheries studied, the camera system has had a variable effectiveness in profiling catches, enabling the characterization of fisheries through video review, individual catch counts, and weight estimates but, with varying accuracy and efficiency, as observed in previous EM studies of other fisheries (Van Helmond et al., 2017), especially in artisanal purse seine fisheries. In demersal fisheries using bottom trawl and trammel nets, the accuracy was higher. However, for purse seine and bottom trawl fisheries targeting Scomber scombrus, the accuracy was lower. This indicates that the camera system presented in this study was more effective for certain fisheries, while adjustments to the system and working protocol may be necessary for others.
In demersal trawl fisheries (OTB_DEF and OTB_MPD) and trammel net fisheries (GTR_DEF), the camera system accurately depicted the species composition of retained and discarded catches, showing results comparable to those observed by human observers (Moncrief-Cox et al., 2020; Briand et al., 2023). This capability allows for identifying target species without the need for human observers, thereby enhancing cost-efficiency in data collection in the obtaining of more data to assess each fishery (Needle et al., 2015; Plet-Hansen et al., 2019). Additionally, our study revealed that the use of cameras can improve understanding of marine biodiversity and the ecological impacts of fishing activities on exploited stock habitats (Bicknell et al., 2016; McCarthy et al., 2023). Collaboration with the commercial fishing sector enables the fleet to serve as a significant source of biodiversity information, facilitating scientific monitoring of its environmental impact on marine ecosystems. However, in the case of artisanal purse seine fisheries targeting small pelagic species (PS_SPF), our results indicated a several bias in species composition compared to data from human observers. Despite this, the camera system effectively collected catch information, including estimated weights per brailer on a limited basis. Nevertheless, due to operational complexities (such as inability to count individuals), weather conditions, and low-light situations during nocturnal hauls, an alternative EM system tailored to monitor such artisanal fisheries is necessary in this fishery.
In addition to catch information, our camera system has also proven suitable for recording bycatch events in three of the fisheries studied, where this type of unwanted catch: OTB_DEF, OTB_MPD, GTR_DEFand PS_SPF. The system proved valuable in documenting these events and identifying fisheries with higher bycatch rates, consistent with findings from prior studies (Glemarec et al., 2020; Moncrief-Cox et al., 2020; Kindt-Larsen et al., 2023). By collecting bycatch information, we contribute to better management and conservation efforts for marine mammals, seabirds, and Protected, Endangered, and Threatened (PET) species. EM and camera systems facilitate increased sea voyage observations, enhancing data collection across monitored hauls (Puente et al., 2023). In our study, the camera system recorded bycatch events such as Morus bassanus in 10 hauls and Globicephala melas in 1 haul in OTB_MPD, Mola mola in 1 haul in OTB_DEF, and Larus michahellis in 11 hauls in PS_SPF. Moreover, with appropriate recording protocols, the system can capture interactions between marine mammals and vessels, or species behaviors in response to fishing activities, as observed by Lara-Lopez et al. (2012). Furthermore, during onboard surveys, observers were able to collect bycatch records directly, but the retrieval of the trawl net can finish once the observer had to go to the processing deck to sample the fish catches. In that case, the human observer cannot observe if any bycatch is returned to the sea without reaching the processing deck (namely large catches as cetaceans, pelagic sharks, tuna or other large fish). Furthermore, a we not presented a comparison in this type of catch, since we have not obtained an enough number of observations to make a congruent statistical analyze. However, further studies are needed to analyze its accuracy compared to human observers in order to evaluate the system’s efficiency for this purpose.
Regarding catches, our study aimed to evaluate the accuracy of the camera system compared to traditional human observer methods. We found a high correlation between camera and observer records for demersal trawl fisheries. However, certain species, particularly those discarded in mixed fisheries, posed challenges in identification, reducing accuracy and introducing bias, as reported in previous studies (Ames, 2005; Ames et al., 2007). In OTB_MPD, the high volume of mackerel catches resulted in discrepancies with observer reports, attributed to overlapping specimens during handling, complicating accurate recording. Conversely, in artisanal trammel net fisheries (GTR_DEF), despite being demersal, the system demonstrated high accuracy in species identification due to lower catch volumes, achieving minimal bias compared to human observers. This finding aligns with observations by Bartholomew et al. (2018), who also reported high accuracy in species identification and catch recording compared to observer reports. However, the camera system exhibited lower accuracy in purse seine fisheries (PS_SPF), characterized by nocturnal operations and complex fishing dynamics, presenting challenges in achieving high correlations with human observers, similar to studies in tropical tuna purse seine fisheries (Ruiz et al., 2013, 2015; Legorburu et al., 2018).
The highest accuracy in catch monitoring was achieved in trammel net fisheries, showing strong correlation between camera systems and human observer reports for both retained and discarded fractions, as well as species identification. Similar success was noted by Glemarec et al. (2020) in recording bycatch in gillnet fisheries, indicating electronic monitoring (EM) holds promise for this fleet type, which is prevalent in Spain (Valeiras et al., 2014). Conversely, trawl bottom studies revealed more discrepancies between camera recordings and observer reports. In OTB_DEF, the extensive variety of species in both retained and discarded fractions complicates video review, thus hindering accuracy. Improvements could involve testing new recording methods, increasing camera numbers, or employing machine learning tools as explored by Van Essen et al. (2021) and Ovalle et al. (2022), who automated capture recording in demersal fisheries, addressing challenges such as specimen overlap and species confusion. Similarly, OTB_MPD encountered challenges due to the high volume of mackerel catches, leading to difficulty in achieving high accuracy with observer reports.
The overlap of specimens on sorting belts further complicates accurate recording, necessitating control over fish flow or improved separation techniques (Ovalle et al., 2022). PS_SPF faced similar issues due to the specific fishing operations, requiring the design of alternative EM methods tailored to the fishing type for reliable data on brailing operations, as suggested by Briand et al. (2022) in tropical tuna purse seine fisheries and earlier estimations of retained and discarded catches (Briand et al., 2017). Across all studied métiers, the implementation of EM poses numerous challenges that must be addressed in camera placement and system design. Unpredictable factors such as weather and lighting conditions (dependent on time of day) and changes in work dynamics remain significant challenges, necessitating ongoing evaluation and identification of anomalies to inform future EM system designs (Acharya et al., 2024). In other fisheries across the world, similar challenges are mentioned by Van Helmond et al. (2020), along with: the data stored, the privacy on board, necessity to training personnel to identify species and fishing events, clean and maintenance of systems, costly initial investment are common in all fisheries. Moreover, the diversity of vessels, fishing gears, fisheries change several between countries along to the fishery policy in each region. In this study, the tested EM system was addressed to use in small-scale fisheries and artisanal fisheries. To transfer this system to bigger fisheries, need changes as, number of cameras, data stored capacity and the record frames.
To improve the system, in fisheries with low accuracy as PS_SPF, we propose adding additional cameras (at least two) to record the deck area where catches are handled, providing a wider video frame. Regarding light conditions, it is necessary to install additional light bulbs on board, beyond those already present on the vessel. Furthermore, implementing a standardized protocol for fishing operations could help improve accuracy, but this would require the collaboration of the fishing vessel crew. For example, ensuring that all handling activities are conducted within field of view of the cameras. In the same line, this protocol is necessary when high volumes of catches, as noted in the fishery OTB_MPD. In these situations, the vessel crew, could separate catches better to avoid lose individuals in the records and improve the accuracy (Van Helmond et al., 2017). Moreover, the use of artificial intelligence tools is the next step to enhance the performance of EM systems, as well as facilitate video review and streamline data collection through automatic species identification (Ovalle et al., 2022; Van Essen et al., 2021). These systems have the potential to be used in different stages of fishing operations: inside the fishing net to track the quantity of fish entering during the fishing process, as tested by Garcia et al. (2020). Fishing markets represent another potential application for EM systems to gather more data on landings and track catches (Garcia-d’Urso et al., 2022). Thus, the potential of artificial intelligence and machine learning techniques lies in their ability to improve electronic monitoring.
Another point to highlight, is the size of the cameras and the number of cameras on board. Both characteristics have to adapted to each fishery and type of boat, since, the type of fishery and the boat change between artisanal or small-scale fishery and for example fisheries in international waters. In addition, this size of camera could be to improve the quality of the obtained videos and images (Van Helmond et al., 2015). Moreover, the level of protection for the cameras varies depending on whether they are positioned outside or inside to record fishing operations and catch processing. This also strongly depends on the specific fishery being studied (Van Helmond et al., 2020).
A more technical aspect to consider is the cost-efficiency of camera systems compared to human observers. EM systems require a substantial initial economic investment to install the system on board, including hardware, software, and the purchase of hard drives, among other components, as noted by Needle et al. (2015). Once the EM system is installed, the main expenses include system maintenance, software licenses, data transmission, data storage, and video review (Plet-Hansen et al., 2019). Video review, in particular, can be costly because technical reviewers need prior experience in fisheries and specialized training before analyzing any footage (Chavance et al., 2013). However, there is significant potential to improve cost-efficiency in this area through the application of machine learning and artificial intelligence, which can assist in video review and reduce costs (French et al., 2015). Similarly, human observers involve additional expenses, such as medical insurance, transportation, and training. Although the cost of camera systems may be high, their ability to increase the coverage of fleet sampling enhances efficiency. This makes EM systems the most comprehensive alternative to relying solely on human observers (James et al., 2018). Despite these challenges, electronic monitoring and camera systems represent robust tools for enhancing understanding of marine ecosystems, assessing fishing impacts, and expanding monitoring coverage across fishing fleets. Our study demonstrates the potential application of EM systems in various fisheries to record catches, bycatch, and fishing operations, providing valuable scientific monitoring data in the absence of human observers. Nevertheless, ongoing evaluation and refinement are necessary to address current challenges and optimize EM system designs for future deployments and broader fisheries applications.
The original contributions presented in the study are included in the article. Further inquiries can be directed to the corresponding author.
Ethical approval was not required for this study. The ethics committee’s requirements do not apply, as the study was conducted on fishing vessels, where the fish were already dead at the time of observation and manipulation. The catch, including fish and other organisms, was handled by the vessel's crew under normal commercial fishing conditions.
MB: Conceptualization, Data curation, Formal analysis, Methodology, Writing – original draft. EA: Writing – review & editing. LA: Conceptualization, Funding acquisition, Investigation, Methodology, Project administration, Supervision, Writing – review & editing. JCF: Writing – review & editing, Data curation, Methodology. CP: Data curation, Methodology, Writing – review & editing. JO: Writing – review & editing. RP: Writing – review & editing. JV: Conceptualization, Funding acquisition, Investigation, Methodology, Project administration, Supervision, Writing – review & editing.
The author(s) declare that financial support was received for the research, authorship, and/or publication of this article. This scientific article has been carried out within the framework of the MAP2021-03 project ‘New intelligent electronic observation technologies for more sustainable fisheries management’ (TIPES Project) funded by the Ministry of Fisheries (General Secretariat of Fisheries) through funds from the NextGenerationEU is the Recovery and Resilience Facility (RRF). Part of the technology and scientific staff has been funded by the DESCARSEL project (co-funded by the European Union through the European Maritime Fisheries and Aquaculture Fund (EMFAF).
Our thanks to the owners and crew of the commercial vessels that have collaborated in the experimental campaigns of the project. Thanks to M. Pilar Vara del Río and Héctor Villa (General Secretary of Fisheries-MAPA of Spain) and Pablo Abaunza (Head of Fisheries Area of the Spanish Institute of Oceanography) for their involvement in the development of the project as well as to all the people who have participated in the realization of this publication.
The authors declare that the research was conducted in the absence of any commercial or financial relationships that could be construed as a potential conflict of interest.
The author(s) declare that no Generative AI was used in the creation of this manuscript.
All claims expressed in this article are solely those of the authors and do not necessarily represent those of their affiliated organizations, or those of the publisher, the editors and the reviewers. Any product that may be evaluated in this article, or claim that may be made by its manufacturer, is not guaranteed or endorsed by the publisher.
Acharya D., Farazi M., Rolland V., Petersson L., Rosebrock U., Smith D., et al. (2024). Towards automatic anomaly detection in fisheries using electronic monitoring and automatic identification system. Fish Res. 272, 106939. doi: 10.1016/j.fishres.2024.106939
Ames R. T. (2005). International pacific halibut commission established by a convention between Canada and the United States of America the efficacy of electronic monitoring systems: a case study on the applicability of video technology for longline fisheries management Seattle, Washington 2005 (Seattle: International Pacific Halibut Commission). Available at: https://www.iphc.int/2021/10/31/iphc-2005-sr080-the-efficacy-of-electronic-monitoring-systems-a-case-study-on-the-applicability-of-video-technology-for-longline-fisheries-management/ (Accessed April 30, 2024).
Ames R. T., Leaman B. M., Ames K. L. (2007). Evaluation of video technology for monitoring of multispecies longline catches. N Am. J. Fish Manag 27, 955–964. doi: 10.1577/m06-029.1
Antelo L. T., Bellido J. M., Valeiras J., Pérez-Martín R. I. (2020). Innovative marine technologies applied to discard mitigation and management: The MARTEC18 conference. Mar. Policy. 267, 103911. doi: 10.1016/j.marpol.2020.103911
Bartholomew D. C., Mangel J. C., Alfaro-Shigueto J., Pingo S., Jimenez A., Godley B. J. (2018). Remote electronic monitoring as a potential alternative to on-board observers in small-scale fisheries. Biol. Conserv. 219, 35–45. doi: 10.1016/j.biocon.2018.01.003
Bergsson H., Plet-Hansen K., Jensen P. (2017). Final Report on Development and usage of REM systems along with electronic data transfer as a measure to monitor compliance with the Landing Obligation DiscardLess-strategies for the gradual elimination of discards in European fisheries View project Hologenomics in conservation View project. (Denmark: Ministry of Food, Agriculture and Fisheries). doi: 10.13140/RG.2.2.23628.00645
Bicknell A. W. J., Godley B. J., Sheehan E. V., Votier S. C., Witt M. J. (2016). Camera technology for monitoring marine biodiversity and human impact. Front. Ecol. Environ. 14, 424–432. doi: 10.1002/fee.1322
Briand K., Bonnieux A., Le Dantec W., Le Couls S., Bach P., Maufroy A., et al. (2017). Comparing electronic monitoring system with observer data for estimating non-target species and discards on French tropical tuna purse seine vessels. Available online at: https://www.iccat.int/Documents/CVSP/CV074_2017/n_7/CV074073813.pdf (Accessed March 1, 2024).
Briand K., Sabarros P. S., Maufroy A., Vernet A. L., Yon A., Bonnieux A., et al. (2023). An application of Electronic Monitoring System to optimize onboard observation protocols for estimating tropical tuna purse seine discards. Reg. Stud. Mar. Sci. 68, 103267. doi: 10.1016/j.rsma.2023.103267
Briand K., Sabarros P. S., Maufroy A., Vernet A.-L., Yon A., Relot-Stirnemann A., et al. (2022). Capability of electronic monitoring system to inform the hauling process of French tuna purse seiners catch. Available online at: https://hal.ird.fr/ird-03382655v2.
Castro J., Marín M., Vázquez A. (2011). Fichas descriptivas de los métier DCF de zona ICES. (Spain: Instituto Español de Oceanografía).
Catchpole T. L., Frid C. L. J., Gray T. S. (2005). Discards in North Sea fisheries: Causes, consequences and solutions. Mar. Policy 29, 421–430. doi: 10.1016/j.marpol.2004.07.001
Chan A. N., Long K., Alger B. (2024). Examining the potential of electronic monitoring to augment protected species bycatch data collection. Available online at: http://spo.nmfs.noaa.gov/tech-memos/ (Accessed June 6, 2024).
Chavance P., Batty A., Mc Edelrry H., Dubroca L., Dewals P., Cauquil P., et al. (2013). Comparing observer data with video monitoring on a French purse seiner in the Indian ocean. IOTC-2013-WPEB09-43. IOTC (Indian Ocean Tuna Comission). Available online at: https://iotc.org/sites/default/files/documents/2014/01/IOTC-2013-WPEB09-43_-_Observer_data_PS.pdf (Accessed September 30, 2024).
Dalskov J., Håkansson K. B., Olesen H. J. (2011). Final report on the danish catch quota management project (Charlottenlund, Denmark: APA). Available at: http://www.aqua.dtu.dk/upload/aqua/publikationer/forskningsrapporter/235 (Accessed March 14, 2024).
Dalskov J., Kindt-Larsen L., Danmarks Tekniske Universitet. DTU Aqua. (2009). Final report of fully documented fishery (DTU Aqua, Danmarks Tekniske Universitet). Available online at: https://backend.orbit.dtu.dk/ws/portalfiles/portal/6581478/23102009%24204_09_samlet.pdf (Accessed March 1, 2024).
Dalskov J., Olesen H. J., Møller E., Jensen S. P., Jensen M., Schultz F., et al. (2012). Danish Catch Quota Management trials-application and results. Available online at: http://www.aqua.dtu.dk/Publikationer/Forskningsrapporter/Forskningsrapporter_siden_2008 (Accessed March 15, 2024).
EFCA (2019). Technical guidelines and specifications for the implementation of Remote Electronic Monitoring (REM) in EU fisheries (Vigo). Available online at: https://www.efca.europa.eu/en/content/technical-guidelines-and-specifications-implementation-remote-electronic-monitoring-rem-eu (Accessed March 1, 2024).
Emery T. J., Noriega R., Williams A. J., Larcombe J. (2019). Measuring congruence between electronic monitoring and logbook data in Australian Commonwealth longline and gillnet fisheries. Ocean Coast. Manag 168, 307–321. doi: 10.1016/j.ocecoaman.2018.11.003
European Union (2008). Commission Decision of 6 November 2008 adopting a multiannual Community programme under Council Regulation (EC) No 199/2008 concerning the establishment of a Community framework for the collection, management and use of data in the fisheries sector and support for scientific advice in relation to fisheries data, management and use of data in the fisheries sector and support for scientific advice regarding the common fisheries policy. Available online at: https://www.boe.es/buscar/doc.php?id=DOUE-L-2008-82597 (Accessed February 29, 2024).
European Union (2013). Regulation (EU) No 1380/2013 of the European Parliament and of the Council of 11 December 2013 on the Common Fisheries Policy, amending Council Regulations (EC) No 1954/2003 and (EC) No 1224/2009 and repealing Council Regulations (EC) No 2371/2002 and (EC) No 639/2004 and Council Decision 2004/585/EC. Available online at: https://eur-lex.europa.eu/eli/reg/2013/1380/oj (Accessed March 1, 2024).
FAO (2018). The State of World Fisheries and Aquaculture 2018 - Meeting the sustainable development goals. Available online at: https://www.fao.org/documents/card/en?details=I9540EN (Accessed March 1, 2024).
Fox J., Weisberg S. (2019). An R companion to applied regression. 3rd ed. (SAGE. Thousand Oaks (CA: Sage). Available at: https://socialsciences.mcmaster.ca/jfox/Books/Companion/ (Accessed March 8, 2024).
French G., Fisher M., Mackiewicz M., Needle C. (2015). Convolutional Neural Networks for Counting Fish in Fisheries Surveillance Video (Norwich, United Kingdom: British Machine Vision Association and Society for Pattern Recognition) 72 (4), 7.1–7.10. doi: 10.5244/c.29.mvab.7
Garcia R., Prados R., Quintana J., Tempelaar A., Gracias N., Rosen S., et al. (2020). Automatic segmentation of fish using deep learning with application to fish size measurement. ICES J. Mar. Sci. 77, 1354–1366. doi: 10.1093/icesjms/fsz186
Garcia-d’Urso N., Galan-Cuenca A., Pérez-Sánchez P., Climent-Pérez P., Fuster-Guillo A., Azorin-Lopez J., et al. (2022). The DeepFish computer vision dataset for fish instance segmentation, classification, and size estimation. Sci. Data 9, 287. doi: 10.1038/s41597-022-01416-0
Glemarec G., Kindt-Larsen L., Lundgaard L. S., Larsen F. (2020). Assessing seabird bycatch in gillnet fisheries using electronic monitoring. Biol. Conserv. 243, 108461. doi: 10.1016/j.biocon.2020.108461
Götz S., Oesterwind D., Zimmermann C. (2015). Report on the German Catch Quota Management trial 2012 - 2014. (Germany: Institute of Baltic Sea Fisheries Rostock). Available online at: https://literatur.thuenen.de/digbib_extern/dn057609.pdf (Accessed March 3, 2024).
Hothorn T., Hornik K., Van De Wiel M. A., Zeileis A. (2006). A lego system for conditional inference. Am. Statistician 60, 257–263. doi: 10.1198/000313006X118430
ICES (2020). EU request on emergency measures to prevent bycatch of common dolphin (Delphinus delphis) and Baltic Proper harbour porpoise (Phocoena phocoena) in the Northeast Atlantic. Report of the ICES Advisory Committee eu.2. doi: 10.17895/ices.advice.6023
James K. M., Campbell N., Vidarsson J. R., Vilas C., Plet-Hansen K. S., Borges L., et al. (2018). “Tools and technologies for the monitoring, control and surveillance of unwanted catches,” in The European Landing Obligation: Reducing Discards in Complex, Multi-Species and Multi-Jurisdictional Fisheries (Cham, Germany: Springer International Publishing), 363–382. doi: 10.1007/978-3-030-03308-8_18
Kelleher K., Food and Agriculture Organization of the United Nations (2005). Discards in the world’s marine fisheries: an update (Food and Agriculture Organization of the United Nations). Available online at: https://www.fao.org/3/y5936e/y5936e.pdf (Accessed March 1, 2024).
Kindt-Larsen L., Glemarec G., Berg C. W., Königson S., Kroner A. M., Søgaard M., et al. (2023). Knowing the fishery to know the bycatch: bias-corrected estimates of harbour porpoise bycatch in gillnet fisheries. Proc. R. Soc. B: Biol. Sci. 290, 20222570. doi: 10.1098/rspb.2022.2570
Lara-Lopez A., Davis J., Stanley B., Australian Fisheries Management Authority., and Fisheries Research & Development Corporation (Australia) (2012). Evaluating the use of onboard cameras in the shark gillnet fishery in South Australia (Canberra, Australia: Australian Fisheries Management Authority).
Legorburu G., Lekube X., Canive I., Ferré J. G., Delgado H., Moreno G., et al. (2018). Efficiency of Electronic Monitoring on FAD related activities by supply vessels in the Indian Ocean. ISSF Technical Report 2018-03 (Washington, D.C). Available online at: https://www.iss-foundation.org/about-issf/what-we-publish/issf-documents/issf-2018-03-efficiency-of-electronic-monitoring-on-fad-related-activities-by-supply-vessels-in-the-Indian-ocean/ (Accessed March 1, 2024).
McCarthy A., Jeffs A., Ogilvie S., Taylor D., Radford J., Tuck I. (2023). The use of cameras on commercial deep-water trawls to investigate habitat associations and scampi trawl efficiency in New Zealand scampi Metanephrops challengeri. Fisheries Sci. 89, 731–745. doi: 10.1007/s12562-023-01728-z
Moncrief-Cox H. E., Carlson J. K., Norris G. S., Wealti M. C., Deacy B. M., Scott-Denton E. (2020). Development of video electronic monitoring systems to record Smalltooth sawfish, pristis pectinata, interactions in the shrimp trawl fisheries of the southeastern United States, with application to other protected species and large bycatches. Mar. Fisheries Rev. 82, 1–8. doi: 10.7755/MFR.82.3-4.1
Needle C. L., Dinsdale R., Buch T. B., Catarino R. M. D., Drewery J., Butler N. (2015). Scottish science applications of Remote Electronic Monitoring. ICES J. Mar. Sci. 74 (4), 1214–1229. doi: 10.1093/icesjms/fsu225
Ovalle J. C., Vilas C., Antelo L. T. (2022). On the use of deep learning for fish species recognition and quantification on board fishing vessels. Mar. Policy 139, 105015. doi: 10.1016/j.marpol.2022.105015
Plet-Hansen K. S., Bergsson H., Ulrich C. (2019). More data for the money: Improvements in design and cost efficiency of electronic monitoring in the Danish cod catch quota management trial. Fish Res. 215, 114–122. doi: 10.1016/j.fishres.2019.03.009
Puente E., Citores L., Cuende E., Krug I., Basterretxea M. (2023). Bycatch of short-beaked common dolphin (Delphinus delphis) in the pair bottom trawl fishery of the Bay of Biscay and its mitigation with an active acoustic deterrent device (pinger). Fish Res. 267, 106819. doi: 10.1016/j.fishres.2023.106819
R Core Team (2023). R: A language and environment for statistical computing (Vienna, Austria: R Foundation for Statistical Computing). Available at: https://www.R-project.org/ (Accessed March 7, 2024).
Ruiz J., Batty A., Mcelderry H., Restrepo V., Lezama N., Murua H., et al. (2013). Pilot study of an electronic monitoring system on a tropical tuna purse seine vessel in the Atlantic Ocean. Available online at: www.tuna-org.org (Accessed March 15, 2024).
Ruiz J., Krug I., Gonzalez O., Gomez G., Urrutia X. (2015). Electronic eye: electronic monitoring trial on a tropical tuna purse seiner in the Atlantic Ocean. Available online at: https://www.iccat.int/Documents/CVSP/CV071_2015/n_1/CV071010476.pdf (Accessed March 1, 2024).
Sea Council of Galicia (2011). Decreto 15/2011 do 28 de xaneiro, “polo que se regulan as artes aparellos, útiles, equipamentos e técnicas permitidos para a extracción profesional dos recursos mariños vivos en augas de competencia da Comunidade Aútonoma de Galicia. Spain: Off. J. Galicia. Available at: https://www.xunta.gal/dog/Publicados/2011/20110215/Anuncio65FE_es.html (Accessed March 1, 2024).
Secretaría General de Pesca (2024). Informe anual de la actividad de la flota pesquera español 2024 (Datos 2022). Available online at: https://www.mapa.gob.es/es/pesca/temas/registro-flota/informeanualflota2024conpa_tcm30-687759.pdf (Accessed January 23, 2025).
Ulrich C., Olesen H. J., Bergsson H., Egekvist J., Håkansson K. B., Dalskov J., et al. (2015). Discarding of cod in the Danish Fully Documented Fisheries trials. ICES J. Mar. Sci. 72, 1848–1860. doi: 10.1093/icesjms/fsv028
Valeiras J., Nélida P, Araujo H., Salinas I., Bellido J. M. (2014). Atlas descartes de la flota de arrastre y enmalle en el caladero nacional cantábrico-noroeste. Available online at: https://digital.csic.es/handle/10261/328044 (Accessed February 29, 2024).
Van Essen R., Mencarelli A., van Helmond A., Nguyen L., Batsleer J., Poos J. J., et al. (2021). Automatic discard registration in cluttered environments using deep learning and object tracking: class imbalance, occlusion, and a comparison to human review. ICES J. Mar. Sci. 78, 3834–3846. doi: 10.1093/icesjms/fsab233
Van Helmond A. T. M., Chen C., Poos J. J. (2015). How effective is electronic monitoring in mixed bottom-trawl fisheries? ICES J. Mar. Sci. 72 (4), 1192–1200. doi: 10.1093/icesjms/fsu200
Van Helmond A. T. M., Chen C., Poos J. J. (2017). Using electronic monitoring to record catches of sole (Solea solea) in a bottom trawl fishery. ICES J. Mar. Sci. 74, 1421–1427. doi: 10.1093/icesjms/fsw241
Van Helmond A. T. M., Mortensen L. O., Plet-Hansen K. S., Ulrich C., Needle C. L., Oesterwind D., et al. (2020). Electronic monitoring in fisheries: Lessons from global experiences and future opportunities. Fish Fisheries 21, 162–189. doi: 10.1111/faf.12425
White D. J., Svellingen C., Strachan N. J. C. (2006). Automated measurement of species and length of fish by computer vision. Fish Res. 80, 203–210. doi: 10.1016/j.fishres.2006.04.009
Keywords: fisheries science, electronic monitoring, scientific data, discards, sustainable fisheries, fisheries management, electronic observation
Citation: Barreiro M, Abad E, Antelo LT, Fernández JC, Pereira C, Ovalle JC, Pérez Martín RI and Valeiras J (2025) Development of smart electronic observation onboard technologies for more sustainable fisheries management. Front. Mar. Sci. 12:1545718. doi: 10.3389/fmars.2025.1545718
Received: 15 December 2024; Accepted: 06 February 2025;
Published: 10 March 2025.
Edited by:
Pablo Presa, University of Vigo, SpainReviewed by:
Taner Yildiz, Istanbul University, TürkiyeCopyright © 2025 Barreiro, Abad, Antelo, Fernández, Pereira, Ovalle, Pérez Martín and Valeiras. This is an open-access article distributed under the terms of the Creative Commons Attribution License (CC BY). The use, distribution or reproduction in other forums is permitted, provided the original author(s) and the copyright owner(s) are credited and that the original publication in this journal is cited, in accordance with accepted academic practice. No use, distribution or reproduction is permitted which does not comply with these terms.
*Correspondence: Mateo Barreiro, bWF0ZW8uYmFycmVpcm9AaWVvLmNzaWMuZXM=
Disclaimer: All claims expressed in this article are solely those of the authors and do not necessarily represent those of their affiliated organizations, or those of the publisher, the editors and the reviewers. Any product that may be evaluated in this article or claim that may be made by its manufacturer is not guaranteed or endorsed by the publisher.
Research integrity at Frontiers
Learn more about the work of our research integrity team to safeguard the quality of each article we publish.