
94% of researchers rate our articles as excellent or good
Learn more about the work of our research integrity team to safeguard the quality of each article we publish.
Find out more
ORIGINAL RESEARCH article
Front. Mar. Sci., 27 February 2025
Sec. Marine Fisheries, Aquaculture and Living Resources
Volume 12 - 2025 | https://doi.org/10.3389/fmars.2025.1539206
 Leif K. Rasmuson1,2*†
 Matthew T. O. Blume1†Kelly A. Lawrence1Bruce M. Laughlin3
 Christopher A. Edwards3
 Mark R. Terwilliger1
 A. Camille Ayrea1
 Alexandra G. McInturf4
 Bryan J. Legare5
 Taylor K. Chapple4
Of the seven species of Pacific rockfish declared overfished in the California Current in 2008, yelloweye rockfish (Sebastes ruberrimus) is the only remaining overfished rockfish species. Part of the original rebuilding plan included designation of a yelloweye rockfish conservation area, a rocky reef closed off the Central Coast of Oregon that is closed to bottom fishing. The yelloweye rockfish conservation area’s ability to help rebuild the population, is predicated on the theory that demersal rockfishes are relatively sedentary. However, in the years since being declared overfished, acoustic tagging studies suggested yelloweye rockfish did not remain in the yelloweye rockfish conservation area. However, where they went remained a mystery. In this paper we describe the use of pop-off satellite tags to conduct a mark-recapture study of 11 yelloweye rockfish tagged within the Stonewall Bank Yelloweye Rockfish Conservation Area. We used back-in-time particle tracking coupled with an ocean circulation model in an attempt to increase the precision in the location at which each tag shed off the fish, and further validated that location by associating it to the underlying seafloor habitat type. Ten out of eleven tags were shed from the fish while it was outside the Stonewall Bank Yelloweye Rockfish Conservation Area’s boundary. While most fish remained within 50 km of the Stonewall Bank Yelloweye Rockfish Conservation Area, one tagged fish swam to an offshore reef off Central Washington (~40 km from the shore). Backtracked locations were more likely over rock than the initial satellite transmission, indicating the method was effective at identifying tag shed locations. We found no relationship between days at large, fish sex or length and the distance between release site and shed location. Our work supports a growing body of work that suggests yelloweye rockfish have less site fidelity than previously hypothesized.
Fish movement plays a crucial role in the dynamics of fisheries worldwide. Drivers of movement take many forms including reproduction, provisioning, escaping predators, and responding to changing environments. In the marine environment, some fish species move on the scale of 1000s of kilometers while other species remain within 10s of meters their entire life (Cooke et al., 2022). Additionally, a species movement can change across ontogeny and within a given demographic group (Pearson and Gunderson, 2003; Green and Starr, 2011). The scale and frequency of movement patterns directly influence stock management boundaries and are critical data inputs when creating and implementing spatial closures like marine protected areas (Moffitt et al., 2009; Cadrin et al., 2013). Therefore, understanding the spatiotemporal scales and causes of fish movement is essential for effective management and conservation efforts (Crossin et al., 2017). This is especially critical for species/stocks with life history characteristics that make them more vulnerable to overexploitation (e.g., long-lived, slow growing and maturing).
Yelloweye rockfish (Sebastes ruberrimus) are members of the long-lived rockfish genus, Sebastes, with the oldest aged individual aged at 147 years and late age (>20 years) to maturation (Love et al., 2002; Butler et al., 2012). As with many other demersal rockfishes, the prevailing hypothesis is that yelloweye are relatively sedentary with small home ranges. Similar to seven other long-lived rockfish species within the California Current Ecosystem, yelloweye rockfish were declared overfished in 2002 and a rebuilding plan was initiated in 2004 (Pacific Fishery Management Council, 2008) requiring all targeted fishing of yelloweye rockfish be stopped and bycatch of the species drastically reduced to counteract declines. As part of this plan, a single yelloweye rockfish Conservation Area was established in 2005 off Oregon, at Stonewall Bank, where yelloweye rockfish are a common bycatch species in the Pacific halibut and groundfish fisheries. The small and singular area (~50 km2, rather than a larger area or as part of a network of closed areas) was based on the small home range paradigm for benthic rockfish species; with the goal to specifically reduce fishing pressure and aid in species recovery (i.e., fish remain inside the closed area). In the 20 years since, of the seven rockfish species that were declared overfished, all but yelloweye have recovered. These six recovered species, while all long lived, have different life history characteristics; some are semi-pelagic whereas others are demersal and others live on the continental shelf while others are primarily found on the continental slope. From a management perspective, for the Cowcod, Sebastes levis, multiple species-specific closed areas were established. For the other five rockfish species (Boccacio- Sebastes paucispinus, Canary- Sebastes pinniger, Darkblotched- Sebastes crameri, Pacific Ocean Perch- Sebastes alutus, Widow- Sebastes entomelas) species specific closed areas were not established, however, larger areas of the coast were closed to trawling for rockfish. While not recovered, yelloweye are recovering at rates faster than anticipated — however the species continues to constrain fisheries (Gertseva and Cope, 2017).
Because spatiotemporal scales and causes of fish movement are known to impact effective management (Crossin et al., 2017), our work set out to test assumptions of residency and movement patterns in yelloweye rockfish to see if new efforts could be undertaken to expedite the rebuilding. Some studies have suggested that assumptions of small home range size in yelloweye rockfish may have been influenced by low population sizes (O’Connell and Carlile, 1994; Butler et al., 2012). The Oregon Department of Fish and Wildlife studied how long acoustically tagged yelloweye rockfish remained inside the offshore Stonewall Bank Yelloweye Rockfish Conservation Area (Rankin, 2019) and within a nearshore reef complex (Hannah and Rankin, 2011). In these studies, they found ~78% (7 of 9) of tagged yelloweye rockfish permanently left the yelloweye rockfish conservation area (Rankin, 2019) and ~67% (6 of 9) fish left the nearshore reef complex (Hannah and Rankin, 2011). Similarly, one out of three acoustically tagged yelloweye rockfish in British Columbia exhibit no or limited patterns of residency (Reynolds et al., 2010). Together, these studies suggested that yelloweye rockfish may have larger home ranges than previously hypothesized, and therefore do not fall within the small home range paradigm for demersal rockfish; findings with strong implications for current management strategies.
However, as the aforementioned acoustic studies note in their discussions, acoustic data is limited to presence/absence and defined by the scale of the receiving array; once an animal leaves the array its position is unknown (Carlisle et al., 2015). As such, there is a large degree of uncertainty in the spatial scale of yelloweye rockfish movements, indicating further work is needed to define the extent of yelloweye rockfish movements. This information is necessary to inform effective management of the species, such as the characteristics (e.g., spatial scale) of an effective marine protected area, as well as help define broader spatial threats to yelloweye rockfish in order to promote even faster recovery.
Pop-up satellite tags (PSAT) offer an alternative to acoustic tags. They are typically an effective tool for studying the movement of fishes that travel large, or unknown, distances (Nielsen, 2009; Sippel et al., 2015). Pop-off satellite tags (typically use light levels or geomagnetic fields to estimate the daily location of a tagged animal (+/-100 km; Teo et al., 2004; Klimley et al., 2017) and, once detached from an animal, satellite doppler positioning to more precisely estimate its final location (Hammerschlag et al., 2011). Given the potential of pop-off satellite tags to complement previous acoustic work on yelloweye rockfish, we aimed to use pop-off satellite tags to estimate the broader spatiotemporal movement patterns of yelloweye rockfish tagged in the Stonewall Bank Yelloweye Rockfish Conservation Area.
Yelloweye rockfish were captured using hook and line gear near the southwestern end of the Stonewall Bank Yelloweye Rockfish Conservation Area (Figure 1). All fish were measured to the nearest centimeter and sexed externally. Due to the size of the tag (Figure 2), we only tagged fish >45 cm in length. To minimize the effects of barotrauma after capture and before tagging, fish were placed in modified plastic barrels (used to make pickles) and descended to the ocean floor for 24 hours, following methods of Hannah et al. (2012), which showed that upon retrieval, most fish were active, had no barotrauma symptoms, and overall were in good health (Figure 2).
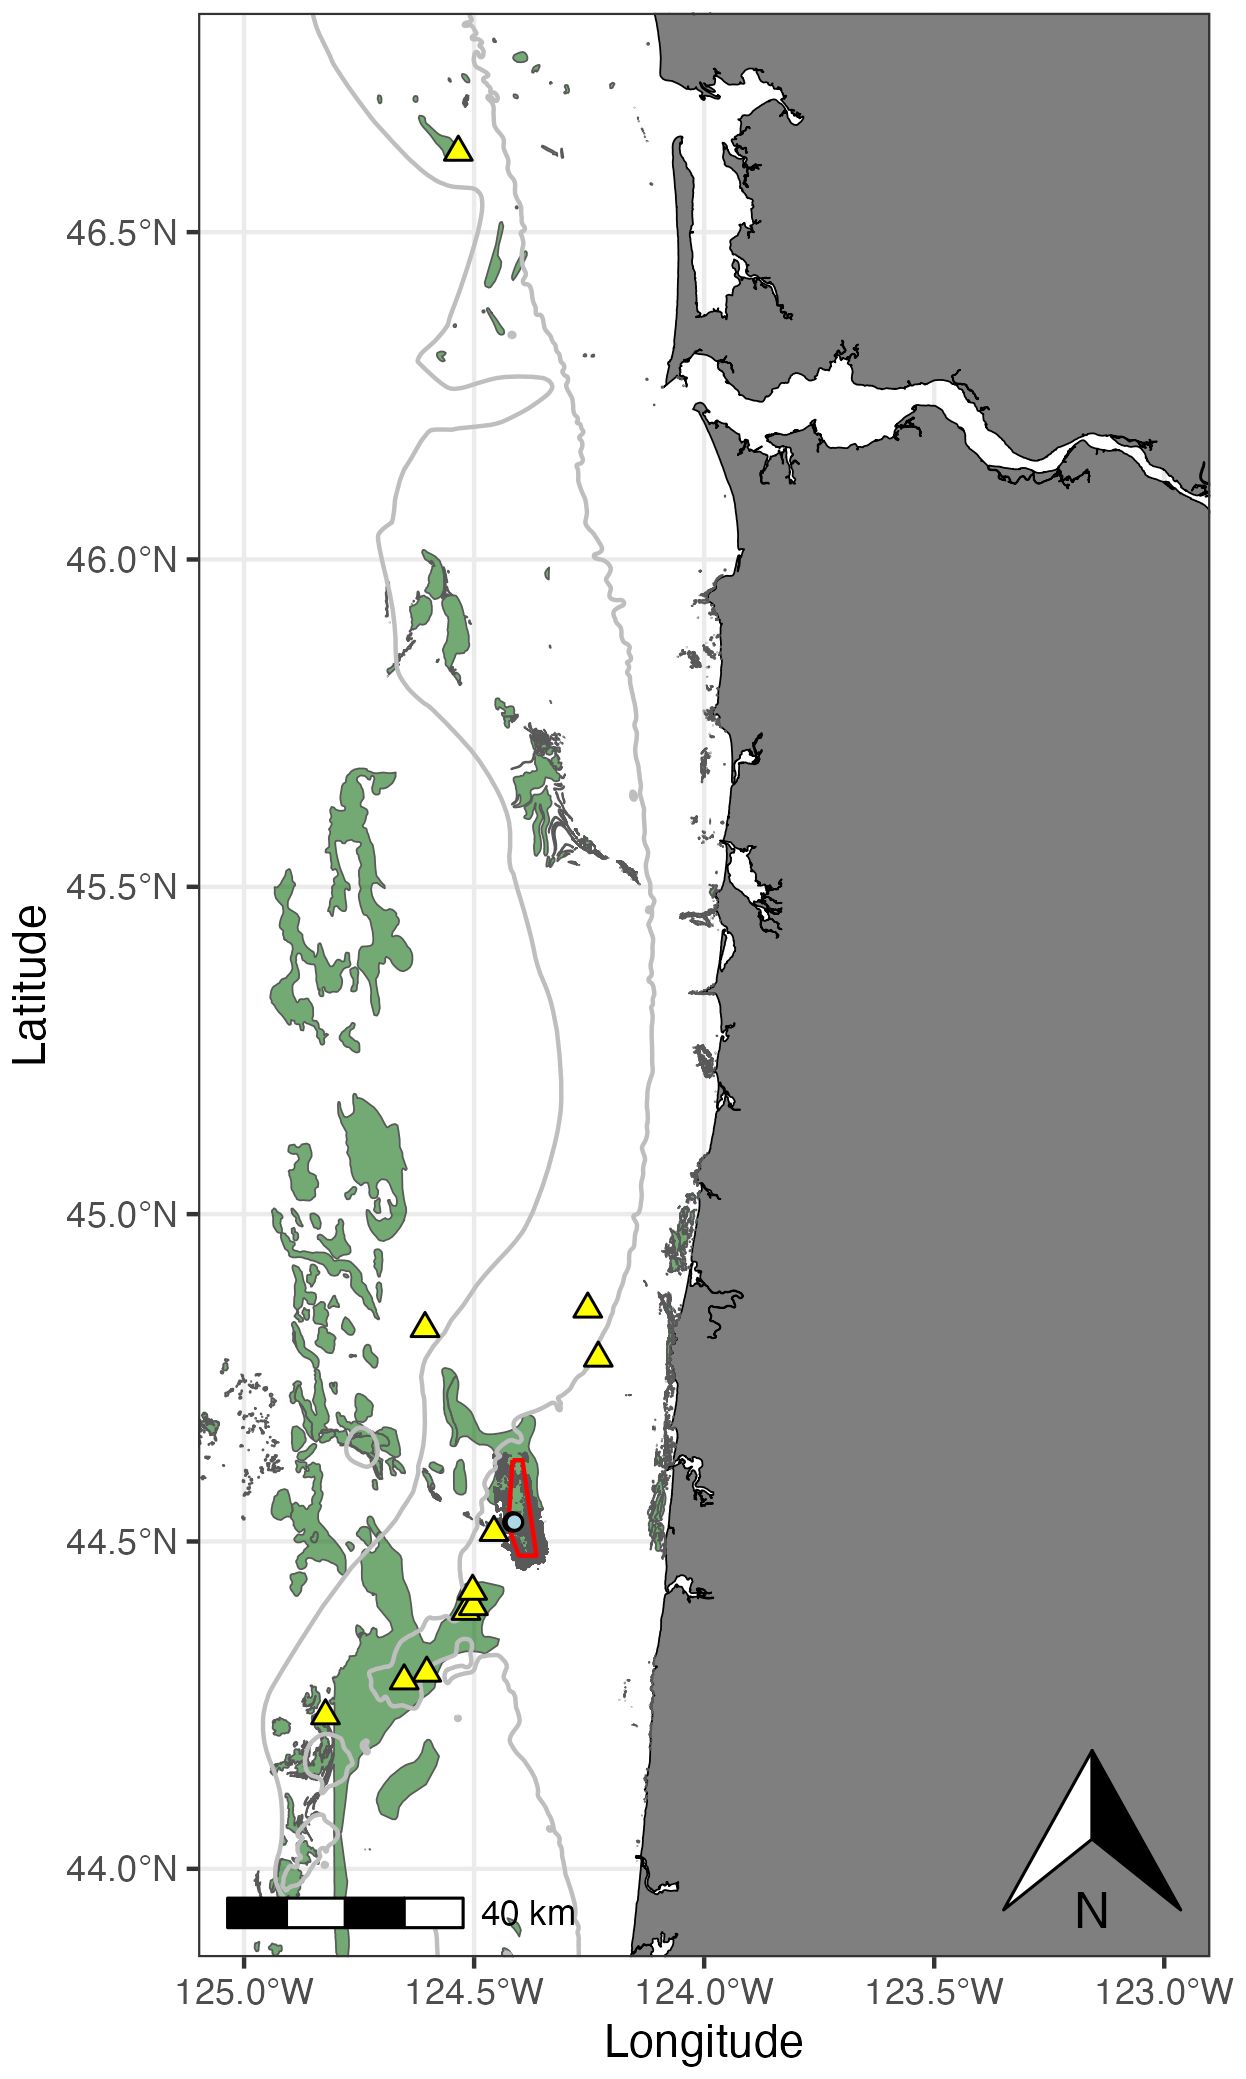
Figure 1. Map of coast between southern Washington and Central Oregon. Red outlined area is the Stonewall Bank Yelloweye Rockfish Conservation Area. Blue dot is the location fish were tagged and released (release location) in mid-May 2023, and yellow triangles are locations where backtracking predicted the tag was shed (shed location). Gray lines are the 100 and 200 m isobaths respectively and green areas denote rocky reefs.
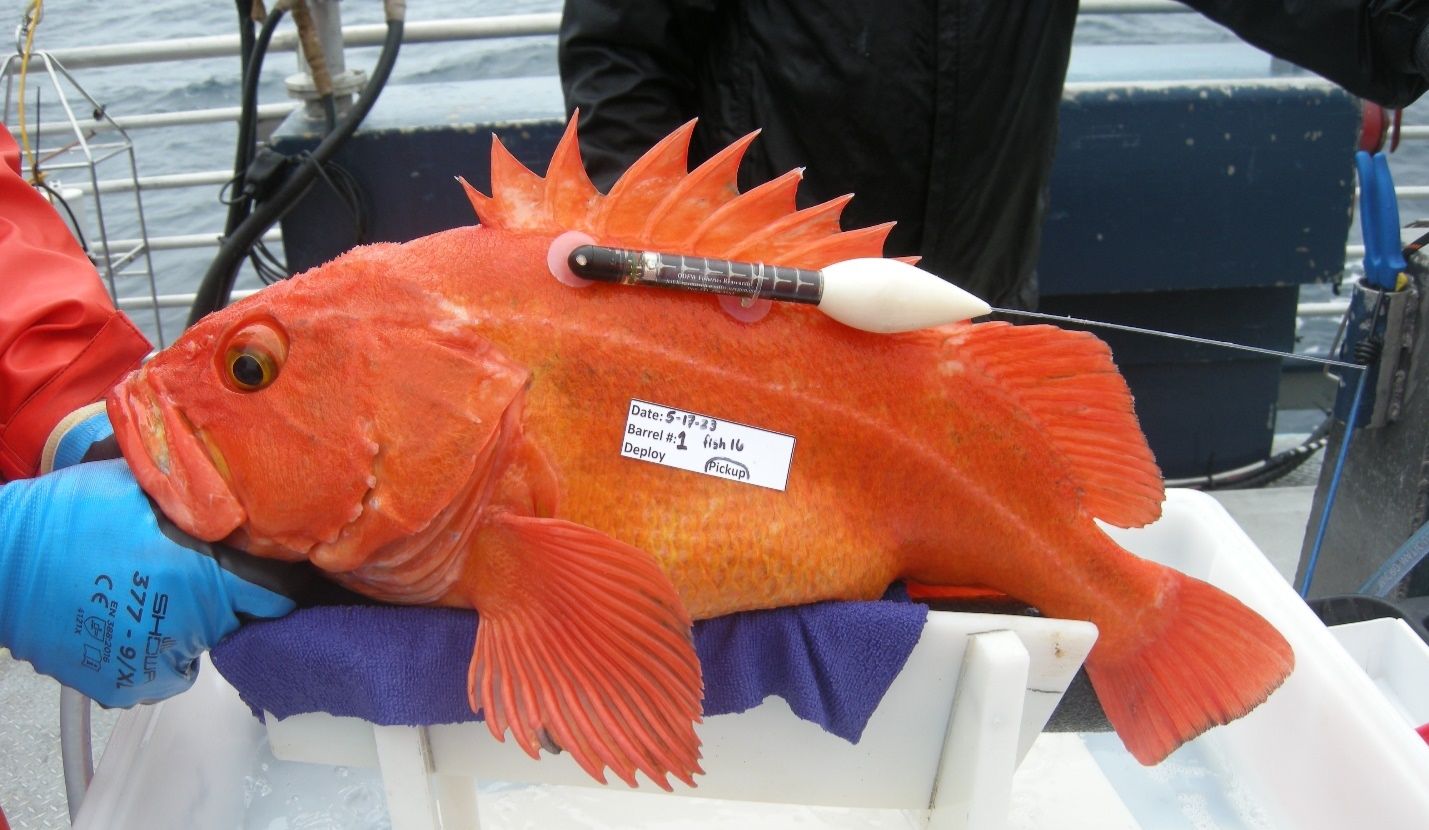
Figure 2. Yelloweye rockfish after being tagged with a with Desert Star GEO satellite tag. Note it shows no signs of barotrauma after recovering for 24 hours on bottom in modified pickle barrel.
After being held in recovery barrels, fish were placed on a tagging cradle where their head/eyes were covered with a cold, wet cloth, and their gills were flushed with seawater using a diffuser placed in their mouth. Each fish was tagged externally with a SeaTag-GEO (Desert Star Systems LLC; 170 mm long x 14.6 mm in diameter; weight in air, 36.7 g). Yelloweye rockfish are known to remain in deep aphotic waters, prohibiting use of PSATs with geolocation. To our knowledge, SeaTag-GEO tags are the smallest tag equipped with a magnetometer (to derive geomagnetic location), and a battery capable of operating for ~ 1 year with no ambient light. Tags record daily average values of the data they collect (magnetic, light, and temperature). In our study, tags were only programmed with a time release (depth and temperature release were disabled). To maximize the likelihood of obtaining data, eight tags were set to release after 200 days and 11 tags were set to release after 300 days.
Each tag was attached via two monofilament strings (1.8 mm in diameter) through the dorsal musculature; adjacent to the base of dorsal spines three and six (Figure 2). The anterior monofilament was attached to the nose cone of the tag, and the posterior monofilament looped around the main tube of the tag. This configuration would allow the main body of the tag to release from the nose cone when the tag reached the end of the tagging duration. During tagging, each fish was held at the surface for as little time as possible (one fish was held for 6 minutes, and the remaining 18 fish were held for 5 minutes or less). All fish were released at the location they were caught (hereafter release location).
Statistical analyses were conducted in R version 4.3.2 “Eye Holes” (R Core Team, 2023). In-depth examination of the magnetometer data revealed extreme fluctuations of magnetic data (see online supplement). These data indicated movements of 100s of km per day, which is highly improbable for this species. Thus, magnetometer data could not be used for location estimates. Instead, we used the Argos satellite transmitted doppler locations of each tag’s location following release from the fish. These satellite locations were the first Argos location with a class of three or better (<1500m error radius), chosen to ensure conservative location estimates (hereafter first quality transmission). Unfortunately, the tags did not transmit immediately after shedding, but required some time at the surface to recharge their capacitor. Because temperature and light are significantly different between surface and bottom, the difference can be used to determine when the fish was on the bottom. Therefore, we can determine the last day/time the tag was on or near the bottom by using the light and temperature data from each tag. This allowed us to determine how long the tag drifted on the surface recharging prior to the first quality transmission. In all instances, low temperature and light levels occurred no more than two days prior to the first quality transmission.
Because the tag may have drifted for two days prior to transmitting its first quality transmission, we used back-in-time Lagrangian particle tracking to further validate the true tag shed location, which represents the last known location of the fish (hereafter shed location). Lagrangian particle tracking uses algorithms to move simulated particles through the ocean based on prevailing ocean and atmospheric conditions (North et al., 2009). These algorithms account for randomness (horizontal diffusivity) and provide insight into how an object (a shed tag in this instance) may have drifted through the ocean in the two days prior to its first transmission. Ocean circulation data were provided by a data assimilative ocean circulation model developed using the Regional Ocean Modelling System (ROMS) which has been shown to accurately represent mesoscale processes in the California Current (Veneziani et al., 2009). The model used the near-real-time forecast system run by Chris Edwards at the University of California, Santa Cruz (UCSC), which provides daily output files and takes its initial conditions from a data assimilative reanalysis product produced by Andy Moore at UCSC. Particle tracking was conducted for each tag separately using the offline particle tracking software package OpenDrift (Dagestad et al., 2017), with 5,000 virtual particles seeded at the surface in a 1 km radius patch centered on the first quality transmission before being propagated backwards in time along the surface using a horizontal diffusivity value of 10 m2 s-1. Particle location was updated every 3,600 s within the model, and the locations of the particles saved every hour for 2 days. We averaged the location of all 5,000 virtual particles on the final time step (48 hours) and considered this the shed location.
As yelloweye rockfish are often associated with rocky habitat, we compared benthic habitat at both the first quality transmission and shed location, the goal being to validate the shed location similar to the methods of Pittman et al. (2014). If shed locations had a higher probability of being over rocky habitat than first quality transmission location, this would suggest particle backtracking better identified the true shed location. To do this, we used the location of all 5,000 particles every hour for 48 hours and extracted the associated benthic habitat for the particle locations. Extracted habitat data was then aggregated into sand, mud, gravel or rock habitat and the percentage of particles in each habitat calculated for each hourly time stamp. Habitat data was derived from the Lith3 category of the Surficial Geologic Habitat (SGH V4) layer produced by BOEM (Goldfinger et al., 2014).
Distances between points (fish release location to shed location) were calculated using a straight line haversine formula (Robusto, 1957). Distances moved were compared to fish length and days at large using simple linear regressions using the “lm” function in R. Four iterations of each regression model (fish length and days at large) were run: 1) using all data points, 2) just data for females, 3) just data for males and 4) all data excluding one individual that made a >200 km movement. To look at seasonal effects, we calculated the average distance fish moved north or south each month, however, due to the low sample size, no further seasonal analysis was done.
On May 15, 16 and 17th 2023, 19 yelloweye rockfish (11 male, 8 female) were captured. Out of the 19 fish released with tags, 13 of those tags transmitted data at some point following their deployment (Table 1). All tags, except one, shed prior to their preprogrammed date and were at large for 114.18 ± 123.50 d (mean ± interquartile range[IQR]). Our data were not normally distributed so mean ± IQR is provided as IQR is a better measure of central tendency for these types of data. We excluded two tags from analyses: tag 225452 due to evidence of a software reset at some point prior to the first location transmission, and tag 225462 due to evidence of several low-quality transmissions over multiple months without location data. While this could indicate a fish was near the surface, we also cannot discount the possibility that the tag was fouled and not transmitting correctly. Backtracking data from these two excluded tags are presented in the online supplement.
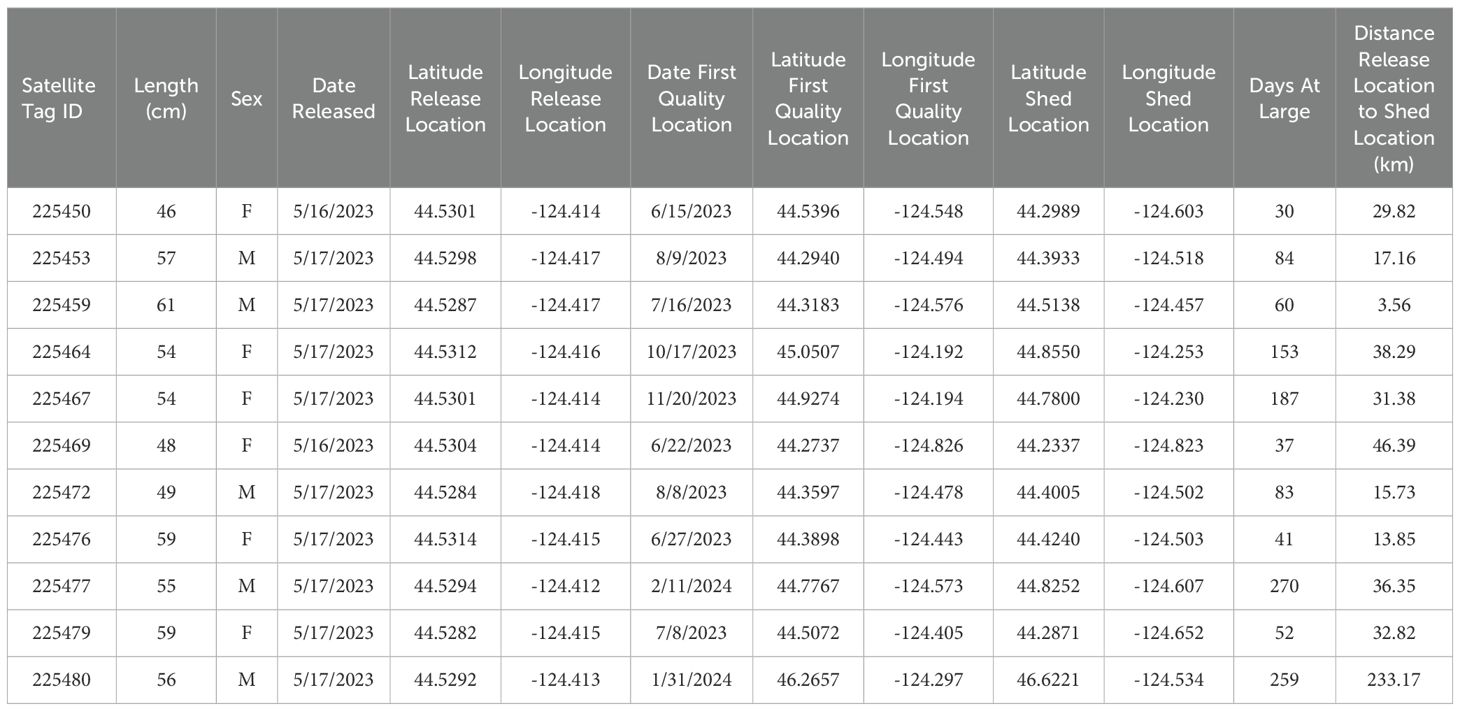
Table 1. Summary data for tagged fish.
For the remaining 11 tags that were not excluded, the first quality transmissions were observed both north and south of the yelloweye rockfish conservation area (Figure 1). Backtracking estimated the tags likely did not drift > 20 km from shed location to first quality transmission (average distance: 12.57 ± 13.17 km (mean ± IQR); Figure 3). First quality transmission locations were mostly over sandy or muddy habitat which are not typically considered to be yelloweye rockfish habitat. Extraction of habitat data for every time step of the backtracking process indicated that tags were most likely shed in rocky habitat favored by yelloweye rockfish with >60% of the shed location being in rocky habitat (Figure 4).
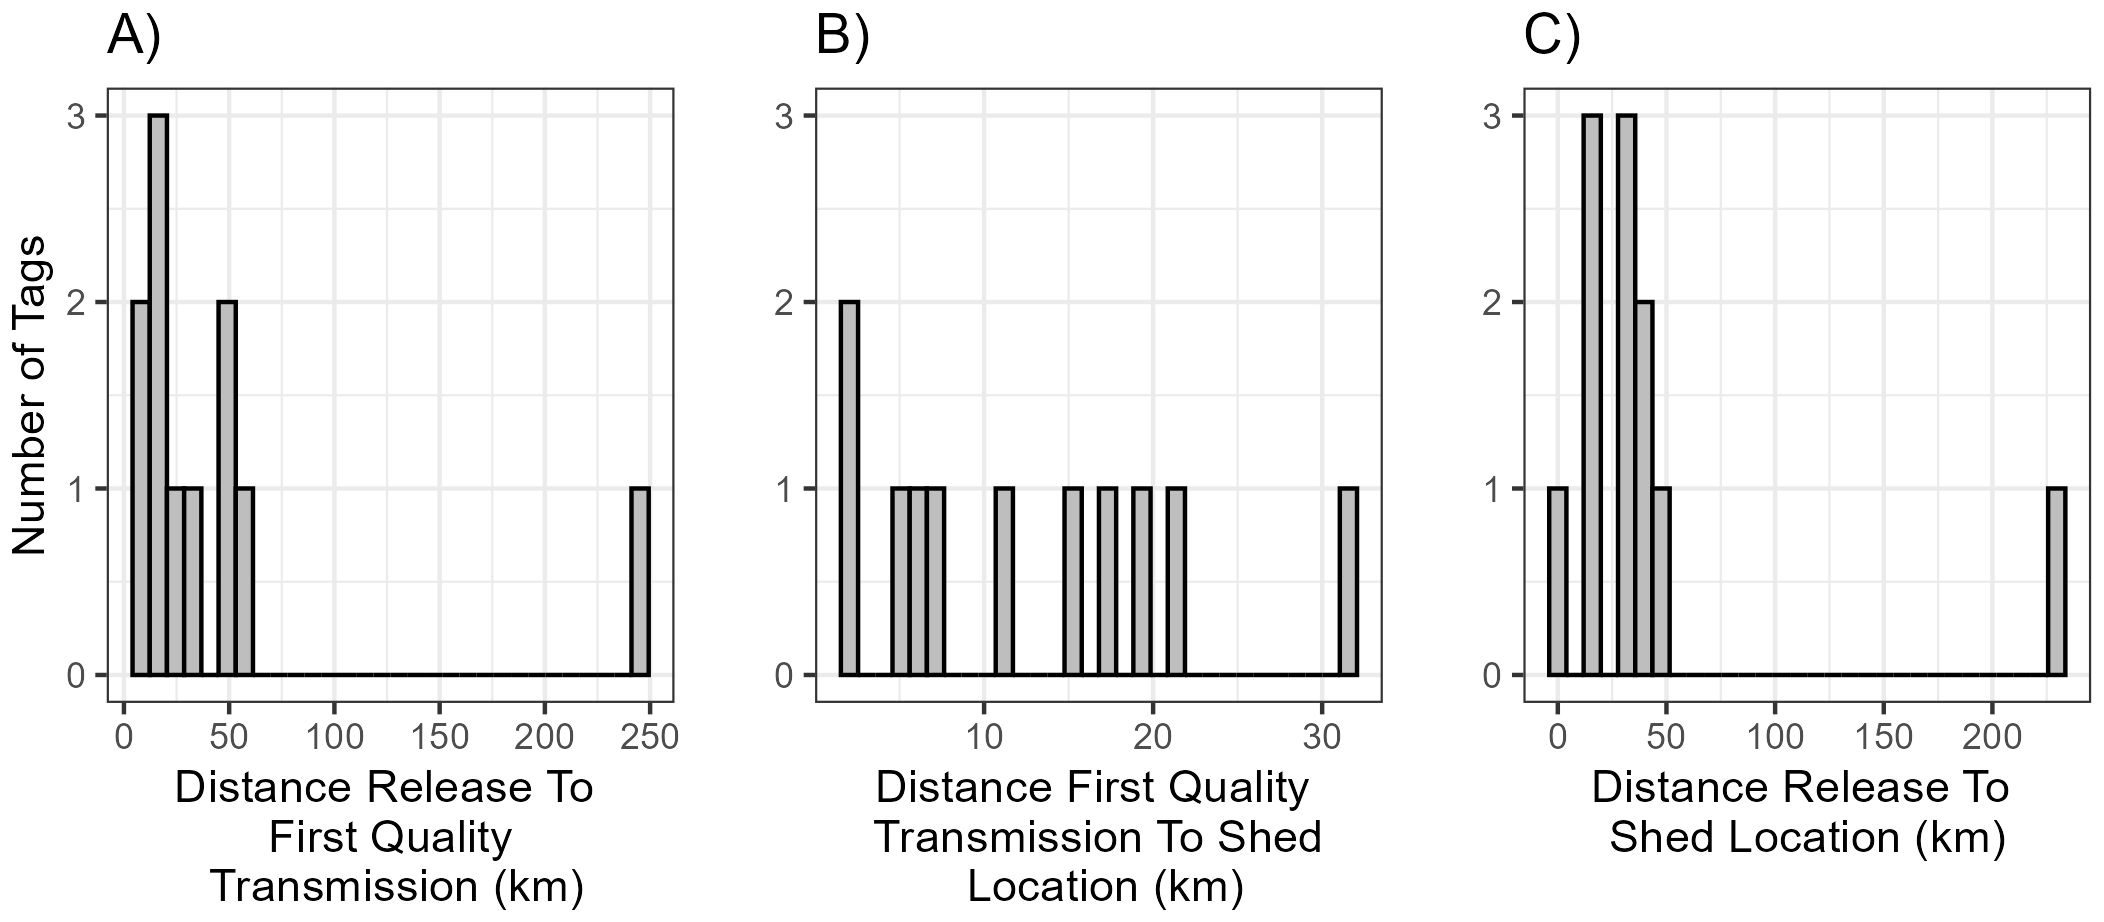
Figure 3. Histograms showing (A), distribution of distances from initial fish release location to first quality transmission for 11 tags (B), distance from the first quality transmission to the shed location (mean location of 5,000 particles 48 hours prior to first quality transmission) (C) and distance from release location to the shed location.
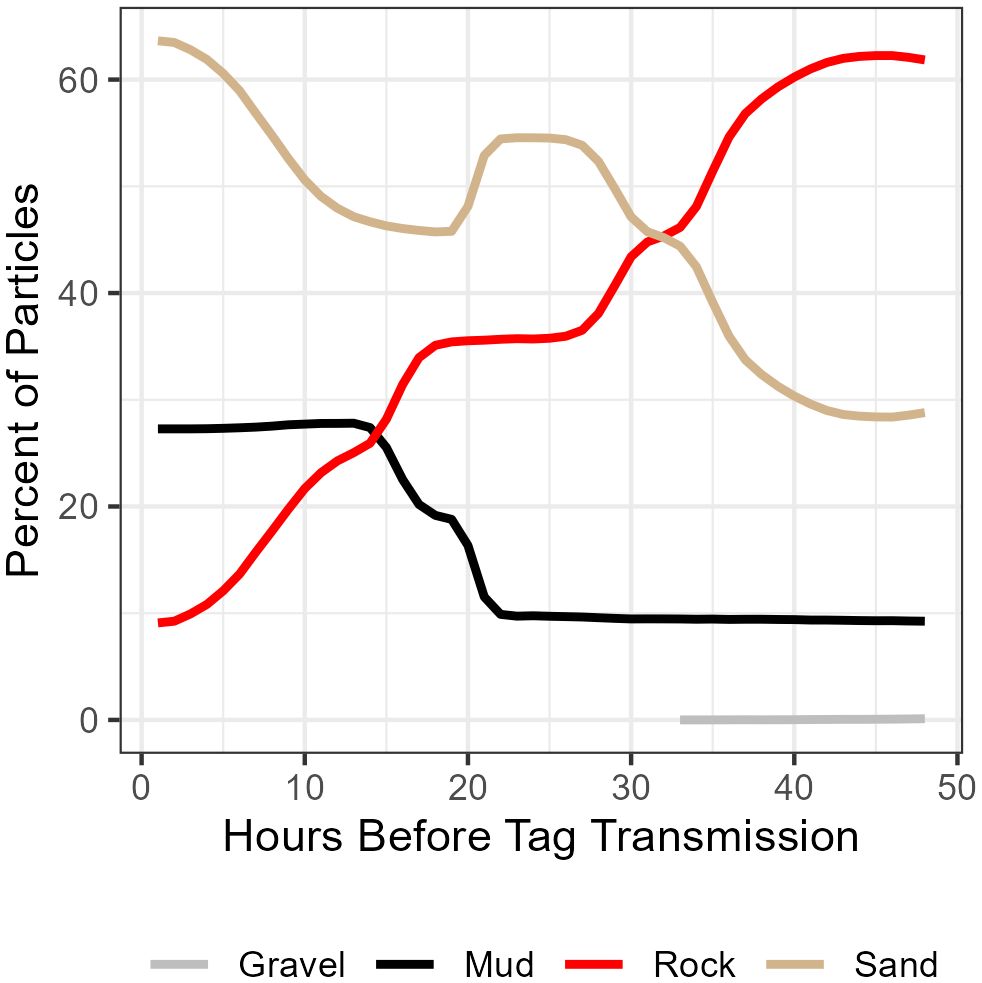
Figure 4. Seafloor habitat percentages, calculated at 1 hour intervals of backtracked trajectory of 5,000 particles released within 1,000 m of the initial Argos tranmissions were received (first quality transmission), for each of the 11 tags.
The shed location of all but one tag (225459) suggests the fish were outside of the yelloweye rockfish conservation area. Most fish remained within 50 km of their release location. There was one notable exception (225480), a fish that moved northward from the release location to the central Washington coast, a distance of 233 km. This site was ~40 km from shore and still on the continental shelf. The average distance from release site to predicted shed location was 48.0 ± 20.87 km (mean ± IQR). Removing the fish that swam to Washington, the average distance between release location and shed location was 28.12 ± 19.38 km (mean ± IQR). There were no statistically significant relationships observed between distance moved from release location and fish length, sex or number of days at large (Figure 5; Table 2). There was, however, a pattern where tags that were shed early in the study were shed south of the release site, whereas tags shed late in the study were north of the release site (Figure 6).
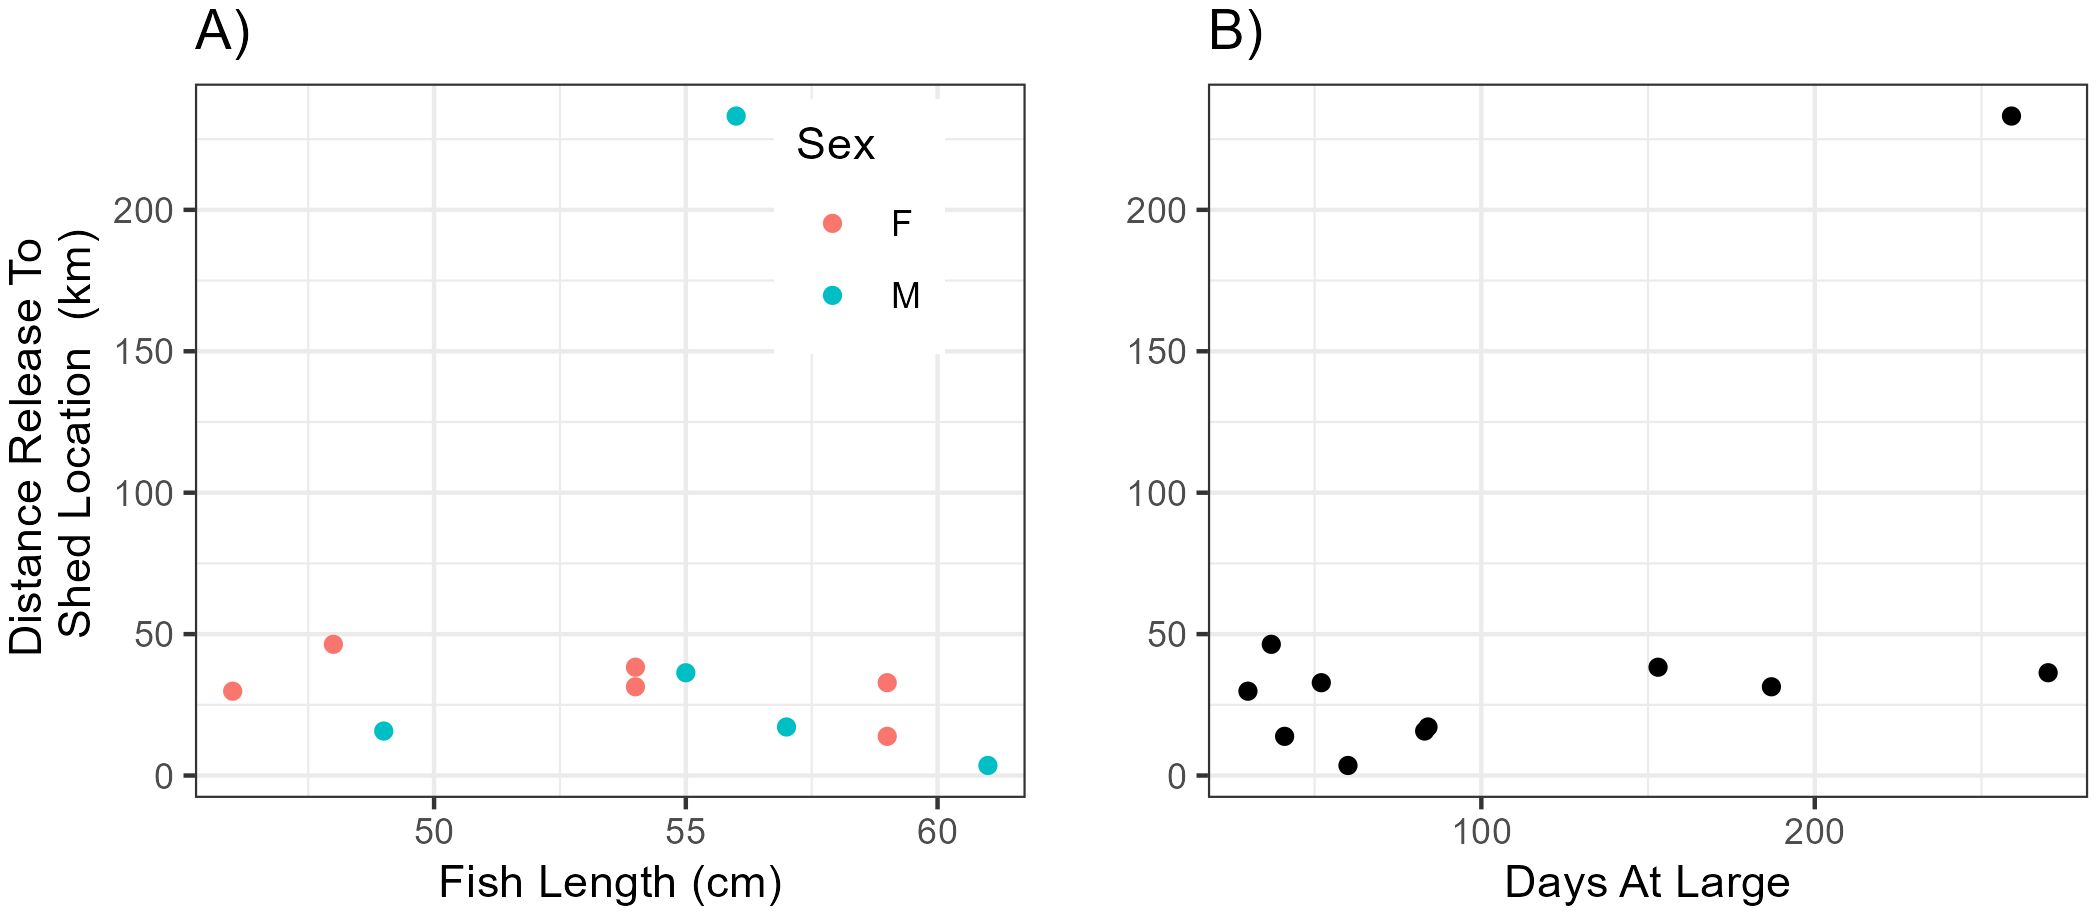
Figure 5. Relationship between fish length and sex (A) and days at large (B) on the distance from the initial fish release location to the average location 48 hours prior to first transmission. Results of linear regressions (all non-significant) are presented in Table 2.
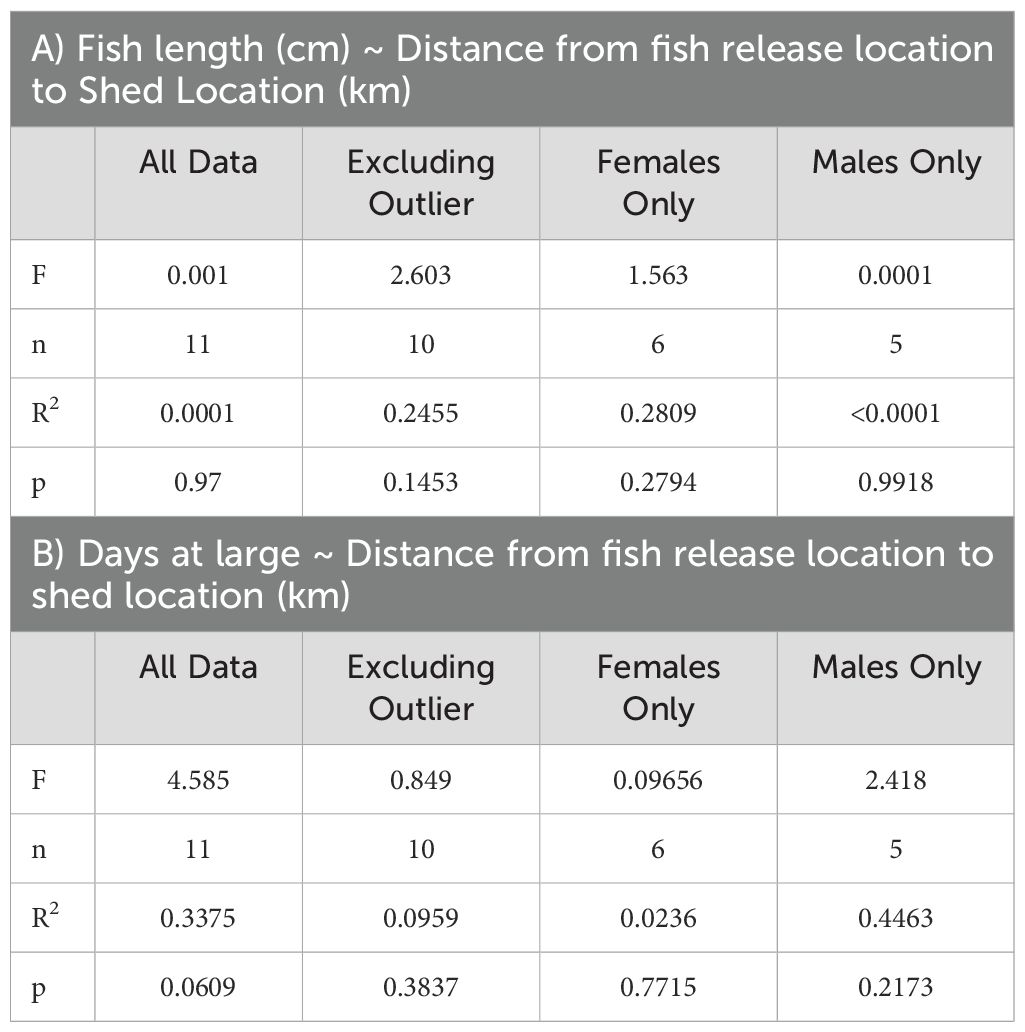
Table 2. Results of linear regression models between the distance from the release location to the tag shed location and fish length (A) or days at large (B).
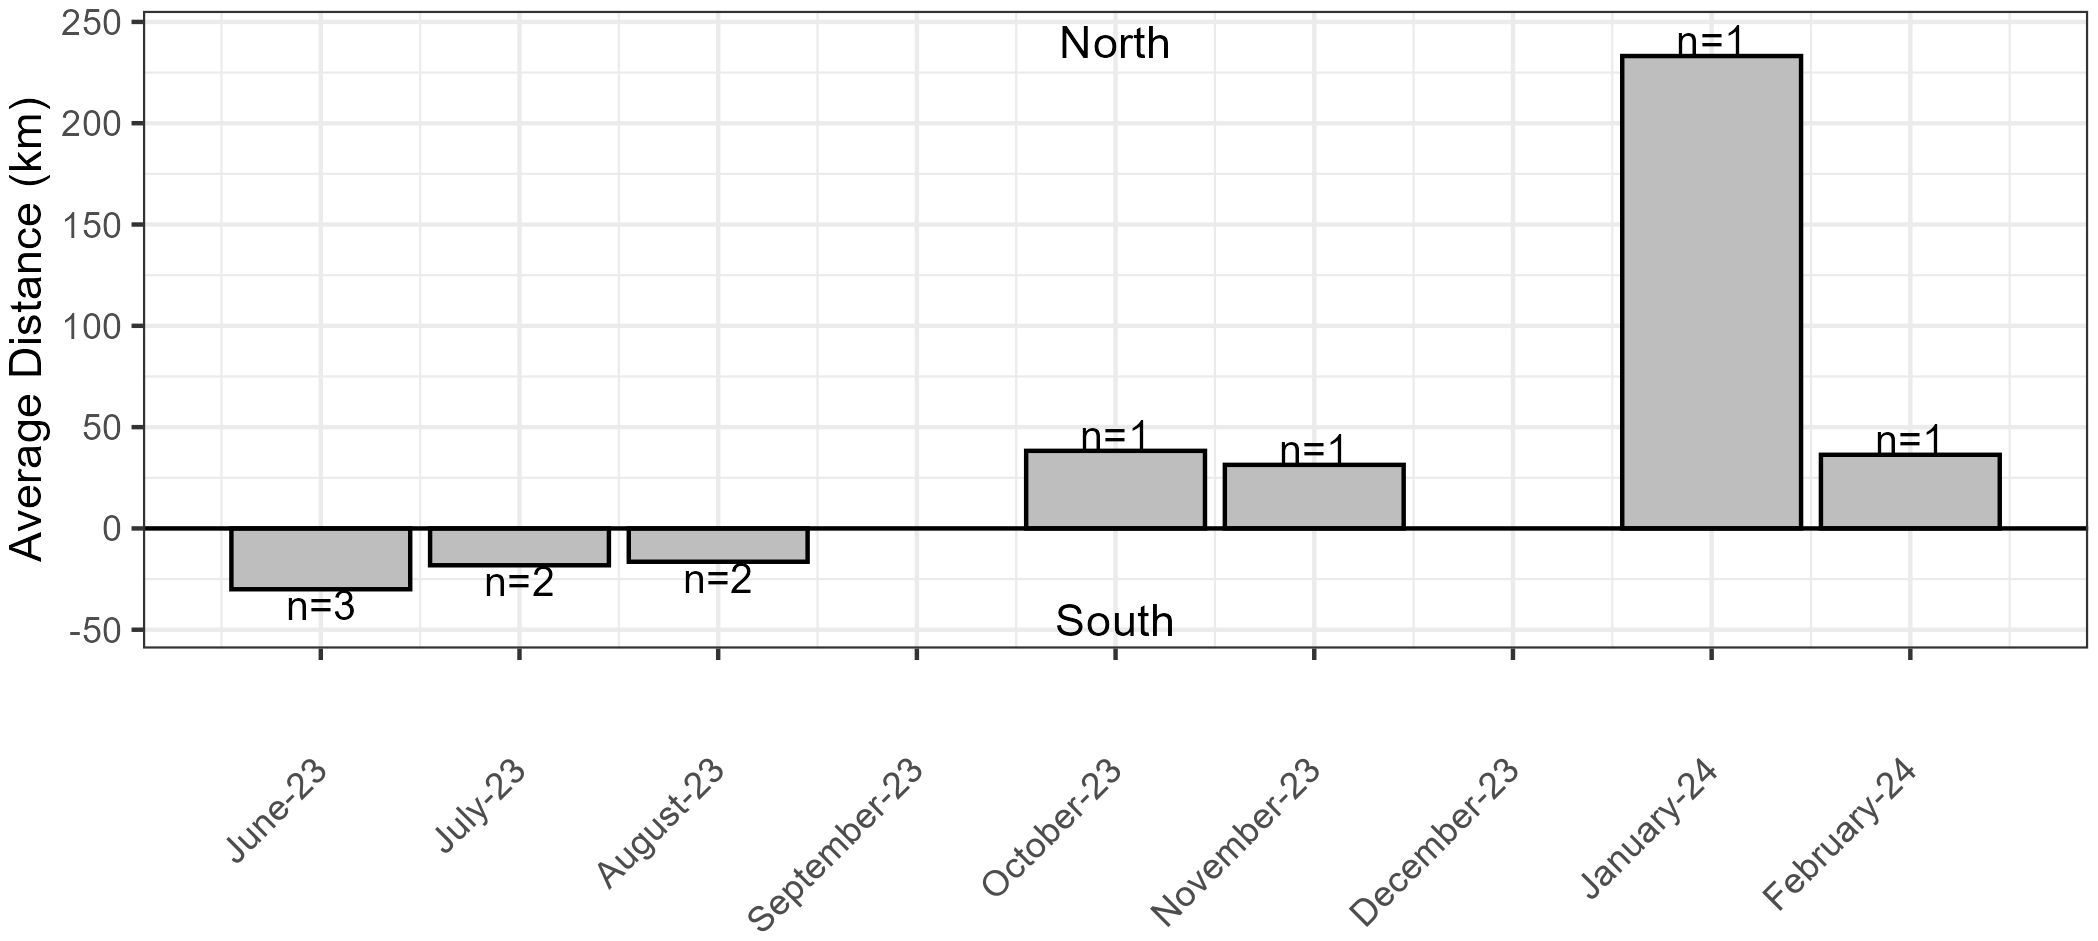
Figure 6. Monthly distance from initial fish release location to the mean location 48 hours prior to first transmission. Positive values indicate northward movement of fish and negative values indicate southward movement.
Our work is the first providing observations into the broad-scale movement of yelloweye rockfish. While previous work suggested some yelloweye rockfish did not remain in small areas studied by acoustic arrays (Reynolds et al., 2010; Hannah and Rankin, 2011; Rankin, 2019), our work provides the first insight into the scale and magnitude of movements undertaken by this species. We found that yelloweye rockfish moved at minimum an average of ~30 km from their release location and are capable of at traveling at least ~230 km, both of which are well outside the protective bounds of the yelloweye rockfish conservation area. Only one fish, 225459, was in the conservation area when its tag shed, but we cannot say they also did not at some point move outside the conservation area. There was no indication that movement was influenced by sex, size or number of days at large. However, tags that shed earlier in the study (within ~80 days of release) were south of the release location whereas tags shed late in the study (over ~100 days of release) were shed north of the release location, suggesting a seasonal component of movement. However, our sample size was small, so interpretations must considered cautiously. Given the small sample size, it is unclear if the individual that went to Washington is an outlier or rather represents a common migratory pathway. Furthermore, it is a possibility, that we may have inadvertently not tagged individuals who are sedentary and remain inside the conservation area.
Conventional geolocation methods for triangulating location from PSATs are not currently applicable to benthic species, and because the geomagnetic data from our tags were problematic, back-in-time particle tracking allowed us to more precisely identify the tag shed location and validate its accuracy with habitat data. The first quality transmission received from Argos satellites usually occurred over sandy muddy bottoms (poor yelloweye rockfish habitat). Backtracking particles provided a drift trajectory of the tag over its two-day capacitor recharge phase, revealing a more likely location for the fish to be when the tag shed, over rocky-bottom (good yelloweye rockfish habitat). Ultimately this suggests backtracking can be an effective tool in understanding where tags were initially shed from fish.
Marine protected areas have been implemented as a conservation strategy to promote the conservation and rebuilding of rockfish stocks (Fisher et al., 2007; Stockhausen and Hermann, 2007). Research has shown that the utility of these reserves is directly related to the size of the home range of the species (Moffitt et al., 2009). This makes these conservation areas highly effective for species with small home ranges, like quillback (Sebastes maliger) and copper (Sebastes caurinus) rockfishes, however, our work indicates that they may be less effective for yelloweye rockfish. Our results suggest that yelloweye rockfish are moving amongst habitats more frequently than previously thought, making them more available to fisheries than previously hypothesized. This is not to say closures are ineffective, but rather the magnitude of the effect is perhaps less than hypothesized. In Oregon, the location and size of the marine protected area created in response to yelloweye rockfish being declared overfished (Stonewall Bank Yelloweye Rockfish Conservation Area) was based on the best available data at the time but was essentially a data-limited decision. In the 20 years since, more data has become available in the form of increased bathymetry data, and subsequently an increased ability to better infer species-habitat associations for yelloweye rockfish in Oregon specifically (Hannah and Blume, 2012; Easton et al., 2015). This, combined with the results from the present study, provide a greater ability to make informed management decisions than was possible when rebuilding began. Incorporating the Stonewall Bank Yelloweye Rockfish Conservation Area into a network of closed areas, as proposed by the Pacific Fisheries Management Council recently, may provide the increased protection needed to expedite the rebuilding of the stock (Pacific Fishery Management Council, 2020).
A key next step in our understanding of this species and how to manage it is determining what factors shape their movement patterns. We were unable to identify sex or size-based differences given our low sample size and restriction of fish lengths that can carry a satellite tag. Additionally, while our work found no statistical relationship between days at large and the distance from release location to shed location, there was a general pattern where tags shed earlier in the season were south of the release location and those shed later were north of the release location. This finding may indicate yelloweye make an annual migration between reefs. If this is indeed the case, a network of closed areas or temporally varying closures may be more effective as a management tool. Regardless of changes to management areas, stock assessment models need to account for the new information. Obviously, our ability to assess this possible temporal component of yelloweye rockfish movement is limited. More insight into yelloweye behavior may be possible through a combination of larger sample size, longer on-fish tagging duration, and tagging fish over a longer time period. Alternatively, routine (weekly to monthly) sampling inside the conservation area using video tools or fishing gear would provide insight into how yelloweye abundance changes in the conservation area over the course of a year.
Surrounding the Stonewall Bank Yelloweye Rockfish Conservation Area are many other large rocky reefs (e.g., Heceta, Daisy Banks, etc). Fishermen have long suspected that yelloweye rockfish make directed movements between reefs (pers comm. J. Wagner) and our findings appear to support this. Additionally, current work by others (pers comm. M. Johnson) is finding evidence that yelloweye rockfish habitat has oceanographic associations rather than just topographic associations and therefore is more dynamic than previously hypothesized. Together these may explain the movement patterns we are seeing if yelloweye rockfish are moving to remain in areas with certain oceanographic characteristics. However, more studies are needed to better quantify the scale and drivers of the movement patterns we observed, especially studies which collect data throughout the duration the fish is tagged.
In summary, we demonstrated the value of unique applications of existing technology to learn more about rockfishes generally. Our work suggests that yelloweye rockfish make more extensive movements than were predicted by theory and, therefore, the yelloweye rockfish conservation area may not be as effective as intended to rebuild yelloweye rockfish. However, our sample size is low due to technological constraints, and our data was limited to fish tagged in a relatively small spatial and temporal range. Future work with larger sample sizes could be conducted across the species’ broader range, and over a broader timescale to better understand the great variability in behavior shown by rockfishes and their implications in management.
The raw data supporting the conclusions of this article will be made available by the authors, without undue reservation.
The animal study was approved by Oregon Department of Fish and Wildlife’s Veterinary Staff. The study was conducted in accordance with the local legislation and institutional requirements.
LR: Conceptualization, Data curation, Formal analysis, Funding acquisition, Investigation, Methodology, Visualization, Writing – original draft, Writing – review & editing. MB: Conceptualization, Methodology, Writing – review & editing, Formal analysis, Visualization. KL: Conceptualization, Formal analysis, Methodology, Visualization, Writing – review & editing. BL: Formal analysis, Writing – review & editing. CE: Formal analysis, Writing – review & editing. MT: Formal analysis, Methodology, Writing – review & editing. AA: Formal analysis, Methodology, Writing – review & editing. AM: Investigation, Writing – review & editing. BL: Investigation, Writing – review & editing. TC: Investigation, Writing – review & editing.
The author(s) declare financial support was received for the research, authorship, and/or publication of this article. Funding for satellite tags was provided by the Pacific States Marine Fisheries Commission. All other vessel costs and satellite transmission costs were covered using Oregon Department of Fish and Wildlife base funding.
Tagging was conducted aboard the CPFV Enterprise operated by Captain Dave DeBelloy.
The authors declare that the research was conducted in the absence of any commercial or financial relationships that could be construed as a potential conflict of interest.
The author(s) declare that no Generative AI was used in the creation of this manuscript.
All claims expressed in this article are solely those of the authors and do not necessarily represent those of their affiliated organizations, or those of the publisher, the editors and the reviewers. Any product that may be evaluated in this article, or claim that may be made by its manufacturer, is not guaranteed or endorsed by the publisher.
The Supplementary Material for this article can be found online at: https://www.frontiersin.org/articles/10.3389/fmars.2025.1539206/full#supplementary-material
Butler J., Love M. S., Laidig T. E. (2012). A guide to the rockfishes, thornyheads and scorpionfishes of the Northeast Pacific. (Berkeley and Los Angeles: University of California Press).
Cadrin S. X., Kerr L. A., Mariani S. (2013). Stock identification methods: applications in fishery science. (Burlington: Elsevier Academic Press).
Carlisle A., Litvin S., Hazen E., Madigan D., Goldman K., Lea R., et al. (2015). Reconstructing habitat use by juvenile salmon sharks links upwelling to strandings in the California Current. Mar. Ecol. Prog. Ser. 525, 217–228. doi: 10.3354/meps11183
Cooke S. J., Bergman J. N., Twardek W. M., Piczak M. L., Casselberry G. A., Lutek K., et al. (2022). The movement ecology of fishes. J. Fish Biol. 101, 756–779. doi: 10.1111/jfb.15153
Crossin G. T., Heupel M. R., Holbrook C. M., Hussey N. E., Lowerre-Barbieri S. K., Nguyen V. M., et al. (2017). Acoustic telemetry and fisheries management. Ecol. Appl. 27, 1031–1049. doi: 10.1002/eap.1533
Dagestad K.-F., Röhrs J., Breivik Ø., Ådlandsvik B. (2017). OpenDrift v1.0: a generic framework for trajectory modeling. doi: 10.5194/gmd-2017-205
Easton R. R., Heppell S. S., Hannah R. W. (2015). Quantification of habitat and community relationships among nearshore temperate fishes through analysis of drop camera video. Mar. Coast. Fish 7, 87–102. doi: 10.1080/19425120.2015.1007184
Fisher R., Sogard S., Berkeley S. (2007). Trade-offs between size and energy reserves reflect alternative strategies for optimizing larval survival potential in rockfish. Mar. Ecol. Prog. Ser. 344, 257–270. doi: 10.3354/meps06927
Gertseva V., Cope J. M. (2017). Stock assessment of the yelloweye rockfish (Sebastes ruberrimus) in state and Federal waters off California, Oregon and Washington. Portland, OR: Pacific Fishery Management Council. 293.
Goldfinger C., Henkel S., Romsos C., Havron B. (2014). “Benthic habitat characterization offshore the Pacific Northwest volume 1: evaluation of continental shelf geology,” in U.S. Department of the interior, bureau of ocean energy management, pacific outer continental shelf region, OCS study BOEM 2014-662 (Camarillo, California: US Department of the Interior Bureau of Ocean Energy Management).
Green K., Starr R. (2011). Movements of small adult black rockfish: implications for the design of MPAs. Mar. Ecol. Prog. Ser. 436, 219–230. doi: 10.3354/meps09263
Hammerschlag N., Gallagher A. J., Lazarre D. M. (2011). A review of shark satellite tagging studies. J. Exp. Mar. Biol. Ecol. 1–8. doi: 10.1016/j.jembe.2010.12.012
Hannah R. W., Blume M. T. O. (2012). Tests of an experimental unbaited video lander as a marine fish survey tool for high-relief deepwater rocky reefs. J. Exp. Mar. Biol. Ecol. 430–431, 1–9. doi: 10.1016/j.jembe.2012.06.021
Hannah R. W., Rankin P. S. (2011). Site fidelity and movement of eight species of pacific rockfish at a high-relief rocky reef on the oregon coast. N Am. J. Fish Manag 31, 483–494. doi: 10.1080/02755947.2011.591239
Hannah R. W., Rankin P. S., Blume M. T. O. (2012). Use of a novel cage system to measure postrecompression survival of northeast pacific rockfish. Mar. Coast. Fish 4, 46–56. doi: 10.1080/19425120.2012.655849
Klimley P., Flagg M., Hammerschlag N., Hearn A. (2017). The value of using measurements of geomagnetic field in addition to irradiance and sea surface temperature to estimate geolocations of tagged aquatic animals. Anim. Biotelemetry 5:1–22. doi: 10.1186/s40317-017-0134-y
Love M. S., Yoklavich M. M., Thorsteinson L. (2002). The rockfishes of the northeast pacific (Berkeley California: University of California Press).
Moffitt E. A., Botsford L. W., Kaplan D. M., O’Farrell M. R. (2009). Marine reserve networks for species that move within a home range. Ecol. Appl. 19:1835–1847. doi: 10.1890/08-1101.1
Nielsen J. L. (Ed.) (2009). Tagging and tracking of marine animals with electronic devices (Dordrecht: Springer).
North E. W., Gallego A., Petitgas P. (2009). Manual of recommended practices for modelling physical-biological interactions during fish early life (Copenhagen: Internat. Council for the Exploration of the Sea).
O’Connell V. M., Carlile D. W. (1994). Habitat-specific density of adult yelloweye rockfish Sebastes ruberrimus in the eastern Gulf of Alaska. Fish Bull. 91, 304–309.
Pacific Fishery Management Council (2008). Pacific coast groundfish fishery management plan for the california, oregon and washington groundfish fishery as amendeded through amendment, Vol. 19 (Portland, OR: Pacific Fishery Management Council).
Pacific Fishery Management Council (2020). Pacific coast groundfish fishery management plan for the california, oregon and washington groundfish fishery (Portland, OR: Pacific Fishery Management Council).
Pearson K. E., Gunderson D. R. (2003). Reproductive Biology and Ecology of Shortspine Thornyhead Rockfish, Sebastolobus alascanus, and longspine thornyhead rockfish, S. altivelis, from the northeastern Pacific Ocean. Environ. Biol. Fish 67, 117–136. doi: 10.1023/A:1025623426858
Pittman S. J., Monaco M. E., Friedlander A. M., Legare B., Nemeth R. S., Kendall M. S., et al. (2014). Fish with chips: tracking reef fish movements to evaluate size and connectivity of caribbean marine protected areas. PloS One 9, e96028. doi: 10.1371/journal.pone.0096028
Rankin P. S. (2019). Summary of Yelloweye Rockfish (Sebastes ruberrimus) acoustic telemetry conducted at Stonewall Bank from 2005-2013.
R Core Team (2023). R: A language and environment for statistical computing. R Foundation for statistical computing(Vienna, Austria). Available at: https://www.R-project.org.
Reynolds B. F., Powers S. P., Bishop M. A. (2010). Application of acoustic telemetry to assess residency and movements of rockfish and lingcod at created and natural habitats in prince william sound. PloS One 5:e12130. doi: 10.1371/journal.pone.0012130
Robusto C. C. (1957). The cosine-haversine formula. Am. Math. Monthly 64:38–40. doi: 10.2307/2309088
Sippel T., Paige Eveson J., Galuardi B., Lam C., Hoyle S., Maunder M., et al. (2015). Using movement data from electronic tags in fisheries stock assessment: A review of models, technology and experimental design. Fish Res. 163, 152–160. doi: 10.1016/j.fishres.2014.04.006
Stockhausen W. T., Hermann A. J. (2007). “Modeling larval dispersion of rockfish: A tool for marine reserve design,” in Biology, assessment, and management of North Pacific rockfishes, 251–273. (Juneau: Alaska Sea Grant Program).
Teo S. L., Boustany A., Blackwell S., Walli A., Weng K. C., Block B. A. (2004). Validation of geolocation estimates based on light level and sea surface temperature from electronic tags. Mar. Ecol. Prog. Ser. 283, 81–98. doi: 10.3354/meps283081
Keywords: overfished, rockfish, movement, home range, MPA, tagging, yelloweye rockfish
Citation: Rasmuson LK, Blume MTO, Lawrence KA, Laughlin BM, Edwards CA, Terwilliger MR, Ayrea AC, McInturf AG, Legare BJ and Chapple TK (2025) Routine large-scale movements of the yelloweye rockfish (Sebastes ruberrimus). Front. Mar. Sci. 12:1539206. doi: 10.3389/fmars.2025.1539206
Received: 04 December 2024; Accepted: 03 February 2025;
Published: 27 February 2025.
Edited by:
Shawn Elizabeth Larson, Seattle Aquarium, United StatesReviewed by:
Matteo Zucchetta, National Research Council (CNR), ItalyCopyright © 2025 Rasmuson, Blume, Lawrence, Laughlin, Edwards, Terwilliger, Ayrea, McInturf, Legare and Chapple. This is an open-access article distributed under the terms of the Creative Commons Attribution License (CC BY). The use, distribution or reproduction in other forums is permitted, provided the original author(s) and the copyright owner(s) are credited and that the original publication in this journal is cited, in accordance with accepted academic practice. No use, distribution or reproduction is permitted which does not comply with these terms.
*Correspondence: Leif K. Rasmuson, bGVpZi5rLnJhc211c29uQG9kZncub3JlZ29uLmdvdg==
†These authors have contributed equally to this work and share first authorship
Disclaimer: All claims expressed in this article are solely those of the authors and do not necessarily represent those of their affiliated organizations, or those of the publisher, the editors and the reviewers. Any product that may be evaluated in this article or claim that may be made by its manufacturer is not guaranteed or endorsed by the publisher.
Research integrity at Frontiers
Learn more about the work of our research integrity team to safeguard the quality of each article we publish.