
95% of researchers rate our articles as excellent or good
Learn more about the work of our research integrity team to safeguard the quality of each article we publish.
Find out more
ORIGINAL RESEARCH article
Front. Mar. Sci. , 04 April 2025
Sec. Physical Oceanography
Volume 12 - 2025 | https://doi.org/10.3389/fmars.2025.1533191
Xisha sea area features rough bathymetry and complex hydrological environment, acting as an important baroclinic source and sink in the northwestern South China Sea. To investigate the impacts of Xisha topography on the local generation of internal solitary waves (ISWs) and on the propagation of the far-field ISWs, an idealized 2D non-hydrostatic model ORCTM with a very-high resolution was employed to reveal the mechanisms. The result of this study shows that the shallow-water sill of the Xisha Islands, i.e., seamount Panshi-Yu, can generate first- and second-mode ISWs through the internal tidal beam mechanism, as well as second-mode ISWs via the lee-wave mechanism. As is reported previously, Zhongsha Islands could be a far-field source for ISWs in the Xisha sea area. While approaching the shallow-water sill of the Xisha Islands, those far-field first-mode ISWs undergo amplitude reduction and significant phase shift because of their collision with local generated ISWs in the Xisha sea area, while their phase speed increases and decreases due to the increase and decrease of the water depth, respectively. Finally, the far-field ISWs convert into second-mode convex ISWs over the shallow-water sill of the Xisha Islands. This study suggests that rough topography is crucial in the formation of the complicated multimodal internal wave field in the Xisha sea area.
Internal solitary waves (ISWs), which normally occur in the stratified ocean, are a kind of strongly nonlinear and large-amplitude oceanic dynamical process with ubiquitous distribution in the worldwide marginal and shelf sea, and have a large impact on the material transport and energy cascade in the ocean (Osborne and Burch, 1980; Grimshaw et al., 2010). ISWs can change the propagation of acoustic signals in the seawater (Apel et al., 2007; Li et al., 2023), trigger intense turbulent mixing (Sandstrom et al., 1989; Moum et al., 2003; Lamb, 2014), and influence the primary productivity of the ocean (Wang et al., 2007; Feng et al., 2023). The strong horizontal current sheer caused by ISWs also threaten the navigation safety of underwater vehicles and affect marine engineering such as offshore oil platforms (Cai et al., 2003; Qiu et al., 2023). Therefore, it is essential to improve the understanding of the hydrodynamic characteristics of ISWs.
The South China Sea (SCS) is one of the sea areas where ISWs occur most frequently in the global oceans. The ISWs in the northern SCS have been extensively investigated by means of in-situ observations (Ramp et al., 2004; Huang et al., 2016; Xu and Chen, 2021), satellite remote sensing analyses (Zhao et al., 2004; Liu and Hsu, 2004) and numerical simulations (Buijsman et al., 2010; Vlasenko et al., 2010; Zeng et al., 2019; Davis et al., 2020). Baroclinic energies generated at the Luzon Strait propagate across the central deep basin of SCS, Zhongsha and Xisha Islands before they arrive at the Vietnam Coast (Zhao, 2014; Xu et al., 2016). As previous research presented, Xisha sea area is an important source (Liang et al., 2019; Jia et al., 2021, 2023) and sink (Yan et al., 2020) of baroclinic energy in the northwestern SCS. What kind of evolution processes those far-field internal waves may undergo in the Xisha sea area is still unknown. However, for the water depth around Zhongsha Islands and Xisha Islands are relatively deep and the amplitude of ISWs in this area are smaller than those in the northern SCS, the in-situ observations focusing on ISWs in this area are sparse. Hence, compared to studies of ISWs in the northern SCS (Guo and Chen, 2014; Alford et al., 2015), ISWs in the northwestern SCS, especially in the Xisha sea, have not received comparable attention.
Xisha sea area, characterized by complex seabed topography, fosters a rich tapestry of multi-scale oceanic dynamical processes including barotropic tides, currents driven by monsoon, internal waves, and remotely generated mesoscale eddies (Wang et al., 2003; Nan et al., 2011; Xu et al., 2016; Zhao et al., 2018; Yan et al., 2020; Shu et al., 2022). The interactions between internal waves and other oceanic dynamic processes are active in this area. These interactions near Xisha Islands are special and important in the marine dynamics of SCS because they rely on the changes of the complex internal waves field under the modulation of the tough bottom bathymetry, which might trigger intense turbulent mixing. Thus, it is indispensable to figure out the evolution of internal waves under the impacts of varying topography.
The bathymetric distribution around the Xisha sea area is displayed in Figure 1. The Xisha Islands, which are located to the west of the Zhongsha Islands, span a large area in both meridional and zonal directions and have numerous seamounts. The topography of the Xisha Islands varies significantly along different transections, which implies that there may be multiple sources, various generation mechanisms and complex interactions of ISWs in these regions.
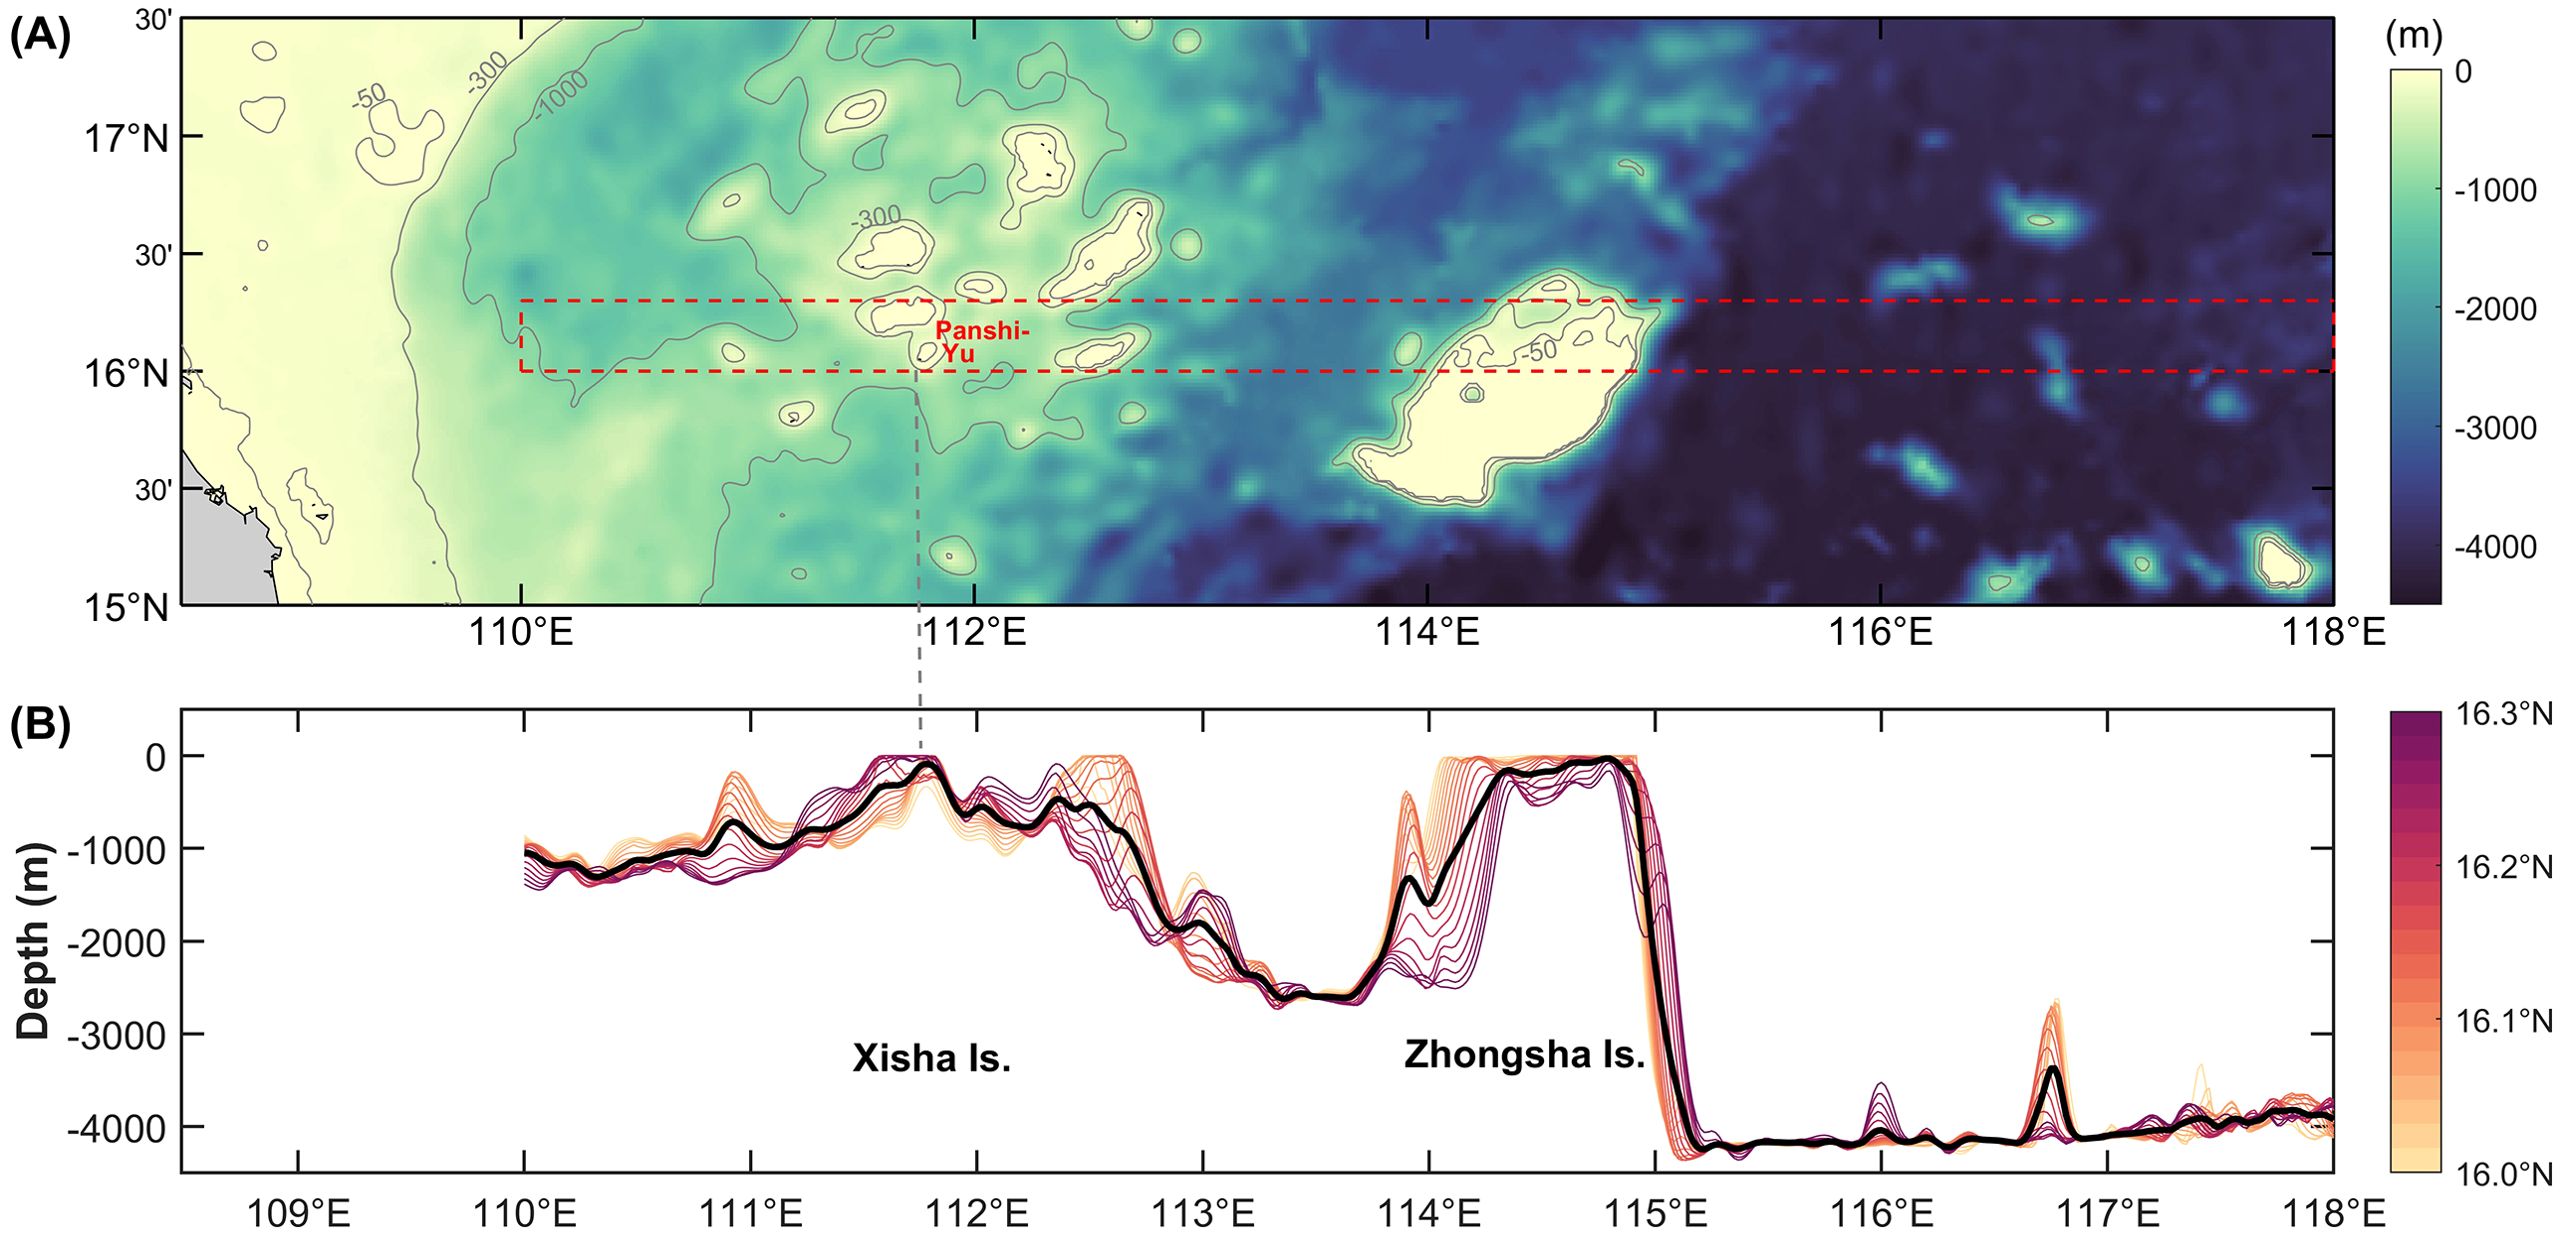
Figure 1. (A) Bathymetric distribution around the Xisha sea area. The topographic data is taken from ETOPO1 Global Relief Model (2011). The red dashed box (110.0-118.0°E, 16.0-16.3°N) in upper panel indicates the model domain. (B) The zonal transections of bathymetry at 1’ intervals in the zonal direction in the model domain. Bold black line denotes the averaged bathymetry of all zonal transections of bathymetry.
Li et al. (2011) noticed ISWs propagating toward the Vietnam continental shelf in the regions west of the Xisha Islands from a remote sensing perspective, and revealed that the topography of the Zhongsha Islands can generate westward propagating ISWs through non-hydrostatic 2D numerical experiments; Wang et al. (2013) compiled more than 2500 satellite remote sensing images and analyzed more than 3500 wave trains of ISWs in the SCS, and found that the waves propagating to the coast of Vietnam are ubiquitous in the region west of the Xisha Islands.
For the shoreward propagating ISWs on the continental shelf northwest of the Xisha Islands, Liang et al. (2019) and Jia et al. (2021, 2023) suggested that the internal tidal beam excited from sills of the Xisha Islands interacts with the thermocline to form a depression wave, which undergoes nonlinear steepening and transforms into internal wave trains while propagating northwestwards to regions near the shelf break. This mechanism is termed as internal tidal beam mechanism (Gerkema, 2001; Grisouard et al., 2011). However, given the two numerical studies mentioned above have not included other possible sources of ISWs like the Zhongsha Islands and Luzon Strait in the simulation domain, the far-field ISWs are not considered. Hence, the present understandings toward the multi-source internal wave fields in the Xisha sea area are still limited.
Summarily speaking, previous studies on ISWs in the northwestern SCS mainly focused on the sources of shoreward ISWs in the areas west and northwest of the Xisha Islands and the generation mechanism of westward propagating ISWs originated from the Zhongsha Islands. However, so far there has been no study on the influence of the topography of the Xisha Islands on the far-field ISWs across the northwestern SCS, which may include two aspects: (1) Will the topography of the Xisha Islands generate ISWs locally? If yes, how will the local-generated ISWs evaluate in the Xisha sea area? Will they interact with the far-field ISWs in the propagating process? (2) How will the far-field ISWs be affected by the variable topography of the Xisha Islands?
To address the questions above, a typical zonal transection (the same as in Li et al., 2011) is selected, mainly taking the Panshi-Yu terrain of the Xisha Islands as an example to investigate the physical mechanism in how the variable Xisha topography affects the far-field ISWs through a series of idealized 2D non-hydrostatic numerical simulation experiments. The structure of this paper is organized as follows: section 2 introduces the employed numerical model as well as exhibits model setting and model validation, followed by analyses of results in section 3 and conclusions in section 4.
To simulate the dynamics of ISWs, a nonlinear and non-hydrostatic oceanic regional circulation and tide model (ORCTM) is adopted in this paper (Huang et al., 2023). ORCTM is based on the Navier-Stokes equations, utilizing Boussinesq approximation and incompressible conditions. The orthogonal curvilinear Arakawa-C grid is supported horizontally and z-coordinate is supported vertically. A non-hydrostatic approximation module is implemented to reproduce fine structures in the ocean such as nonlinear internal waves (Huang et al., 2023; Huang H. et al., 2024).
The main configurations of the 2D numerical experiments in this paper are similar to Li et al. (2011). The model topography data are obtained from ETOPO1 Global Relief Model (2011) with a spatial resolution of 1’ (Amante and Eakins, 2009). The spatial extent of model domain is 110.0-118.0°E, 16.0-16.3°N, shown in the red dashed box in Figure 1A. The zonal topographic transection of 2D numerical standard experiment (EXP_std) is obtained through averaging the bathymetry meridionally (Table 1; Figure 1B). It can be seen from Figure 1 that the model domain includes the topography of the Xisha Islands, the Zhongsha Islands and the deep-sea basin to the east of the Zhongsha Islands. The topography of the Xisha Islands is relatively complex, and we mainly focus on the role of the topography of seamount Panshi-Yu in this paper. Since the water depth of most part of the deep-sea basin east of the Zhongsha Islands is deeper than 4000 m, the effects of the slight variations of bottom topography on the ISWs are negligible. Therefore, we set the bathymetry east of the Zhongsha Islands as 4200 m in the experiments (Figure 2A). In the selected transection the highest sill, or the shallow-water sill, of the Xisha Islands is recorded as sill a, which refers to the seamount Panshi-Yu, and its water depth is 90.6 m. The west and east sill of the Zhongsha Islands is recorded as sill b and sill c, respectively, and their water depth is 157.1 m and 32.9 m, respectively.
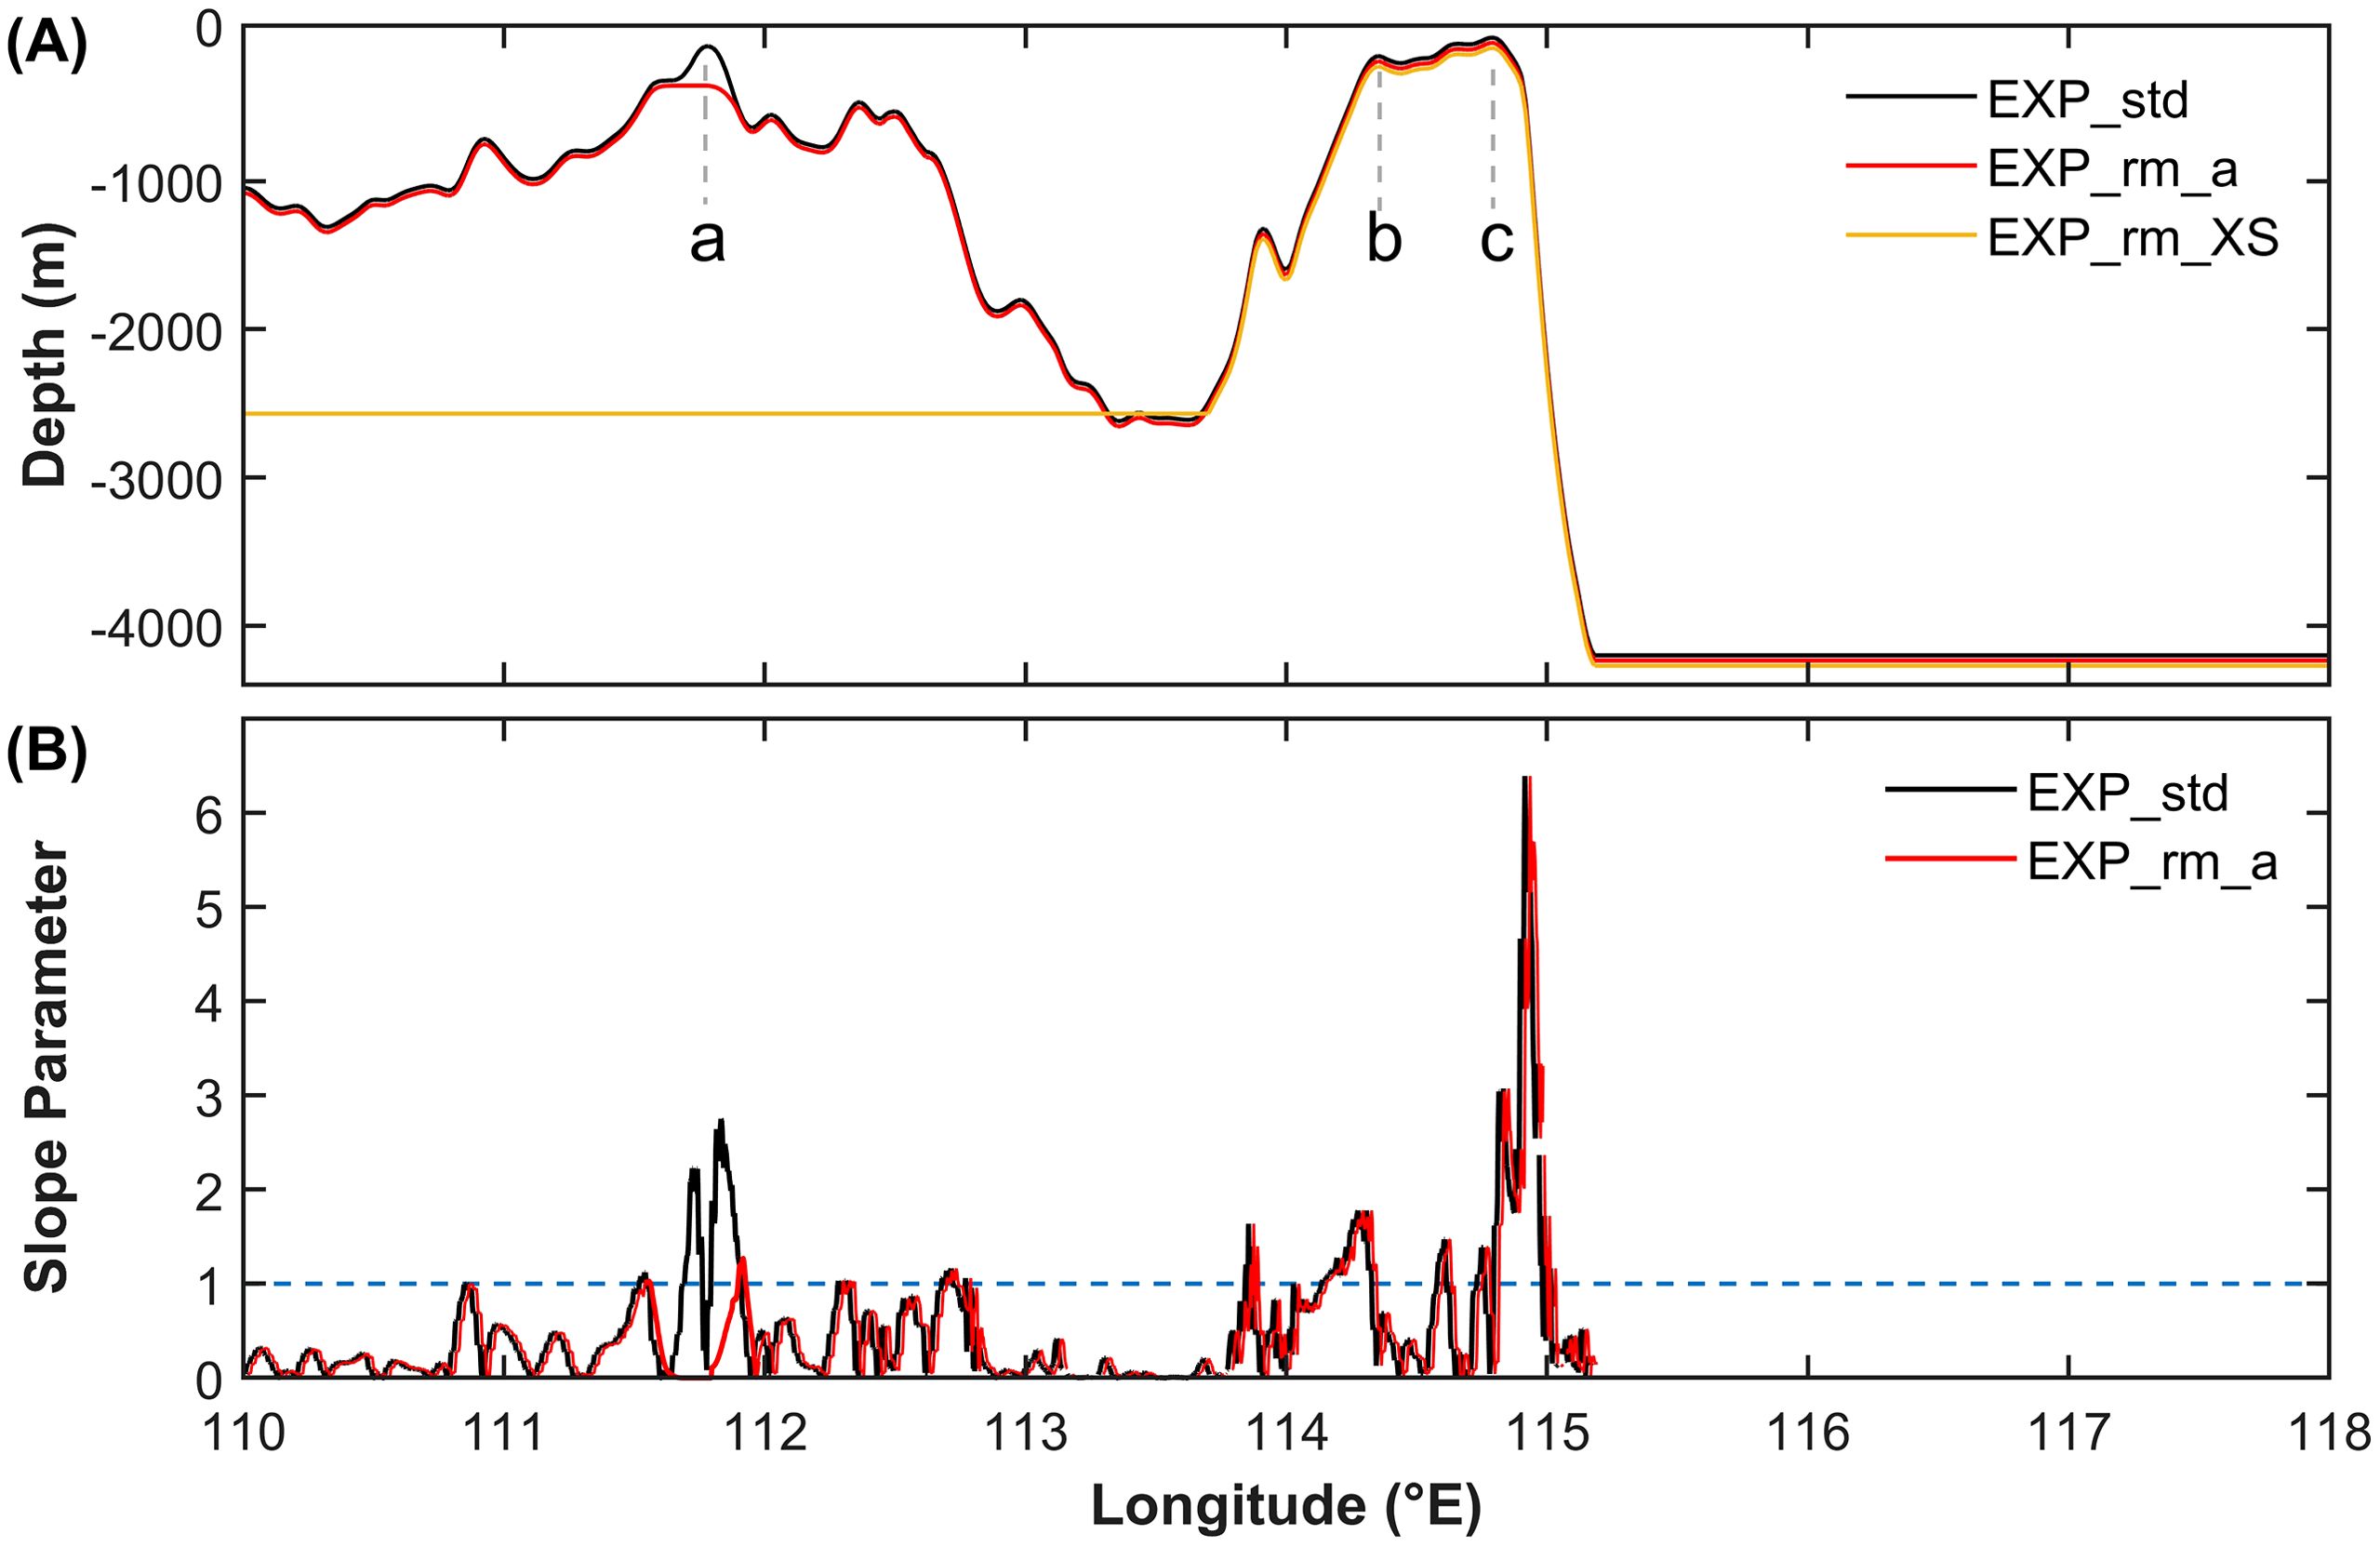
Figure 2. Topography (A) and slope parameter (B) of the model domain. Sill a, b, c is denoted using a, b, c in (A), respectively. The blue dashed line in (B) is the critical value of slope parameter.
Three experimental cases are designed in this study (Table 1). As the generation source of far-field ISWs set in these experiments, Zhongsha topography is of the same among the three cases. In addition to the standard experiment (EXP_std), two other sets of topographic sensitivity experiments are undertaken in this paper, whose topographic distributions are shown in Figure 2A. In the experiment irrespective of sill a (EXP_rm_a), sill a of the Xisha Islands is removed from topography of case EXP_std. In the experiment irrespective of the Xisha Islands topography (EXP_rm_XS), the water depth west of the Zhongsha Islands is set to 2500 m, which is the same as the typical topographic transection chosen by Li et al. (2011). To measure the steepness of the terrain, we introduce the dimensionless slope parameter , which is the ratio of the slope of the topography to the slope of the internal tidal beam , where h is the topographic height, x is the horizontal coordinate, is the frequency of barotropic tide, f is Coriolis parameter, and N is the buoyancy frequency of the local regions. Shaw et al. (2009) suggested that only for can the internal tidal beams be emanated. The distributions of the slope parameter on the simulated transection for case EXP_std and case EXP_rm_a are shown in Figure 2B, and it can be seen in case EXP_rm_a that the maximum value of the slope parameter near sill a of the Xisha Islands decreases approximately to 1 after removing the shape of sill a.
The horizontal grid resolution in the inner zone of the model domain is 250 m. The time-step is set as 10 s to satisfy the Courant-Friedrichs-Lewy (CFL) condition. There are 420 layers vertically, and the thickness of each layer is 10 m. To prevent the reflection of the internal wave signals at the boundaries, 25 grids have been set up as sponge boundary layer at both open boundaries, with a resolution of 1200 m each, and the total thickness of the sponge boundary layer at each side is 30 km.
The initial field of stratification are horizontally homogeneous. The profile of temperature, salinity, and squared buoyancy frequency (shown in Figure 3) used as the initial conditions and boundary conditions of the model, are derived from World Ocean Atlas (2018) summer data (Garcia et al., 2019) through horizontally averaging. The initial field of horizontal and vertical velocity are set as zeros. In addition, Li et al. (2011) conducted sensitivity experiments forced by different tidal harmonics and found that at the Zhongsha Islands the ISWs generated by semidiurnal harmonic tidal flow are significantly stronger than those generated by diurnal one, and the nonlinear interaction between diurnal and semidiurnal harmonic tidal flow have little effect on the ISWs. That is why we choose the zonal velocity of M2 semidiurnal constituent to drive the model at the east open boundary. The M2 zonal tidal forcing at the east boundary, whose amplitude is set up as 0.0375 m s-1 according to TPXO 10 dataset (Egbert and Erofeeva, 2002), varies in the form of sine temporally. The tidal forcing and stratification at the boundary impact the inner zone of the model domain via relaxation open boundary conditions (Zhang et al., 2011), wherein the sponge thickness is 30 km and the damping time scale is set to 500 s. The modified PP81 parameterization scheme (Pacanowski and Philander, 1981) is implemented in the simulation, and the adjustable parameter for the vertical eddy viscosity and for the vertical eddy diffusivity are set to and m2 s-1, respectively; both the bottom friction and the bottom drag coefficients are set as (Marsland et al., 2003; Huang et al., 2023). The configurations of the three experimental cases are identical except for the topography (Table 1).
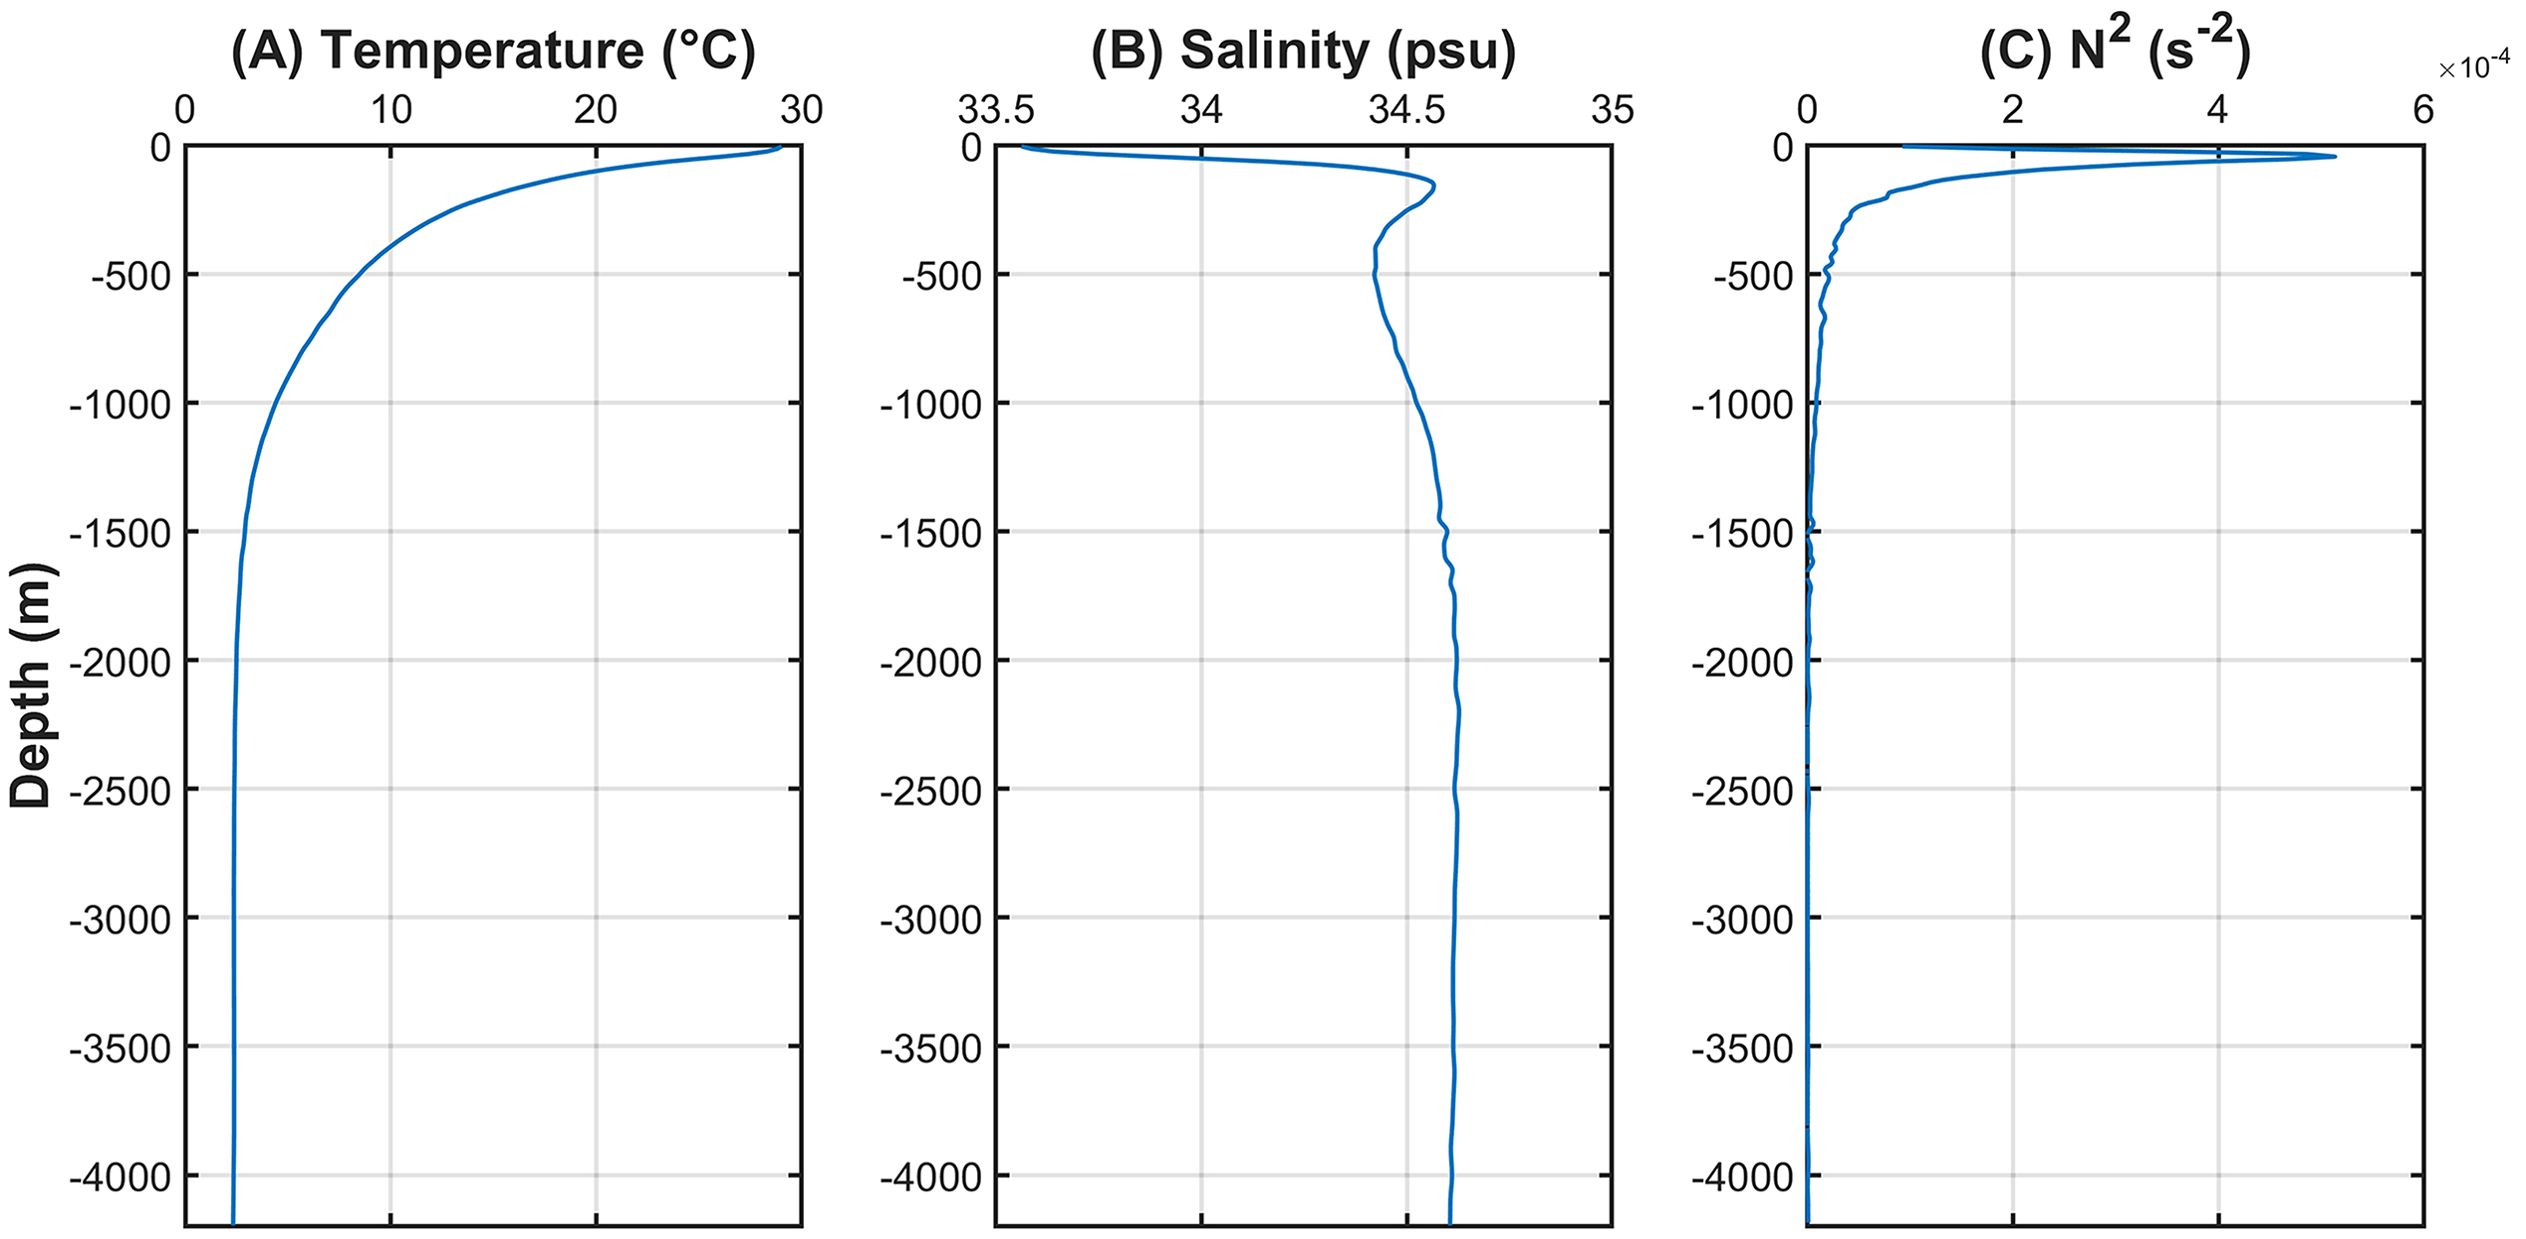
Figure 3. Profiles of horizontal-averaged initial field for the model including (A) temperature, (B) salinity and (C) buoyancy frequency squared are derived from World Ocean Atlas (2018) summer data in the model domain (110.0-118.0°E, 16.0-16.3°N).
The model validations are as follows:
Firstly, we compare the ISWs generation and propagation process obtained from the experiment irrespective of the Xisha Islands topography (EXP_rm_XS) with the results of Li et al. (2011) (Figure 4). Figures 4A–D are the wave fields reproduced by ORCTM. Figures 4E–H show the wave fields reproduced by Li et al. (2011) through MITgcm. The ISWs simulated by MITgcm and ORCTM can approximately reach the similar location at the same time, and their amplitudes are in good agreement by the time of 33 h.
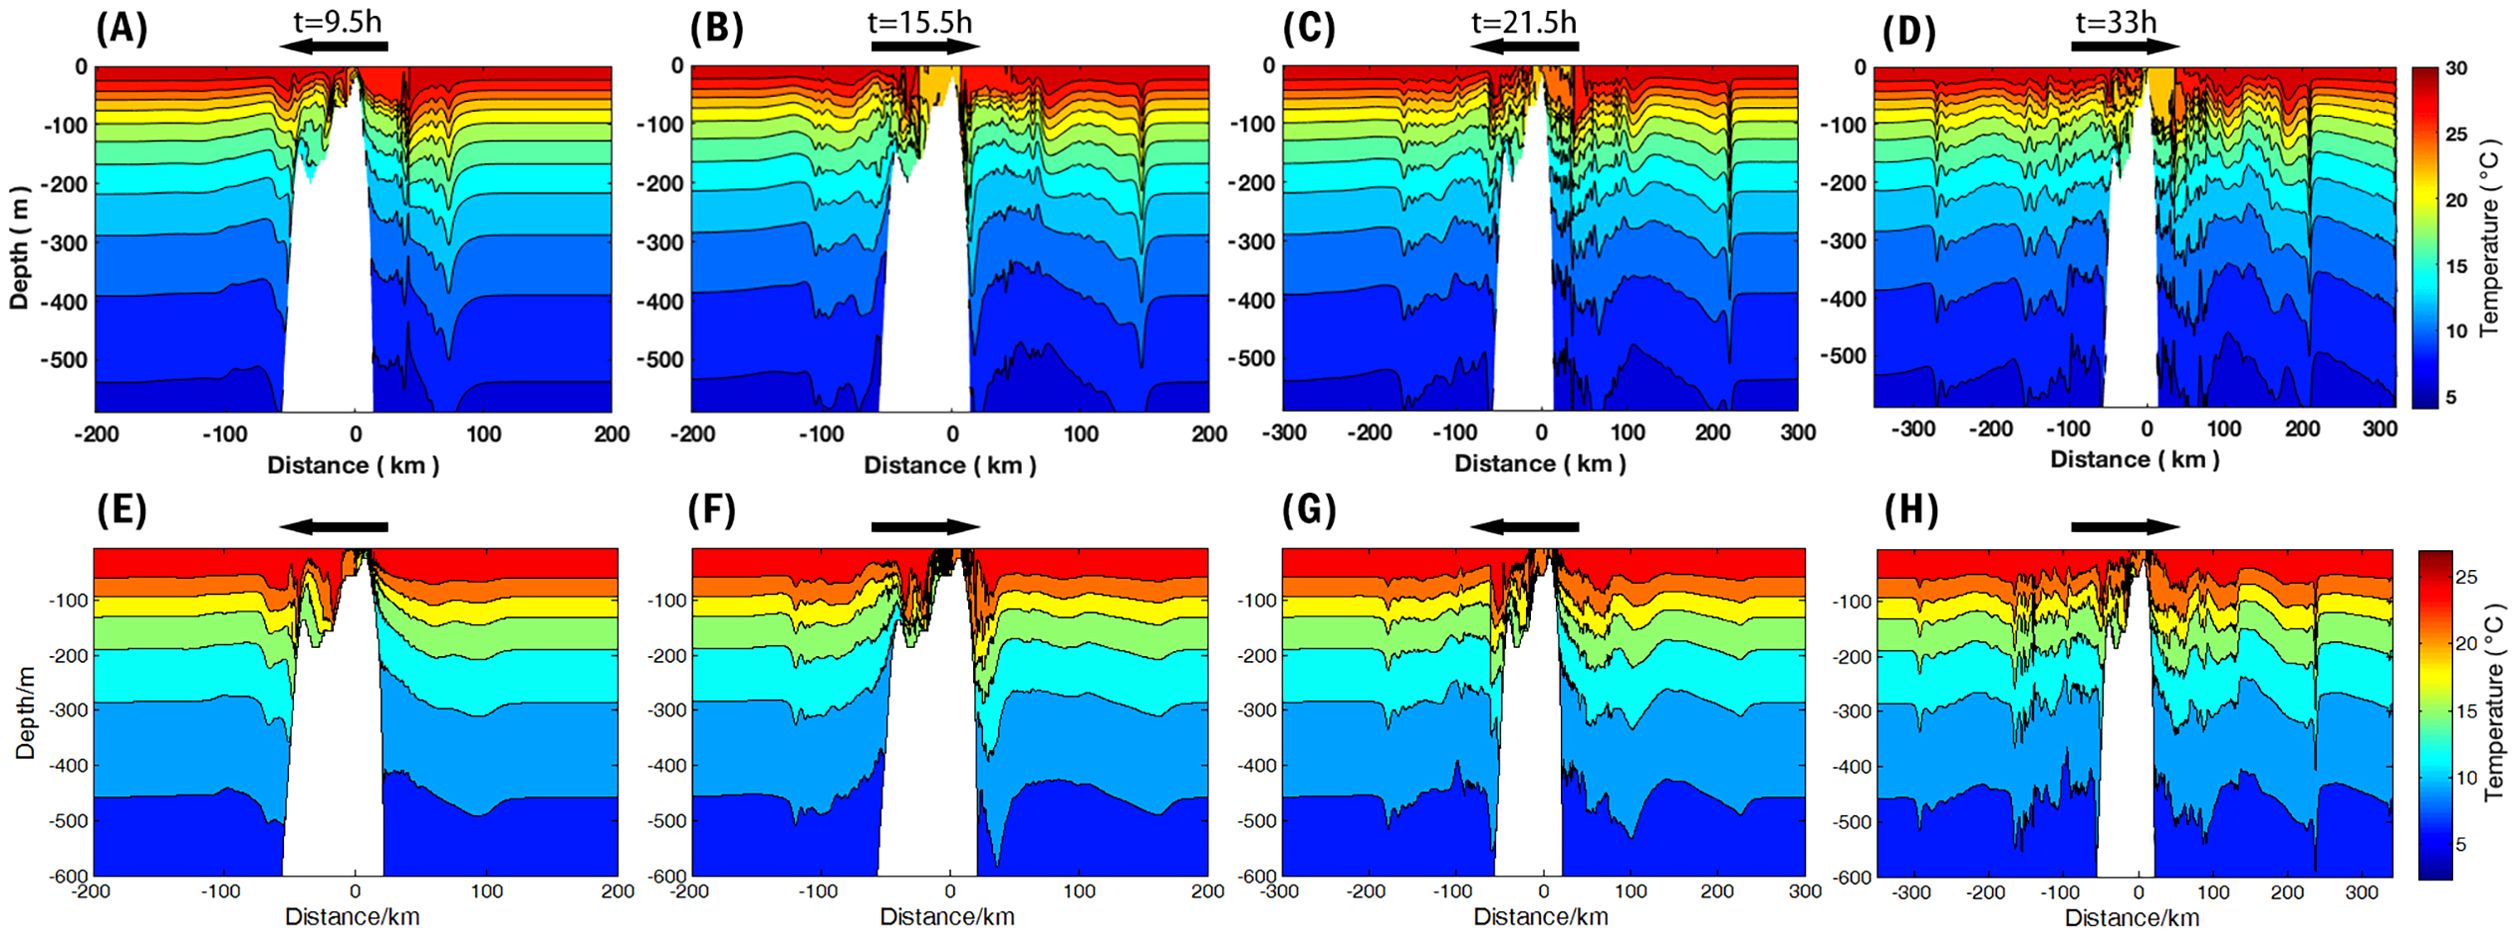
Figure 4. Comparison of isotherms between the result of case EXP_rm_XS (A–D) and Li et al. (2011) (E–H). The black arrows indicate the tidal direction. (A, E), (B, F), (C, G) and (D, H) denotes 9.5 h, 15.5 h, 21.5 h and 33.0 h, respectively.
In addition, the amplitude of zonal barotropic velocity of M2 constituent obtained from the model results through tidal harmonic analysis is compared with harmonic constants derived from TPXO 10 dataset (Egbert and Erofeeva, 2002). As the bathymetry data used for TPXO 10 data set is different from that used in these ORCTM experiments, the tidal parameter extracted in regions shallower than 100m may deviate with each other. Hence, the midpoint of the line connecting the west sill (sill b) and the east sill (sill c) of the Zhongsha Islands (114.5875°E, 16.15°N) is employed to validate the model result. The modeled and TPXO 10 derived velocity amplitudes are 0.9134 m s-1 and 0.9031 m s-1, respectively, which are in well agreement.
Furthermore, we compare the number of solitary waves in the first-mode wave package near the western boundary of the model domain in case EXP_std, case EXP_rm_a and case EXP_rm_XS (shown in Supplementary Figure 1). Wave trains west of Xisha Islands simulated by the experiments taking the Xisha topography into consideration (EXP_std and EXP_rm_a) turn out to contain about 5 solitons, whereas those simulated by the experiment irrespective of the Xisha topography (EXP_rm_XS) turn out to contain about 3 solitons. Comparing with the internal wave trains containing more than 5 solitons detected from the VNIR image shown in Figure 1 of Li et al. (2011), the experimental results considering the topography of the Xisha Islands are closer to the satellite remote sensing observations.
In summary, the reliability of this model is verified and the necessity of considering the Xisha Islands topography is confirmed.
In order to analyze the generation mechanism as well as the subsequent propagation and evolution process of far-field ISWs originated from the west sill (sill b) of the Zhongsha Islands and the local-generated ISWs from the shallow-water sill (sill a) of the Xisha Islands, the results of case EXP_rm_XS and case EXP_std are studied in this subsection sequentially.
This subsection mainly discusses the generation process and mechanism of the far-field ISWs from the west sill (sill b) of the Zhongsha Islands. The east sill (sill c) of the Zhongsha Islands only generates eastward ISWs, and will not be discussed in this paper. In order to show the effect of the magnitude and direction of the barotropic tidal flow on the generation of ISWs during one M2 tidal cycle, Figures 5A–H give the distribution of baroclinic horizontal velocity , where U is the total horizontal velocity including barotropic and baroclinic component, is the sea surface height, H is the water depth and z is the vertical coordinate, and isotherms which indicate the waveform of the internal waves.
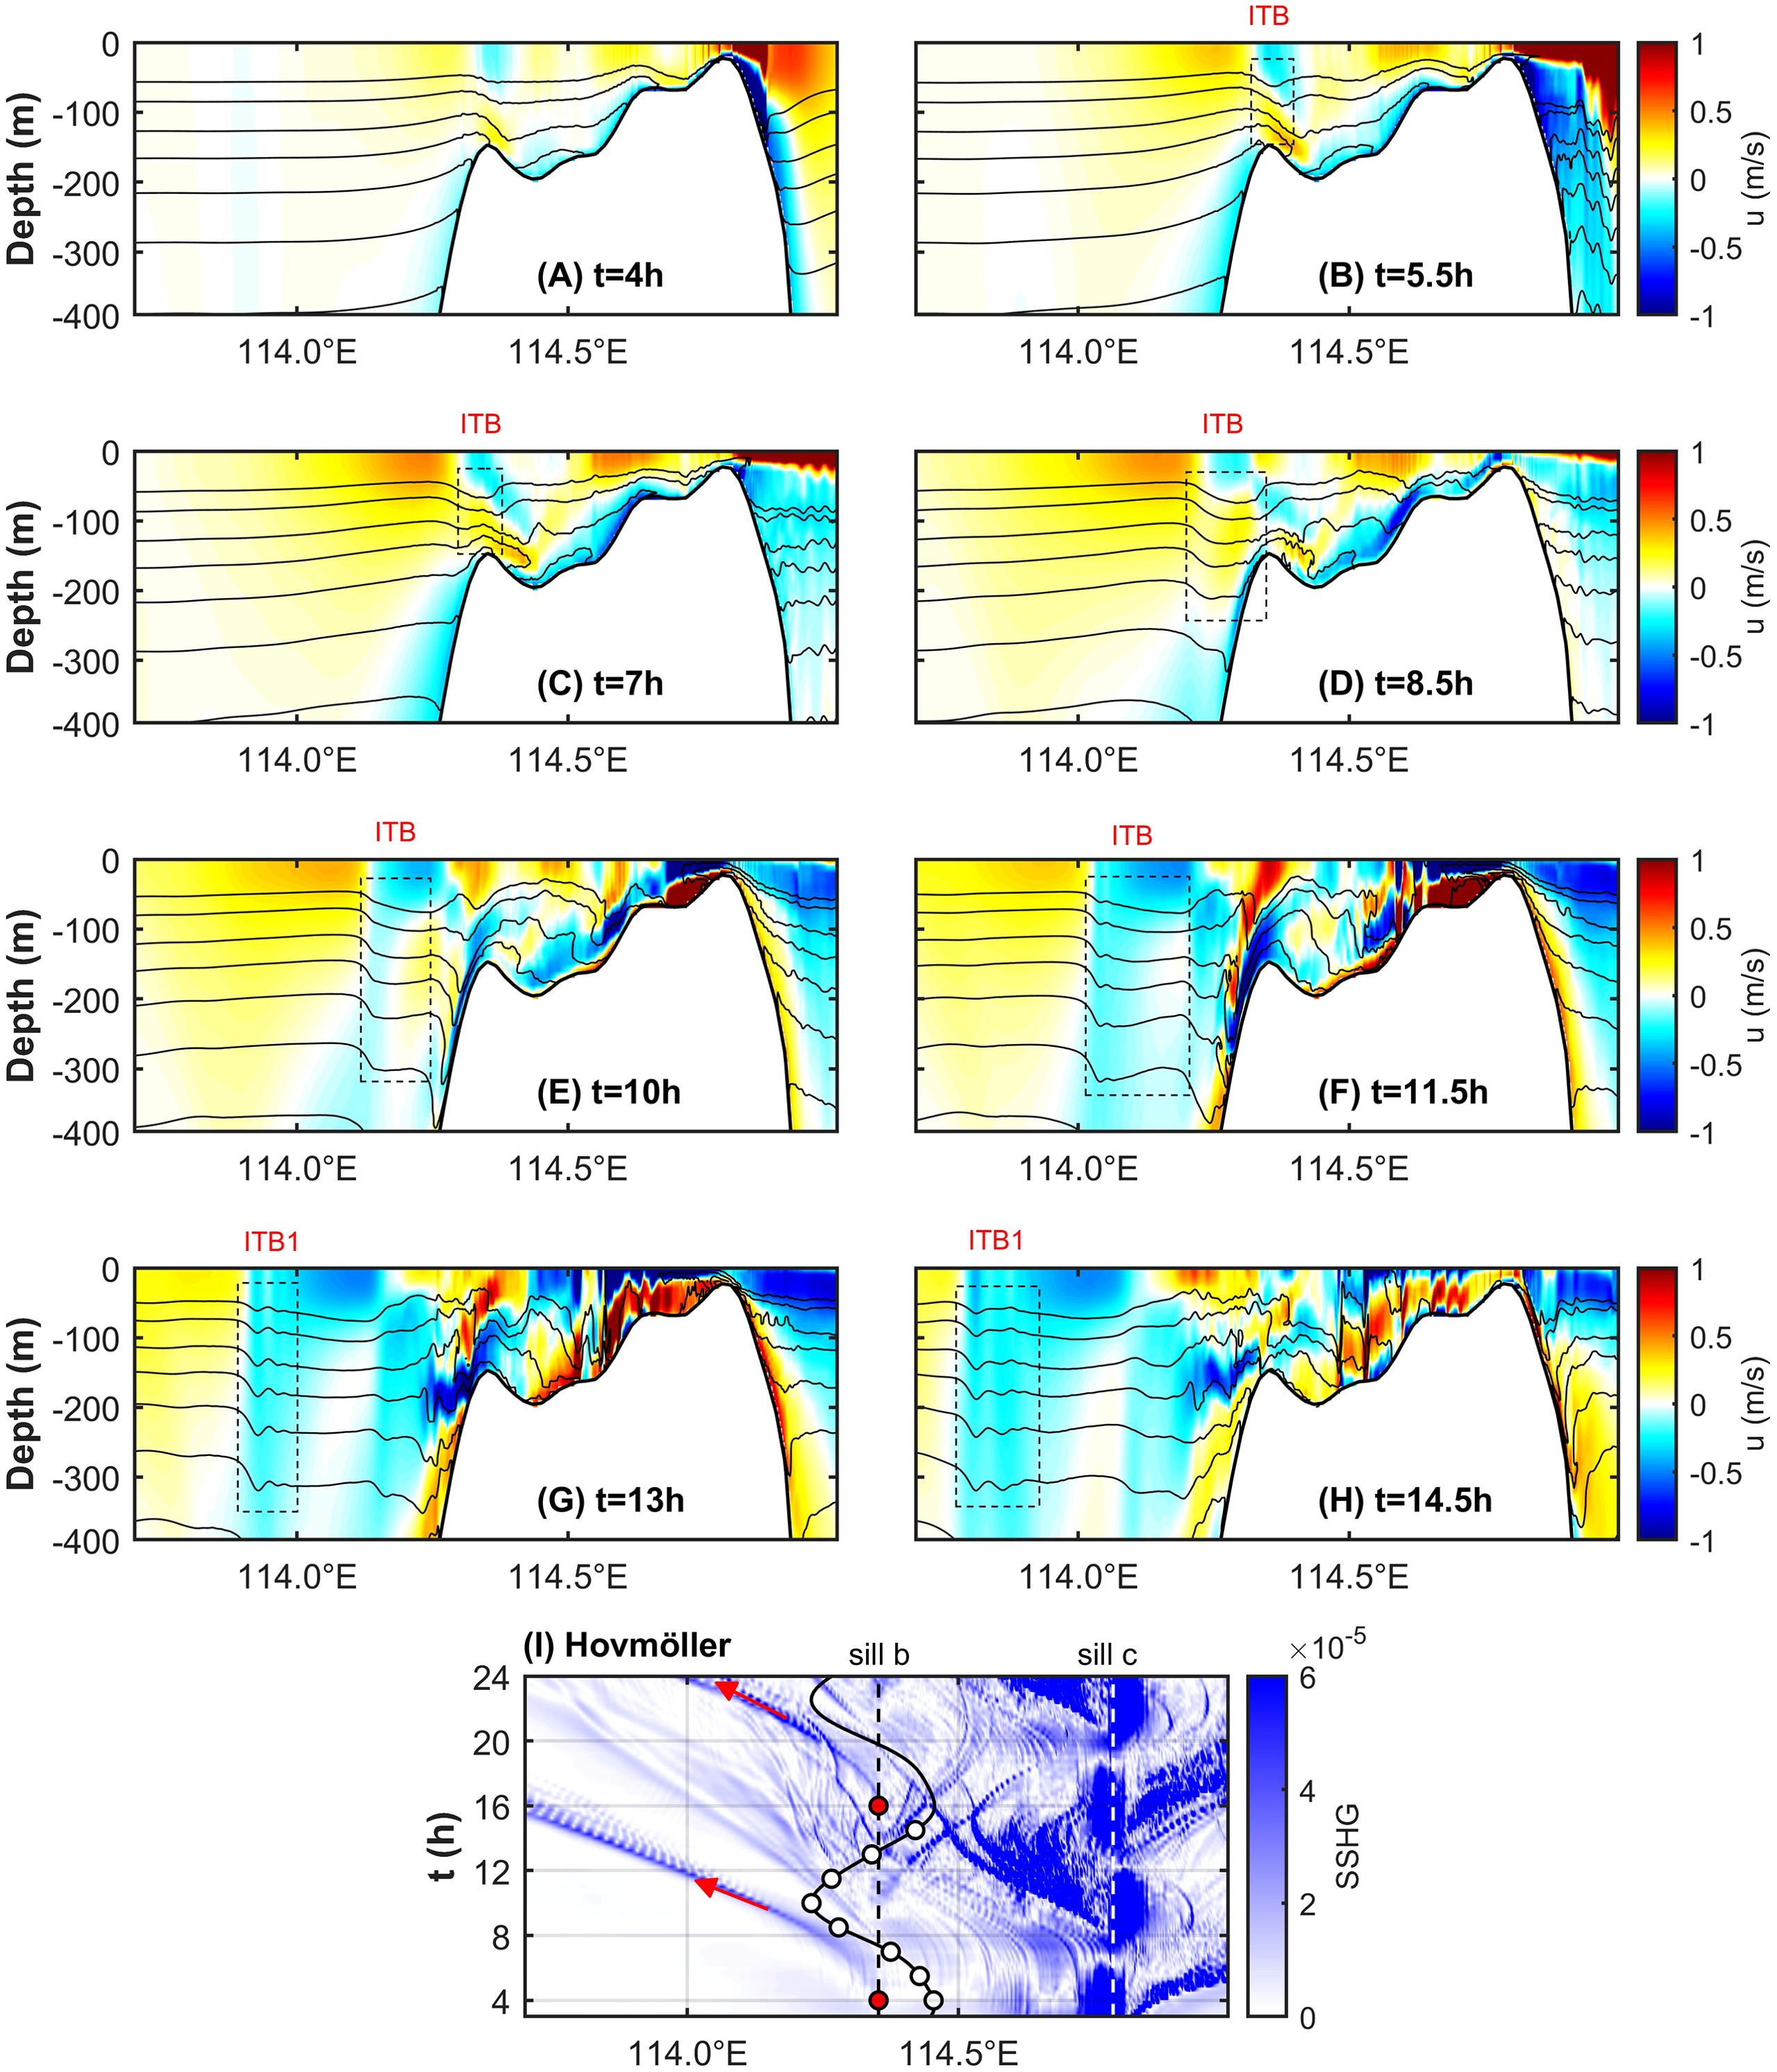
Figure 5. (A–H) show the zonal baroclinic velocity u in m s-1 with isotherms for case EXP_rm_XS. The black dashed boxes labeled with ITB or ITB1 sequentially show the evolution of one first-mode ISWs train generated through internal tidal beam mechanism during one tidal cycle. (I) is the Hovmöller diagram of the sea surface height gradient (SSHG) with the time resolution of 0.25 h. The vertical black and white dashed lines indicate the position of sill b and sill c, respectively. The black curve with white dots shows the barotropic current variation at sill b, each white dot gives the corresponding phase of the tidal current in (A–H). The blue trajectories labeled with red arrows show the propagation of first-mode waves, which are generated from the red dots.
At t = 4 h (Figure 5A), the eastward tidal current reaches its maximum value. The internal tidal beam is emanated at sill b, at the same time, the isotherms elevate on the west side and depress on the east side of the sill. Subsequently a depression occurs above sill b at t = 5.5 h (shown in box ITB of Figure 5B). When t = 7 h (Figure 5C), the barotropic current at sill b changes from eastwards to westwards, and then the depression propagates westwards from sill b. In the time period corresponding to Figures 5D–F, the background tidal current is always westward, and the westward upper branch of internal tidal beams excited from sill b are reflected horizontally at the thermocline and continue to propagate westwards and downwards. In Figure 5E the depression mentioned above gradually increases in wavelength, steepen at the wave front, and flatten at the wave rear under the nonlinear effect. At t = 11.5 h (Figure 5F), the wave front starts to disintegrate because of dispersion. The amplitude and half-width of the head wave increases and the tail waves gradually grows to form the westward propagating first-mode ISWs train (marked by box ITB1 in Figures 5G, H).
In the following, the tidal and topographic characteristics at sill b are scrutinized from the perspective of dimensionless parameter to further investigate the generation mechanism of the first-mode ISWs. The slope parameter can measure the steepness of the topography, and the calculated results show that the slope parameter at sill b is greater than 1 (Figure 2B), which is favorable for triggering internal tidal beams. To assess the tidal contribution at sill b, this paper employs the nonlinear parameter proposed by Vlasenko et al. (2005), where U is the barotropic tidal amplitude, is the frequency of the barotropic tide, L and H is the horizontal and vertical scale of the topography, respectively, and D is the water depth. When , only internal tides are generated; otherwise, the nonlinear effect is not negligible. When the water depth D and the vertical scale of topography H are of the same magnitude, the can be simplified as the tidal excursion , where denotes the wave number of the topography. According to the theory of St. Laurent and Garrett (2002), for , only internal tides are generated, only when can ISWs be generated through the lee-wave mechanism. The calculated results of the above dimensionless parameters are listed in Table 2, and the results show that both the nonlinear parameter and tidal excursion at sill b is of order 10-1. Considering the previously described generation and evolution process of the first-mode ISWs generated from sill b, it is concluded that the generation mechanism is the internal tidal beam mechanism.
Large amplitude ISWs can trigger enormous vertical displacement of isopycnals, which could modulate sea surface height . As a result, when taking no other baroclinic dynamical process into consideration in the model, the stripes of large value of sea surface height gradient (SSHG) can be used for describing the ISWs beneath ocean surface, which is expressed as Equation 1:
Slope of stripes of large value of SSHG on the x-t plain yields the nonlinear phase speed of ISWs. Figure 5I shows the distribution of SSHG in the x-t plane, i.e., Hovmöller diagram, from which the propagation trajectory of the westward first-mode ISWs trains from the Zhongsha Islands (shown by the red arrow) is captured. When fully developed, the above mentioned ISWs trains, whose nonlinear phase speed is about 2.74 m s-1, are generated when the eastward tidal current at sill b reaches the maximum value (shown by the red dots in Figure 5I).
Figure 6 further displays the waveforms and positions of the first-mode ISWs generated from sill b at different moments during the evolution process. Both the number of solitons in one ISWs package and the amplitude of each soliton increase during the westward propagation, until large amplitude and steadily propagating ISWs packages are formed.
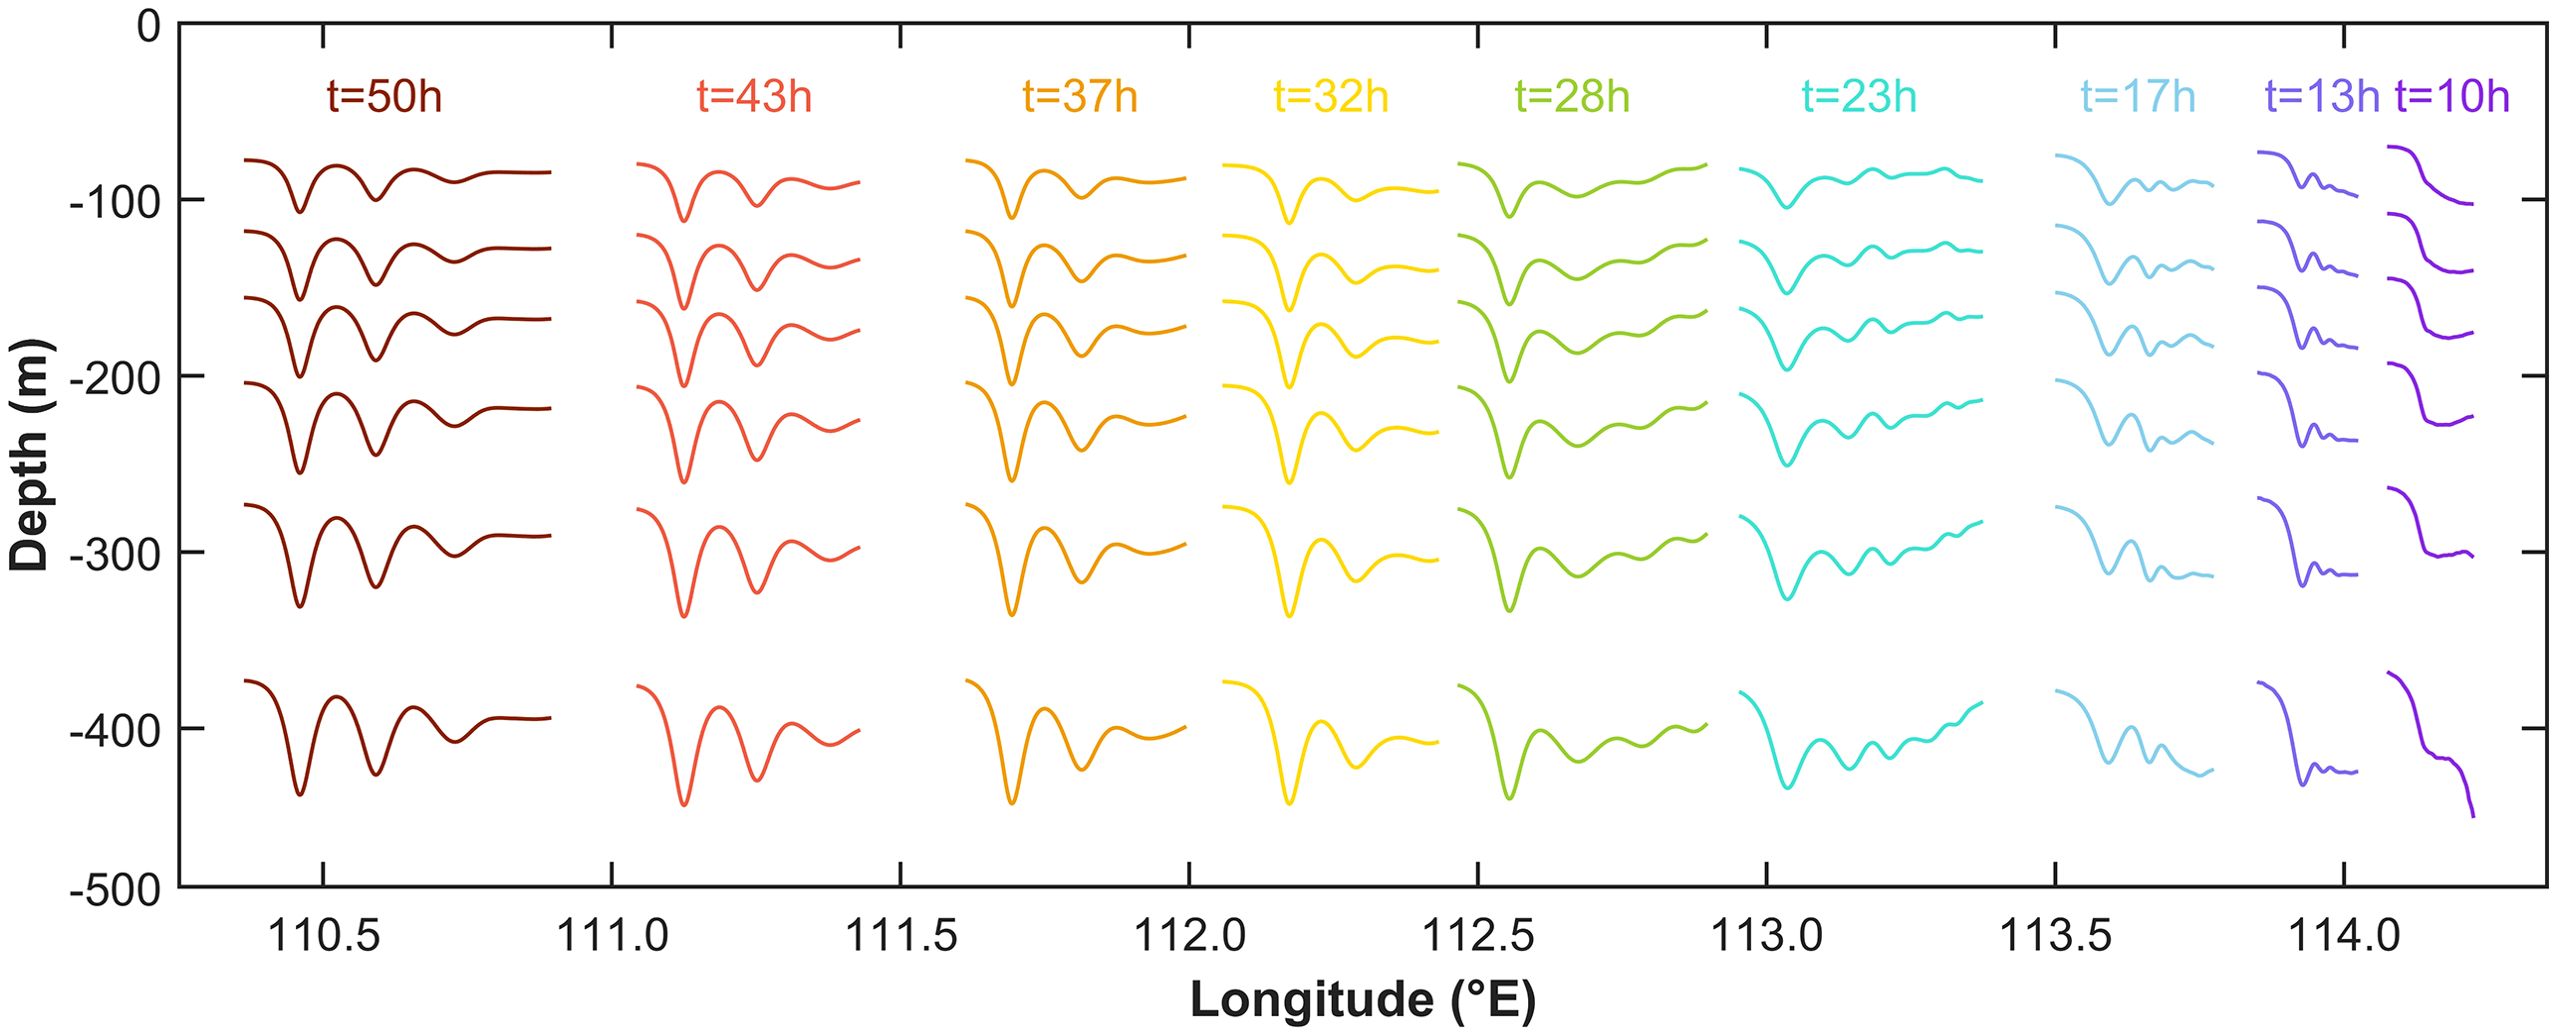
Figure 6. Isotherms denoting waveforms of the same westward first-mode ISWs generated from sill b at t = 10, 13, 17, 23, 28, 32, 37, 43, 50 h for case EXP_rm_XS.
The generation process of local-generated ISWs from the shallow-water sill (sill a) of the Xisha Islands can be analyzed based on case EXP_std. Figures 7A–H give the distribution of baroclinic horizontal velocity every 1/8 M2 tidal cycle from the time when the westward barotropic tide reaches its maximum value at t = 10.5 h. Since the westward propagating far-field ISWs from the Zhongsha Islands have not yet reached sill a during the analyzed time period in Figure 7, the generation of internal waves at sill a during this time period are mainly attributed to the interaction of local current and topography of the Xisha Islands.
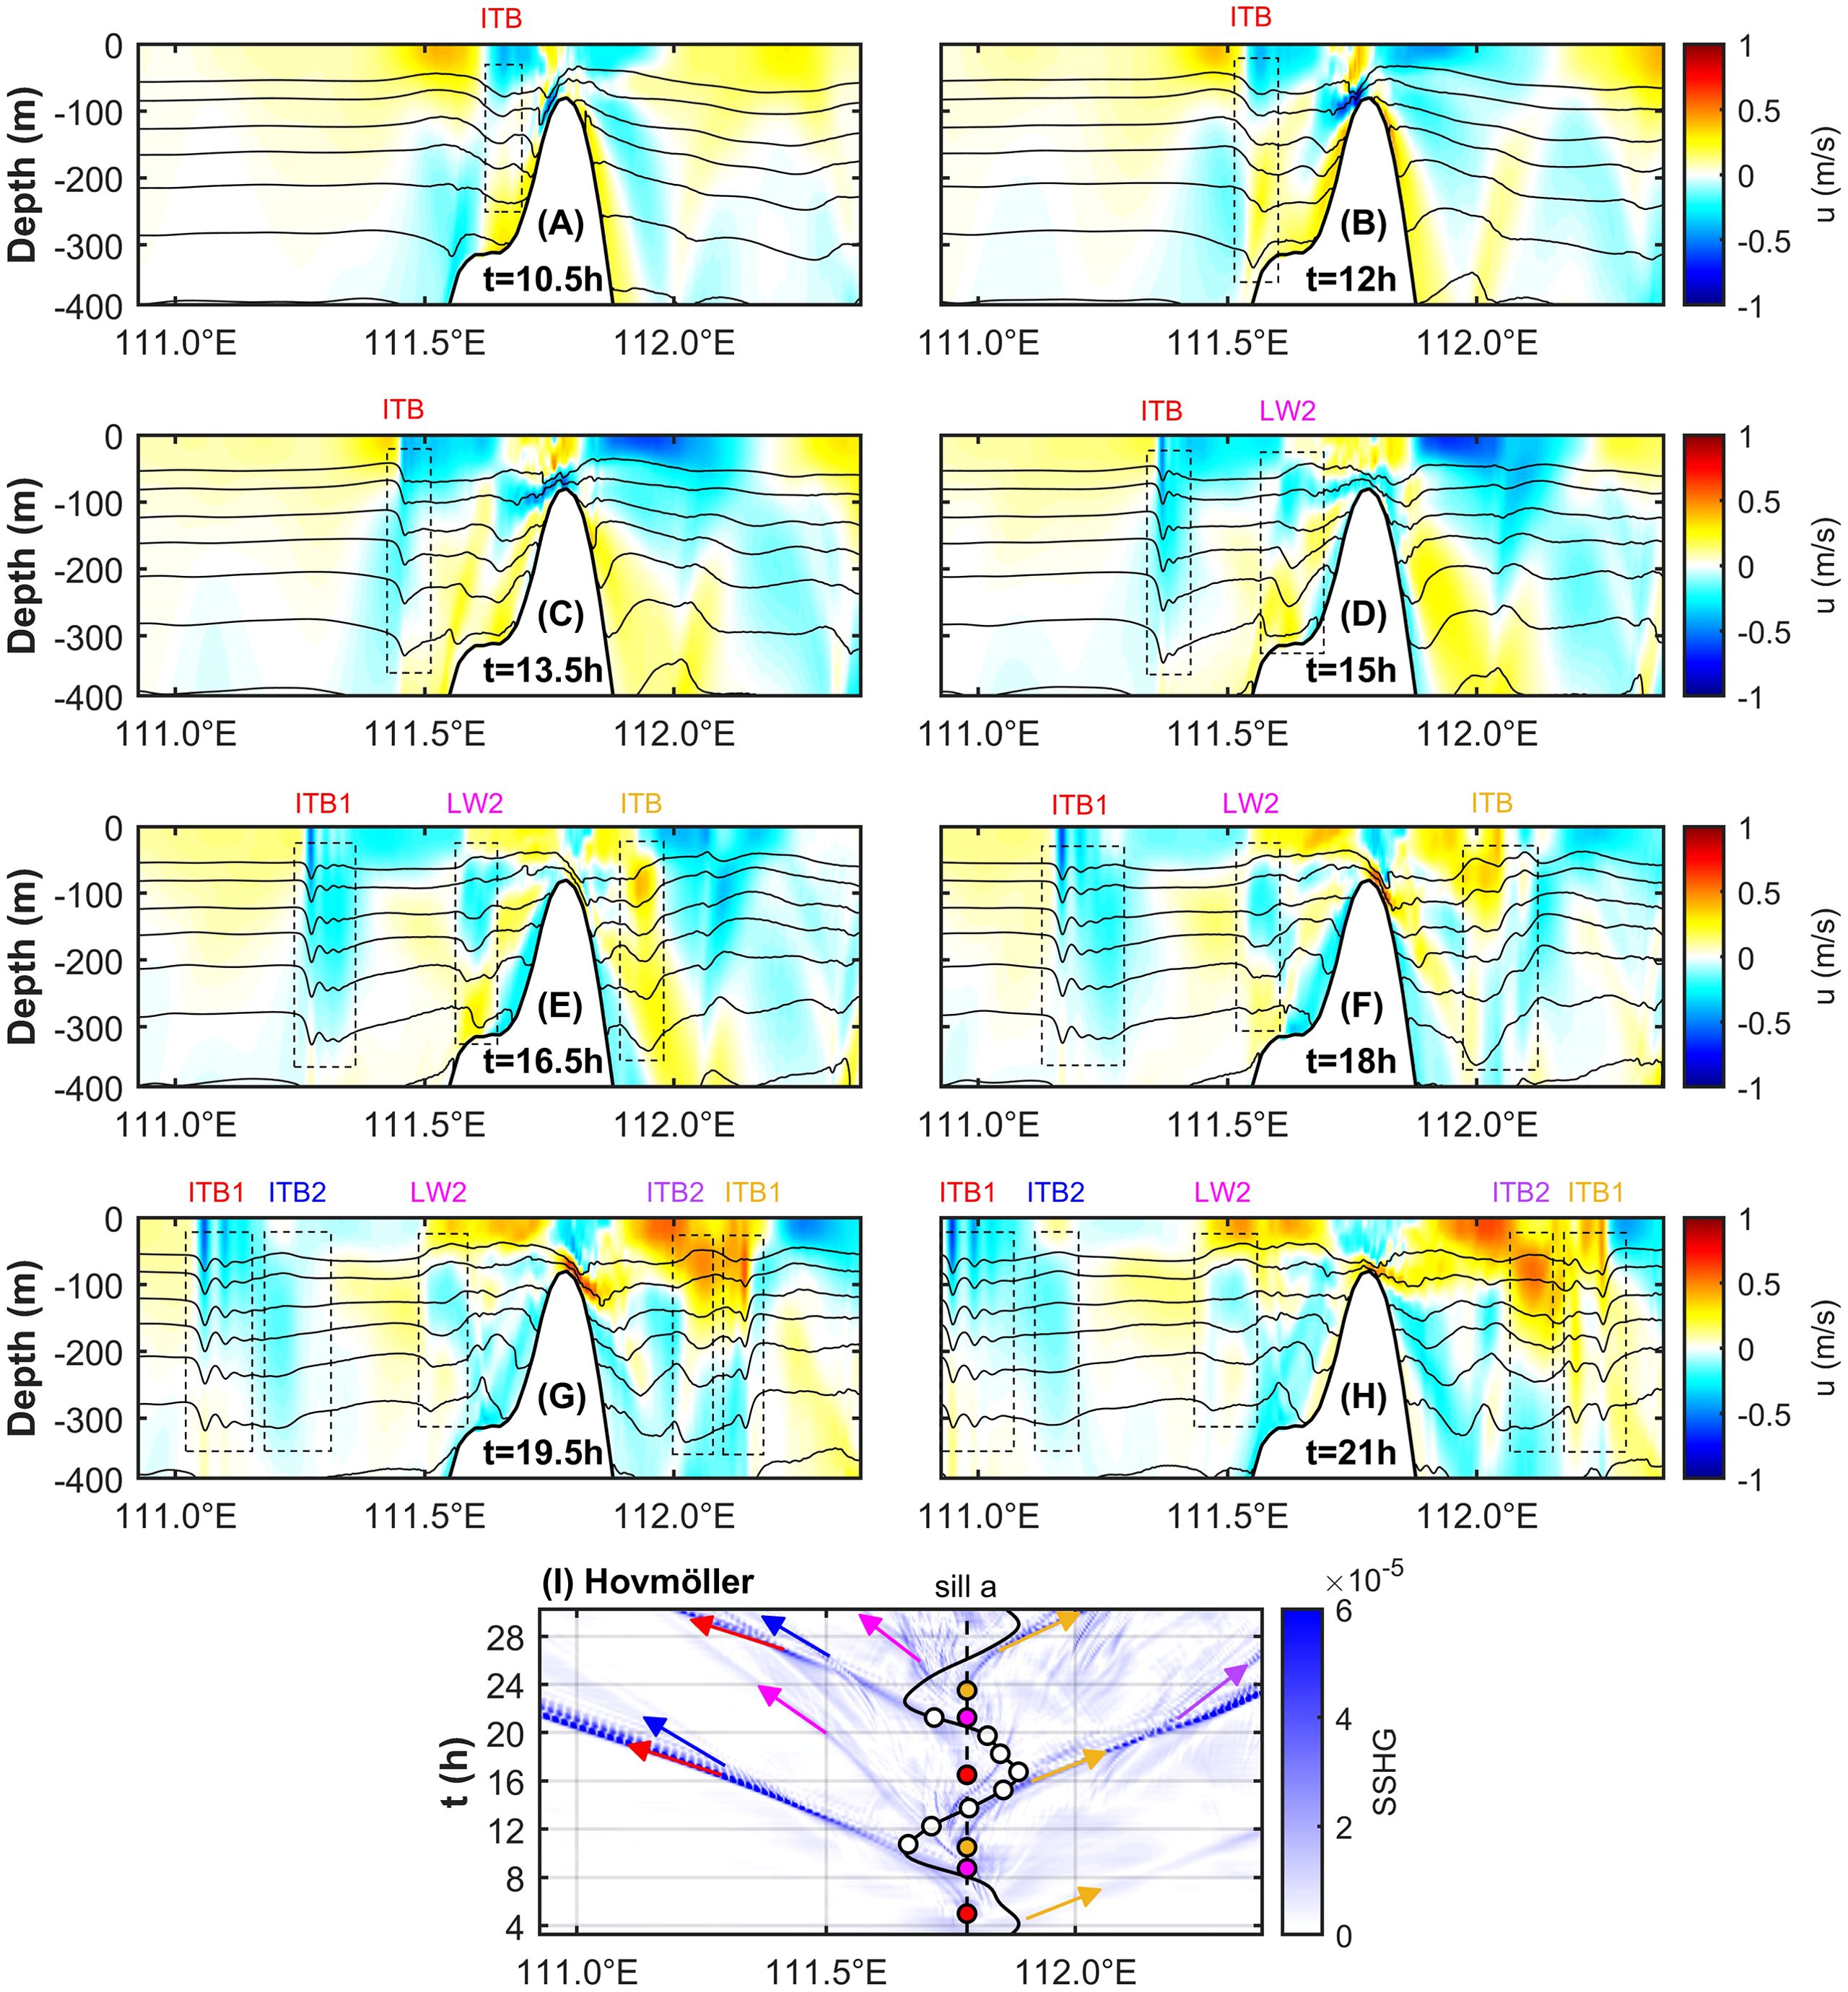
Figure 7. (A–H) are the distribution of the horizontal baroclinic velocity u in m s-1 with isotherms near sill a for case EXP_std. Black dashed boxes labeled with ITB, ITB1, ITB2 sequentially show the evolution of first- and second-mode ISWs generated through internal tidal beam mechanism, and other black dashed boxes labeled with LW2 sequentially show the evolution of second-mode ISWs generated through lee-wave mechanism. (I) is the Hovmöller diagram of SSHG. The vertical black dashed line indicates the position of sill a. The black curve with white dots shows the barotropic current variation at sill a, each white dot gives the corresponding phase of the tidal current in (A–H). The blue trajectories labeled with red (yellow) and with blue (purple) arrows show the westward (eastward) propagation of first- and second-mode ISWs, respectively, which are both generated through internal tidal beam mechanism from the red (yellow) dots. The blue trajectories labeled with magenta arrows show the westward propagation of second-mode ISWs, which are generated through lee-wave mechanism from the magenta dots.
Firstly, the generation process and mechanism of the westward propagating ISWs from the Xisha Islands is studied. At t = 10.5 h (Figure 7A), the isotherms on the west side of sill a bulge downwards, and the westward upper branch and eastward upper branch of internal tidal beams excited by sill a reflect horizontally at the thermocline. After reaching the thermocline, the westward upper branch of internal tidal beams triggers a depression perturbation (indicated by box ITB whose font is red), which is subsequently steepened due to nonlinear effects in the westward background tidal current. However, the eastward upper branch of internal tidal beams does not undergo the above steepening process in the background tidal current whose direction is opposite to its propagating direction (Figure 7C). At t = 15 h (Figure 7D), the depression fluctuation shown in box ITB undergoes disintegration and a distinct head wave can be observed in the form of undular bore, which increases in amplitude and half-width during the westward propagation in Figures 7E–H until it evolves into a steadily propagating first-mode ISWs train (denoted by Box ITB1) whose phase speed is 1.88 m s-1. The propagation trajectory of this kind of ISWs in the Hovmöller diagram from sill a is shown by the red arrow in Figure 7I. They are generated when the eastward tidal current at sill a reaches the maximum value (shown by the red dots). Further analysis of the dimensionless parameters shows that the slope parameter at sill a of the Xisha Islands is larger than 1 (shown as black line in Figure 2B), which is favorable of exciting internal tidal beams. The nonlinear parameters and tidal excursion are both of order 10-1 (Table 2), so the generation mechanism of the first-mode ISWs at sill a of the Xisha Islands is internal tidal beam mechanism.
In Figures 7E–H, a second-mode ISW (denoted by box ITB2) exists at the tail of the westward propagating first-mode ISWs train marked by ITB1. It is known from Figure 7I that the aforementioned second-mode ISW originates at the same time as the westward propagating first-mode ISWs when the eastward tidal current of sill a reaches its maximum. As the first- and second-mode ISWs fully develop, the phase speed of the second-mode ISW is smaller than that of the first-mode ISWs, so the two types of ISWs will separate from each other. That means, sill a can generate the second-mode ISWs through the internal tidal beam mechanism.
From Figure 7I, it can also be seen that, unlike the first- and second-mode ISWs generated by the internal tidal beam mechanism described above, sill a can also directly generate second-mode ISWs (shown by the magenta arrow and dot) whose phase speed is 0.91 m s-1 through lee-wave mechanism when the eastward tide transforms into the westward tide. According to the waveform shown in box LW2 of Figures 7D–H, the ISW is a second-mode convex ISW. To investigate the generation mechanism of this kind of second-mode ISWs, this paper adopts the j-mode Froude number as the criterion, where U is the barotropic tidal velocity amplitude above the sill, and is the j-mode linear phase speed yielded by solving the simplified Taylor-Goldstein equation without the consideration of background current (Stashchuk et al., 2007; Liu, 2010; Raju et al., 2021) based on the initial temperature and salinity field. The expression of the simplified Taylor-Goldstein equation and the boundary conditions are:
Where N is the buoyancy frequency, W is the vertical structure of the internal wave, and H is the water depth. If , the fluid is in a supercritical state, the j-mode ISWs can be generated by the lee-wave mechanism. The second-mode Froude number of sill a is calculated to be , which means, the generation mechanism of this type of second-mode ISWs is the lee-wave mechanism.
The generation process of the eastward propagating first-mode ISWs at sill a is similar to that of the westward propagating first-mode ISWs. One ISWs train is generated every half tidal cycle at sill a, and the propagating direction of ISWs trains generated are alternant. During the time period corresponding to Figures 7E–H, the box ITB whose font is yellow traces the steepening, disintegration, and evolution of the interface perturbation caused by the eastward upper branch of internal tidal beams excited at sill a. When the tidal current at sill a is eastward, the steepening of the interface perturbation caused by the westward upper branch of internal tidal beams is suppressed. The eastward propagating first-mode ISWs (marked by box ITB1) has a second-mode wave (shown in box ITB2) separation in the tail. The propagation trajectories of the eastward propagating first- and second-mode ISWs in the Hovmöller diagram are shown by the yellow and purple arrows in Figure 7I, respectively. In a word, sill a can also generate eastward first- and second-mode ISWs through the internal tidal beam mechanism.
Figure 8 shows the results of case EXP_std. It could be visualized intuitively that sill b of the Zhongsha Islands can generate westward propagating ISWs, while sill a of the Xisha Islands can generate westward and eastward propagating ISWs. The local-generated ISWs in Xisha sea area and the far-field ISWs from the Zhongsha may have head-on collisions during their propagation processes.
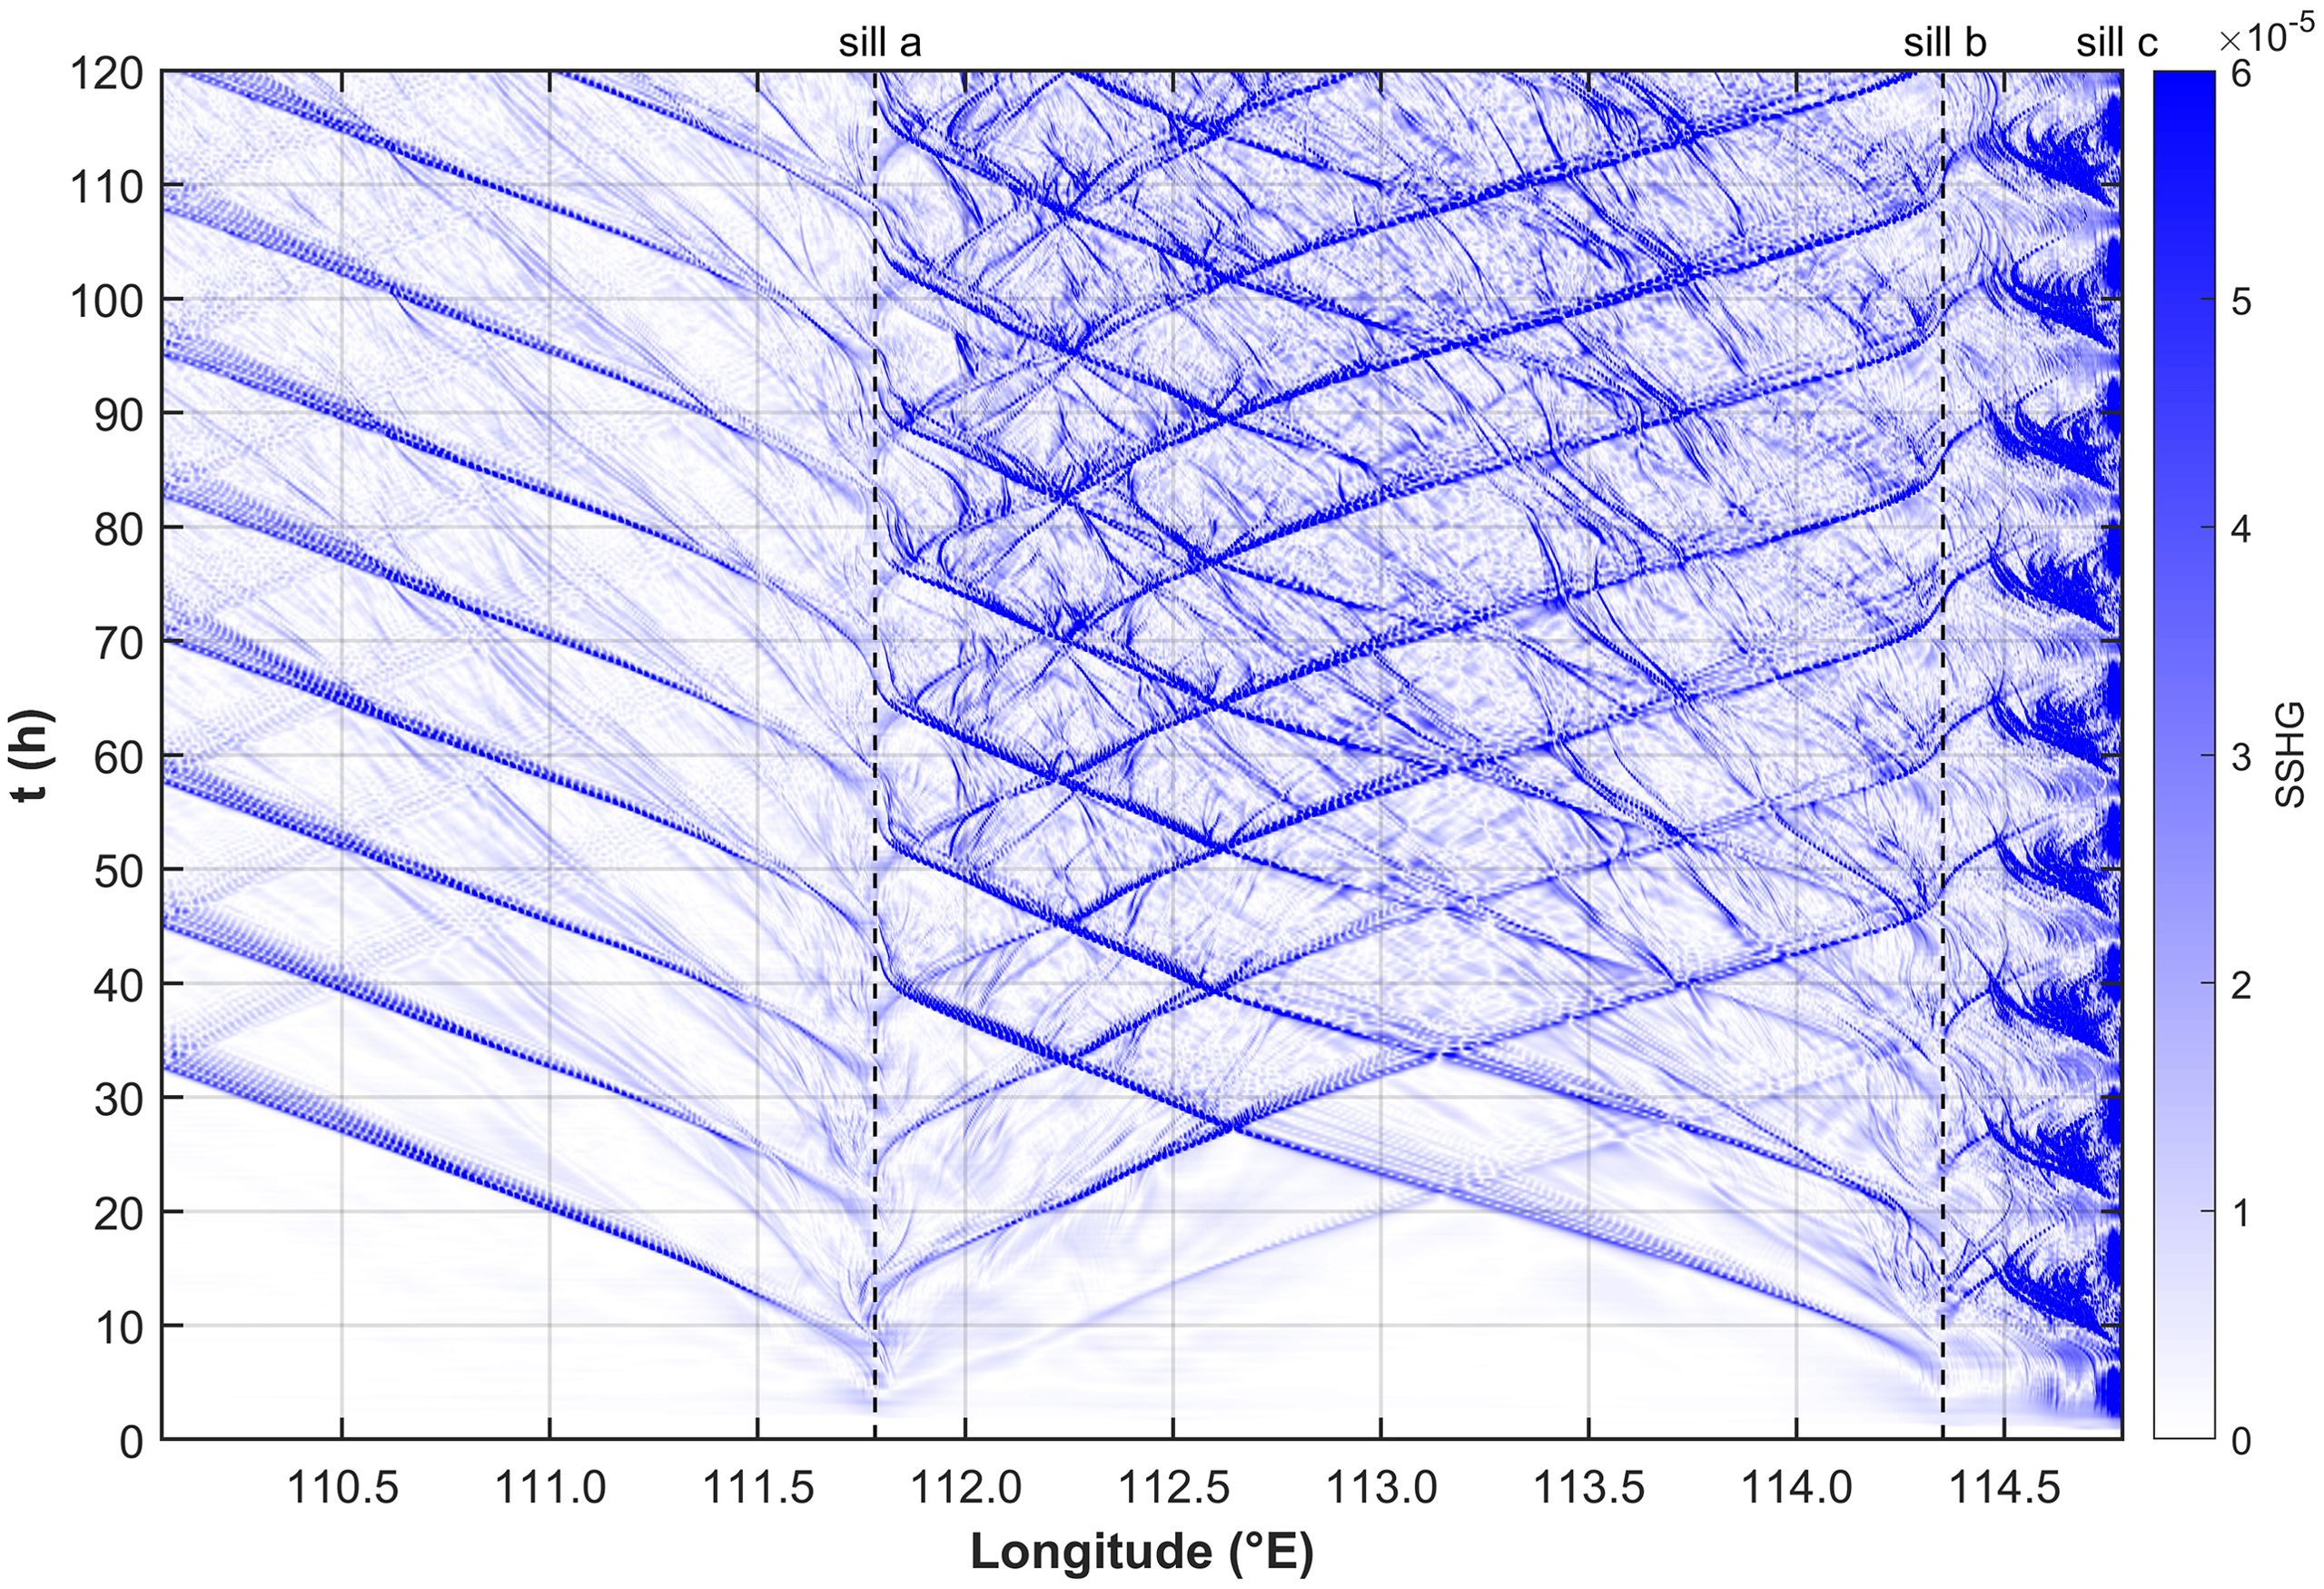
Figure 8. Hovmöller diagram of SSHG for case EXP_std west of sill c. The location of sill a and b are marked by black dashed lines.
In summary, sill b of the Zhongsha Islands can generate westward propagating first-mode ISWs by the internal tidal beam mechanism, and the internal wave signals originate at the moment when the eastward barotropic current of sill b reaches its maximum value. Sill a of the Xisha Islands can generate westward (eastward) propagating first- and second-mode ISWs by the internal tidal beam mechanism, and aforementioned two modes of internal wave signals originate together at the moment of the eastward (westward) tidal maximum and separate in the propagation process because of their discrepancy of phase speed. Westward propagating second-mode ISWs can also be generated by the lee-wave mechanism when the tidal current above sill a turns from eastwards to westwards. In a word, in the Xisha sea area there exist far-field and local-generated ISWs, and the internal waves in this area are multi-source and multimodal, and are emanated through various generation mechanisms. The investigation in this subsection suggests the wave fields in the Xisha sea area are quite complex and implies multiple dynamical interactions such as head-on collisions.
Based on the discussion in subsection 3.1, the ISWs generated from the far field, i.e. Zhongsha Islands, may collide with the ISWs generated locally from the Xisha Islands (Figure 8). How do they interact with each other during possible collision? How will the far-field ISWs be affected by the variation of water depth in the Xisha sea area?
This subsection reveals the wave-wave interaction due to collision by comparing the results of case EXP_std and that of case EXP_rm_a. The only difference of the topographic configuration between the two cases lies on the existence of sill a of the Xisha Islands. For the case removing sill a topography, i.e., case EXP_rm_a, the Xisha Islands are not capable of generating ISWs. The blue and orange isotherms in Figure 9 show the results of case EXP_rm_a and case EXP_std, respectively. Before the collision, the depression isotherms denoting westward propagating first-mode ISWs of the two cases coincide with each other (shown in Figure 9A whose close-up is displayed in Figure 9E). For case EXP_std, Figure 9B denotes the starting moment of collision when the two waves are just in contact and their head wave amplitudes are superimposed; Figure 9C is the moment when the head wave of the eastward propagating local-generated ISWs is superimposed on the tail wave of the westward propagating far-field ISWs; Figure 9D whose close-up is shown in Figure 9F denotes a moment after the collision, when the far-field ISWs from the Zhongsha Islands have been modulated by the incoming waves in case EXP_std. The amplitude of the far-field ISWs modulated by the incoming waves (with an amplitude of 20.6 m, shown as orange solid isotherms) is smaller than that has not been modulated (with an amplitude of 23.7 m, shown as blue dotted isotherms). Besides, the phase of the former shifts significantly compared with the latter. The findings here that collisions reduce the amplitude and significantly change the phase of the far-field ISWs is consistent with the findings from the ideal experiment conducted by Yuan and Wang (2022).
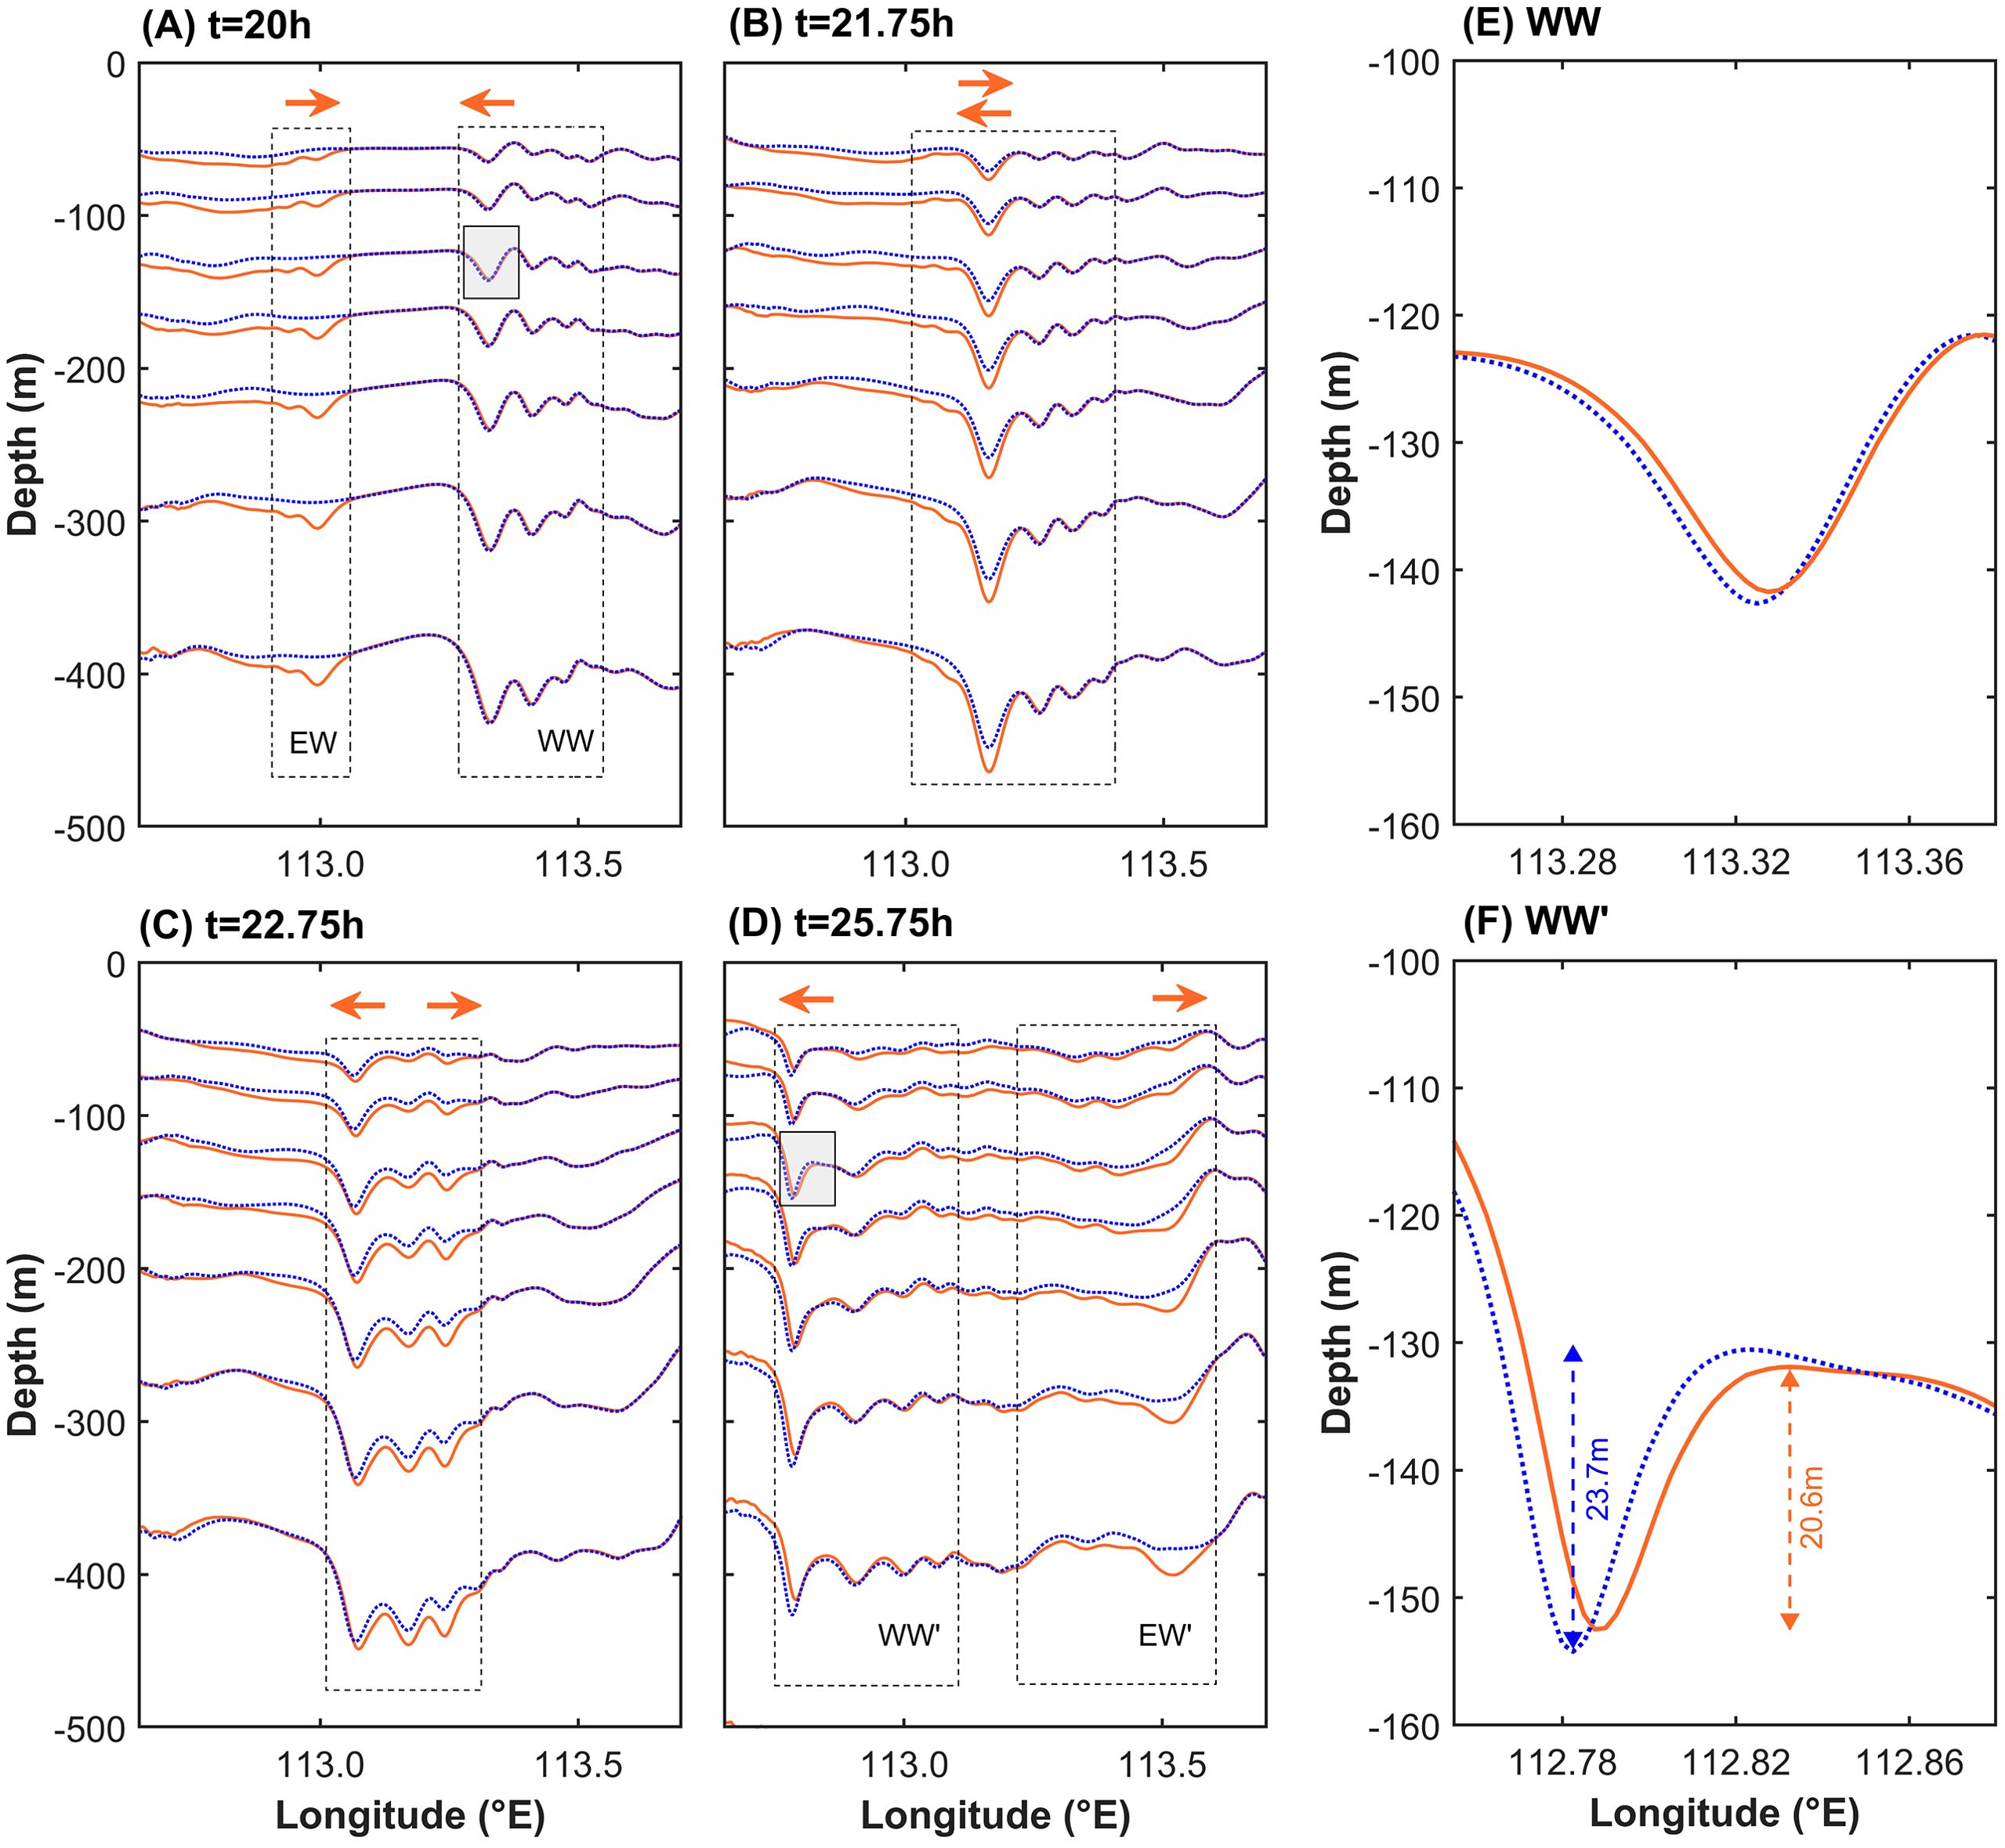
Figure 9. Orange solid isotherms are for case EXP_std and blue dotted isotherms are for case EXP_rm_a at (A) t = 20 h, (B) t = 21.75 h, (C) t = 22.75 h, and (D) t = 25.75 h The orange arrows denote the propagating direction of ISWs. The EW (EW’) region denotes eastward ISWs from the Xisha Islands before (after) the modulation, and the WW (WW’) region denotes westward ISWs from the Zhongsha Islands before (after) the modulation. (E, F) is the close-up of the shaded areas in (A, D), respectively.
The amplitude reduction and phase shift of far-field ISWs due to head-on collisions can also be confirmed using the Hovmöller diagram. We subtract the SSHG for case EXP_std from that for case EXP_rm_a, and plot the difference in the Hovmöller diagram (shown in Figure 10A). Larger absolute value of the difference means larger discrepancy between the results of the two cases, i.e., more significant phase shift. The four boxes marked by M0 to M3 in Figure 10A indicate signals of four evolving stages the far-field ISWs train from the Zhongsha Islands which have been modulated by zero to three incoming waves, respectively. Every head-on collision makes the phase discrepancy to be a little bit more obvious and finally the phase of far-field ISWs change significantly.
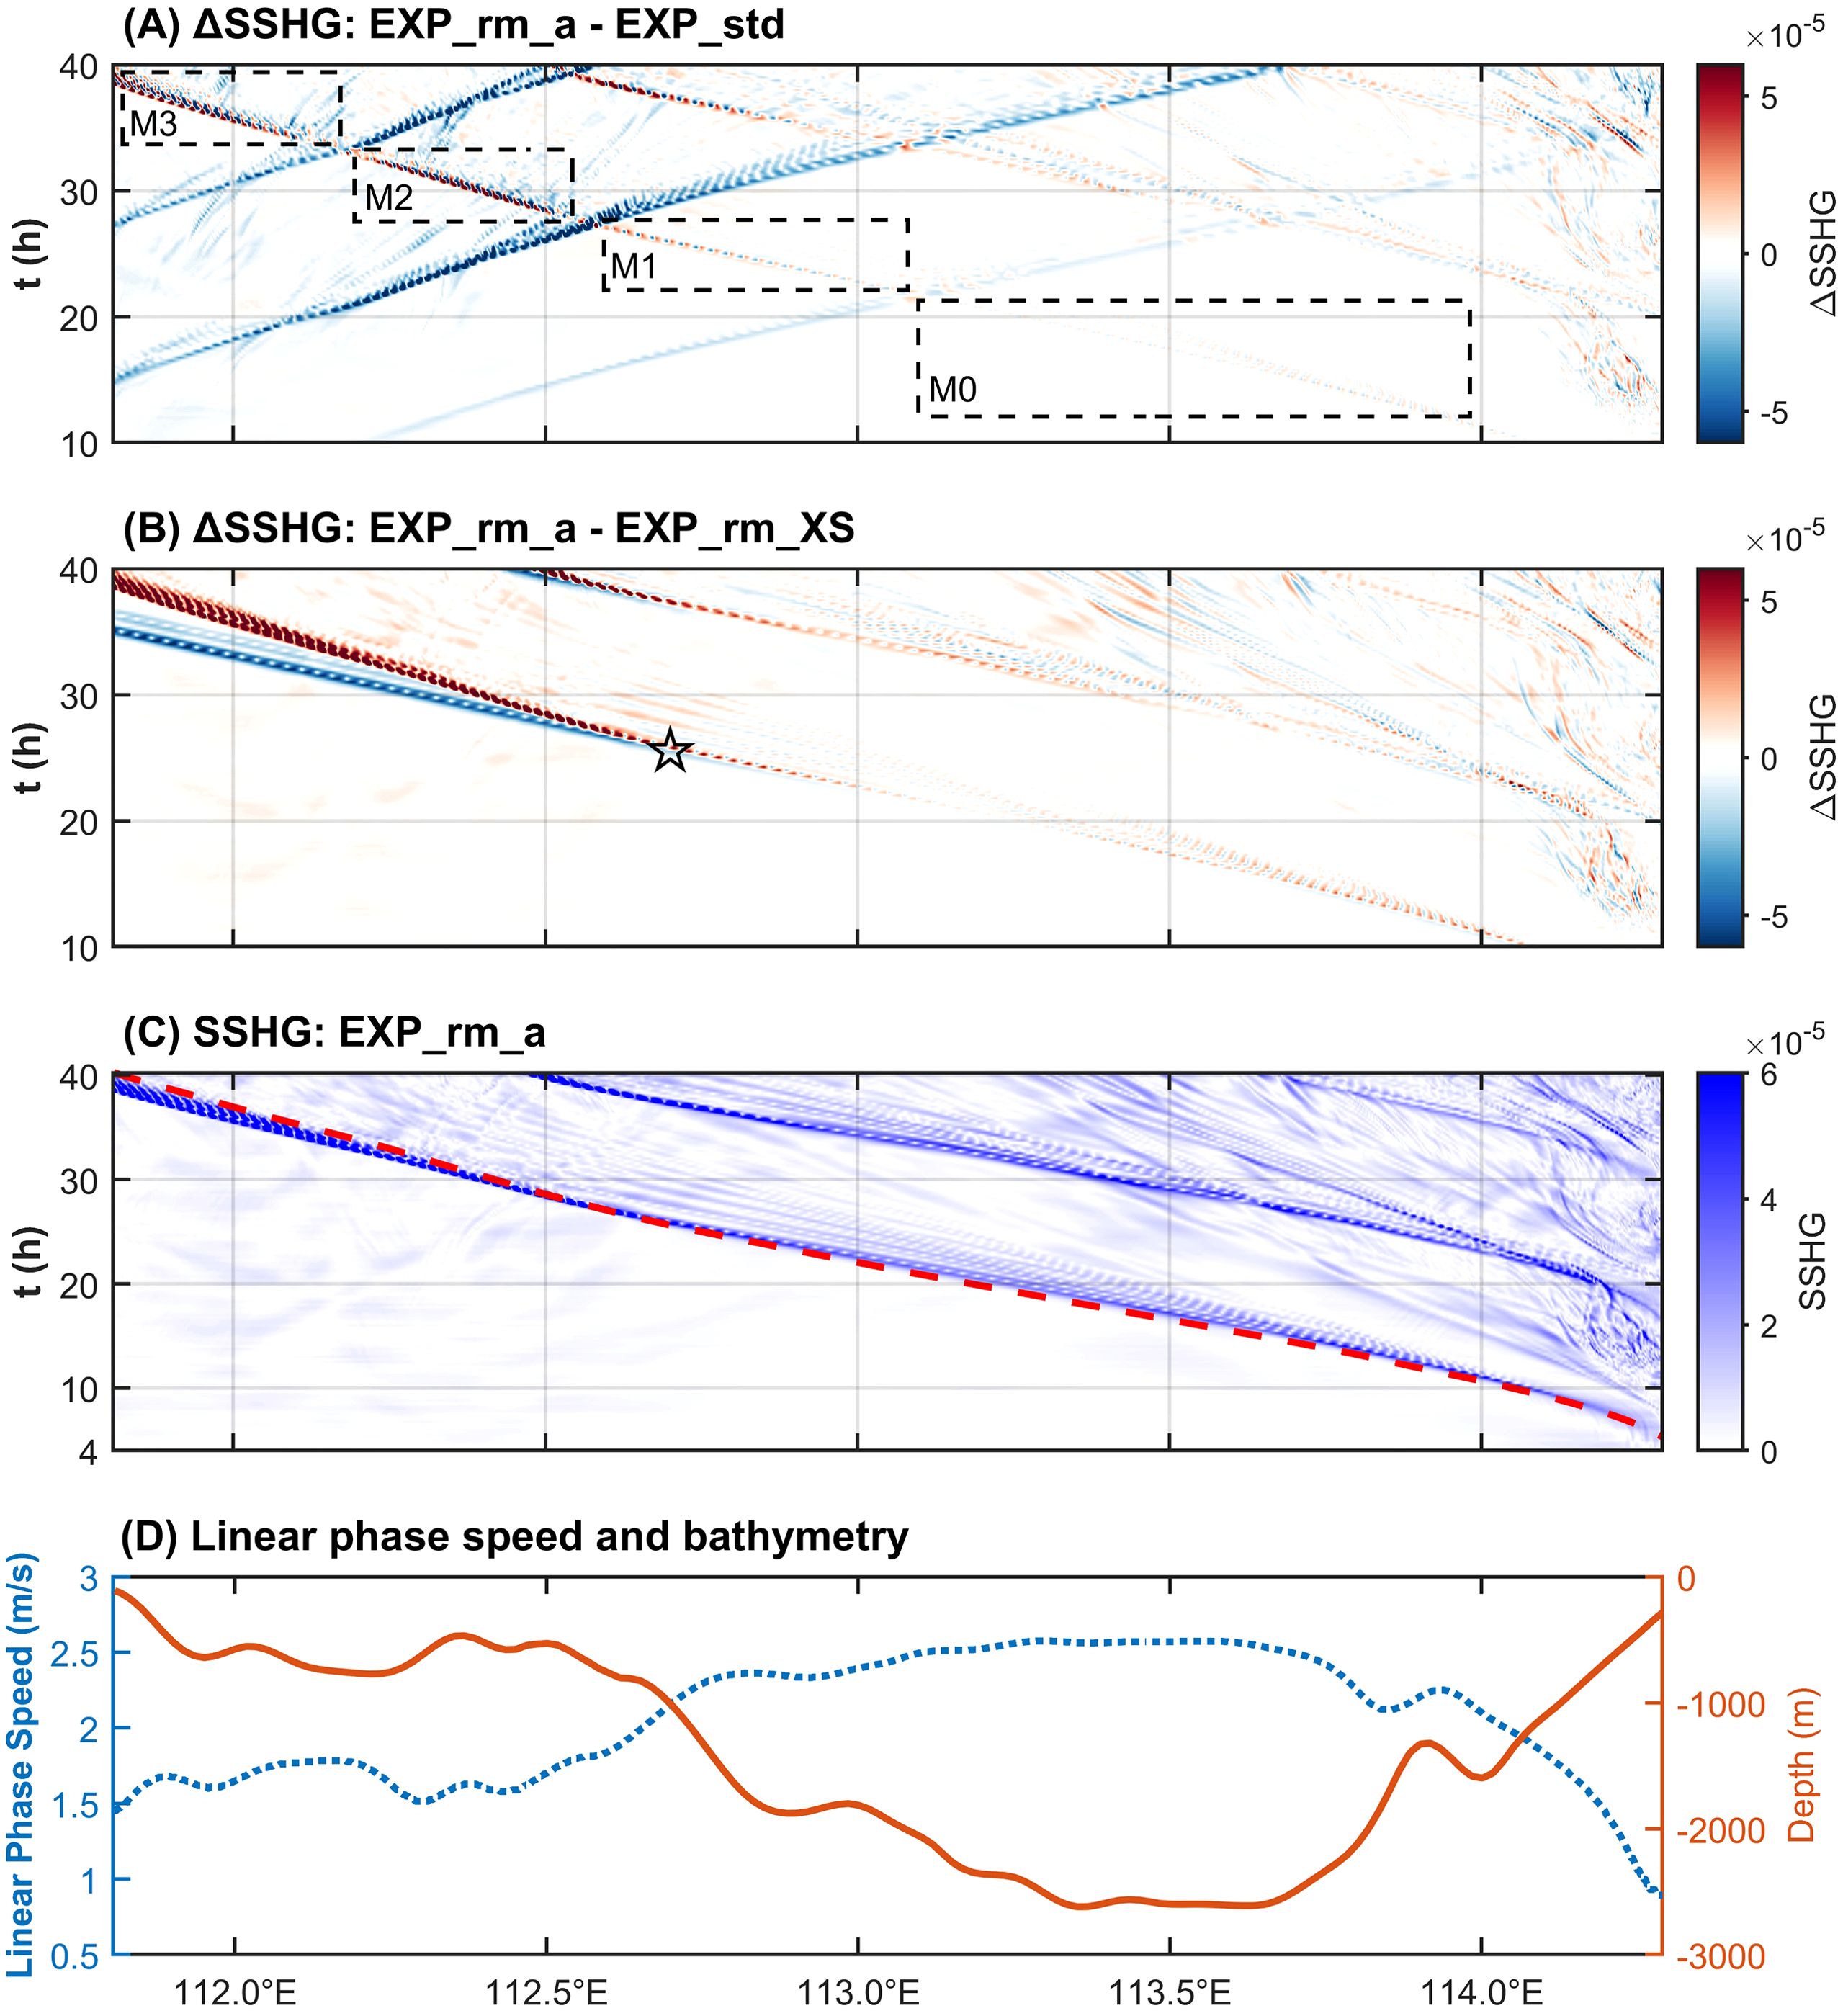
Figure 10. (A) Hovmöller diagram of the SSHG difference between case EXP_rm_a and case EXP_std between sill a of the Xisha Islands and sill b of the Zhongsha Islands. (B) Hovmöller diagram of the SSHG difference between case EXP_rm_a and case EXP_rm_XS. (C) Hovmöller diagram of SSHG for case EXP_rm_a, and the red dashed line is the linear trajectory of the westward propagating first-mode ISWs from the Zhongsha Islands based on the simplified T-G equation. (D) blue dotted line indicates distribution of the linear phase speed in m s-1 yielded from the simplified T-G equation and the blue solid line means water depth in m. The range of x-coordinates of (A–D) are of the same.
This subsection mainly compares the results of case EXP_rm_XS and case EXP_rm_a. Both two cases eliminate sill a, there is no eastward ISWs generated from the Xisha Islands. The difference of the propagation process of the simulated westward propagating far-field ISWs between the two cases is mainly caused by the topographic variation of the Xisha Islands.
We subtract the SSHG for case EXP_rm_XS from that for case EXP_rm_a, and plot the difference in the Hovmöller diagram (shown in Figure 10B), where the pentagram indicates the location and moment when the westward propagating ISWs from the Zhongsha Islands arrive at the steep slope of the Xisha Islands. Before approaching the steep slope, the phase speed of far-field ISWs train for the two cases is similar. In the case EXP_rm_a which consider the main body of the Xisha Islands terrain, the phase speed of far-field ISWs train decreases after it reaches the steep slope of the Xisha Islands, and the signal trajectory of it separates from that of case EXP_rm_XS.
We can also calculate the linear phase speed of ISWs in the stratified ocean from a linear theoretical framework and compare it with the simulated nonlinear phase speed of the ISWs. The slope of the stripes of SSHG large value in Figure 10C indicates the nonlinear phase speed of ISWs obtained from case EXP_rm_a. We use the simplified T-G equation, i.e. Equation 2, to calculate the first-mode linear phase speed for case EXP_rm_a, and the linear phase speed calculated at each point on the x-axis is shown in Figure 10D. The solution of T-G equation under the framework of linear theory suggests that the thicker the water column is, the faster the mode-1 linear phase speed of the ISWs is (Tensubam et al., 2021; Huang L. et al., 2024). We further integrate the linear phase speed at each point from sill b to sill a with respect to time to obtain the position to which the ISWs propagates at different moments, so as to plot its trajectory in the linear framework (as shown by the red dashed line in Figure 10C). The results show that the red dashed line matches well with the trajectory of the SSHG high value signal. Since the linear phase speed calculated by the T-G equation is mainly related to the water depth, the change of phase speed during the propagation of the far-field first-mode ISWs is mainly caused by the variation of water depth, and the phase speed first increases and then decreases during its approach to sill a of the Xisha Islands.
In summary, when approaching sill a, the far-field first-mode ISWs are modulated by the topography of Xisha Islands as follows: (1) the phase speed of the far-field ISWs is mainly influenced by the topography of the Xisha Islands, and the overall trend of the phase speed initially increases and then decreases; (2) the local-generated ISWs make far-field ISWs undergo collisions to decrease the amplitude of head wave and undergo substantial phase shift.
In this subsection, the evolution of far-field ISWs over the shallow-water sill (sill a) of the Xisha Islands will be discussed.
Due to the 90.6 m water depth of sill a is smaller than the double of the water depth of pycnocline which is around 50 m as shown in Figure 3C, the depression wave arriving at sill a will undergo polarity transition and convert into elevation wave. Figures 11A–H gives the mode conversion of incident first-mode ISWs at sill a of the Xisha Islands. The westward propagating incident first-mode ISWs train is marked by black box IcW1 in Figure 11. During the shoaling process, the head wave of the incident ISWs train suppresses and becomes flat gradually, while the rear side of it elevates. The black box in Figures 11D–E shows the intermediate status of mode conversion of the aforementioned ISWs, where the elevated isotherms cross over the sill to the west. In Figure 11E, the raised isotherms are located just above sill a. The westward background tidal current reaches the maximum value at the time corresponding to Figure 11F, and depression isotherms appears near the west slope of sill a, which is just below the elevation isotherms mentioned previously. A convex second-mode ISW generates on the west side of sill a (shown in black box MC2 of Figure 11F) and propagate westwards in the westward background tidal current (Figures 11G, H).
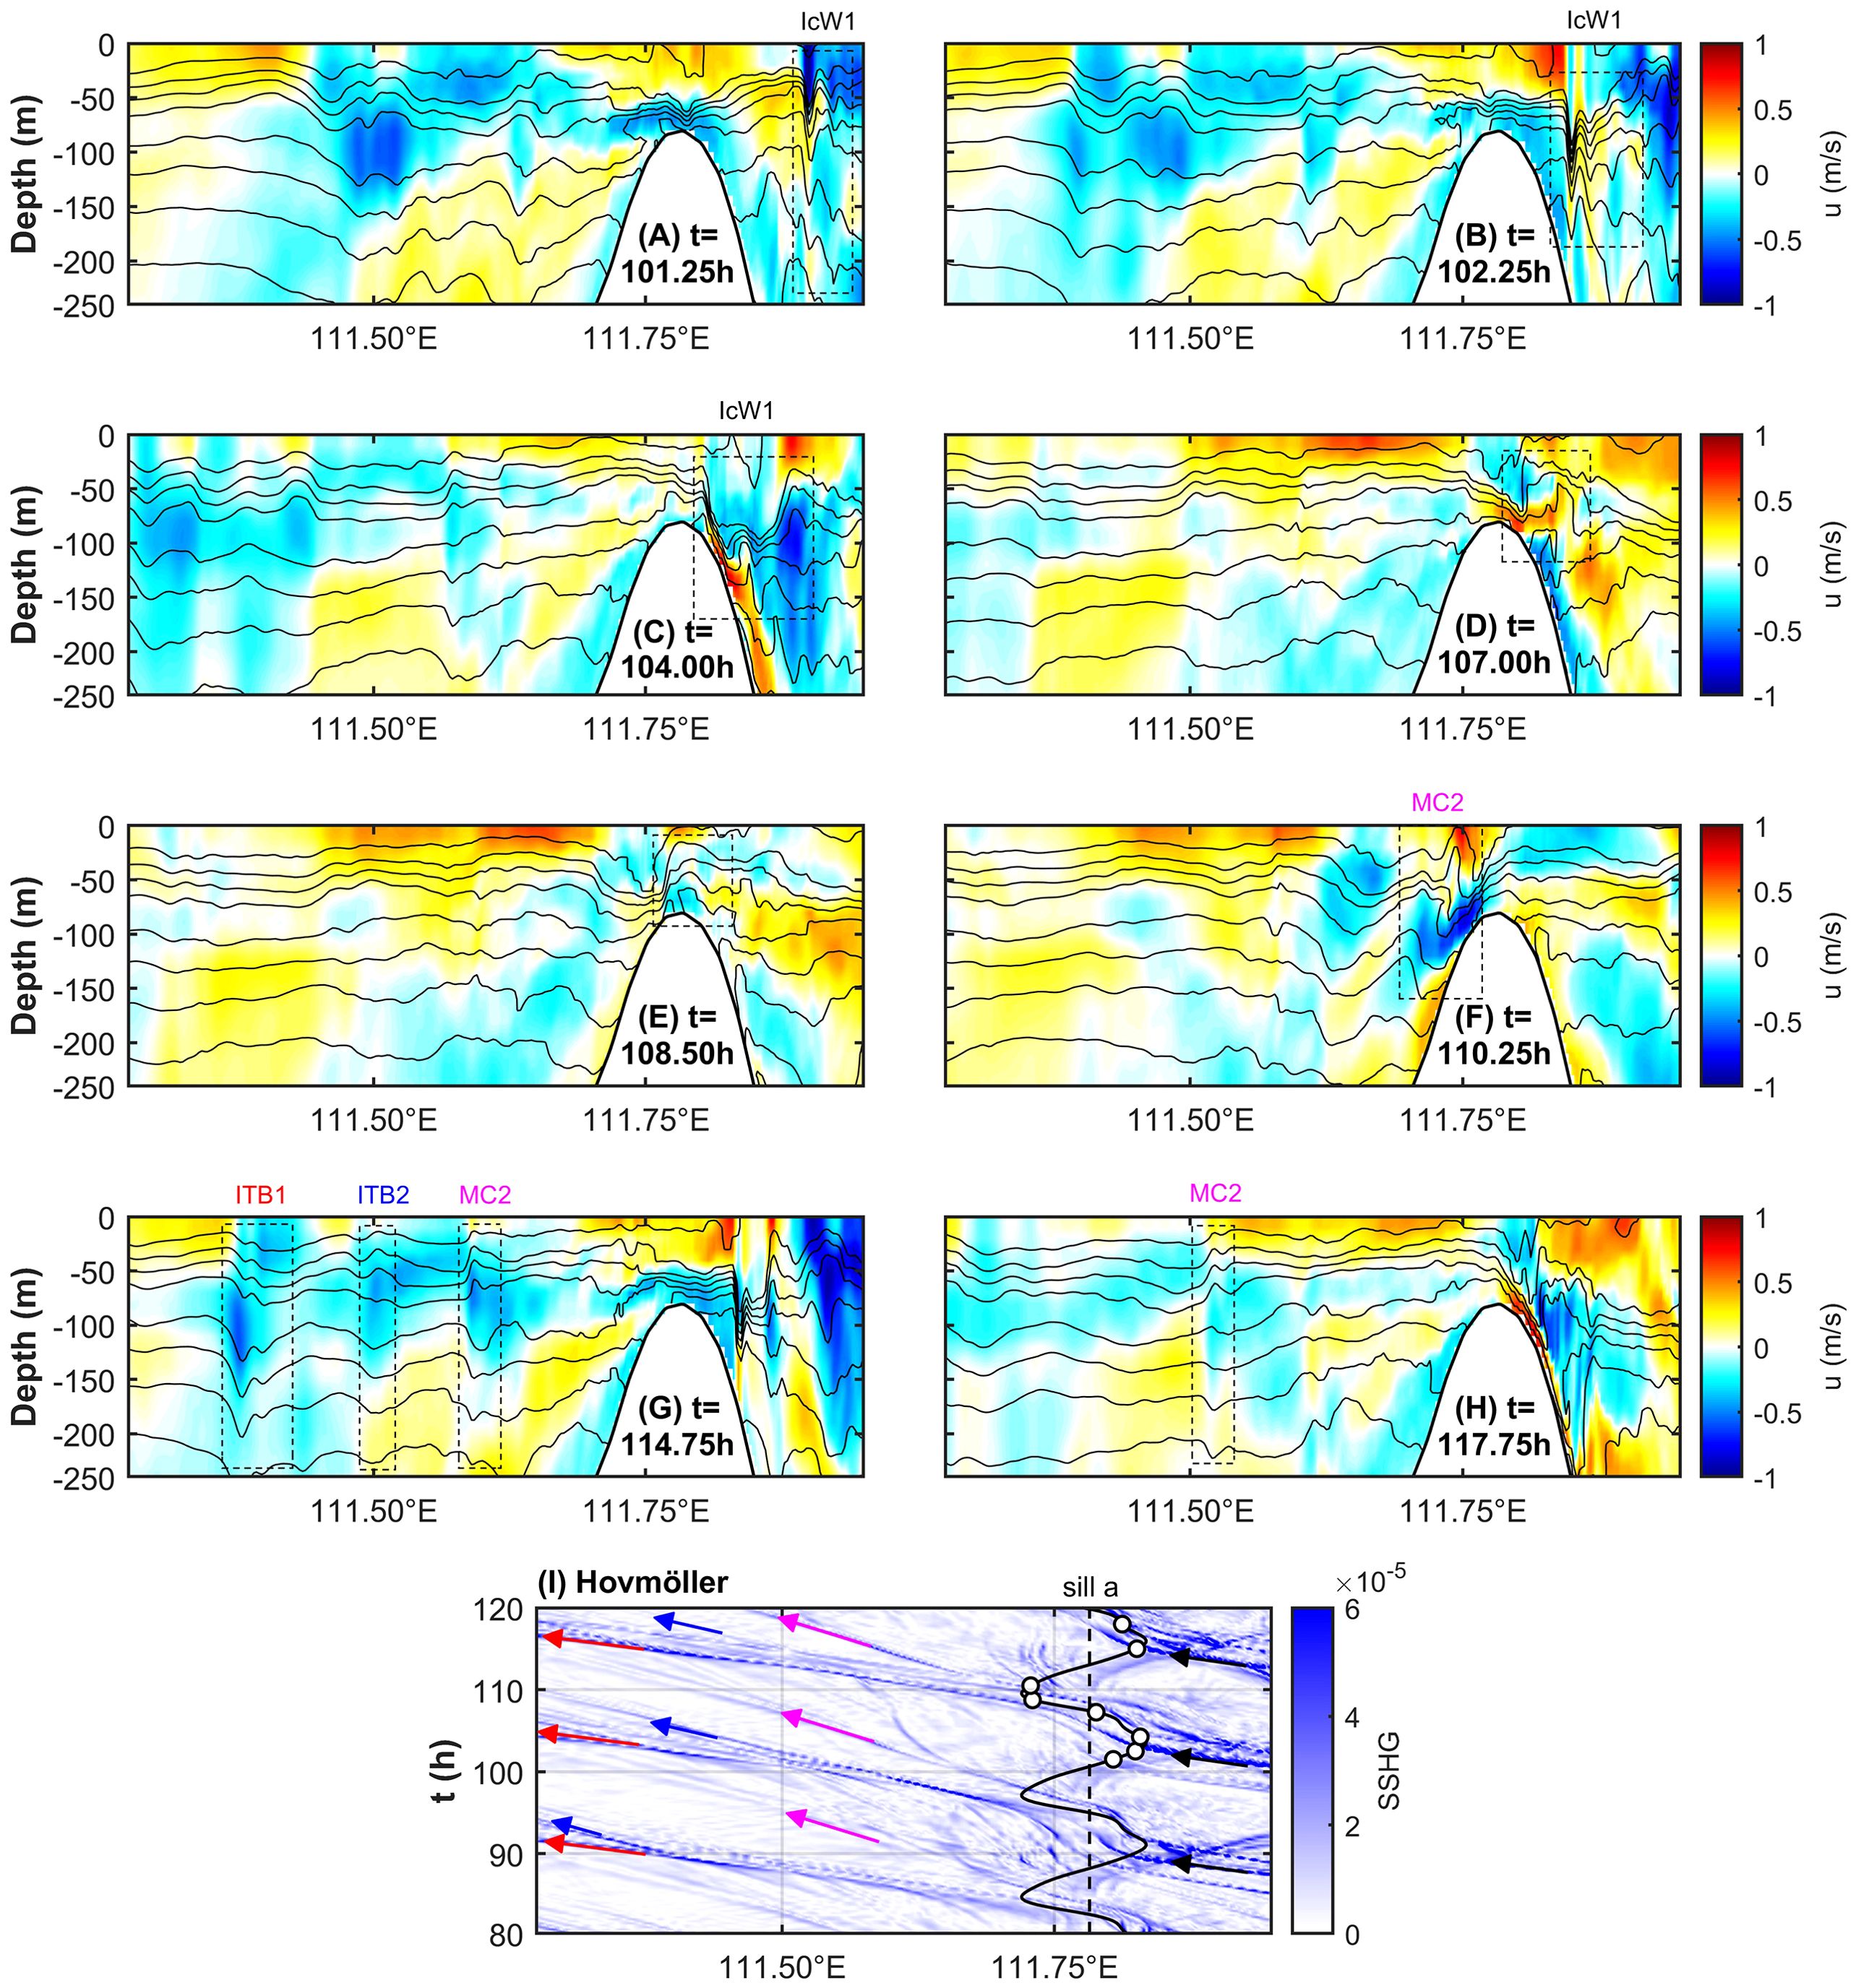
Figure 11. Mode conversion of westward propagating incident first-mode ISWs at sill a of the Xisha Islands. (A–H) are the distribution of the horizontal baroclinic velocity u in m s-1 with isotherms near sill a for case EXP_std. Black dashed boxes labeled with IcW1, ITB1, ITB2 and MC2 show sequentially the waveforms of incident first-mode wave, first- and second-mode ISWs generated through the internal tidal beam mechanism and second-mode ISWs generated through mode conversion, respectively. (I) is the Hovmöller diagram of SSHG. The meaning of the vertical black dashed line, the black curve as well as the white dots on the curve are the same as those of Figure 7I. The blue trajectory labeled with black, red, blue and magenta arrows indicate the westward propagation of incident first-mode waves, first- and second-mode ISWs generated through the internal tidal beam mechanism, and second-mode ISWs generated through mode conversion, respectively.
On the physical mechanism of the mode conversion of ISWs under the impacts of varying terrain, Vlasenko and Alpers (2005) implemented a 2D numerical simulation and reported that the breaking of mode-1 incident ISWs above a steep sill induce the generation of mode-2 transmitted convex ISWs. When large-amplitude mode-1 ISWs impinge upon an underwater bank, the rear side of the wave steepens and elevates, taking the denser water into the lighter water layer and triggering intensive diapycnal mixing. When mode-1 ISWs break, instabilities are induced, vortices are excited and mode-2 ISWs with larger vertical shear are generated (Vlasenko and Hutter, 2001). The breaking criterion proposed in Vlasenko and Hutter (2002a, 2002b) and Vlasenko and Alpers (2005) is applied to these simulation results, exhibiting similar generation mechanism of mode-2 transmitted convex ISWs.
Comparing Figure 11I with Figure 7I, further elaboration of the mechanism of the mode conversion of ISWs at sill a is as follows: From subsection 3.1, in each M2 period at sill a of the Xisha Islands a westward second-mode convex ISW is generated through the lee-wave mechanism, and in each M2 period at sill b of the Zhongsha Islands a westward first-mode ISWs train is generated. The latter arrives at sill a of the Xisha Islands at the same moment as the former generates, when the tidal current at sill a turns from eastwards to westwards. Therefore, the formation of the above westward second-mode convex ISWs here can be explained from the perspective of waveform: the upper part of the waveform shown in box MC2 in Figure 11F is the elevation fluctuation formed by the polarity transition of the incident first-mode wave, while the depression fluctuation formed by the westward background tide on the back slope of the sill constitutes the lower part of the waveform. The polarity transition process and the lee-wave occur simultaneously, forming the waveform structure of the second-mode convex ISWs.
The westward second-mode ISWs generated by the combined effect of the polarity transition process and the lee-wave mechanism, which are marked with magenta arrows in Hovmöller diagram (Figure 11I), can be distinguished from the first- and second-mode westward ISWs generated locally from sill a through the internal tidal beam mechanism according to the moment of occurrence. The evolution of the aforementioned first- and second-mode westward ISWs is marked by boxes ITB1 and ITB2 in Figure 11G, respectively, and are marked with red and blue arrows in Hovmöller diagram (Figure 11I), respectively. It could be seen that the ISWs in the sea area west of the Xisha Islands have the characteristics of multiple generation sites including the local sources, i.e. Xisha Islands, and the far-field sources, i.e. Zhongsha Islands.
In summary, westward propagating first-mode depression ISWs generated from the far field undergo a mode conversion at the shallow-water sill (sill a) of the Xisha Islands, forming a second-mode convex ISW that continues to propagate westwards. The westward propagating second-mode ISWs in the sea area west of the shallow-water sill of the Xisha Islands have multiple generation mechanisms and source sites, including those generated locally by the internal tidal beam mechanism and those formed by mode conversion of far-field ISWs at the shallow-water sill of the Xisha Islands.
This paper investigated the generating mechanism of ISWs in the Xisha sea area using a nonlinear, non-hydrostatic 2D numerical model. The wave-wave interaction between the far-field and local-generated ISWs is explored and the influence of the Xisha topography on the far-field ISWs are presented. Main conclusions are as follows:
1. In Xisha sea area exist ISWs generated from local seamounts and far field. The west sill (sill b) of the Zhongsha Islands can generate westward first-mode ISWs through the internal tidal beam mechanism. The shallow-water sill (sill a) of the Xisha Islands can generate first- and second-mode westward ISWs and eastward ISWs through the internal tidal beam mechanism. In addition, sill a of the Xisha Islands can also generate the westward second-mode ISWs through the lee-wave mechanism.
2. The influence of the Xisha topography on the far-field ISWs generated from Zhongsha Islands includes three aspects: firstly, the local-generated eastward ISWs collide with the far-field westward first-mode ISWs, causing the latter to decrease in amplitude and undergo significant phase shift; secondly, when approaching the Xisha Islands, the linear phase speed of the aforementioned far-field ISWs is affected by the bathymetric variation of the Xisha Islands, initially increasing and then decreasing; thirdly, the far-field first-mode ISWs arrive at the shallow-water sill of the Xisha Islands and convert into westward second-mode convex ISWs.
In summary, this study uncovers the local generation of ISWs in the Xisha sea area as well as the impact of Xisha topography on the far-field ISWs through a 2D idealized numerical model on a typical transection. The results suggest that the variable topography of Xisha Islands contributes to the complicated internal wave field of Xisha sea area, where exist multi-source and multimodal internal waves generated through multiple mechanisms. Internal waves at different stages of development exist simultaneously and probably interact with each other during propagation. The varying terrain influence the phase speed of internal waves and induce the mode conversion of far-field mode-1 ISWs.
On the dynamical processes of internal waves in the Xisha sea area, there are still quite a few interesting questions remained, which are worthy of further studies through realistic 3D modeling, such as the wave-wave interactions and wave-current interactions under the impacts of topography, wave-induced diapycnal turbulent mixing among seamounts, other factors that may affect the generation and propagation of ISWs, and so on. In the further research, more in-situ observations in the Xisha sea area are required for comprehensive model validation and for the improvement of parameterization scheme. The exploration of physical mechanisms in this study will provide theoretical foundations for future investigations.
The raw data supporting the conclusions of this article will be made available by the authors, without undue reservation.
HC: Data curation, Formal Analysis, Investigation, Methodology, Software, Validation, Visualization, Writing – original draft. AX: Investigation, Software, Validation, Writing – review & editing. HH: Methodology, Software, Validation, Writing – review & editing. DL: Conceptualization, Formal Analysis, Software, Validation, Writing – review & editing. CL: Formal Analysis, Validation, Visualization, Writing – review & editing. XC: Conceptualization, Funding acquisition, Project administration, Supervision, Writing – review & editing.
The author(s) declare that financial support was received for the research and/or publication of this article. This research has been supported by the National Natural Science Foundation of China (NSFC), Grant No. U23A2032 (Interaction between internal waves and other multi-scale ocean dynamic processes in Xisha sea area).
The authors thank both the National Supercomputing Center in Jinan and the Marine Big Data Center of Institute for Advanced Ocean Study at Ocean University of China for the provision of computing resource.
The authors declare that the research was conducted in the absence of any commercial or financial relationships that could be construed as a potential conflict of interest.
The author(s) declare that no Generative AI was used in the creation of this manuscript.
All claims expressed in this article are solely those of the authors and do not necessarily represent those of their affiliated organizations, or those of the publisher, the editors and the reviewers. Any product that may be evaluated in this article, or claim that may be made by its manufacturer, is not guaranteed or endorsed by the publisher.
The Supplementary Material for this article can be found online at: https://www.frontiersin.org/articles/10.3389/fmars.2025.1533191/full#supplementary-material
Supplementary Figure 1 | (A) is the distribution of the horizontal baroclinic velocity u in m s-1 with isotherms at t = 69 h for case EXP_std. (B, C) are similar to (A) but at t = 65 h for case EXP_rm_a and for case EXP_rm_XS, respectively. Topography set for the three cases are shown in (D) and the gray shading box denotes the plotting regions of (A–C). Sill a is indicated by a in (D).
Alford M. H., Peacock T., MacKinnon J. A., Nash J. D., Buijsman M. C., Centurioni L. R., et al. (2015). The formation and fate of internal waves in the South China Sea. Nature 521, 65–69. doi: 10.1038/nature14399
Amante C., Eakins B. W. (2009). Data from: ETOPO1 1 arc-minute global relief model: procedures, data sources and analysis. NOAA technical memorandum NESDIS NGDC-24 (Boulder, Colorado: National Geophysical Data Center, NOAA). doi: 10.7289/V5C8276M
Apel J. R., Ostrovsky L. A., Stepanyants Y. A., Lynch J. F. (2007). Internal solitons in the ocean and their effect on underwater sound. J. Acoust. Soc Am. 121, 695–722. doi: 10.1121/1.2395914
Buijsman M. C., Kanarska Y., McWilliams J. C. (2010). On the generation and evolution of nonlinear internal waves in the South China Sea. J. Geophys. Res. Oceans 115, C02012. doi: 10.1029/2009jc005275
Cai S., Long X., Gan Z. (2003). A method to estimate the forces exerted by internal solitons on cylindrical piles. Ocean Eng. 30, 673–689. doi: 10.1016/S0029-8018(02)00038-0
Davis K. A., Arthur R. S., Reid E. C., Rogers J. S., Fringer O. B., DeCarlo T. M., et al. (2020). Fate of internal waves on a shallow shelf. J. Geophys. Res. Oceans 125, e2019JC015377. doi: 10.1029/2019jc015377
Egbert G. D., Erofeeva S. Y. (2002). Efficient inverse modeling of barotropic ocean tides. J. Atmos. Ocean. Technol. 19, 183–204. doi: 10.1175/1520-0426(2002)019<0183:EIMOBO>2.0.CO;2
Feng X., Wang L., Ji C., Wang H., Zhu C., Jia Y. (2023). The impact of internal solitary waves on deep-sea benthic organisms on the continental slope of the northern South China Sea. Front. Mar. Sci. 10. doi: 10.3389/fmars.2023.1184397
Garcia H. E., Boyer T. P., Baranova O. K., Locarnini R. A., Mishonov A. V., Grodsky A., et al (2019). World ocean atlas 2018: product documentation. Ed. Mishonov A. (Silver Spring, Maryland: NCEI NESDIS NOAA).
Gerkema T. (2001). Internal and interfacial tides: beam scattering and local generation of solitary waves. J. Mar. Res. 59, 227–255. doi: 10.1357/002224001762882646
Grimshaw R., Pelinovsky E., Talipova T., Kurkina O. (2010). Internal solitary waves: propagation, deformation and disintegration. Nonlin. Processes Geophys. 17, 633–649. doi: 10.5194/npg-17-633-2010
Grisouard N., Staquet C., Gerkema T. (2011). Generation of internal solitary waves in a pycnocline by an internal wave beam: a numerical study. J. Fluid Mech. 676, 491–513. doi: 10.1017/jfm.2011.61
Guo C., Chen X. (2014). A review of internal solitary wave dynamics in the northern South China Sea. Prog. Oceanogr. 121, 7–23. doi: 10.1016/j.pocean.2013.04.002
Huang X., Chen Z., Zhao W., Zhang Z., Zhou C., Yang Q., et al. (2016). An extreme internal solitary wave event observed in the northern South China Sea. Sci. Rep. 6, 30041. doi: 10.1038/srep30041
Huang H., Qiu S., Zeng Z., Song P., Guo J., Chen X. (2024). Modulation of internal solitary waves by one mesoscale eddy pair west of the Luzon Strait. J. Phys. Oceanogr. 54, 2133–2152. doi: 10.1175/JPO-D-23-0244.1
Huang H., Song P., Qiu S., Guo J., Chen X. (2023). A nonhydrostatic oceanic regional model, ORCTM v1, for internal solitary wave simulation. Geosci. Model. Dev. 16, 109–133. doi: 10.5194/gmd-16-109-2023
Huang L., Yang J., Ma Z., Liu B., Ren L., Liu A. K., et al. (2024). Generation of diurnal internal solitary waves (ISW-D) in the Sulu Sea: From geostationary orbit satellites and numerical simulations. Prog. Oceanogr. 225, 103279. doi: 10.1016/j.pocean.2024.103279
Jia T., Liang J., Li X.-M., Li Q. (2023). Generation of nonlinear internal waves on the northern continental shelf south of Hainan Island. Cont. Shelf Res. 266, 105083. doi: 10.1016/j.csr.2023.105083
Jia T., Liang J., Li Q., Sha J., Li X.-M. (2021). Generation of shoreward nonlinear internal waves south of the Hainan Island: synthetic aperture radar observations and numerical simulations. J. Geophys. Res. Oceans 126, e2021JC017334. doi: 10.1029/2021jc017334
Lamb K. G. (2014). Internal wave breaking and dissipation mechanisms on the continental slope/shelf. Annu. Rev. Fluid. Mech. 46, 1545–4479. doi: 10.1146/annurev-fluid-011212-140701
Li D., Chen X., Liu A. (2011). On the generation and evolution of internal solitary waves in the northwestern South China Sea. Ocean Modell. 40, 105–119. doi: 10.1016/j.ocemod.2011.08.005
Li J., Huang X., Shi Y., Yang Y., Zhao W. (2023). Effects of internal solitary waves on three-dimensional sound propagation and DOA estimation in the South China Sea. Appl. Acoust. 212, 109612. doi: 10.1016/j.apacoust.2023.109612
Liang J., Li X.-M., Sha J., Jia T., Ren Y. (2019). The lifecycle of nonlinear internal waves in the northwestern South China Sea. J. Phys. Oceanogr. 49, 2133–2145. doi: 10.1175/jpo-d-18-0231.1
Liu Z. (2010). Instability of baroclinic tidal flow in a stratified fjord. J. Phys. Oceanogr. 40, 139–154. doi: 10.1175/2009jpo4154.1
Liu A. K., Hsu M. K. (2004). Internal wave study in the South China Sea using synthetic aperture radar (SAR). Int. J. Remote Sens. 25, 1261–1264. doi: 10.1080/01431160310001592148
Marsland S. J., Haak H., Jungclaus J. H., Latif M., Röske F. (2003). The Max-Planck-Institute global ocean/sea ice model with orthogonal curvilinear coordinates. Ocean Modell. 5, 91–127. doi: 10.1016/S1463-5003(02)00015-X
Moum J. N., Farmer D. M., Smyth W. D., Armi L., Vagle S. (2003). Structure and generation of turbulence at interfaces strained by internal solitary waves propagating shoreward over the continental shelf. J. Phys. Oceanogr. 33, 2093–2112. doi: 10.1175/1520-0485(2003)033<2093:SAGOTA>2.0.CO;2
Nan F., He Z., Zhou H., Wang D. (2011). Three long-lived anticyclonic eddies in the northern South China Sea. J. Geophys. Res. Oceans 116, C05002. doi: 10.1029/2010JC006790
Osborne A. R., Burch T. L. (1980). Internal solitons in the andaman sea. Science 208, 451–460. doi: 10.1126/science.208.4443.451
Pacanowski R. C., Philander S. G. H. (1981). Parameterization of vertical mixing in numerical models of tropical oceans. J. Phys. Oceanogr. 11, 1443–1451. doi: 10.1175/15200485(1981)011<1443:POVMIN>2.0.CO;2
Qiu N., Liu X., Liu Z., Li Y., Hu P., Chang Y., et al. (2023). Mechanical model and characteristics of deep-water drilling riser-wellhead system under internal solitary waves. Mar. Struct. 90, 103439. doi: 10.1016/j.marstruc.2023.103439
Raju N. J., Dash M. K., Bhaskaran P. K., Pandey P. C. (2021). Numerical investigation of bidirectional mode-1 and mode-2 internal solitary wave generation from north and south of Batti Malv Island, Nicobar Islands, India. J. Phys. Oceanogr. 51, 47–62. doi: 10.1175/jpo-d-19-0182.1
Ramp S., Tang T., Duda T., Lynch J. F., Liu A., Chiu C.-S., et al. (2004). Internal solitons in the northeastern South China Sea. part I: sources and deep water propagation. IEEE J. Oceanic Eng. 29, 1157–1181. doi: 10.1109/joe.2004.840839
Sandstrom H., Elliott J. A., Cochrane N. A. (1989). Observing groups of solitary internal waves and turbulence with batfish and echosounder. J. Phys. Oceanogr. 19, 987–997. doi: 10.1175/1520-0485(1989)019<0987:OGOSIW>2.0.CO;2
Shaw P.-T., Ko D. S., Chao S.-Y. (2009). Internal solitary waves induced by flow over a ridge: with applications to the northern South China Sea. J. Geophys. Res. Oceans 114, C02019. doi: 10.1029/2008jc005007
Shu Y., Wang J., Xue H., Huang R., Chen J., Wang D., et al. (2022). Deep-current intraseasonal variability interpreted as topographic rossby waves and deep eddies in the xisha islands of the South China sea. J. Phys. Oceanogr. 52, 1415–1430. doi: 10.1175/JPO-D-21-0147.1
Stashchuk N., Inall M., Vlasenko V. (2007). Analysis of supercritical stratified tidal flow in a Scottish Fjord. J. Phys. Oceanogr. 37, 1793–1810. doi: 10.1175/jpo3087.1
St. Laurent L., Garrett C. (2002). The role of internal tides in mixing the deep ocean. J. Phys. Oceanogr. 32, 2882–2899. doi: 10.1175/1520-0485(2002)032<2882:troiti>2.0.co;2
Tensubam C. M., Raju N. J., Dash M. K., Barskar H. (2021). Estimation of internal solitary wave propagation speed in the Andaman Sea using multi-satellite images. Remote Sens. Environ. 252, 112123. doi: 10.1016/j.rse.2020.112123
Vlasenko V., Alpers W. (2005). Generation of secondary internal waves by the interaction of an internal solitary wave with an underwater bank. J. Geophys. Res. Oceans 110, C02019. doi: 10.1029/2004jc002467
Vlasenko V. I., Hutter K. (2001). Generation of second mode solitary waves by the interaction of a first mode soliton with a sill. Nonlinear Process. Geophys. 8, 223–239. doi: 10.5194/npg-8-223-2001
Vlasenko V., Hutter K. (2002a). Numerical experiments on the breaking of solitary internal waves over a slope-shelf topography. J. Phys. Oceanogr. 32, 1779–1793. doi: 10.1175/1520-0485(2002)032<1779:NEOTBO>2.0.CO;2
Vlasenko V. I., Hutter K. (2002b). Transformation and disintegration of strongly nonlinear internal waves by topography in stratified lakes. Ann. Geophys. 20, 2087–2103. doi: 10.5194/angeo-20-2087-2002
Vlasenko V., Stashchuk N., Guo C., Chen X. (2010). Multimodal structure of baroclinic tides in the South China Sea. Nonlinear Proc. Geoph. 17, 529–543. doi: 10.5194/npg-17-529-2010
Vlasenko V., Stashchuk N., Hutter K. (2005). Baroclinic tides: theoretical modeling and observational evidence (Cambridge: Cambridge University Press).
Wang Y.-H., Dai C.-F., Chen Y.-Y. (2007). Physical and ecological processes of internal waves on an isolated reef ecosystem in the South China Sea. Geophys. Res. Lett. 34, L18609. doi: 10.1029/2007GL030658
Wang J., Huang W., Yang J., Zhang H., Zheng G. (2013). Study of the propagation direction of the internal waves in the South China Sea using satellite images. Acta Oceanol. Sin. 32, 42–50. doi: 10.1007/s13131-013-0312-6
Wang G., Su J., Chu P. C. (2003). Mesoscale eddies in the South China Sea observed with altimeter data. Geophys. Res. Lett. 30, 2121. doi: 10.1029/2003GL018532
Xu A., Chen X. (2021). A strong internal solitary wave with extreme velocity captured northeast of Dong-Sha Atoll in the northern South China Sea. J. Mar. Sci. Eng. 9, 1277. doi: 10.3390/jmse9111277
Xu Z., Liu K., Yin B., Zhao Z., Wang Y., Li Q. (2016). Long-range propagation and associated variability of internal tides in the South China Sea. J. Geophys. Res. Oceans 121, 8268–8286. doi: 10.1002/2016JC012105
Yan T., Qi Y., Jing Z., Cai S. (2020). Seasonal and spatial features of barotropic and baroclinic tides in the northwestern South China Sea. J. Geophys. Res. Oceans 125, e2018JC014860. doi: 10.1029/2018JC014860
Yuan C., Wang Z. (2022). Bidirectional Whitham type equations for internal waves with variable topography. Ocean Eng. 257, 111600. doi: 10.1016/j.oceaneng.2022.111600
Zeng Z., Chen X., Yuan C., Tang S., Chi L. (2019). A numerical study of generation and propagation of type-a and type-b internal solitary waves in the northern South China Sea. Acta Oceanol. Sin. 38, 20–30. doi: 10.1007/s13131-019-1495-2
Zhang Z., Fringer O. B., Ramp S. R. (2011). Three-dimensional, nonhydrostatic numerical simulation of nonlinear internal wave generation and propagation in the South China Sea. J. Geophys. Res. Oceans 116, C05022. doi: 10.1029/2010JC006424
Zhao Z. (2014). Internal tide radiation from the Luzon Strait. J. Geophys. Res. Oceans 119, 5434–5448. doi: 10.1002/2014JC010014
Zhao Z., Klemas V., Zheng Q., Yan X.-H. (2004). Remote sensing evidence for baroclinic tide origin of internal solitary waves in the northeastern South China Sea. Geophys. Res. Lett. 31, L06302. doi: 10.1029/2003GL019077
Keywords: internal solitary waves, head-on collision, mode conversion, Xisha Islands, numerical simulation
Citation: Chen H, Xu A, Huang H, Li D, Li C and Chen X (2025) Impacts of the Xisha topography on the far-field internal solitary waves. Front. Mar. Sci. 12:1533191. doi: 10.3389/fmars.2025.1533191
Received: 23 November 2024; Accepted: 18 March 2025;
Published: 04 April 2025.
Edited by:
Xi Zhang, Ministry of Natural Resources, ChinaReviewed by:
Weifeng Sun, China University of Petroleum (East China), ChinaCopyright © 2025 Chen, Xu, Huang, Li, Li and Chen. This is an open-access article distributed under the terms of the Creative Commons Attribution License (CC BY). The use, distribution or reproduction in other forums is permitted, provided the original author(s) and the copyright owner(s) are credited and that the original publication in this journal is cited, in accordance with accepted academic practice. No use, distribution or reproduction is permitted which does not comply with these terms.
*Correspondence: Xueen Chen, eGNoZW5Ab3VjLmVkdS5jbg==
Disclaimer: All claims expressed in this article are solely those of the authors and do not necessarily represent those of their affiliated organizations, or those of the publisher, the editors and the reviewers. Any product that may be evaluated in this article or claim that may be made by its manufacturer is not guaranteed or endorsed by the publisher.
Research integrity at Frontiers

Learn more about the work of our research integrity team to safeguard the quality of each article we publish.