 Michelle Zapp Sluis1*
 Daniel L. Lippi1
 Phillip J. Sanchez1,2
 Nathaniel R. Miller3
 Shane A. Stephens1
 Beatrice P. Ferreira4
 Jay R. Rooker1
- 1Department of Marine Biology, College of Marine Sciences and Maritime Studies, Texas A&M University, Galveston, TX, United States
- 2Noas Island Laboratories, Smithsonian Tropical Research Institute, Panama City, Panama
- 3Jackson School of Geosciences, The University of Texas at Austin, Austin, TX, United States
- 4Department of Oceanography, Federal University of Pernambuco, Recife, PE, Brazil
Different applications of inductively coupled plasma mass spectrometry (ICP-MS) have the potential to influence results of otolith geochemical assays. Laser ablation and solution-based ICP-MS were compared on paired otoliths from three species of juvenile fish representative of estuarine (red drum [Sciaenops ocellatus]), coastal/reef (gray parrotfish [Sparisoma axillare]), and pelagic (blackfin tuna [Thunnus atlanticus]) ecosystems. Additionally, two laser ablation techniques (continuous line transects and series of spots) were performed to determine whether these two commonly used approaches yielded comparable results. No significant differences existed between line transects and spots for any of the three species investigated, with high correlations occurring for all otolith element:Ca (E:Ca) values retained for statistical testing (Mg:Ca, Mn:Ca, Sr:Ca, Ba:Ca), suggesting that both laser ablation techniques produced equivalent otolith E:Ca values. In contrast, pronounced differences in E:Ca values were detected between laser ablation (across otolith transverse section) and solution-based (whole otolith dilution) applications on paired sagittal otoliths. While some E:Ca discrepancies varied among the three species, overall otolith E:Ca values were higher when quantified by laser ablation, except for Ba:Ca which tended to be higher when analyzed by solution-based ICP-MS. Differences observed between laser ablation and solution-based applications are the result of the allometric growth of the otolith and may become more pronounced in older, larger individuals as the differential growth along the otolith axes becomes less uniform with age. Further, laser ablation techniques can examine life history profiles and discern fluctuations over time, proving a preferred application over solution-based analysis.
1 Introduction
Application of otolith (ear stone) geochemistry to develop natural signatures has been a common practice among fishery scientists to distinguish fish from separate nursery habitats (Gillanders and Kingsford, 2000; Zapp Sluis et al., 2012; Rooker et al., 2019), examine natal homing and movement of adult stocks (Thorrold et al., 2001; Fraile et al., 2015; Rooker et al., 2014, 2021), assess population connectivity and stock mixing (Reis-Santos et al., 2013; Sanchez et al., 2020; Rooker et al., 2023), investigate environmental stressor exposure (Limburg and Casini, 2019), and applied as an alternative aging method (Heimbrand et al., 2020; Hüssy et al., 2021; Frey et al., 2023). Otoliths are acellular, metabolically inert and accrete as the fish grows, allowing some elements from surrounding seawater to be incorporated within the otolith matrix and permanently retained throughout life (as reviewed in Campana, 1999). This property led to the development of various analytical techniques to quantify elemental concentrations in otoliths, with inductively coupled plasma mass spectrometry (ICP-MS) currently one of the most widespread applications.
Initially, solution-based ICP-MS was more commonly applied over laser ablation ICP-MS, because it was perceived to be more precise and able to obtain better quantities of trace elements (de Pontual et al., 2000). However, solution-based analysis often relies on whole otoliths being dissolved to incorporate the entire life history of an individual fish. Thus, this approach does not provide age or life-stage specific geochemical information. While micromilling devices can be used to extract otolith cores or material from specific life-history periods for solution-based assays (Arslan and Secor, 2008; Rooker et al., 2010), the size of the drilling bit limits the precision of the sample material collected. With laser ablation ICP-MS, discrete sampling locations on the otolith can be linked to a specific age or life stage of an individual through otolith microstructure analysis, providing the time of occurrence for each geochemical value (Mohan et al., 2022).
Research applications using laser ablation ICP-MS for geochemical analysis of otoliths typically include line transects or a series of spots. Line transects are a continuous ablation path that run parallel or sub-parallel to the radial growth direction of the otolith from the central core (start of life) to the exterior edge (end of life), which are commonly used to generate geochemical life profiles (Serre et al., 2018; Rooker et al., 2021; Mohan et al., 2022). In contrast, spots ablate specific locations on the otolith and are often used to investigate a certain period of life. A series of evenly spaced spots from the core to the margin of the otolith have also been used to examine changes in elemental concentrations throughout the individual’s life (Baumann et al., 2015; Catalán et al., 2018; Sanchez et al., 2020).
Three teleost fish taxa from different ecosystems with distinct physiochemical conditions were selected to evaluate different ICP-MS applications frequently used in the geochemical analysis of otoliths and other biogenic carbonate structures. The primary aim of the study was to determine whether otolith element:Ca (E:Ca) values and resulting geochemical signatures were statistically similar between two common ICP-MS applications (laser ablation and solution-based), and between two widely used laser ablation techniques (continuous line transects versus series of spots). Further, if any variations in otolith E:Ca values occurred between these applications, were similarities or differences consistent among the three species or variety of ecosystems (estuarine, coastal/reef, pelagic) assessed in this study.
2 Materials and methods
Sagittal otolith pairs were obtained from three species collected in different geographic locations. The finfish taxa used in this assessment were representative of individuals inhabiting estuarine (red drum [Sciaenops ocellatus]), coastal/reef (gray parrotfish [Sparisoma axillare]), and pelagic (blackfin tuna [Thunnus atlanticus]) ecosystems. Red drum were collected along the coast of Texas, USA from either Galveston Bay or the Upper Laguna Madre. Gray parrotfish were collected from reef or seagrass habitats along the southern coast of Pernambuco, Brazil. Blackfin tuna were collected from the Caribbean Sea (Saint Lucia) and the northern Gulf of Mexico. Otoliths from 10 individuals from each region or habitat type were used in the analyses, resulting in 20 samples per species. All specimens were juveniles, with respective restricted size ranges to minimize potential age/size effects for comparisons between the two sampling locations for each species.
Otoliths were rinsed with 18 megohm doubly deionized water (DDIH2O) and a soft bristled plastic brush was used to remove any adhering tissue residue. To further reduce any surface contamination, otoliths were then soaked in 1% ultra-pure nitric acid (HNO3) for 1 minute, then liberally rinsed with DDIH2O to remove the acid. After drying under a class 100 laminar flow hood, otoliths were stored in acid washed plastic vials until prepared for elemental analysis.
2.1 Laser ablation ICP-MS
One sagittal otolith from each pair was embedded in Struers EpoFix resin, sectioned, and prepared for laser ablation ICP-MS analysis. A low speed ISOMET saw was used to cut a 1.5 mm transverse section of the embedded otolith containing the core. These thin sections were attached to petrographic slides with Crystalbond thermoplastic glue and polished until the core was revealed. Indium (In) was added to the resin in order to observe In spikes if resin was ablated along with otolith material, thus allowing these observations to be removed.
Concentrations of nine elements (7Li, 24-25Mg, 43-44Ca, 55Mn, 59Co, 63Cu, 66Zn, 88Sr, 137Ba) were quantified using an Elemental Scientific NWR193UC (193 nm wavelength, <4 ns pulse width) laser system coupled to an Agilent 7500ce ICP-MS at the University of Texas at Austin. The laser system is equipped with a large format two-volume laser cell with fast washout (<1s), that accommodated all otolith samples and standards in a single load. Prior to analysis, samples and standards were pre-ablated to remove potential surface contamination using a 75 μm wide ablation path moving at a rate of 50 μm s-1, with the laser set at 60% power and 10 Hz. Two laser ablation sampling techniques were analyzed for comparison: continuous line transects versus series of spots. Line transects were acquired with a 50 μm wide ablation path moving at 5 μm s-1 at 50% power and 10 Hz, starting at the core moving outwards along the longest growth axis to the edge. A series of 50 μm diameter ablation spots, with 150 μm spacing between centroids, were measured directly on top of the previous scanned line transect (Figure 1) using the same power and frequency. Fluence variation over the analytical sessions averaged 2.79±0.01 J cm-2 for both line transects and spots. The quadrupole time-resolved method measured 13 masses using integration times of 10 ms (24Mg, 43-44Ca, 88Sr, 115In), 20 ms (25Mg, 55Mn), and 50 ms (7Li, 59Co, 63Cu, 66Zn, 137-138Ba).
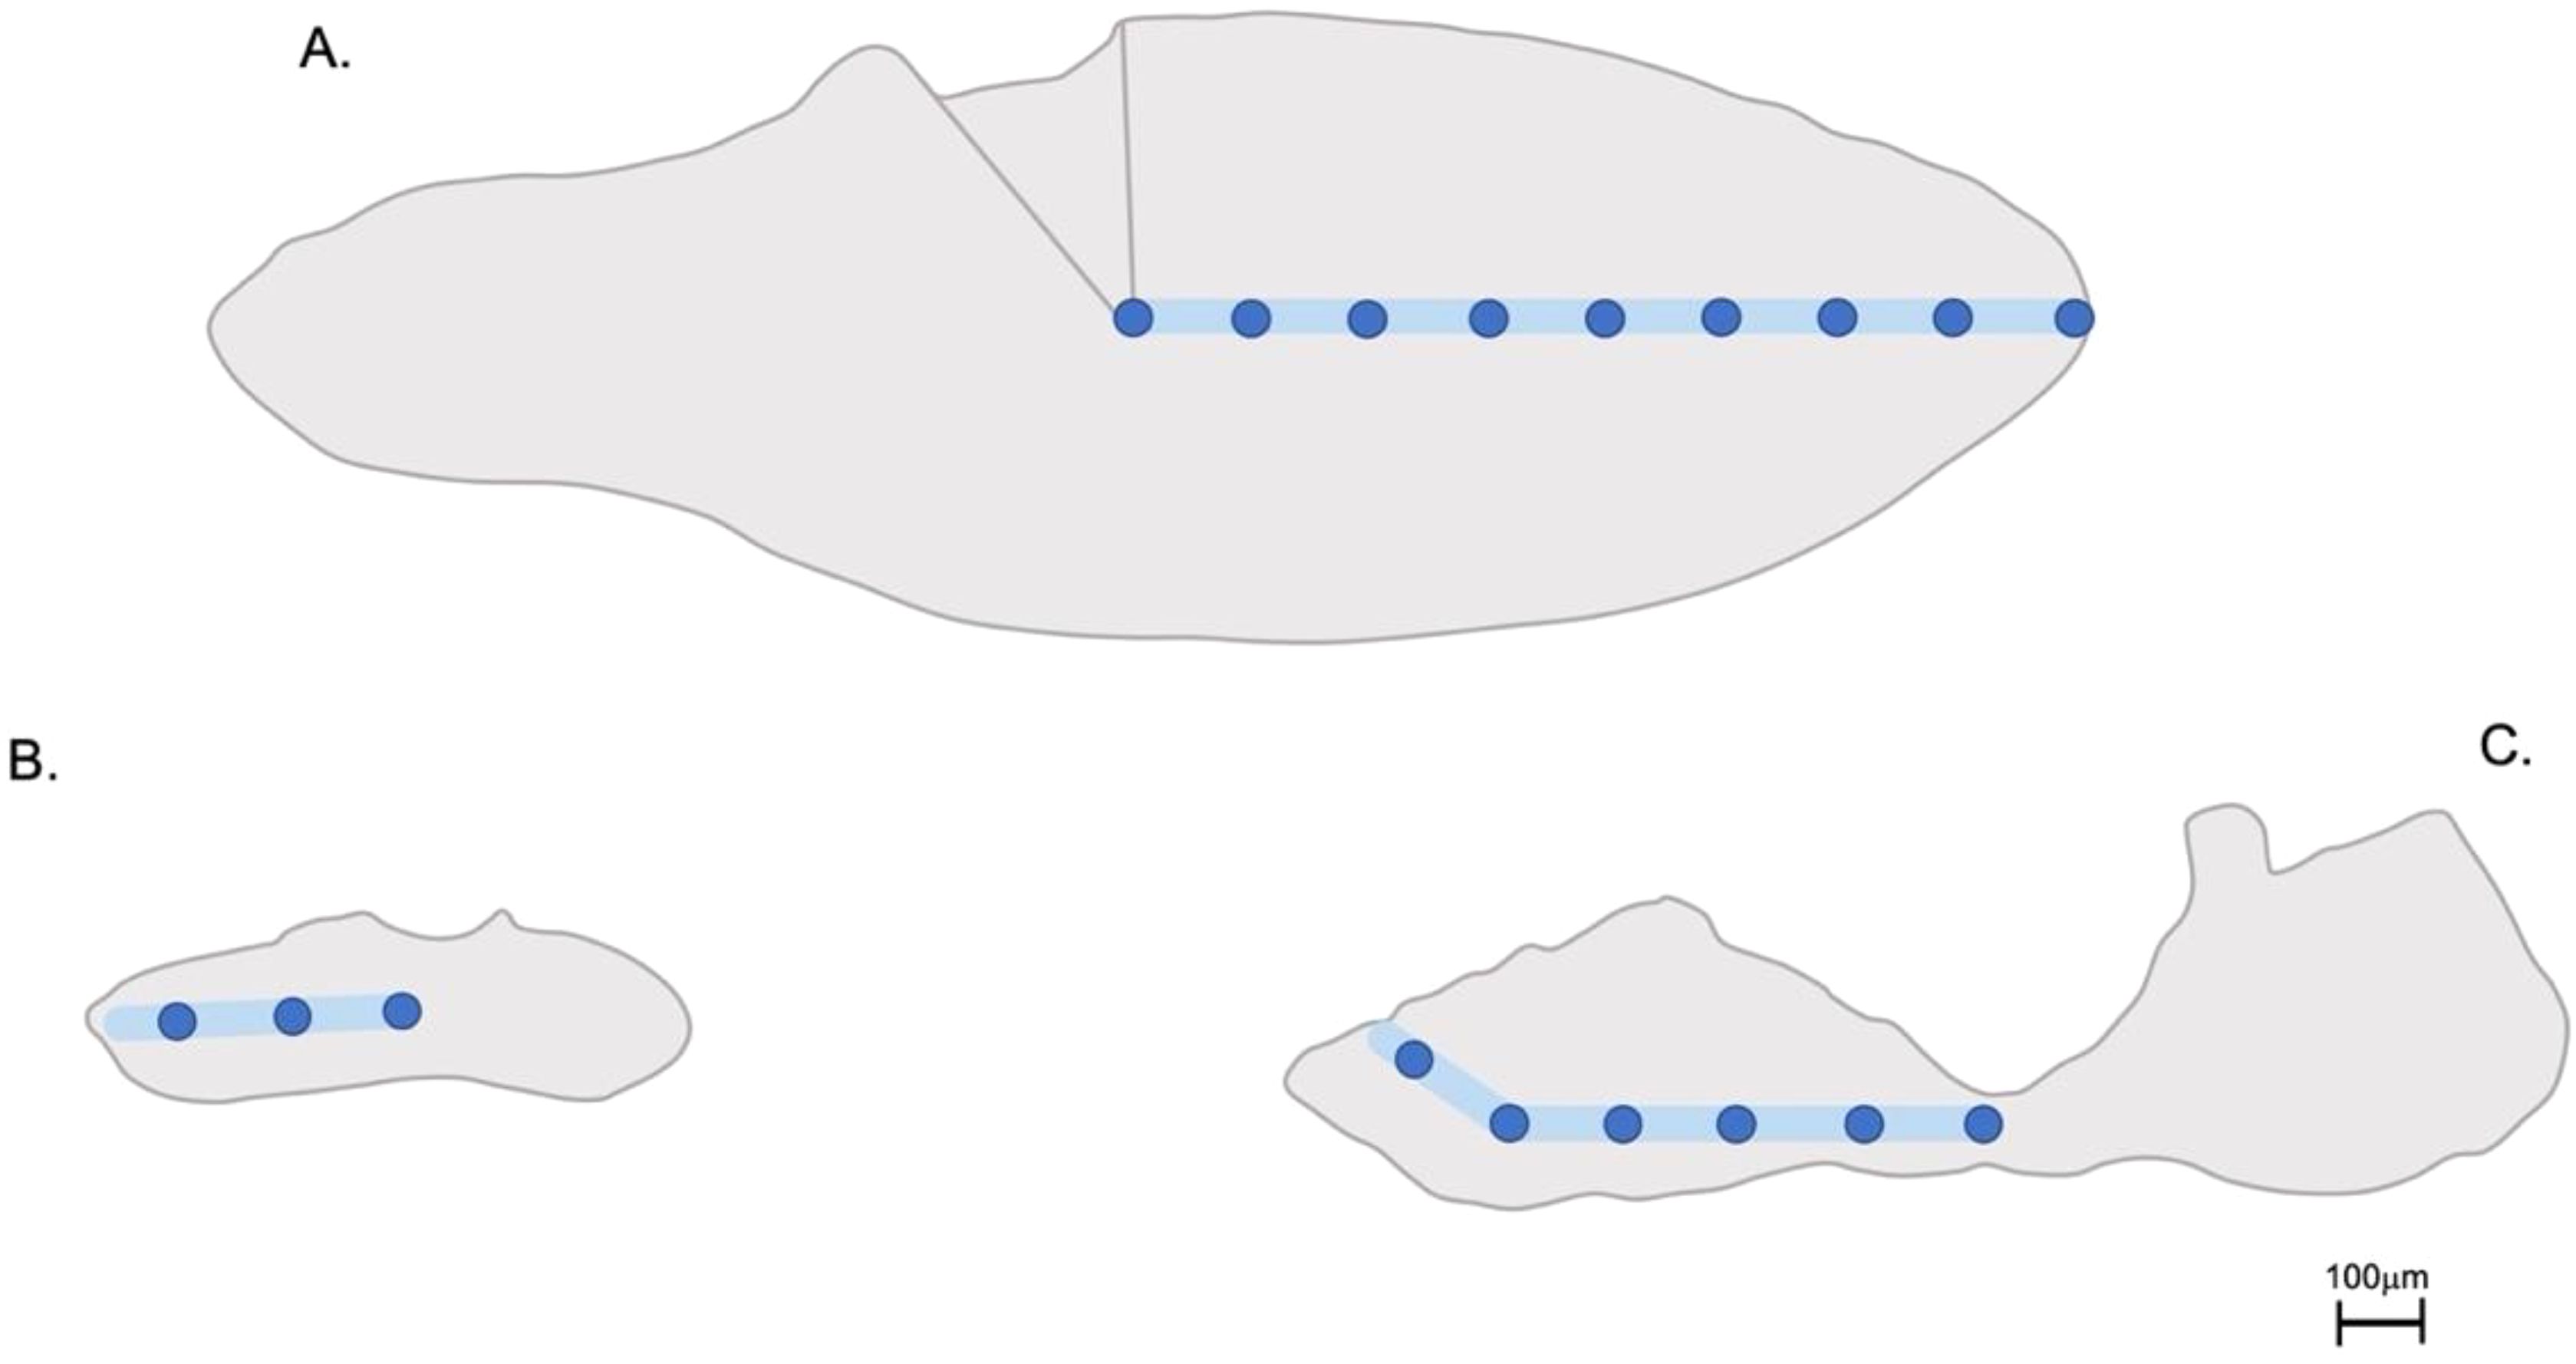
Figure 1. Transverse sections of (A) red drum, (B) gray parrotfish and (C) blackfin tuna otoliths displaying the location of the two laser ablation sampling techniques: continuous line transect (blue line) and series of spots (blue dots).
Time-resolved intensities were converted to concentration (ppm) equivalents using Iolite software (Hellstrom et al., 2008), with 43Ca as the internal standard and a Ca index value of 38.3 weight %. The trace element concentration values were divided by 383,000 ppm Ca to obtain E:Ca values comparable to those obtained from solution-based analysis. Baselines were determined from 30-s gas blank intervals measured while the laser was off and all masses were scanned by the quadrupole. The USGS MACS-3 (synthetic aragonite) was used as the primary reference standard and accuracy and precision were proxied from replicates of NIST 612 analyzed as an unknown. NIST 612 analyte recoveries (N=97) for both line transect and spot techniques were typically within 5% of GeoREM preferred values (http://georem.mpch-mainz.gwdg.de). Laser analyses of unknowns were bracketed hourly by standard measurements (MACS-3 and NIST 612, typically measured in triplicate for 60-s).
2.2 Solution-based ICP-MS
Solution-based ICP-MS analysis was conducted on whole otolith digests for all three species using the same ICP-MS unit as the laser ablation analysis to quantify the nine elements listed above. All elements were indexed to Ca to obtain E:Ca values. One sagittal otolith from each otolith pair, blanks, and standards (calibration, quality control) were prepared using trace metal grade reagents in acid-cleaned labware to have a consistent matrix of 40 ppm Ca in 2% HNO3. For otolith dissolutions, Ca concentrations were assumed consistent with the NRC FEBS-1 otolith standard (383,000 ± 1400 ppm Ca). The initial digestion involved the addition of 4 or 7 mL of 2% HNO3, which provided a 10-20x molar excess for dissolving the otolith. The reaction occurred for two days with episodic agitation. A second dilution was performed on blackfin tuna and red drum otoliths only, as gray parrotfish otoliths were much smaller, to obtain an estimated 40 ppm Ca in the final solution (40.01 ± 0.40 Ca was average for all samples). The final dissolution provided about 4 mL of sample for the blackfin tuna and red drum otoliths, and as little as 0.75 mL for gray parrotfish otoliths.
A fairly high (for ICP-MS), but invariant, Ca concentration (Ca: 40.337 ± 0.131 ppm; n=6) was used to allow calculated E:Ca values for each calibration standard to be entered in the data analysis table and, in turn, E:Ca values to be outputted directly in a single analysis based on the linear relationship between element intensity and E:Ca value (R = 1.0000 for all E:Ca). The calibration range for each E:Ca was designed to bracket typical elemental concentrations in otoliths across fish species (Campana, 1999). Prior to analysis, the instrument was optimized for sensitivity across the atomic mass unit range, while minimizing oxide production (< 1.2%). The Octopol Reaction System® was operated in no-gas mode for all analytes (7Li, 24-25Mg, 43-44Ca, 55Mn, 59Co, 63Cu, 66Zn, 88Sr, 137Ba). Intensities of internal standard elements (Sc, Ge, In), mixed into unknowns via in-run pumping, were used to compensate for instrumental drift (<2% throughout the analytical sequence). Limits of detection (LOD), based upon the population of blank (40 ppm Ca in 2% HNO3, n=20) analyses interspersed throughout the analytical sequence ranged between 1x10⁻⁴ (Sr:Ca), 1x10⁻⁵ (Mg:Ca), and 1x10⁻⁶ (Li:Ca, Mn:Ca, Co:Ca, Cu:Ca, Ba:Ca). Replicates of a mid-range calibration standard (n=2) had typical recoveries within 2% of calculated E:Ca values. Reference standards USGS MACS-3 and FEBS-1 were also dissolved and diluted to achieve a 40 ppm in 2% HNO3 matrix. The E:Ca recoveries were typically within 8% of calculated values for replicates of USGS MACS-3 (N=5) and within 10% for replicates of FEBS-1 (N=5), although Co, Cu, and Zn concentrations are not validated for the latter. Lithium and Co were both below detection for FEBS-1 and all otolith samples. Copper and Zn were below detection for 60% (mainly red drum and blackfin tuna) and 27% (mainly red drum) of samples, respectively. Relative to LODs, median E:Ca values for otolith unknowns were greater by factors of 38 (Sr:Ca), 19 (Ba:Ca), 7 (Mg:Ca, Zn:Ca), and 6 (Mn:Ca); all others were lower than LODS (Co:Ca) or only slightly (<1x) higher (Li:Ca, Cu:Ca). Thus, of the 9 trace elements analyzed, only four (24Mg, 55Mn, 88Sr, and 137Ba) were retained in all statistical analyses based on these detection limits.
2.3 Data analysis
A total of 20 red drum, 17 gray parrotfish, and 20 blackfin tuna otolith pairs (N = 57) were retained in the final statistical analyses; three gray parrotfish samples were removed due to inadequate otolith material for solution-based analysis. Accuracy of the three applications (line transects, spots, and solution-based) was calculated using the recovery rate by taking the ratio of the reference standard measured concentration to the certified concentration (element concentrationmeasured/element concentrationcertified). Analysis of variance (ANOVA) comparisons of recovery rates were applied to further evaluate accuracy (α = 0.05). To examine the precision, a relative standard deviation (RSD = [SD/mean]x100) was calculated as a percent using the reference standard data for comparison. For line transects, data were smoothed using successive 7-point moving median and moving average filters to reduce high frequency outliers in the data set. Overall average otolith E:Ca values for individual fish from either lines or spots were derived by pooling values obtained from each technique, which in turn were then compared to solution-based E:Ca values from the dissolution of the other (paired) otolith. Multivariate analysis of variance (MANOVA) was used to test for differences in otolith geochemical signatures among applications, locations, and an application x location interaction. While it was not surprising that the two locations sampled for each species significantly differed in otolith geochemical signatures due to varying ambient water chemistries, there was no significant application x location interaction for red drum, gray parrotfish, or blackfin tuna. Thus, locations were combined within species to increase sample sizes, and mean E:Ca values of individual elements were analyzed with an ANOVA to determine if concentrations differed among the applications. Tukey’s honestly significant difference (HSD) test was applied to detect a posteriori differences (α = 0.05) among means. Linear regression models were used to evaluate the relationship of individual E:Ca values among paired applications (line vs spots and line vs solution-based) for species combined based on the goodness-fit-measure (R2). Elements that followed the assumption of normality differed among species most likely due to small sample sizes and differences in sampling locations. However, ANOVAs are robust to most violations of normality and thus departures from normality should not compromise the overall results (Underwood, 1981; Blanca et al., 2017).
3 Results
Accuracy of the laser ablation techniques to quantify reference standard values were high, with recovery rates ranging from 94.6-102.2% for line transects and 91.3-102.5% for spots (Table 1). There was no significant difference in the accuracy of laser ablation techniques for all elements, except Mg which had significantly higher (F1,95 = 74.35, P<0.0001) recovery rates for lines (99.2%) compared to spots (91.3%). For solution-based analysis, there was a slight overestimation of the recovery rate for Mg (125.3%) in the FEBS-1 standard, while Ca (86.6%) and Sr (86.1%) were underestimated with MACS-3 (Table 1). The accuracy of the solution-based analysis with MACS-3 was significantly lower for Ca (F1,48 = 418.81, P<0.0001) and Sr (F1,48 = 161.16, P<0.0001) compared to line transects, with no other significant differences occurring among the other elements. Recovery rates of the FEBS-1 standard for solution-based analysis were significantly higher, although sometimes slightly overestimated, for Mg (F1,48 = 117.19, P<0.0001), Mn (F1,48 = 80.36, P<0.0001), and Ba (F1,48 = 31.30, P<0.0001), while significantly lower for Ca (F1,48 = 35.27, P<0.0001) compared to line transects. Relative standard deviations (RSDs) for all three analytical applications were below 6.5% with improved precision calculated for solution-based analysis using the FEBS-1 standard (0.9-2.1%: Table 1). The precision for line transects (1.2-6.3%) and spots (1.5-4.0%) was similar for all elements, except for Ba were the precision for spots (2.9%) was improved compared to line transects (6.3%). The MACS-3 standard for solution-based analysis tended to be less precise, typically producing higher RSD values compared to the other applications (4.4-5.4%; Table 1).
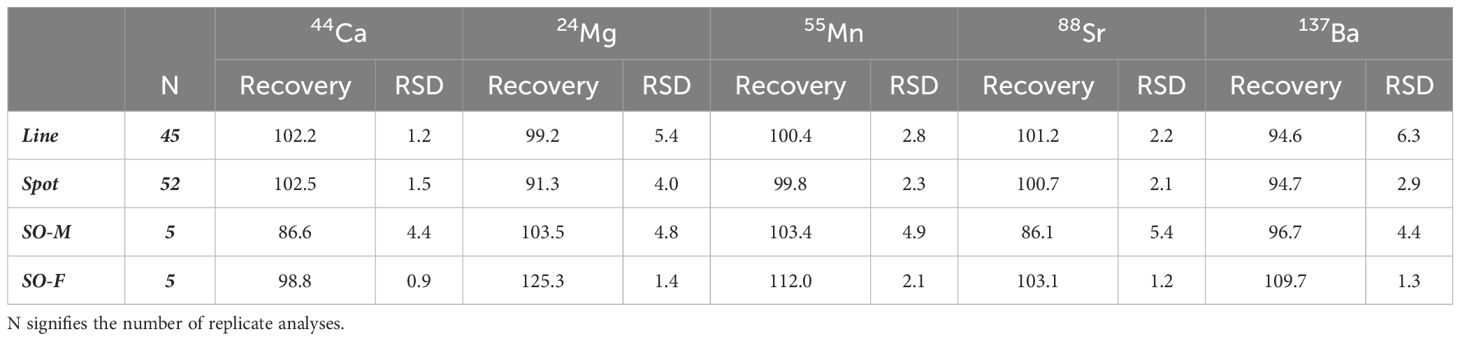
Table 1. Recovery (%) and relative standard deviation (RSD, %) calculated from NIST 612 recoveries against MACS-3 standard trace element concentrations analyzed by laser ablation line transects and spots, and from MACS-3 (M) and FEBS-1 (F) standard trace element concentrations analyzed by solution-based (SO) ICP-MS.
Mean otolith E:Ca profiles from line transects for all three species aligned well with mean E:Ca values of spots ablated along the same region of the otolith, with values for spots consistently within the shaded area (1 SD) of the running means for combined E:Ca values of lines (Figure 2). Mean E:Ca values of spots were typically closer to the line transect means at the core versus the edge of the otolith. For red drum, mean otolith E:Ca values were only significantly different for Mg (F2,57 = 24.50, P<0.0001) and Sr (F2,57 = 24.68, P<0.0001) among the three applications. For both of these elements, line transects and spots had similar otolith E:Ca values, and both laser ablation techniques had significantly higher values than those from the solution-based analysis (Figure 3; Table 2). Mean otolith E:Ca values for gray parrotfish were significantly different among the applications for Sr (F2,48 = 10.68, P<0.001) and Ba (F2,48 = 4.21, P<0.05) only. Otolith Sr:Ca values did not differ significantly between line transects and spots, and both were significantly higher than solution-based values. For Ba:Ca, values from the line transects did not differ significantly from spots or solution-based analysis; however, Ba:Ca values for spots were significantly lower than solution-based values (Figure 3; Table 2). Mean otolith E:Ca values for blackfin tuna were significantly different among the three applications (Mg: F2,57 = 6.06, P<0.01; Mn: F2,57 = 21.94, P<0.0001; Sr: F2,57 = 3.55, P<0.05; Ba: F2,57 = 44.21, P<0.0001). When examining these differences further, line transects and spots had similar mean values, with both laser ablation techniques showing higher Mg:Ca and Mn:Ca values, but lower Ba:Ca values relative to the solution-based analysis. For Sr:Ca, values from the spots did not differ significantly from line transects or the solution-based analysis; however, Sr:Ca values for lines were significantly lower than solution-based values (Figure 3; Table 2).
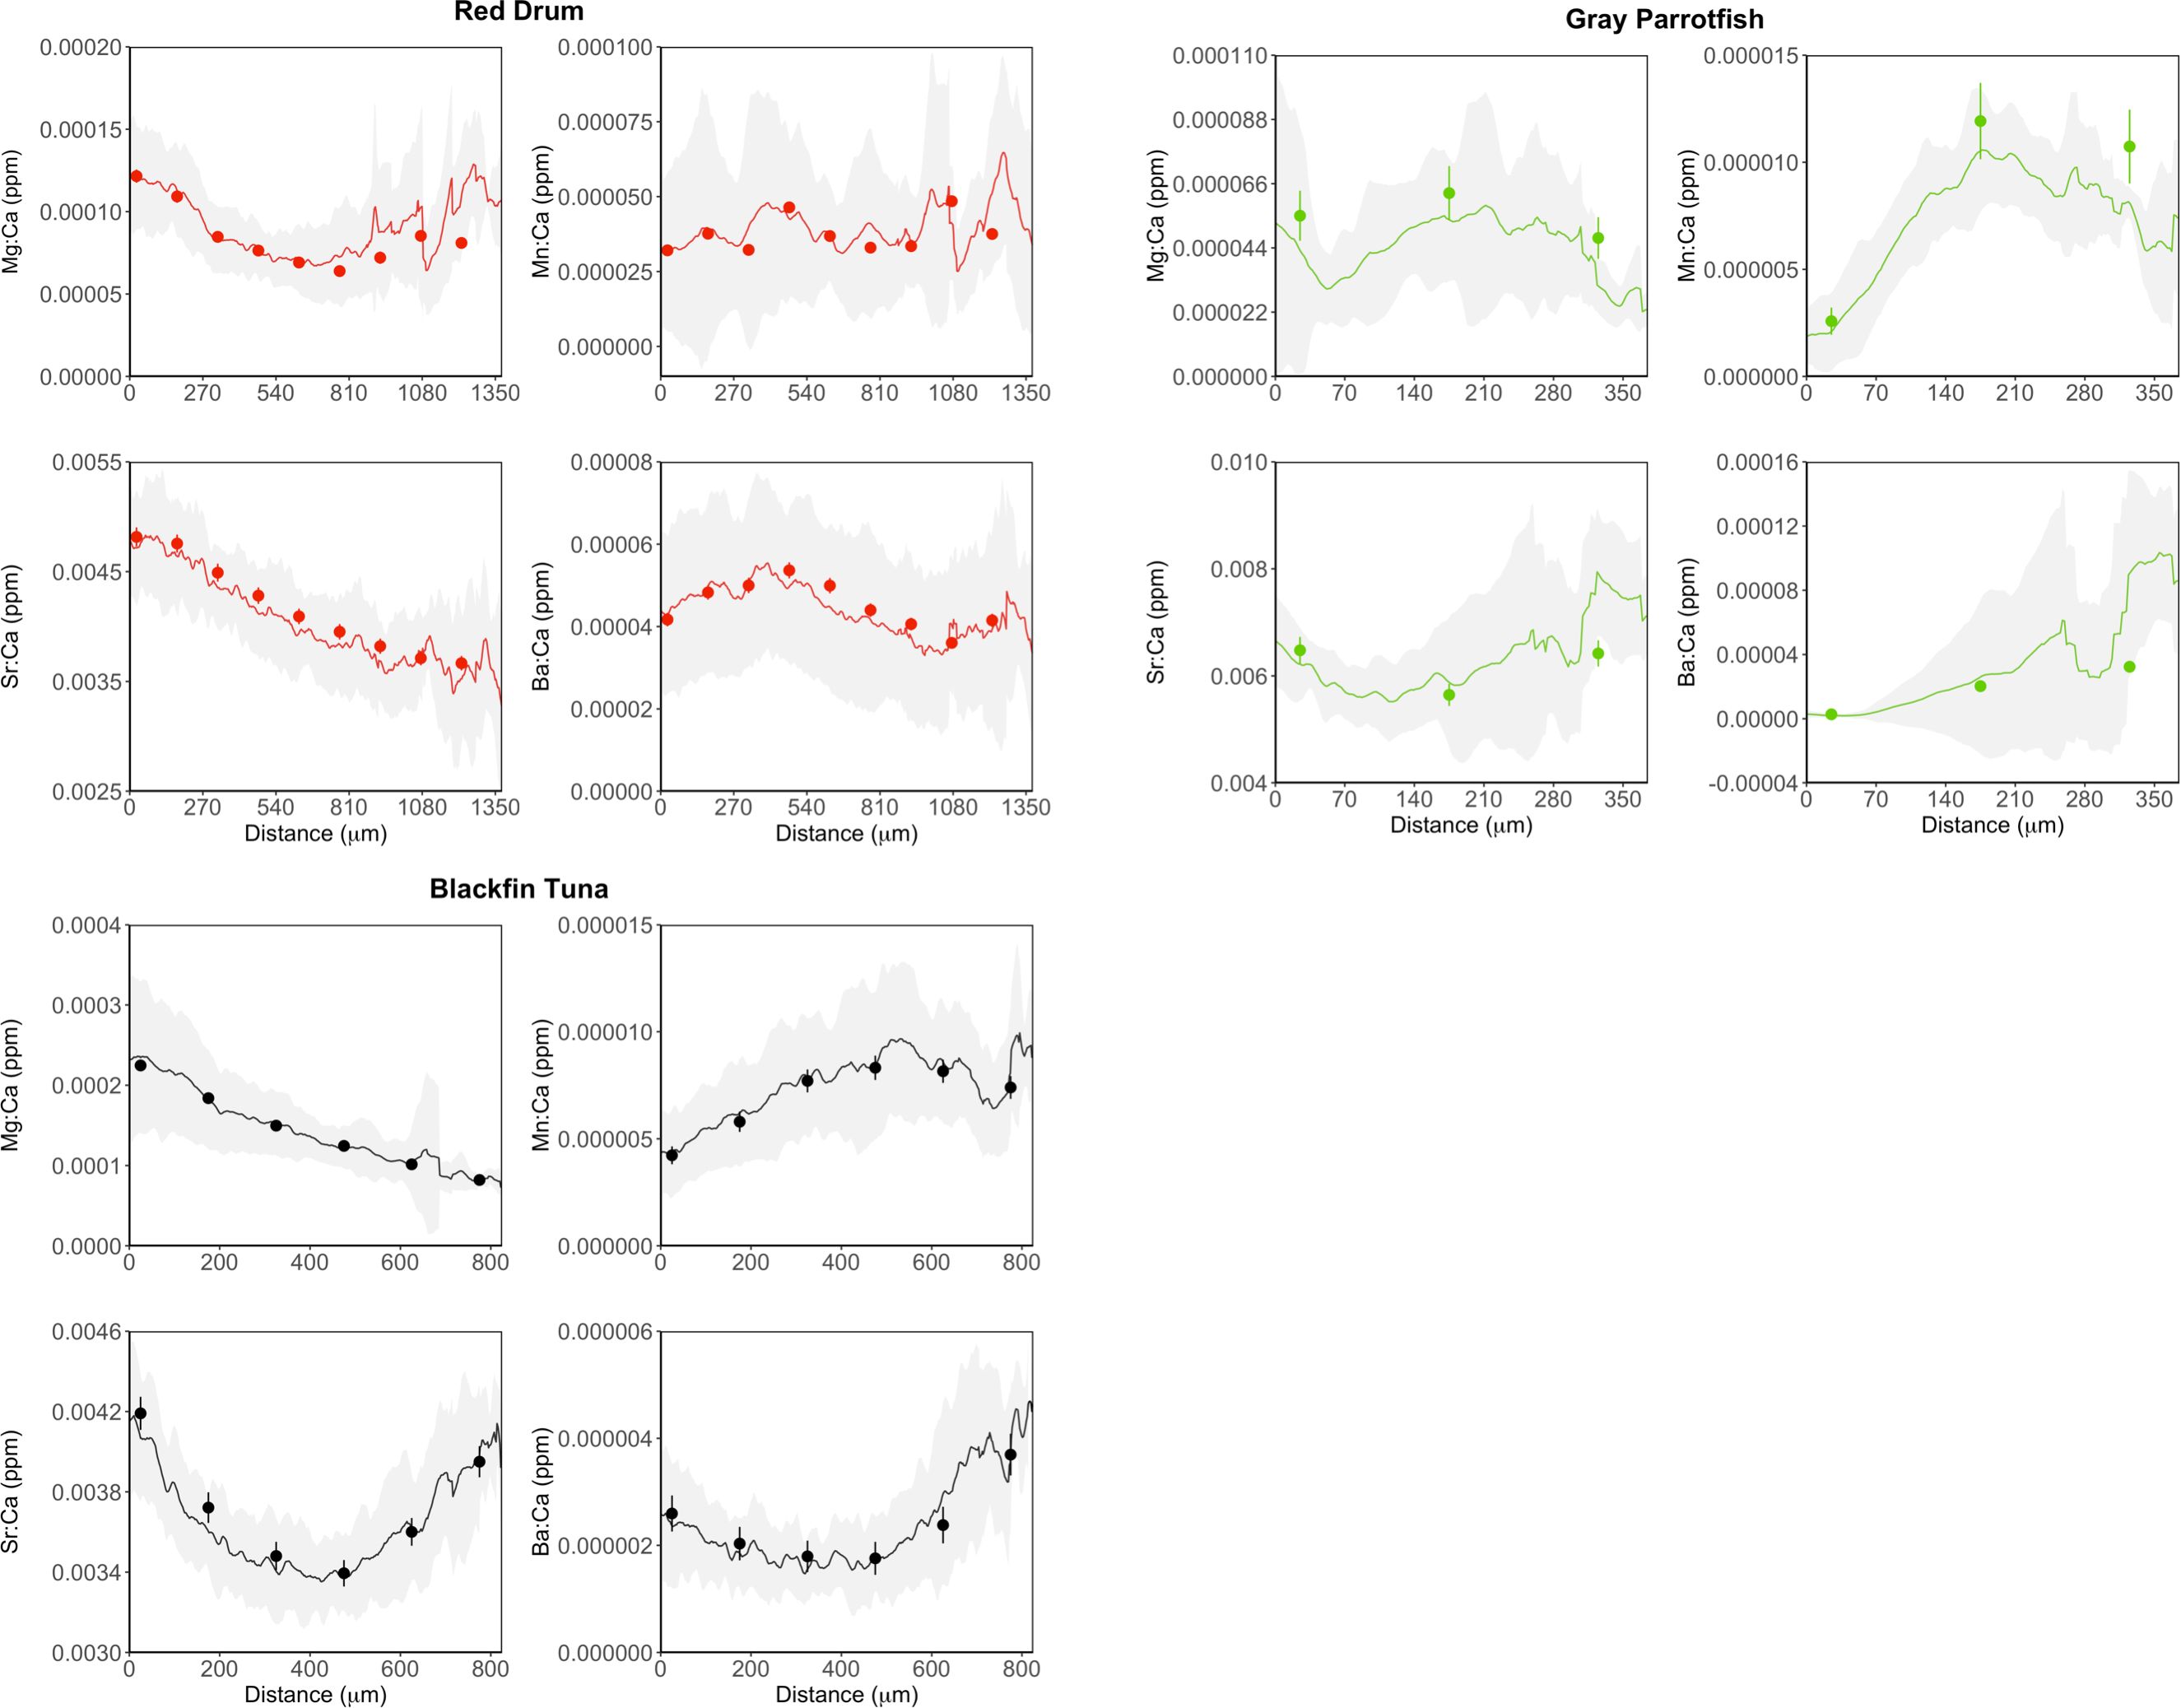
Figure 2. Mean otolith E:Ca profiles from line transects for red drum (N = 20; red), gray parrotfish (N = 17; green), and blackfin tuna (N = 20; black). Profiles depict the laser path from the core (0 μm) to the outer edge of the otolith. Solid lines represent the running average and shading denotes 1 SD. Circles denote E:Ca values for spots in relation to their location along the line transect path with 1 SD error bars.
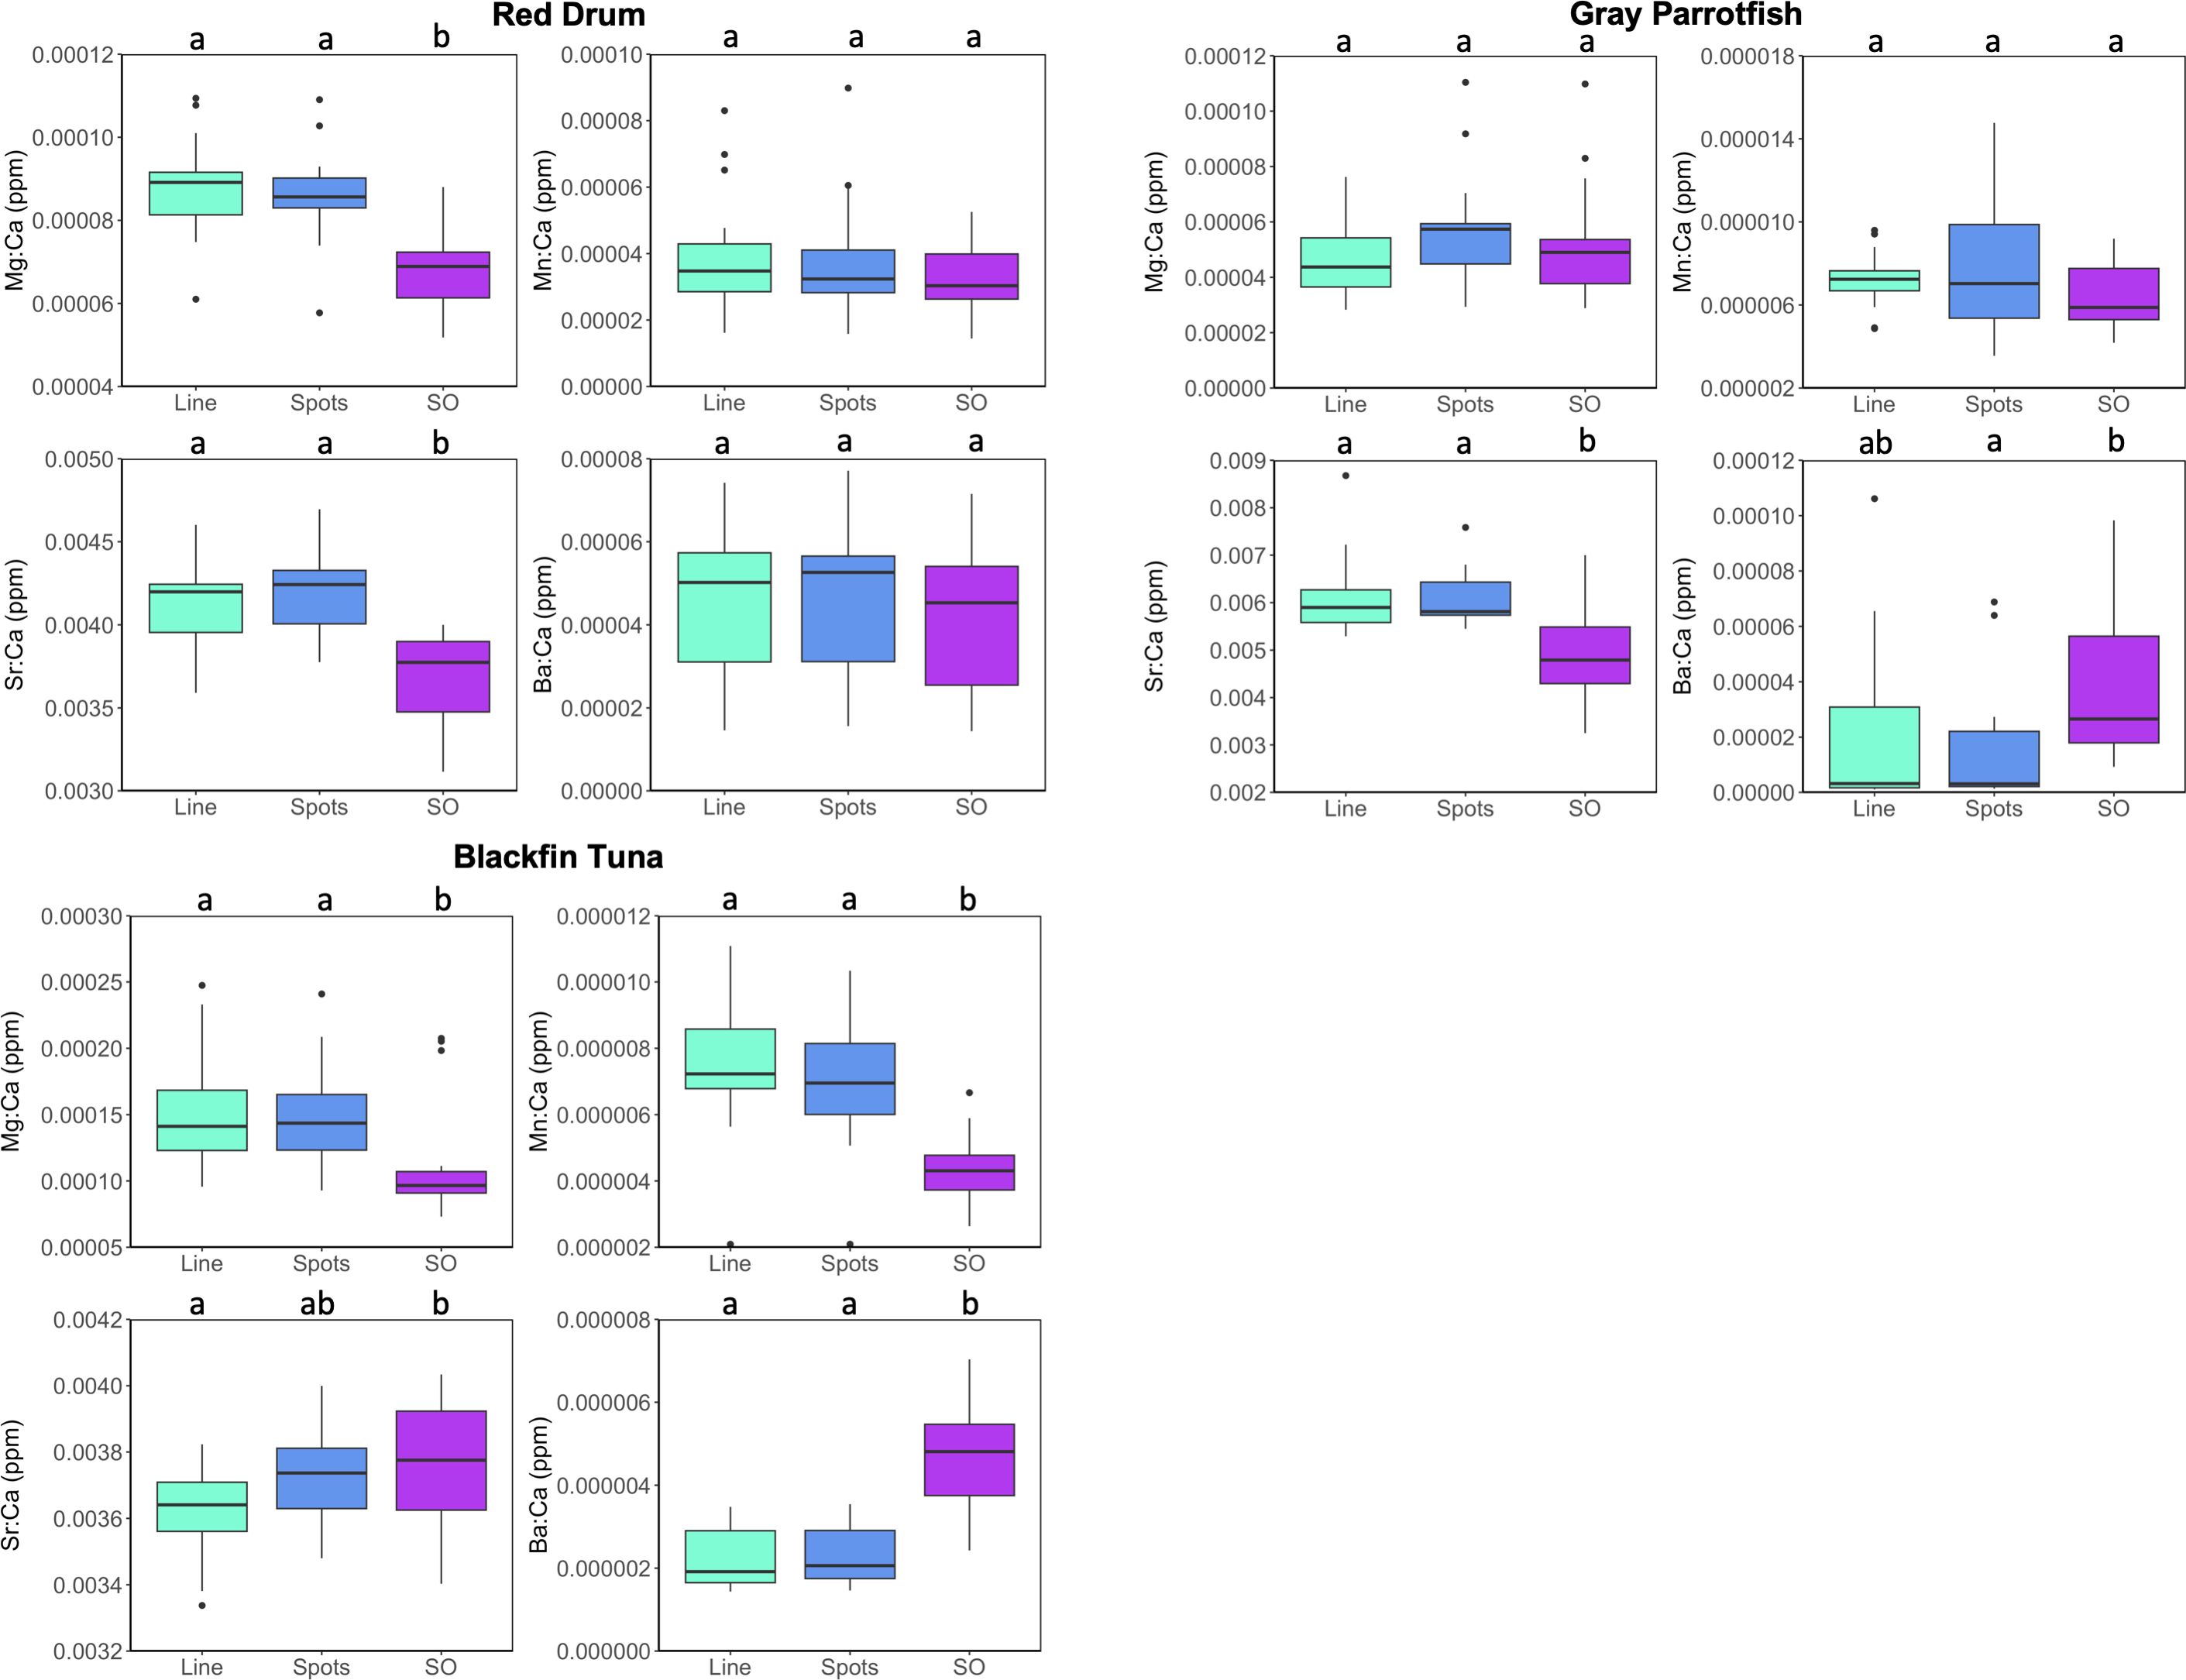
Figure 3. Boxplots of otolith E:Ca values for red drum, gray parrotfish, and blackfin tuna based on laser ablation line transects and spots, and solution-based (SO) ICP-MS. Boxes represent the 25th to 75th percentile ranges with the horizontal line indicating the median, whiskers exhibit the 10th to 90th percentiles, and dots are outliers. Groups (i.e., applications) that are significantly different are denoted with different letters based on Tukey’s HSD (P < 0.05).
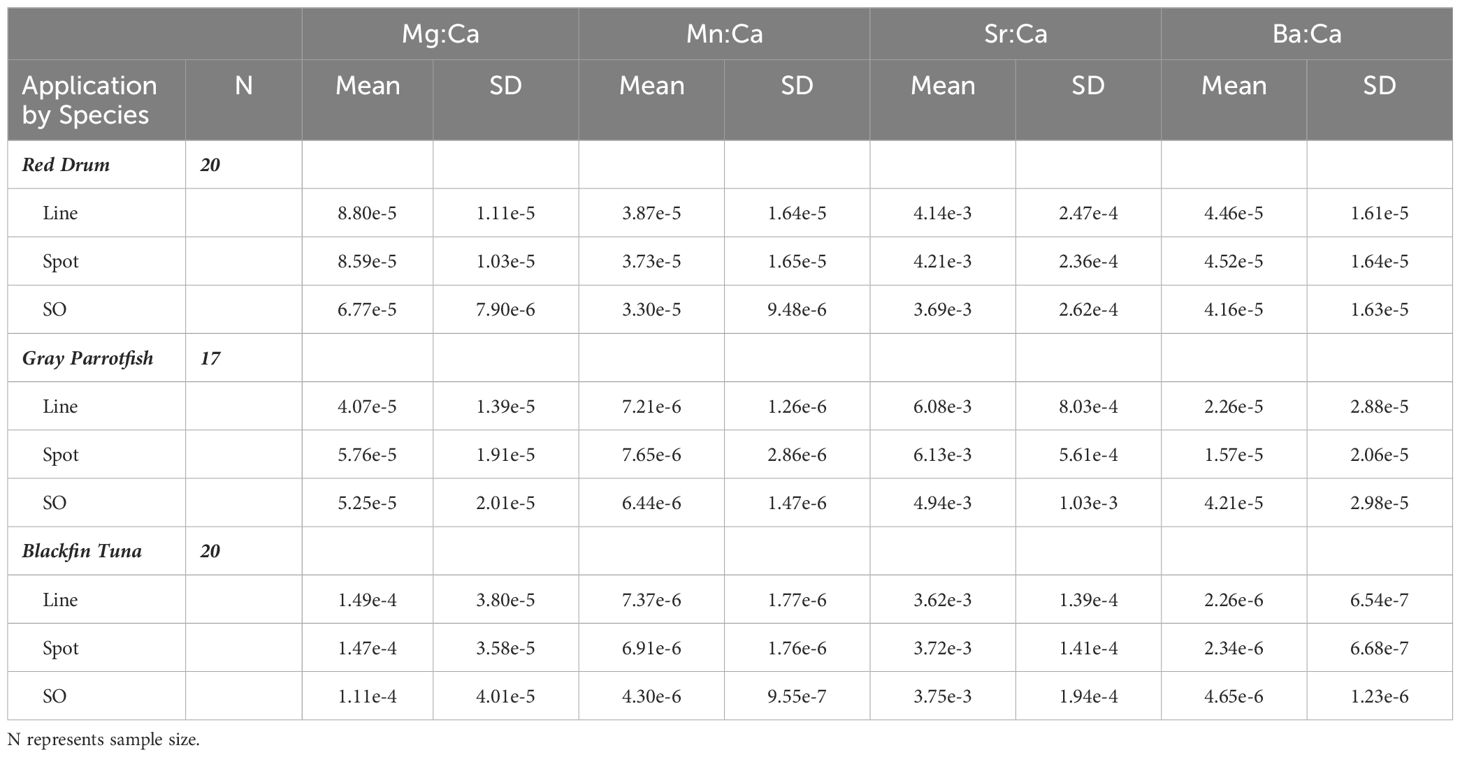
Table 2. Mean and standard deviation (SD) for element:Ca (Mg:Ca, Mn:Ca, Sr:Ca, and Ba:Ca) values in otoliths of red drum, gray parrotfish and blackfin tuna analyzed with laser ablation line transects and spots, and solution-based (SO) ICP-MS.
Linear regression models show that line transect and spot techniques produced nearly identical overall mean otolith E:Ca values for all elements assayed (R2 ≥ 0.91), with slopes that deviated minimally from the 1:1 line for all species combined (Figure 4). This was expected given that no differences were detected between line transects and spots for any of the three species. The strongest relationship between lines and spots based on R2 values occurred for Mn:Ca and Sr:Ca (0.98 and 0.96, respectively). While the differences were not significant, line transect Sr:Ca values did appear to be slightly lower compared to spots for all species, which was also observed in the overall means (Table 2). Gray parrotfish otoliths had slightly higher Mg:Ca values and lower Ba:Ca values for spots relative to line transects, which resulted in slightly lower R2 values (0.94 and 0.91, respectively) for these elements (Figure 4; Table 2).
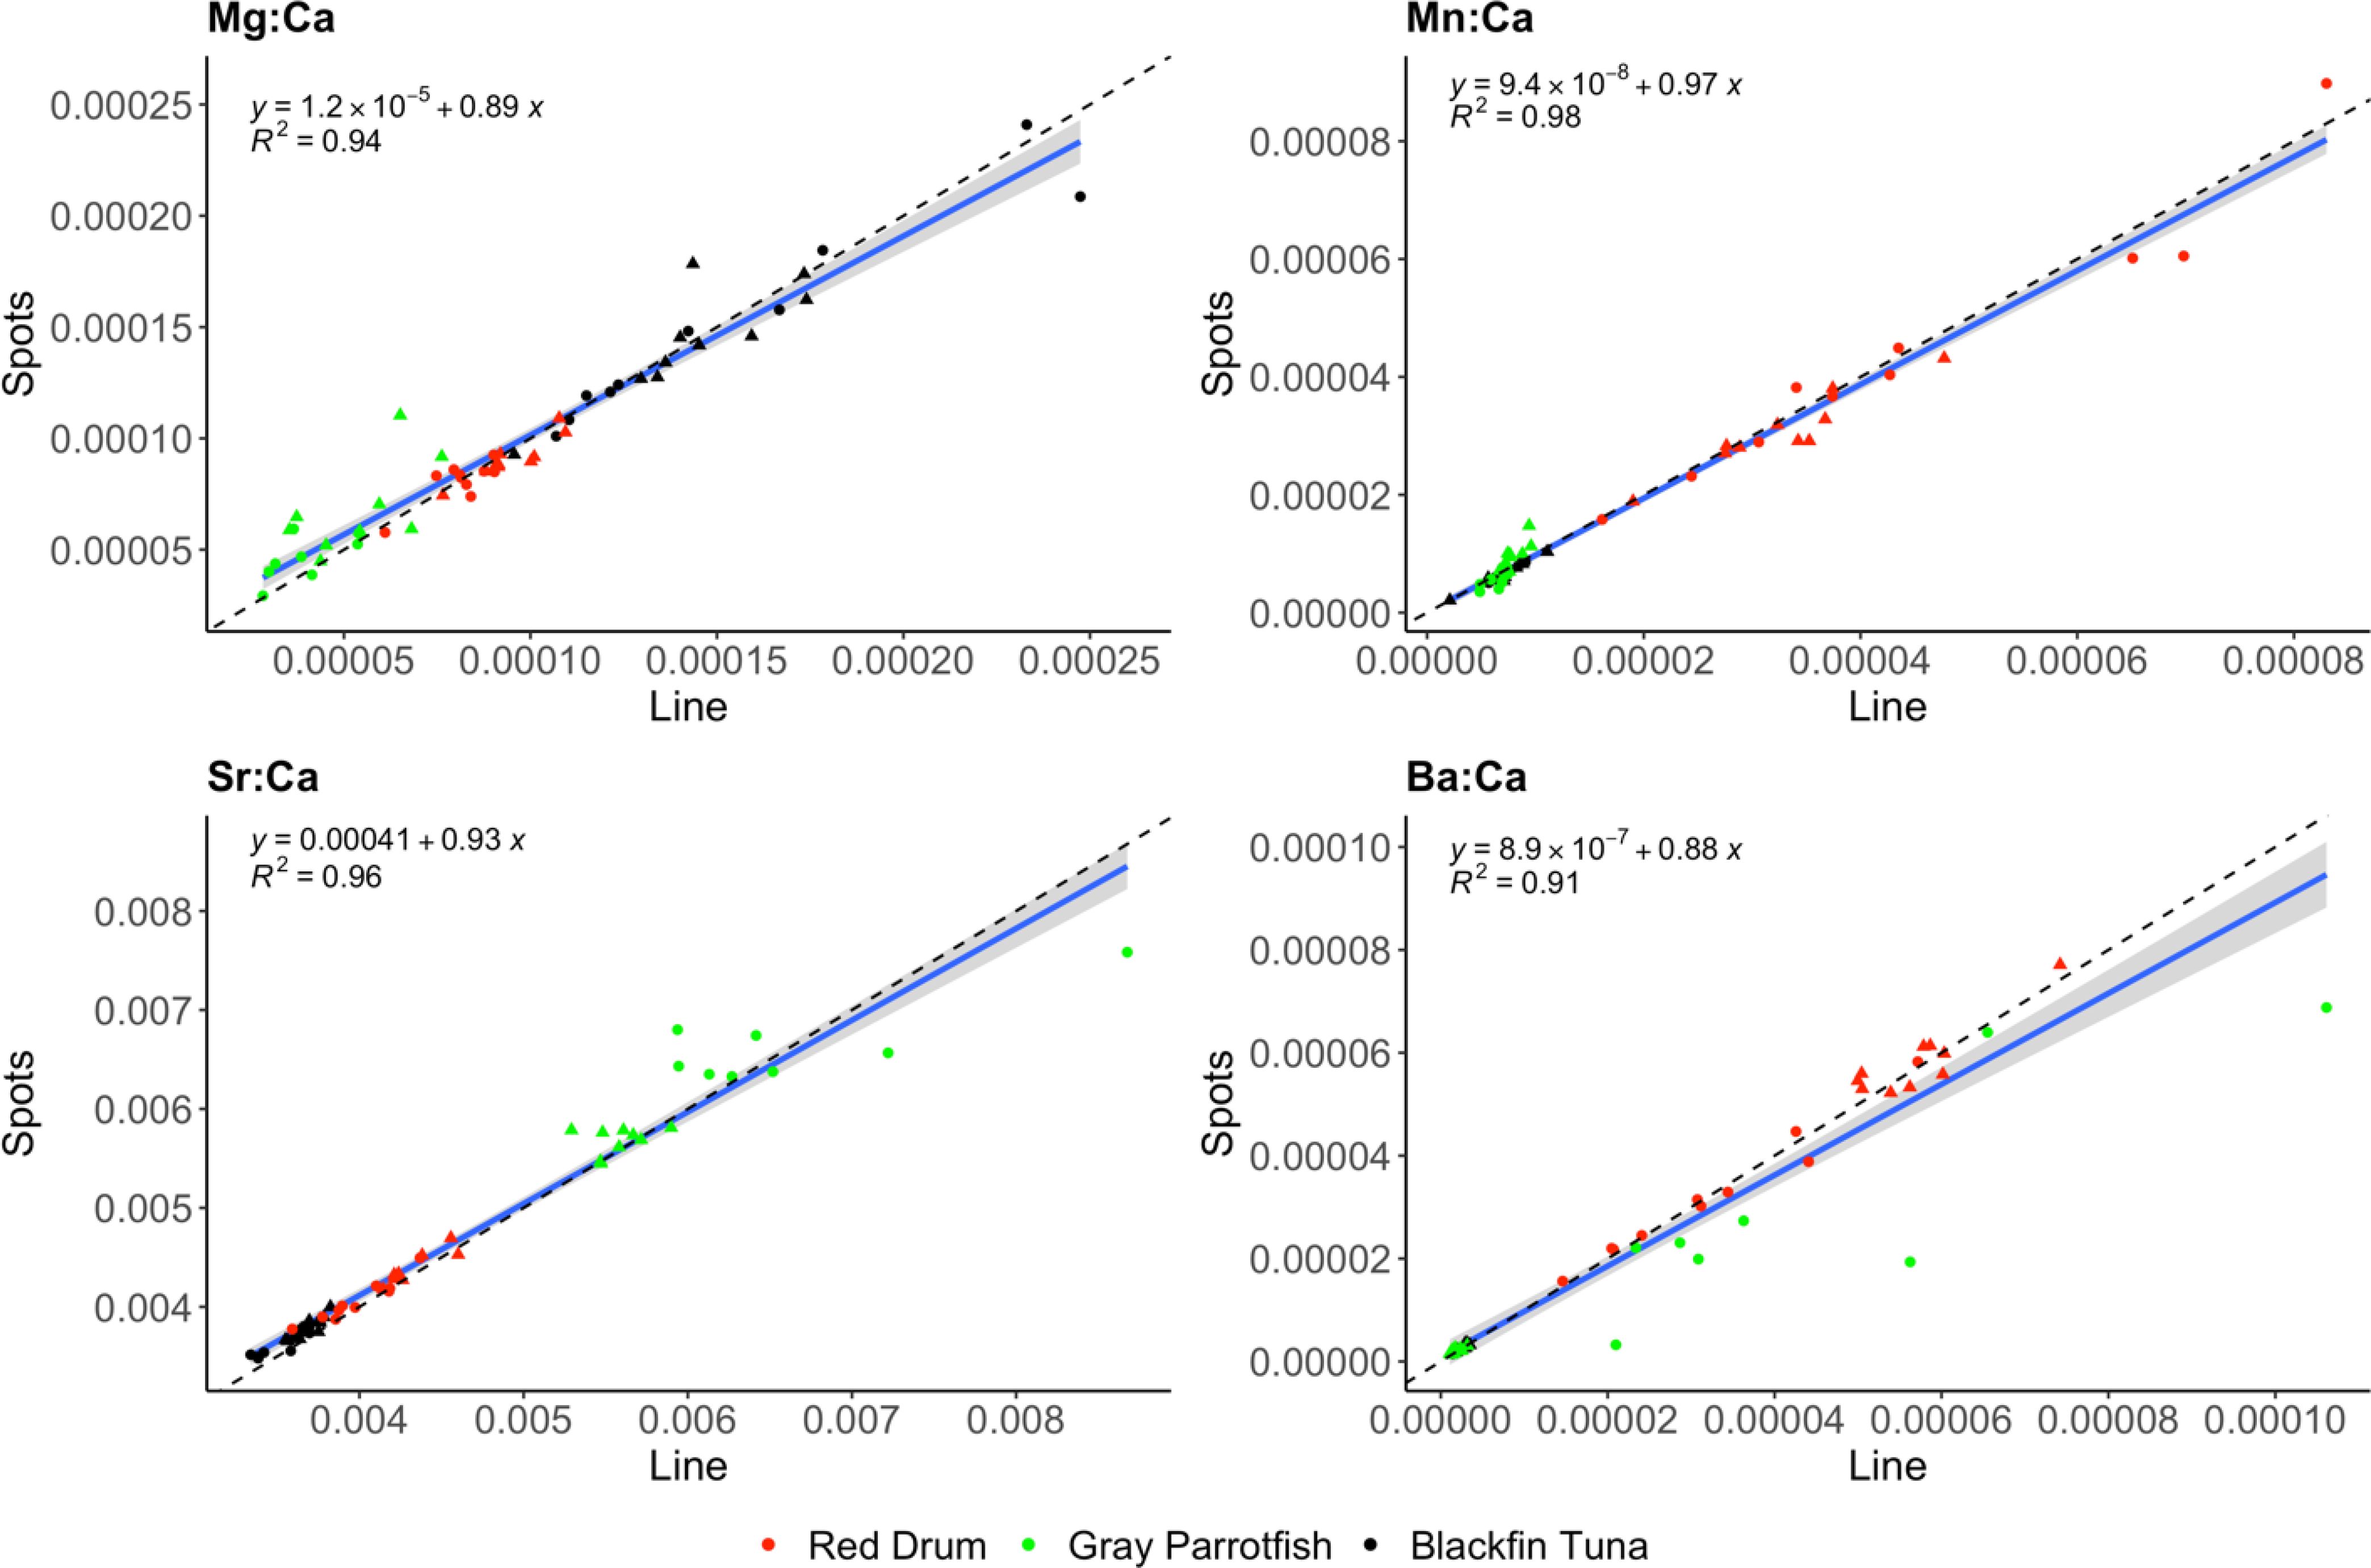
Figure 4. Otolith E:Ca values (ppm) for red drum (red), gray parrotfish (green) and blackfin tuna (black) quantified by laser ablation ICP-MS line transects and spots on the same otolith. Solid blue lines represent linear regression lines with 95% confidence interval shading, with corresponding regression equations, adjusted R2 and expected 1:1 ratio lines (dashed lines) provided. Habitats are symbolized for visual purpose only: red drum Galveston Bay (circle) and Upper Laguna Madre (triangle), gray parrotfish reef (circle) and seagrass (triangle), and blackfin tuna Caribbean Sea (circle) and Gulf of Mexico (triangle).
Since a strong 1:1 relationship occurred for otolith E:Ca values between line transects and spots, only one laser ablation technique (line transects) was selected to further evaluate differences between laser and solution-based ICP-MS. Although estimates of mean otolith E:Ca values between line transect and solution-based applications were not as highly correlated as between both laser ablation techniques, robust relationships did exist (R2 = 0.64 - 0.87; Figure 5). Again, the strongest relationship occurred for Mn:Ca (R2 = 0.87), with generally higher values for line transects compared to the solution-based analysis (as also seen in Table 2). The weakest relationship occurred for Sr:Ca values (R2 = 0.64), where otolith E:Ca values for line transects were significantly higher for red drum and gray parrotfish, and significantly lower for blackfin tuna compared to solution-based E:Ca values (Figures 3, 5).
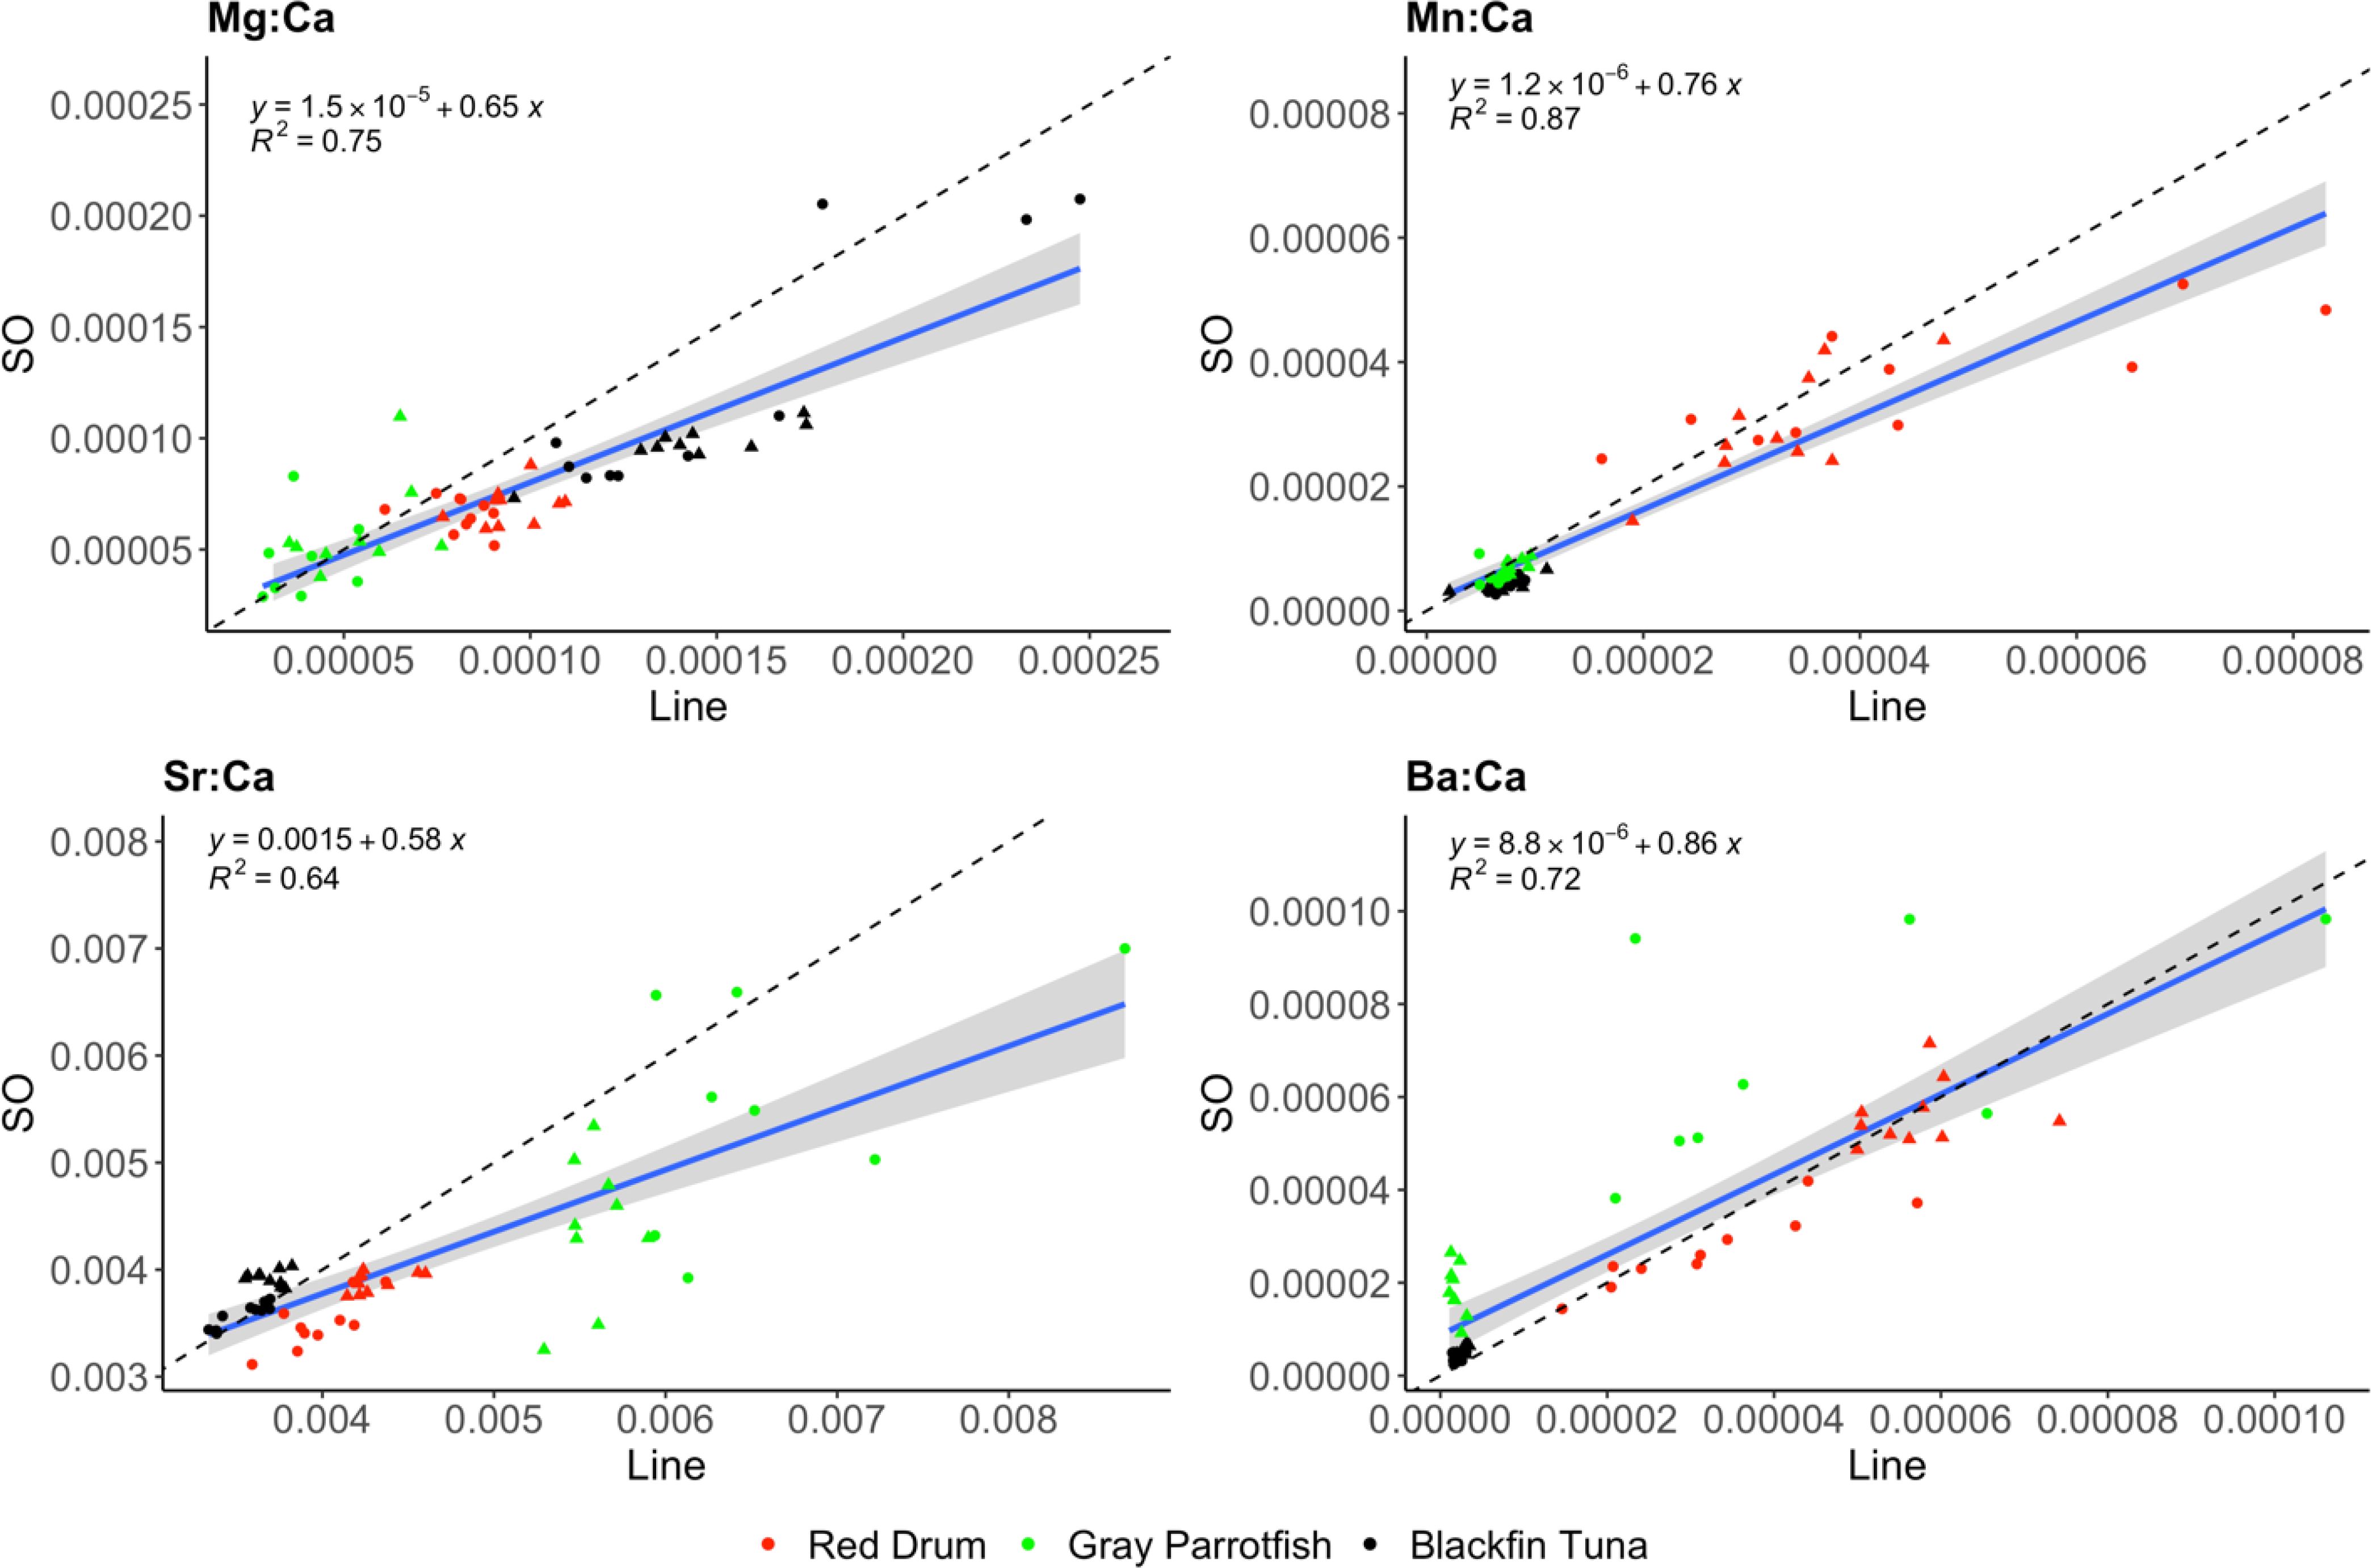
Figure 5. Otolith E:Ca values (ppm) of red drum (red), gray parrotfish (green) and blackfin tuna (black) quantified by laser ablation line transects and solution-based (SO) ICP-MS analysis on paired otoliths. Lines, equations, and symbols are the same as expressed in Figure 4.
4 Discussion
As advances in otolith geochemistry continue to develop, it is important to examine various analytical approaches as different methodologies or techniques can impact results (Campana et al., 1997; Secor et al., 2002). While previous studies have investigated the differences of using laser ablation and solution-based ICP-MS for analyzing otoliths of fish larvae (Ludsin et al., 2006) or inter-laboratory discrepancies between milled solution-based samples versus laser ablation (Geffen et al., 2013), this study is novel in its approach by not only contrasting laser ablation and solution-based applications to quantify otolith E:Ca values for several species that occupy differing habitats or ecosystems, but also by comparing two common laser ablation techniques (transect lines vs spots). For all species investigated, otolith E:Ca values for lines and spots were comparable, with no statistical differences in overall means detected between the two laser ablation techniques. While line transects and spots produced statistically similar results, suggesting data from each may be used interchangeably, it should be noted that line transects provided more detail along the region of the otolith profiled, whereas fluctuations in otolith E:Ca values may be missed between spots depending on the spacing, as seen in Figure 2. Yang et al. (2014) performed laser ablation line transects and spots on ostracod shells and determined that line transects provided more precise E:Ca values over spots due to a higher sample mass ablated per scan. Based on the RSD percentages of this study, the precision between line transects and spots was relatively similar, with the highest variation occurring for Ba. Further, no significant difference existed in the accuracy of the two laser ablation techniques, although line transects produced more accurate measurements of Mg compared to spots.
With unlimited volumes, longer integration times, and multiple analysis cycles, solution-based ICP-MS should have better precision and sensitivity compared to laser ablation. Laser ablation integration times are usually less than 0.05-0.1 s, whereas solution mode integration times typically range from 0.1-0.3 s allowing for better counting statistics and resolution of more representative values. Repeated analyses (typically three cycles) in solution mode of the exact same sample drives down the precision (RSD) compared to laser ablation ICP-MS. While the RSD percentages of this study were relatively good (<10%) for all application trials, solution-based analysis was more precise, producing the lowest RSDs, when using the FEBS-1 reference standard; however, the MACS-3 standard tended to be less precise than laser ablation techniques. Further, while both laser ablation techniques produced good recovery rates (90-110%) representing high accuracy, solution-based analysis using FEBS-1 slightly overestimated Mg and Mn, while MACS-3 underestimated Ca and Sr. Other studies have exposed accuracy problems when using MACS-3 for exclusive calibration compared to glass reference material, likely due to the heterogeneity of the material, and determined using NIST 612 to calibrate MACS-3 provided element concentrations within 10% of the certified reference values (Thompson et al., 2022). This method was applied to the laser ablation techniques to help improve accuracy and precision, but it was not an option with solution analysis resulting in lower precision and accuracy when using the MACS-3 standard. Geffen et al. (2013) showed similar results overall with solution-based analysis being more precise, but laser ablation ICP-MS being more accurate when examining the reference standards NIES-22 and FEBS-1. Even though solution-based analysis can resolve more elements, the required volume for the analysis can create high dilution rates that can make elements difficult to detect (Campana et al., 1997). For this reason, several elements in this study were removed from the statistical analysis due to concentrations below detection limits, with some of the smallest otoliths (gray parrotfish) being removed completely as the sample dilution resulted in a volume too small to be practically analyzed with the autosampler. Conversely, there were no issues analyzing the smallest otoliths in this study with laser ablation ICP-MS.
Among the three applications investigated, otolith Mn:Ca values consistently had the highest correlation for all paired comparisons, followed by otolith Mg:Ca values. The MACS-3 reference standard Mn concentrations are more accurate compared to the other elements (Thompson et al., 2022), potentially explaining the increased correlation between laser ablation and solution-based applications. Otolith cores also tend to be enriched in Mn due to physiological regulation during the embryonic stage as it is necessary for respiratory development, and Mn may be an important constituent in the initial development of the otolith as a substitute for Ca (Brophy et al., 2004; Ruttenberg et al., 2005). While not as pronounced as Mn, Mg values can also be elevated at the core or during the juvenile stage (Ruttenberg et al., 2005). It is important to note that allometric growth of the otolith during ontogeny may lead to variation in mean E:Ca values between laser ablation and solution-based applications on the same otolith. This is due to laser ablation techniques quantify otolith material along a single transverse plane through the otolith core while solution-based ICP-MS sums the geochemistry of all growth planes within the 3-D structure of the whole otolith. Both laser ablation techniques for red drum and blackfin tuna had significantly higher Mg:Ca values relative to solution-based analysis, whereas both laser ablation techniques produced significantly higher Mn:Ca values for blackfin tuna only. These two species consisted of older, larger juveniles (> age-1) compared to gray parrotfish (age-0) in the study samples. Therefore, a laser ablation path along a transverse section strongly influenced by core chemistry may have acquired higher concentrations in these larger individuals that could have been slightly diluted in the solution-based samples due to whole otolith dilution. The smaller parrotfish otoliths may have more uniform Mn:Ca and Mg:Ca values throughout the otolith that did not result in significant differences between laser ablation and solution-based ICP-MS.
Although Sr is highly concentrated in otoliths, associated Sr:Ca values were least correlated between laser ablation and solution-based applications, with Ba:Ca values exhibiting better correlation. In otoliths, Sr and Ba concentrations reflect ambient water conditions and are biomineralized in proportion to the surrounding environment, with higher Sr:Ca values occurring in seawater compared to freshwater and higher Ba:Ca values occurring in freshwater (Bath et al., 2000). For red drum and gray parrotfish, otolith Sr:Ca values from laser ablation techniques were higher compared to solution-based analysis, potentially due to the factors discussed above. However, line transects on otoliths of blackfin tuna had significantly lower Sr:Ca values than the solution-based analysis, with overall Sr:Ca values of blackfin tuna being generally lower than the other two species analyzed in this study. Likewise, Ba:Ca values were lower for spots of gray parrotfish and for both laser ablation techniques of blackfin tuna compared to the solution-based analysis, whereas there was no significant difference in Ba:Ca values between ICP-MS applications for red drum. Both gray parrotfish and blackfin tuna profiles start with low Ba:Ca values at the otolith core gradually increasing near the edge, while red drum profiles remain fairly constant throughout. The overall low Sr:Ca values for the blackfin tuna and the initial lower Ba:Ca values for gray parrotfish and blackfin tuna may have had the opposite effect previously discussed in the paragraph above, where now whole otolith dilution of the solution-based analysis was able to acquire greater Sr:Ca and Ba:Ca values compared to the small spatial scale of the laser ablation techniques. Otolith accretion and metabolic rate differences among the three species can result in specie specific variations in the incorporation of elements into the otolith (Hammer and Jenkins, 2007), further explaining why E:Ca values derived from laser ablation and solution-based applications were not uniform across species for certain elements.
This study demonstrates that otolith E:Ca values were statistically similar between the two laser ablation techniques for each of the three species assayed, suggesting that line transects and spots can be used interchangeably. Both laser ablation techniques can generate life history profiles that provide a tool to characterize otolith E:Ca fluctuations over time or age of the individual. Line transects provide more fine-scale and continuous resolution of otolith E:Ca variation along a life history transect that may otherwise be missed between the spacing of spots. It was also demonstrated that E:Ca values from laser ablation and solution-based applications were often statistically different, but discrepancies in E:Ca values can vary among fish species. Finally, it was shown that solution-based assays incorporating whole otolith dilution may be more comparable to laser ablation when using otoliths of smaller or younger individuals, with differences becoming more pronounced when assaying otoliths of larger, older individuals. This is attributed to otoliths of younger individuals typically beginning with a more uniform (oval) shape before differential growth along the otolith axes becomes more pronounced with age.
Data availability statement
The raw data supporting the conclusions of this article will be made available by the authors, without undue reservation.
Ethics statement
The animal study was approved by Institutional Animal Care and Use Committee (IACUC)/Texas A&M University. The study was conducted in accordance with the local legislation and institutional requirements.
Author contributions
MZ: Conceptualization, Data curation, Formal analysis, Investigation, Methodology, Project administration, Visualization, Writing – original draft, Writing – review & editing. DL: Data curation, Funding acquisition, Investigation, Writing – review & editing. PS: Data curation, Investigation, Writing – review & editing. NM: Conceptualization, Data curation, Investigation, Methodology, Project administration, Writing – review & editing. SS: Data curation, Investigation, Writing – review & editing. BF: Funding acquisition, Supervision, Writing – review & editing. JR: Conceptualization, Funding acquisition, Investigation, Methodology, Resources, Supervision, Writing – review & editing.
Funding
The author(s) declare financial support was received for the research, authorship, and/or publication of this article. This study was made possible due to funding from the McDaniel Charitable Foundation to JR Additional funding was provided by the Brazilian National Council for Scientific and Technological Development (CNPq) for a Special Visiting Researcher (PVE) grant to BF and JR (401594/2014-9), a PhD grant (140950/2016-8) awarded to DL, and a Research Productivity (PQ) grant to BF (309216/2018-4).
Conflict of interest
The authors declare that the research was conducted in the absence of any commercial or financial relationships that could be construed as a potential conflict of interest.
Generative AI statement
The author(s) declare that no Generative AI was used in the creation of this manuscript.
Publisher’s note
All claims expressed in this article are solely those of the authors and do not necessarily represent those of their affiliated organizations, or those of the publisher, the editors and the reviewers. Any product that may be evaluated in this article, or claim that may be made by its manufacturer, is not guaranteed or endorsed by the publisher.
Supplementary material
The Supplementary Material for this article can be found online at: https://www.frontiersin.org/articles/10.3389/fmars.2025.1531755/full#supplementary-material
Supplementary Table 1 | Average NIST 612 recoveries against MACS-3 trace element concentrations analyzed by laser ablation line transects and spots, and from MACS-3 (M) and FEBS-1 (F) trace element concentrations analyzed by solution-based (SO) ICP-MS compared to the certified values for the reference standards NIST 612, MACS-3 and FEBS-1.
References
Arslan Z., Secor D. S. (2008). High resolution micromill sampling for analysis of fish otoliths by ICP-MS: effects of sampling and specimen preparation on trace element fingerprints. Mar. Environ. Res. 66, 364–371. doi: 10.1016/j.marenvres.2008.05.010
Bath G. E., Thorrold S. R., Jones C. M., Campana S. E., McLaren J. W., Lam J. W. (2000). Strontium and barium uptake in aragonitic otoliths of marine fish. Geochimica Cosmochimica Acta 64, 1705–1714. doi: 10.1016/S0016-7037(99)00419-6
Baumann H., Wells R. J. D., Rooker J. R., Baumann Z. A., Madigan D. J., Dewar H., et al. (2015). Combining otolith microstructure and trace elemental analyses to infer the arrival of Pacific bluefin tuna juveniles in the California Current Ecosystem. ICES J. Mar. Sci. 72, 2128–2138. doi: 10.1093/icesjms/fsv062
Blanca M. J., Alarcon R. A., Arnau J., Bono R., Bendaya R. (2017). Non-normal data: Is ANOVA still a valid option? Psicothema 29, 552–557. doi: 10.7334/psicothema2016.383
Brophy D., Jeffries T. E., Danilowicz B. S. (2004). Elevated manganese concentrations at the cores of clupeid otoliths: possible environmental, physiological, or structural origins. Mar. Biol. 144, 779–786. doi: 10.1007/s00227-003-1240-3
Campana S. E. (1999). Chemistry and composition of fish otoliths: pathways, mechanisms and applications. Mar. Ecol. Prog. Ser. 188, 263–297. doi: 10.3354/meps188263
Campana S. E., Thorrold S. R., Jones C. M., Gunter D., Tubrett M., Longerich H., et al. (1997). Comparison of accuracy, precision, and sensibility in elemental assays of fish otoliths using the electron microprobe, proton-induced X-ray emission, and laser ablation inductively coupled plasma mass spectrometry. Can. J. Fisheries Aquat. Sci. 54, 2068–2079. doi: 10.1139/f97-117
Catalán I. A., Alós J., Díaz-Gil C., Pérez-Mayol S., Basterretxea G., Morales-Nin B., et al. (2018). Potential fishing-related effects on fish life history revealed by otolith microchemistry. Fisheries Res. 199, 186–195. doi: 10.1016/j.fishres.2017.11.008
de Pontual H., Lagardere F., Troadec H., Batel A., Desaunay Y., Koutsikopoulos C. (2000). Otoliths imprinting of sole (Solea solea) from the Bay of Biscay: a tool to discriminate individuals from nursery origins? Oceanologica Acta 23, 497–513. doi: 10.1016/S0399-1784(00)00140-7
Fraile I., Arrizabalaga H., Rooker J. R. (2015). Origin of bluefin tuna (Thunnus thynnus) in the Bay of Biscay. ICES J. Mar. Sci. 72, 625–634. doi: 10.1093/icesjms/fsu156
Frey B., Lyubchich V., Zapp Sluis M., Miller N., Secor D. H. (2023). Examining the periodicity of annular deposition of otolith microconstituents as a means of age validation. Fishery Bull. 121, 188–189. doi: 10.7755/FB.121.4.4
Geffen A. J., Morales-Nin B., Perez-Mayol S., Cantarero-Roldan A. M., Skada J., Tovar-Sanchez A. (2013). Chemical analysis of otoliths: Cross validation between techniques and laboratories. Fisheries Res. 143, 67–80. doi: 10.1016/j.fishres.2013.01.005
Gillanders B., Kingsford M. (2000). Elemental fingerprints of otoliths of fish may distinguish estuarine 'nursery' habitats. Mar. Ecol. Prog. Ser. 201, 273–286. doi: 10.3354/meps201273
Hammer P. A., Jenkins G. P. (2007). Comparison of spatial variation in otolith chemistry of two fish species and relationships with water chemistry and otolith growth. J. Fish Biol. 71, 1035–1055. doi: 10.1111/j.1095-8649.2007.01570.x
Heimbrand Y., Limburg K. E., Hüssy K., Casini M., Sjoberg R., Bratt A. P., et al. (2020). Seeking the true time: Exploring otolith chemistry as an age-determination tool. J. Fish Biol. 97, 552–565. doi: 10.1111/jfb.14422
Hellstrom J., Paton C., Woodhead J., Hergt J. (2008). Chapter A9: Iolite: software for spatially resolved LA-(quad and MC)-ICP-MS analysis. In: Laser ablation ICP–MS in the Earth Sciences: current practices and outstanding Issues (1st ed.). Mineralogical Association of Canada.
Hüssy K., Krüger-Johnsen M., Thomsen T. B., Heredia B. D., Næraa T., Limburg K. E., et al. (2021). It’s elemental, my dear Watson: validating seasonal patterns in otolith chemical chronologies. Can. J. Fisheries Aquat. Sci. 78, 551–566. doi: 10.1139/cjfas-2020-0388
Limburg K. E., Casini M. (2019). Otolith chemistry indicates recent worsened Baltic cod condition is linked to hypoxia exposure. Biol. Lett. 15, 20190352. doi: 10.1098/rsbl.2019.0352
Ludsin S. A., Fryer B. J., Gagnon J. E. (2006). Comparison of solution-based versus laser ablation inductively coupled plasma mass spectrometry for analysis of larval fish otolith microelemental composition. Trans. Am. Fisheries Soc. 135, 218–231. doi: 10.1577/T04-165.1
Mohan J. A., Dewar H., Snodgrass O. E., Miller N. R., Tanaka Y., Ohshimo S., et al. (2022). Otolith geochemistry reflects life histories of Pacific bluefin tuna. PloS One 17, e0275899. doi: 10.1371/journal.pone.0275899
Reis-Santos P., Tanner S. E., Vasconcelos R. P., Elsdon T. S., Cabral H. N., Gillanders B. M. (2013). Connectivity between estuarine and coastal fish populations: contributions of estuaries are not consistent over time. Mar. Ecol. Prog. Ser. 491, 177–186. doi: 10.3354/meps10458
Rooker J. R., Arrizabalaga H., Fraile I., Secor D. H., Dettman D. L., Abid N., et al. (2014). Crossing the line: migratory and homing behaviors of Atlantic bluefin tuna. Mar. Ecol. Prog. Ser. 504, 265–276. doi: 10.3354/meps10781
Rooker J. R., Fraile I., Liu H., Abid N., Dance M. A., Itoh T., et al. (2019). Wide-ranging temporal variation in transoceanic movement and population mixing of bluefin tuna in the North Atlantic Ocean. Front. Mar. Sci. 6, 398. doi: 10.3389/fmars.2019.00398
Rooker J. R., Stunz G. S., Holt S. A., Minello T. J. (2010). Population connectivity of red drum in the northern Gulf of Mexico. Mar. Ecol. Prog. Ser. 407, 187–196. doi: 10.3354/meps08605
Rooker J. R., Wells R. J. D., Block B. A., Liu H., Baumann H., Chiang W. C., et al. (2021). Natal origin and age-specific egress of Pacific bluefin tuna from coastal nurseries revealed with geochemical markers. Sci. Rep. 11, 14216. doi: 10.1038/s41598-021-93298-2
Rooker J. R., Zapp Sluis M., Kitchens L. L., Dance M. A., Falterman B., Lee J. M., et al. (2023). Nursery origin of yellowfin tuna in the western Atlantic Ocean: significance of Caribbean Sea and trans-Atlantic migrants. Sci. Rep. 13, 16277. doi: 10.1038/s41598-023-43163-1
Ruttenberg B. I., Hamilton S. L., Hickford M. J. H., Paradis G. L., Sheehy M. S., Standish J. D., et al. (2005). Elevated levels of trace elements in cores of otoliths and their potential use as natural tags. Mar. Ecol. Prog. Ser. 297, 273–281. doi: 10.3354/meps297273
Sanchez P. J., Rooker J. R., Zapp Sluis M., Pinsky J., Dance M. A., Falterman B., et al. (2020). Application of otolith chemistry at multiple life stages to assess population structure of Warsaw Grouper in the Gulf of Mexico. Mar. Ecol. Prog. Ser. 651, 111–123. doi: 10.3354/meps13457
Secor D. H., Campana S. E., Zdanowicz V. S., Lam J. W. H., Yang L., Rooker J. R. (2002). Inter-laboratory comparison of Atlantic and Mediterranean bluefin tuna otolith microconstituents. ICES J. Mar. Sci. 59, 1294–1304. doi: 10.1006/jmsc.2002.1311
Serre S. H., Nielsen K. E., Fink-Jensen P., Thomsen T. B., Hüssy K. (2018). Analysis of cod otolith microchemistry by continuous line transects using LA-ICP-MS. Geological Survey Denmark Greenland Bull. 41, 91–94. doi: 10.34194/geusb.v41.4351
Thompson J. A., Thompson J. M., Goemann K., Lounejeva E., Cooke D. R., Danyushevsky L. (2022). Use of non-matrix matched reference materials for the accurate analysis of calcium carbonate by LA-ICP-MS. Geostandards Geoanalytical Res. 46, 97–115. doi: 10.1111/ggr.12405
Thorrold S. R., Latkoczy C., Swart P. K., Jones C. M. (2001). Natal homing in a marine fish metapopulation. Science 291, 297–299. doi: 10.1126/science.291.5502.297
Underwood A. J. (1981). Techniques of analysis of variance in experimental marine biology and ecology. Oceanography Mar. Biology: Annu. Rev. 19, 513–605.
Yang Q., Jochum K. P., Stoll B., Weis U., Borner N., Schwalb A., et al. (2014). Trace element variability in single ostracod valves as a proxy for hydrochemical change in Nam Co, central Tibet, during the Holocene. Paleogeography Paleoclimatology Paleoecology 399, 225–235. doi: 10.1016/j.palaeo.2014.01.014
Keywords: otolith, geochemistry, ICP-MS, laser ablation, solution-based
Citation: Zapp Sluis M, Lippi DL, Sanchez PJ, Miller NR, Stephens SA, Ferreira BP and Rooker JR (2025) Assessment of laser ablation and solution-based ICP-MS applications commonly used in otolith geochemical analysis of marine teleosts. Front. Mar. Sci. 12:1531755. doi: 10.3389/fmars.2025.1531755
Received: 20 November 2024; Accepted: 10 February 2025;
Published: 27 February 2025.
Edited by:
Marco Albano, University of Messina, ItalyReviewed by:
Aafaq Nazir, National Taiwan University, TaiwanTakahiro Irie, National Institute of Advanced Industrial Science and Technology (AIST), Japan
Copyright © 2025 Zapp Sluis, Lippi, Sanchez, Miller, Stephens, Ferreira and Rooker. This is an open-access article distributed under the terms of the Creative Commons Attribution License (CC BY). The use, distribution or reproduction in other forums is permitted, provided the original author(s) and the copyright owner(s) are credited and that the original publication in this journal is cited, in accordance with accepted academic practice. No use, distribution or reproduction is permitted which does not comply with these terms.
*Correspondence: Michelle Zapp Sluis, emFwcHNsdWlzQHRhbXUuZWR1