 Hyoungchul Park
 Heidi Nepf
- Department of Civil and Environmental Engineering, Massachusetts Institute of Technology, Cambridge, MA, United States
This study conducted laboratory experiments to investigate the bedload transport within a patchy submerged canopy across a range of patch area densities and spatial configurations. The patch area densities (), defined as the bed area fraction covered by patches, ranged from 0 to 0.56, while the spatial configurations varied from channel-spanning patches to laterally unconfined patches. At low area density (0.3), as increased, more flow passed over the top of the canopy, decreasing the near-bed velocity. However, the formation of turbulent wakes around individual patches increased the near-bed turbulent kinetic energy (TKE). These opposing trends led to a mild decrease in the bedload transport rate with increasing . In contrast, at high area density (0.3), both near-bed velocity and TKE decreased with increasing , resulting in a sharp decrease in bedload transport rate. Furthermore, at the same , channel-spanning patches were associated with lower bedload transport, compared to laterally unconfined patches. A predictive model for bedload transport rate that incorporated both near-bed mean velocity and TKE provided more accurate predictions than models based only on time-averaged velocity (bed stress) or TKE.
1 Introduction
The restoration of vegetated habitats is increasingly recognized as a key strategy for developing sustainable ecosystems. As an alternative to grey infrastructure, vegetated terrain not only mitigates flood risk by enhancing hydraulic roughness (e.g., Bennett and Simon, 2004; Schnauder and Sukhodolov, 2012; Tal and Paola, 2010) but also improves water quality (e.g., Dosskey et al., 2010) and provides essential habitat for fisheries (e.g., Ismail et al., 2018; Massicotte et al., 2015). For successful restoration projects, understanding the morphodynamic response to vegetation re-establishment is crucial. This need has led to numerous studies on hydrodynamic interactions among flow, vegetation, and sediment (e.g., Czarnomski et al., 2012; Le Bouteiller and Venditti, 2014; Neary et al., 2012; Armanini and Cavedon, 2019; Yang et al., 2016; Yager and Schmeeckle, 2013; Wang et al., 2022). Recent research has highlighted that vegetation-generated turbulence can drive sediment transport, as turbulence within the canopy promotes sediment mobilization (e.g., Tinoco and Coco, 2014; 2016, Yang et al., 2016; Yang and Nepf, 2018).
In river channels, aquatic vegetation often grows in submerged patches of finite width and length (e.g., Biggs et al., 2019; Cameron et al., 2013; Cornacchia et al., 2018), hereafter referred to as three-dimensional (3D) submerged patches. Patch size is determined by scale-dependent feedbacks associated with hydrodynamic stress, morphodynamics, and nutrient availability (Kondziolka and Nepf, 2014; Larsen and Harvey, 2011; Rietkerk and Van de Koppel, 2008). In natural streams, 3D submerged patches are distributed in diverse spatial patterns with different spacing (e.g., Cornacchia et al., 2023; Schoelynck et al., 2018). When a current encounters a patchy submerged canopy, flow adjustment occurs in both the horizontal and vertical planes around individual patches, generating 3D turbulent wakes (e.g., Liu et al., 2018). These turbulent wakes interact differently depending on the spatial configuration of the patches within the canopy, thereby influencing the hydrodynamic characteristics within the canopy (e.g., Chembolu et al., 2019; Cornacchia et al., 2019; Park and Nepf, 2025; Savio et al., 2023).
Several previous studies have correlated sediment transport within and around individual vegetation patches and patchy canopies with mean and turbulent flow characteristics (e.g., Holzenthal et al., 2022; Hu et al., 2018; Ortiz et al., 2013; Shan et al., 2020). For example, at the patch scale, reduced mean and turbulent velocity directly downstream of individual patches can promote sediment deposition in this region (Hu et al., 2018; Ortiz et al., 2013). At the canopy scale, patchy distributions of emergent vegetation generate lower turbulence near the bed compared to homogeneous distributions, resulting in a lower bedload transport rate (Shan et al., 2020). While these studies have provided valuable physical insight, they were limited to either a single submerged patch or emergent canopy conditions, failing to capture the full range of vegetation found in natural channels. The present study builds on previous research by investigating the impact of a canopy consisting of 3D submerged patches on bedload transport. Laboratory experiments were conducted using patches of model plants (Rotala indica) in a noncohesive sand bed. This study varied the patch area density, defined as the bed area fraction occupied by patches, between 0 and 0.56. It also considered different spatial distributions, from 2D (channel-spanning patches) to 3D (laterally unconfined patches). The bedload transport rate varied with spatial configuration and was influenced by both mean and turbulent flow characteristics near the bed, such that a predictive model integrating both velocity and turbulence performed better than predictions based on velocity (bed stress) or turbulence magnitude alone.
2 Bedload transport model
In open channel conditions, bedload transport occurs when the shear stress acting on the sediment exceeds the critical resistive force holding grains in place. Based on this, Meyer-Peter and Müller (1948) proposed a model to predict bedload transport rate (), defined as the dry mass of the sediment passing a unit cross-sectional width per time, using the time-averaged bed shear stress () and the critical shear stress required to initiate motion, defined by the nondimensional Shields parameter (),
in which is the dimensionless bedload transport rate (), is an empirical coefficient (12.0 0.5, Deal et al., 2023), and is the nondimensional bed shear stress,
Here, and are the sediment and fluid densities, respectively, is the median grain diameter, is the gravitational acceleration, and is the grain fall velocity, which can be estimated using Rubey’s (1933) equation:
in which is the kinematic viscosity of the fluid.
The time-averaged bed shear stress can be estimated as: , in which is the near-bed time-mean velocity, and is the bed drag coefficient, approximated from the near-bed Reynolds stress () over a bare bed (e.g., Yang and Nepf, 2018). The critical Shields parameter depends on particle characteristics (Julien, 2010):
with the angle of repose and the dimensionless particle diameter, .
Bedload transport is also affected by turbulence (Ancey, 2020; Nelson et al., 1995; Park and Hwang, 2023). Turbulence produces instantaneous enhancement of bed stress, which can dislodge particles, and also generates pressure fluctuations that lift sediment from the bed (Celik et al., 2010; Vollmer and Kleinhans, 2007; Zanke, 2003). Reflecting the contribution of turbulence, Zhao and Nepf (2021) proposed a new model based on turbulent kinetic energy (TKE),
in which () is the nondimensional TKE, with the near-bed TKE, ( over the bare bed) is a scale coefficient that relates bed-generated turbulence with bed-shear stress, and () is the nondimensional critical near-bed TKE inferred from the critical bed stress over bare bed.
For uniform, emergent canopies, the TKE-based model in Equation 4 improved the prediction of bedload transport compared to Equation 1. However, it performed poorly for the submerged patchy canopies considered in this study and the submerged cylinder arrays examined by Zhao and Nepf (2024). For submerged canopies, both mean flow and turbulence influence bedload transport (see Zhao and Nepf, 2024, and Section 4). To reflect the influence of both time-mean bed stress and turbulence, Yang and Nepf (2019) proposed a hybrid flow parameter:
This parameter predicts bedload transport as:
Here, and 4.5) are the parameters obtained from data in Yang and Nepf (2019); Shan et al. (2020), and Zhao and Nepf (2024). The parameter was determined as the value that minimized the relative error () between the observed () and predicted bedload transport rate ().
3 Experimental setup
Laboratory experiments were conducted in a 1-m-wide (W) and 10.4-m-long recirculating flume equipped with two recirculation pipes: one for water (navy arrow in Figure 1A) and one for sediment (brown arrow in Figure 1A). An ejector pump continuously drew sediment from the collection area at the downstream end of the test section and returned it to the upstream end, ensuring a constant sediment feed. To minimize water surface fluctuations caused by the sediment return flow, a 0.7-m-long damping zone was installed using wooden dowels with a diameter of 2.5 cm. The test section length (Ltest) ranged from 2.5 to 4.0 m, depending on the experimental case (Table 1). The flow rate (), depth, and channel-averaged velocity were fixed, with H= 0.27 0.01 m and 0.34 0.01 m/s.
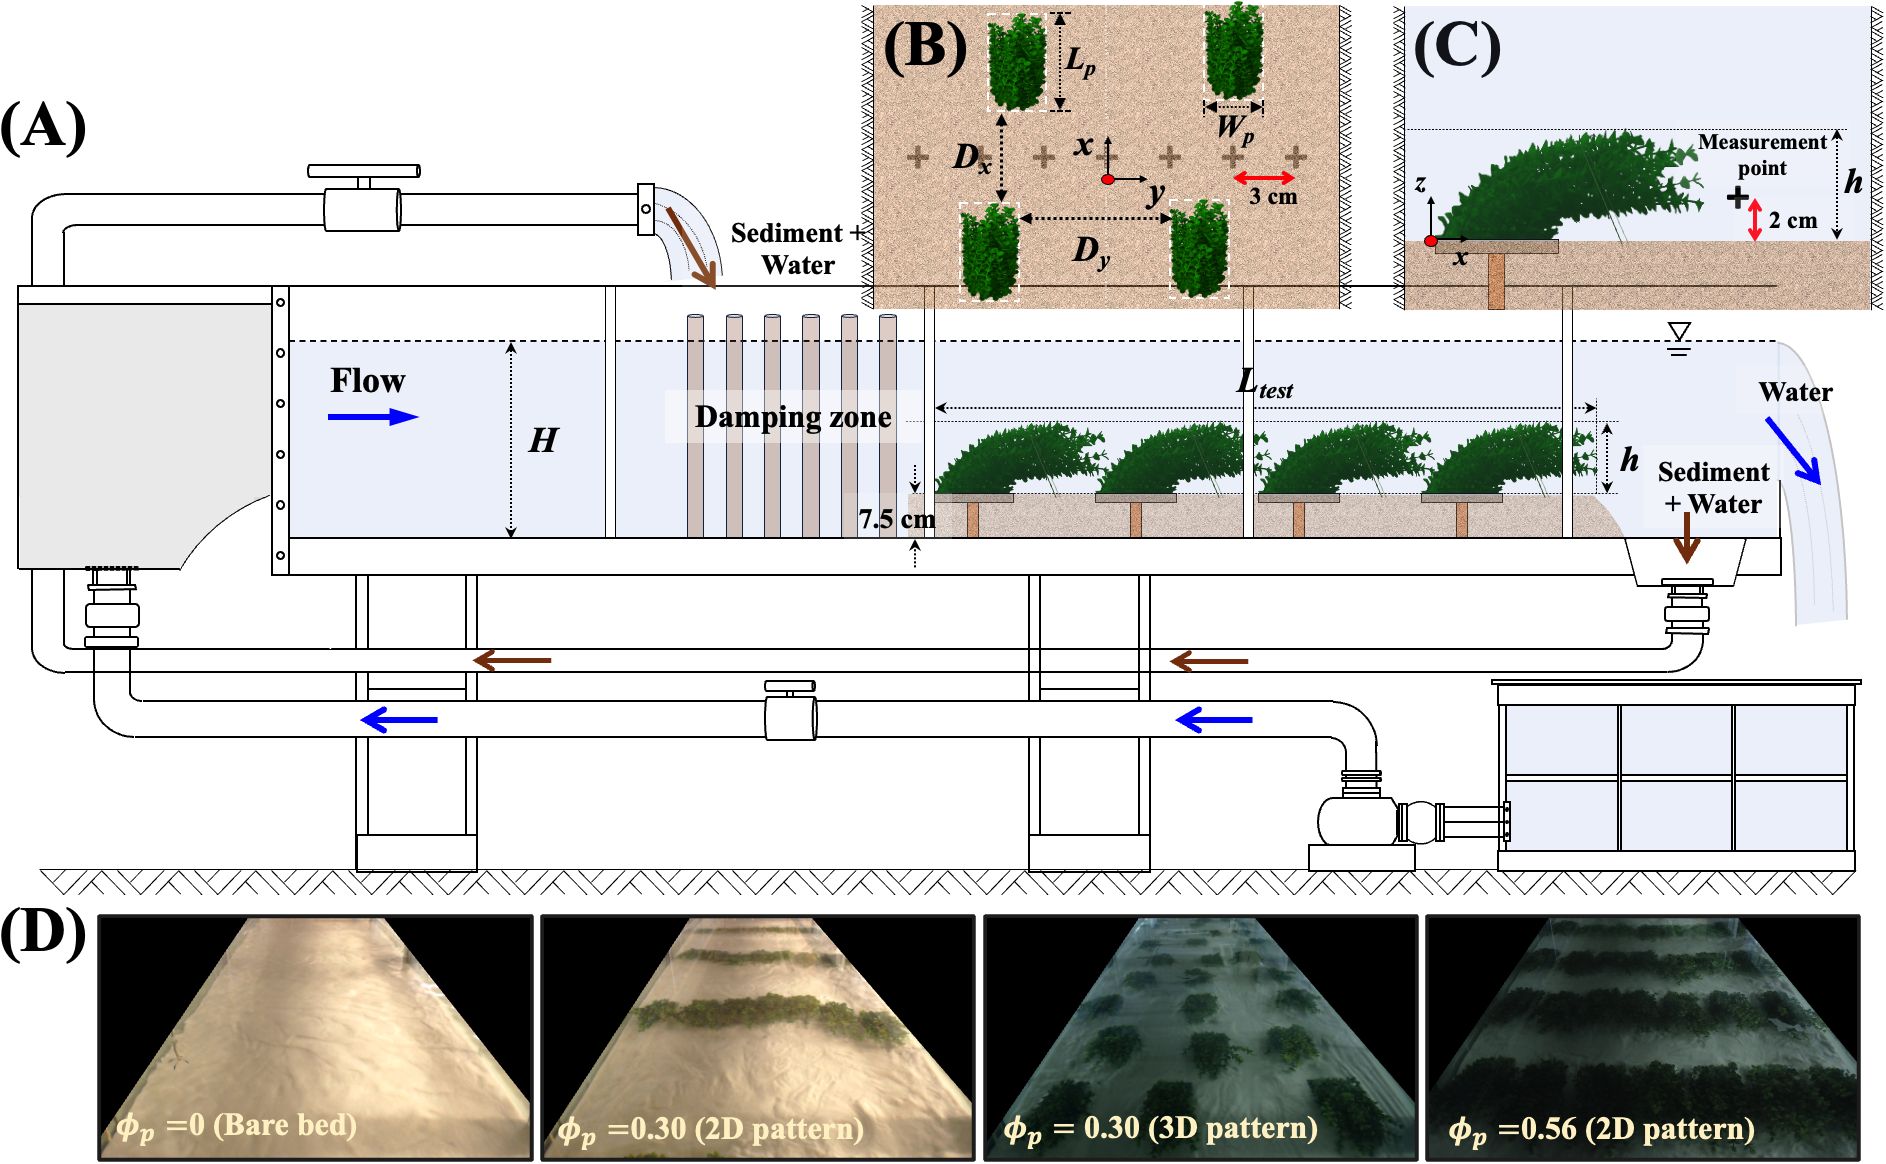
Figure 1. (A) Schematic of the recirculating flume (not to scale). Patches were fixed in a 7.5-cm-thick sand bed. Brown and navy arrows indicate the recirculation paths of sediment and water, respectively. (B) Definition of patch geometry and spacing. (C) Side view of the measurement point. (D) Top views of case 1 (bare bed), case 3 (0.30), case 5 (0.30), and case 9 (0.56).
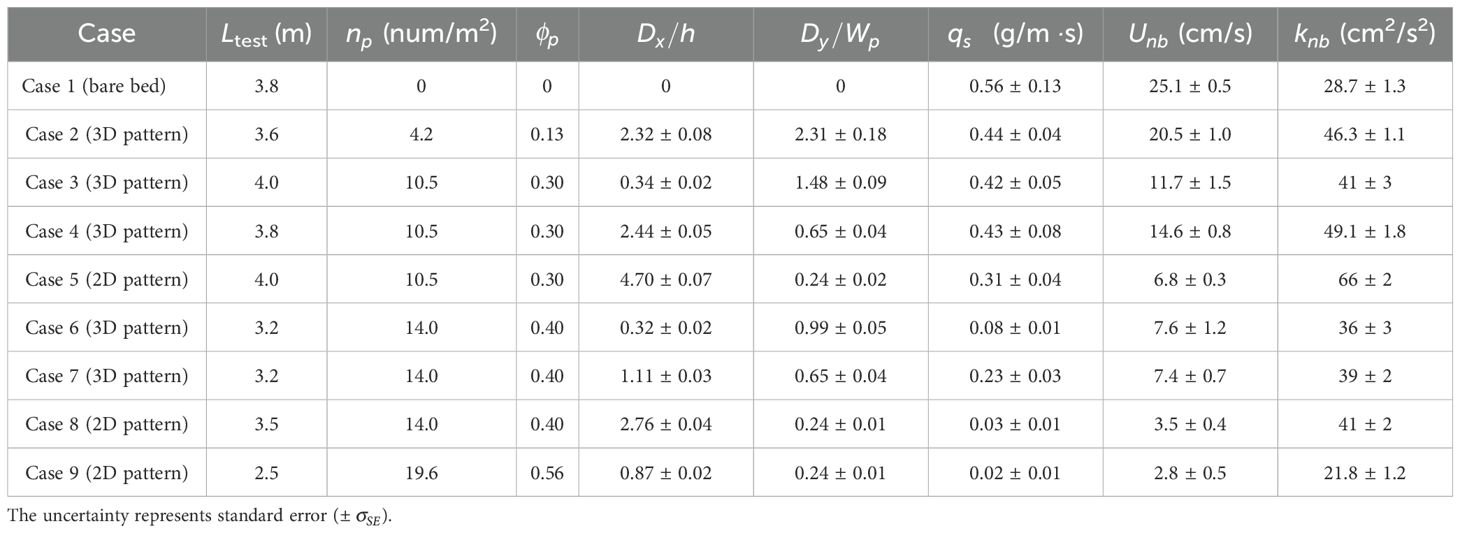
Table 1. Experimental conditions and near-bed flow characteristics (2D pattern and 3D pattern indicate spatial configuration with channel-spanning patches and laterally unconfined patches, respectively.
Vegetation patches were constructed by attaching 24 flexible plastic plants (Rotala indica) to a 5-mm-thick PVC plate with an area of 0.12 m × 0.12 m. The plates were anchored to the channel bed using wooden cylinders (brown vertical stick in Figure 1A). To mimic reconfiguration, the plants were artificially deflected in the streamwise direction using a 1-mm-diameter steel wire, resulting in patch height of =10.6 cm 0.7 cm, a patch width of =11.2 cm 0.8 cm, and a patch length of =26.0 cm 0.9 cm. These patch dimensions were chosen based on the reconfigured geometry of patches observed in natural streams (Cornacchia et al., 2023). A 7.5-cm-thick layer of sand with a median grain size of 0.35 mm and a density of 2,650 kg/m3 was manually flattened before starting each experiment. For medium sand (0.25 mm 0.5 mm), 30 in Equation 3 (see Table 7.1 in Julien, 2010). The formation and movement of ripples were observed in digital video recordings and quantified by measuring the bed elevation every 10 min using the distance check mode of ADV (Vectrino, Nortek) at two positions within the canopy: between (point A) and behind (point B) individual patches (Figure 2A). The change in bed elevation () was calculated by subtracting the initial bed elevation (7.5 cm) from the measured bed elevation at time ().
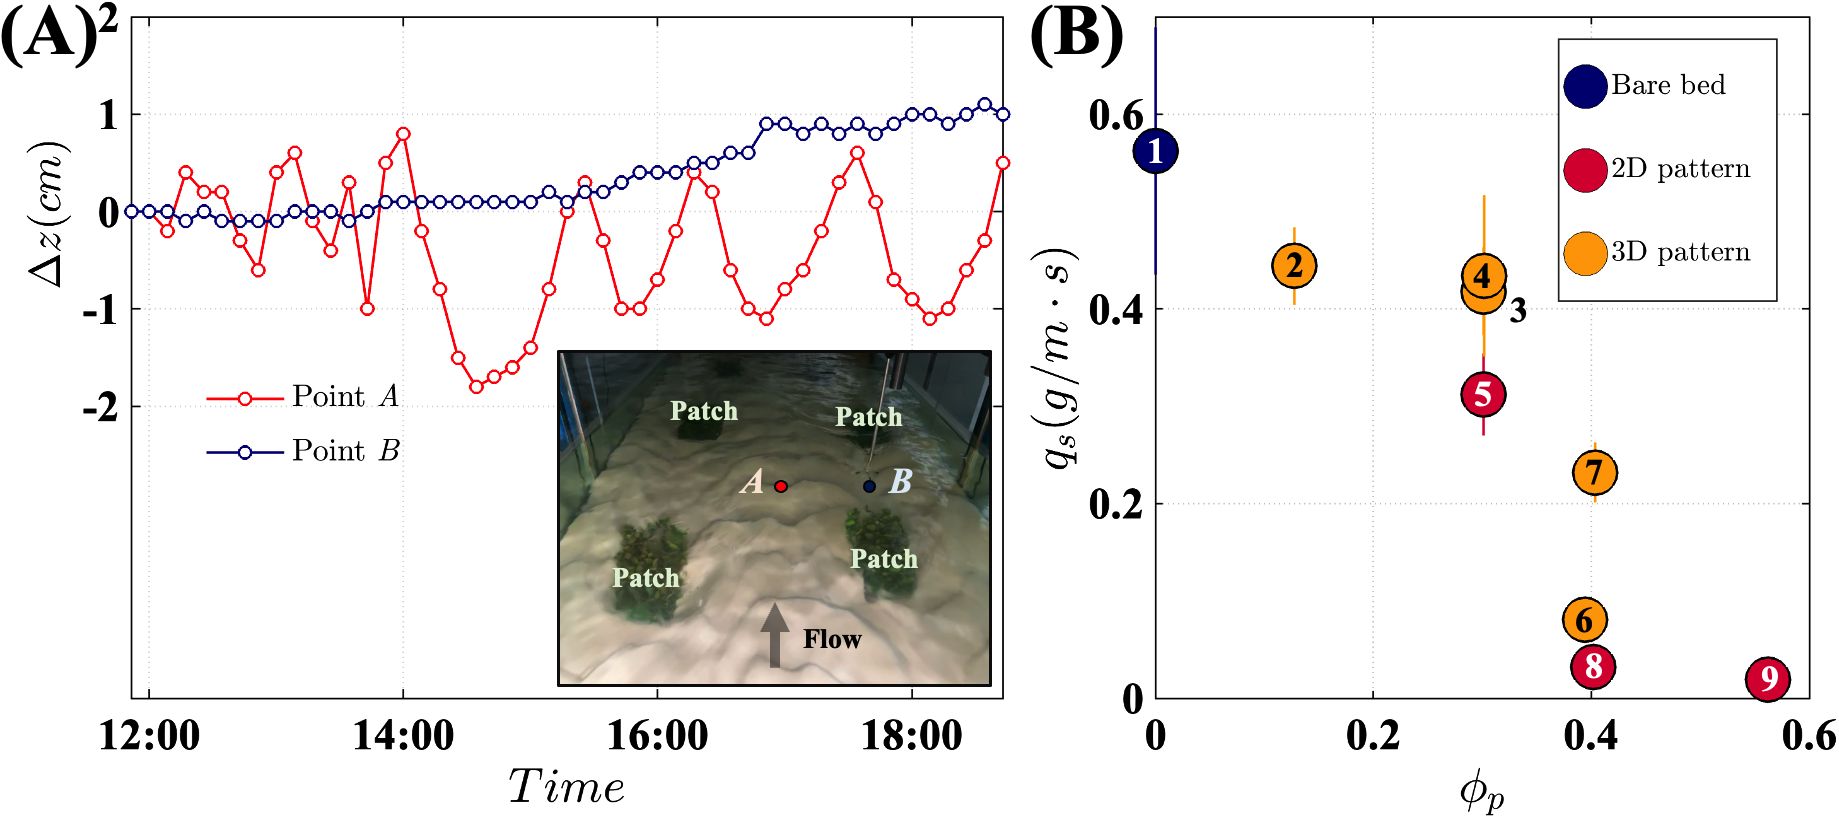
Figure 2. (A) The change in bed elevation (Δ) for case2 at positions A and B, shown in the inset photo. (B) Bedload transport rate as a function of patch area density, . The red markers indicate 2D channel-spanning patches (e.g., 2D pattern in Figure 1C, case 5, and case 8 in Table 1). The orange markers indicate laterally unconfined 3D patches (e.g., the inset above and the 3D pattern in Figure 1C). The numbers on the markers correspond to the case numbers listed in Table 1.
Nine spatial configurations, including both bare and vegetated channels, were considered (Table 1). The patch area density ranged from 0 to 0.56: is the number of patches per bed area and (= 0.028 0.001 m2) is the horizontal area occupied by a single patch. A previous study showed that for the same , near-bed velocity and turbulence varied with the spatial configuration (Park and Nepf, 2025). To capture this effect, we considered three different configurations for the patch densities of 0.3 and 0.4 by varying both the longitudinal gaps () and the lateral gaps () between individual patches (Figure 1B). For channel-spanning patches (2D pattern), patches were arranged in lines across the channel, spaced closely enough that flow between patches was inhibited. For laterally unconfined patches (3D pattern), patches were placed in a roughly staggered arrangement with some randomization, such that flow between adjacent patches was not inhibited (top view in Figure 1D).
During an experiment, both the bedload transport rate () and the near-bed velocity were measured. The bedload transport rate was measured by diverting sediment from the recirculation pipe using a T-valve. A mesh bag was connected to the end of the diversion to collect sediment for 5 to 15 min ( 300 to 900 s), depending on how quickly the bag filled. The collected sediment was placed in a container with water, and the total volume () and mass () of the fluid and sediment in the container were measured by subtracting the mass of empty container. Since , the volume of sediment () collected could be estimated as and the dry mass of sediment as , and is the water density (1,000 kg/m3). The bedload transport rate was then estimated as (unit: g/m). Every 4 h, four replicate measurements were conducted to estimate the mean and the standard error of (Table 1). When stabilized over three consecutive measurements (8 h), we assumed that the equilibrium state of bedload transport had been established and started velocity measurements.
Instantaneous velocities and , in the streamwise, lateral, and vertical directions, respectively, were measured using ADV. The ADV was mounted on a traverse system, allowing adjustment of the measurement positions in the x-y-z plane. Measurements were made 2 cm above the sand bed (Figure 1C a 7-cm distance between ADV and sand bed) with a 3-cm lateral interval (30 measurement points in the lateral direction). For the configuration with the highest density, velocity was also measured near the water surface (0.8) to identify the flow regime (see Section 4.2). Depending on the longitudinal gap size, velocity measurements were carried out at one to three different streamwise positions in the gap. At each point, velocity was measured for 2 min at 100 Hz, and spikes were removed using the despiking method introduced by Goring and Nikora (2002). A short recording time (2 min) was necessary to achieve the required spatial coverage for this study. Note that the measurement time was short compared to the ripple period of 80 min (Figure 2A). This was justified based on findings from a previous study with similar ripple sizes. Specifically, Yang and Nepf (2019) demonstrated that velocity and turbulent kinetic energy measurements taken at 2 cm above the bed exhibited less than 21% variation over the period of migrating ripples (see Supplementary Figure S2 in Yang and Nepf, 2019). This indicated that the 2-min record could represent long-time averages with relatively small uncertainty (20%). Furthermore, the effect of bedform migration within the 2-min velocity measurement could be neglected, as bedform variation over this period was less than 0.5 mm. The velocity records were used to compute two hydraulic parameters: (1) spatial- and temporal-averaged, near-bed stream-wise velocity (), and (2) the turbulent kinetic energy (. The overbar and bracket indicate a temporal and spatial averaging, respectively, while a single prime denotes temporal fluctuations. The spatial average was performed over the horizontal plane and included 30 to 90 measurement points.
4 Result
4.1 Bed load transport
Ripples formed and migrated downstream in the gaps between patches. For example, point A in Figure 2A (red symbols) was located between patches. At this point, the bed elevation fluctuated irregularly over 0.4 cm for the first 3 h, then fluctuated periodically with an amplitude of 0.7 cm and a period of 80 min. In contrast, directly behind a patch (point B, blue symbols in Figure 2A), sediment was continuously deposited over time, resulting in a steady increase in bed elevation. This observation aligned with previous studies that also reported sediment deposition downstream of a vegetation patch (e.g., Ortiz et al., 2013; Hu et al., 2018).
The bedload transport rate was highest in the bare channel and decreased with increasing (Figure 2B). Given the limited number of cases, a simple linear decrease would be a reasonable inference. However, when considering the 2D (red) and 3D (yellow) cases in isolation, the decrease in was steeper for 0.3, suggesting a threshold behavior, which we explore further in the context of the velocity and turbulence trends. The trend of decreasing bedload transport with increasing vegetation coverage contrasts with emergent patchy canopies, where bedload transport rate increases as the bed area occupied by vegetation () increases (Shan et al., 2020). In emergent canopies, flow is laterally deflected around the patches, causing velocity and turbulence to increase in the bare areas between vegetation, which in turn enhances the bedload transport. Conversely, in submerged canopies, as the bed area occupied by vegetation increases, more flow passes over the top of individual patches rather than around them, reducing the near-bed velocity (Figure 3C) and consequently diminishing . Finally, for the same , shifting from a distribution of finite patches (3D pattern, Figure 1C) to channel-spanning patches (2D pattern, Figure 1C) resulted in a lower bedload transport rate (compare red and orange dots at same in Figure 2B). The variation in was influenced by both mean and turbulent flow characteristics, which will be discussed in the next section.
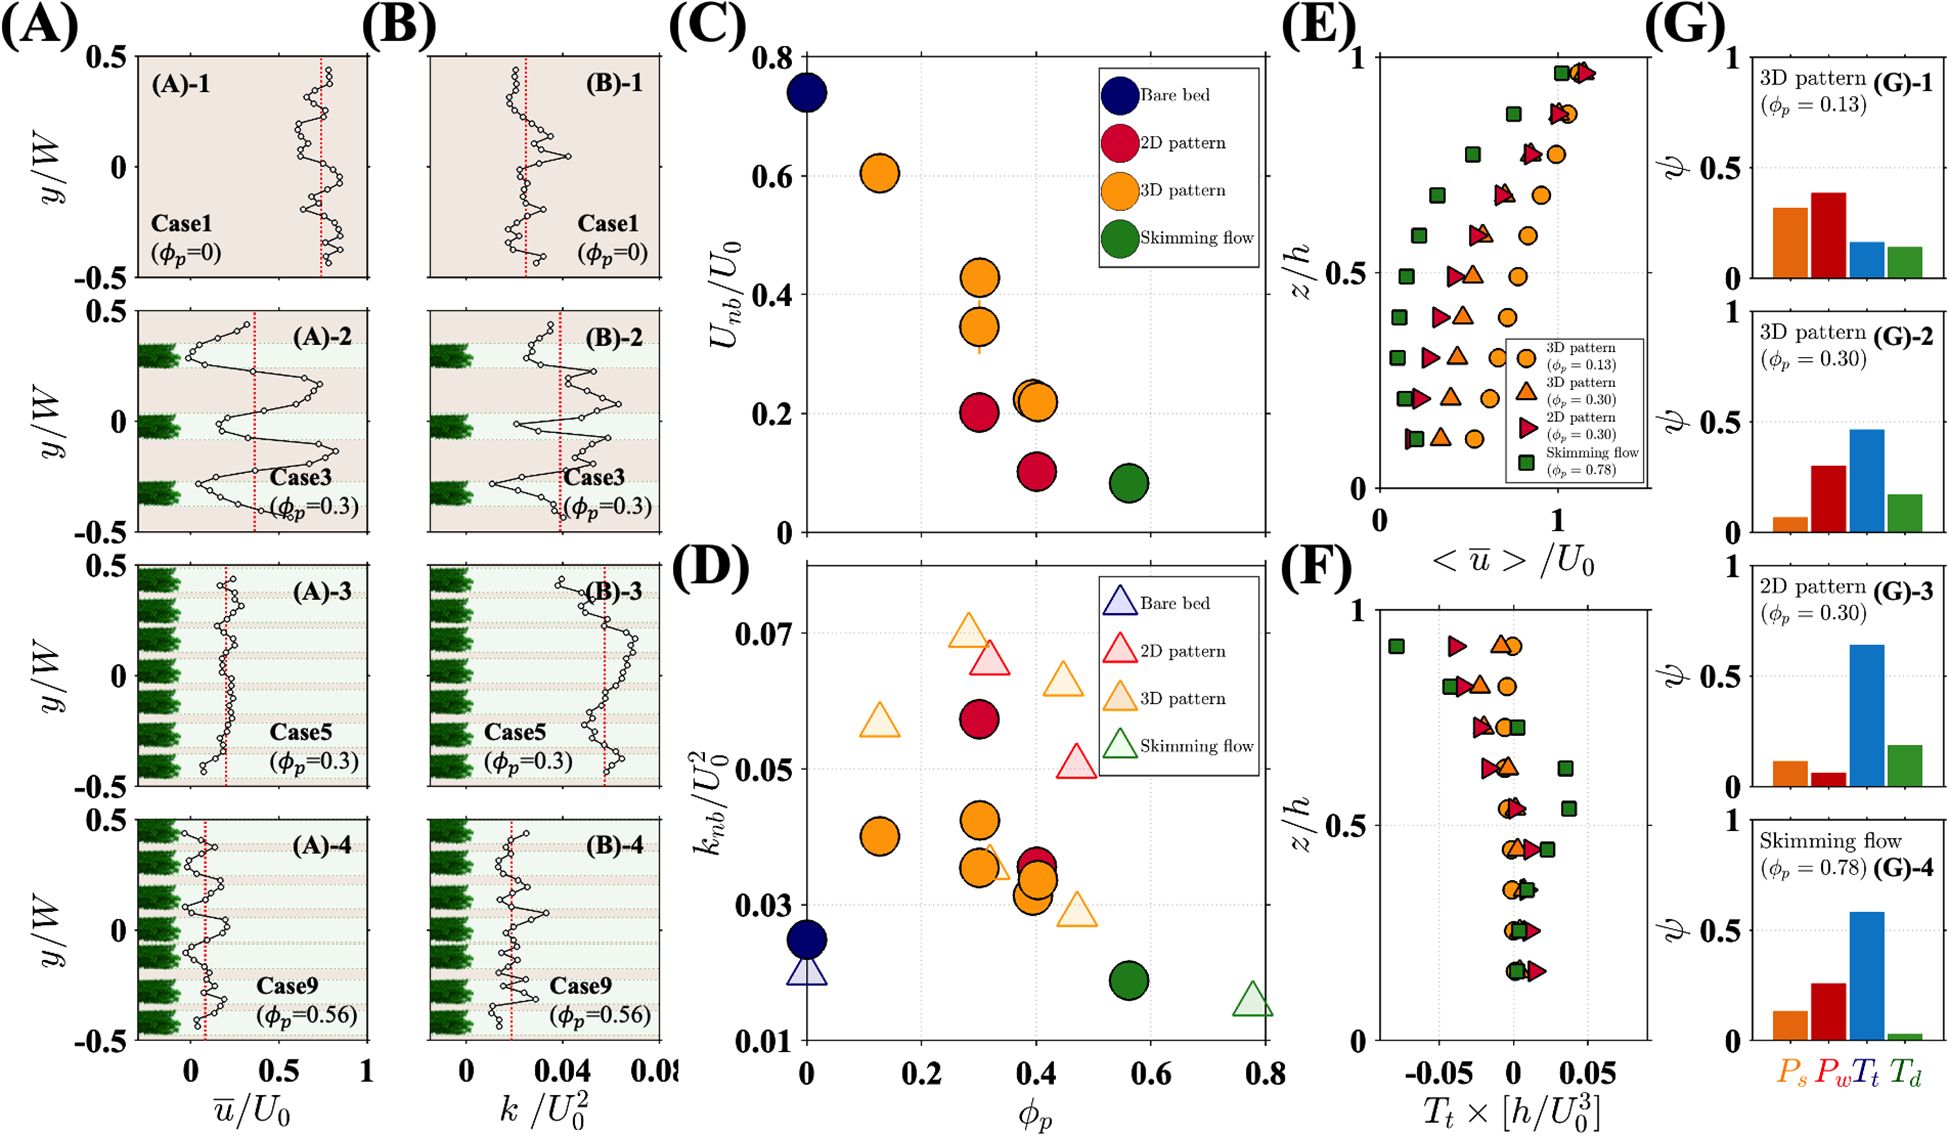
Figure 3. Lateral distribution of normalized (A) streamwise velocity and (B) turbulent kinetic energy for different experimental cases. The green and brown areas represent the regions behind and between the patches, respectively. The red dotted lines indicate horizontally averaged values. Variation in horizontally averaged near-bed (C) streamwise velocity and (D) turbulent kinetic energy with patch area density. Circle markers represent data from the present study with a mobile bed, while triangle markers correspond to Park and Nepf (2025), who used the same plant model but with a fixed bed. Vertical distribution of horizontally averaged (E) streamwise velocity and (F) turbulent transport obtained from Park and Nepf (2025). (G) Fractional contribution () of terms in the turbulence budget evaluated at 0.2.
4.2 Mean and turbulent flow characteristics within the canopy
Near-bed flow characteristics differed between spatial configurations. First, consider case 3 with a patch area density of 0.3. With large lateral gaps between individual patches, near-bed flow primarily moved through the gaps, with significantly lower velocity ( 0) and lower TKE (0.02) downstream of individual patches (green shading in Case 3 in Figure 3A (2), Figure 3B (2); Supplementary Figure S1) compared to the regions between the patches (brown shading in Figure 3A (2), Figure 3B (2); Supplementary Figure S1). The regions of low hydrodynamic intensity behind the patches facilitated sediment deposition (point B in Figure 2A). In the regions in between patches, higher mean velocity and TKE promoted ripple formation and sediment migration (point A in Figure 2A). As the lateral spacing between patches decreased, the velocity difference between the gaps and wakes also decreased (compare cases 3 and 5 in Figure 3A).
The spatially averaged near-bed velocity, , was highest in the bare channel (blue marker, Figure 3C) and decreased with increasing patch area density . Patch configuration also influenced velocity at the same : the 2D channel-spanning configurations (red markers in Figure 3C) consistently exhibited lower mean velocity than 3D configurations (orange markers in Figure 3C) due to total blockage when patches spanned the channel width as a continuous group (2D pattern in Figure 1C). For 0.56 in a channel-spanning configuration, most of the flow skimmed over the canopy, reducing near-bed velocity to nearly zero (Figure 3A , Case 9). In this case, the ratio of surface velocity () to near-bed velocity () was 0.048, which met the criteria for skimming flow, 0.05, as defined in Folkard (2011). 0.56 also met the criteria 0.4 for skimming flow (Wolfe and Nickling, 1993).
In contrast to near-bed velocity, which monotonically decreased with increasing (Figure 3C), near-bed turbulence exhibited a nonlinear trend with , with a peak near 0.3 (circles in Figure 3D). Given the limited number of cases, it was possible that the peak was broad and spanned 0.3 and 0.4. Specifically, considering all cases at the same , the average TKE for 0.3 and 0.4 were 0.045 0.028 and 0.033 0.005, respectively ( 95% confidence level in a t-test), and the probability that the confidence intervals of these two groups overlap was approximately 32%. Figure 3D is supplemented with measurements from Park and Nepf (2025, triangles in Figure 3D), who conducted experiments with the same vegetation models but over a fixed bed. For similar canopy conditions, a lower TKE was observed over the mobile bed (circles), which likely reflected the loss of turbulent energy transferred to sediment movement. Despite the difference associated with bed mobility, both studies indicate a nonlinear influence of patch area density and near-bed TKE, with a maximum near 0.3 (Figure 3D).
For a bare bed (blue circle in Figure 3D), near-bed turbulence was solely derived from bed-shear production (). The introduction of patchy vegetation both changed the near-bed shear production and created new sources of turbulence, resulting in higher near-bed TKE (red and orange markers in Figure 3D) compared to the bare bed (blue circle). Specifically, wake production () occurred in the canopy, and vertical turbulent transport () and dispersive transport () transferred turbulence generated in the shear-layer at the canopy top to the near-bed region (see details in Supplementary Data Sheet 1 - Section 2). A notable exception was the canopies classified as skimming flow (green markers in Figure 3D), for which near-bed turbulence was lower than the bare bed. The nonlinear response of near-bed TKE to patch area density can be understood through changes in the turbulence budget.
When was low (0.13), near-bed velocity was high (Figure 3C), resulting in high wake production (), which contributed the most (38%) to the near-bed turbulence budget (red bar in Figure 3(G)-1 ). As patch density increased to 0.3, near-bed velocity diminished and became more laterally uniform, reducing the contributions from both bed-shear production and wake production (orange and red bars in Figure 3G (2)). At this density, turbulence produced at the top of the canopy and carried toward the bed by turbulent transport () made the greatest contribution to near-bed TKE (Figures 3(G)-2 and 3(G)-3).
For the patch area density producing the peak TKE (0.30), the magnitude of near-bed turbulence depended on spatial configuration, with lower 0.03 for distributed 3D patches (orange markers in Figure 3D) compared to 0.06 for channel-spanning 2D patches (red marker in Figure 3D). The higher turbulence in the channel-spanning configuration was attributed to strong shear in the canopy shear layer, which contributed to the near-bed turbulence through a higher magnitude of vertical turbulent transport (, blue bars in Figure 3G).
As patch area density increased to the point of skimming flow ( 0.56), the shear at the top (green squares in Figure 3E) and thus the canopy-shear production reached its highest value. However, the turbulence produced at the canopy top did not penetrate to the bed, as indicated by the near-zero below 0.4 (green square in Figure 3F). The high canopy drag inhibited turbulent transport toward the bed. In addition, under skimming flow conditions, the near-bed velocity was both small and uniform in both lateral and vertical directions (Figures 3(A)-4, 3E), resulting in minimal bed-shear and wake production. Consequently, the minimum near-bed TKE was observed among all cases (green marker in Figure 3D). Finally, dispersive transport did not make a significant contribution to near-bed turbulence in any of the cases, consistently remaining below 15% (green bars in Figure 3G).
The variation in velocity and TKE with explained the variation of with . Recall from Figure 2B that decreased as increased, but the trend was milder for 0.3 and stronger for 0.3. For 0.3, as increased, near-bed velocity decreased, but TKE increased (Figures 3C, D). These trends had opposing impacts on bedload transport, resulting in a mild decrease in with increasing (Figure 2B). However, for 0.3, both velocity and TKE decreased with increasing (Figures 3C, D), causing a sharp decrease in (Figure 2B). Under skimming flow conditions at the highest , both mean velocity and TKE reached their lowest value across all experimental cases, resulting in the smallest . This highlights the importance of considering both time-mean velocity and turbulence when interpreting bedload transport within submerged canopies.
The drop in bedload transport near 0.3 can be linked to a positive feedback mechanism known to influence the vegetated landscapes. Specifically, in seagrass meadows, which predominantly experience submerged conditions, a patch density around 0.4 is commonly observed in fragmented meadows (e.g., Luhar et al., 2008; Schaefer et al., 2025). According to percolation theory, when 0.4, bare regions can form channels associated with higher velocity, promoting sediment mobility and inhibiting vegetation re-establishment. This creates a positive feedback loop that sustains the channels and the patchy meadow landscape. For example, Schaefer et al. (2025) used satellite images to show that a patchy seagrass meadow persisted for over 50 years, with individual patches shifting position while maintaining 0.4. In contrast, when 0.4, continuous channels are less likely to form, and velocity in bare regions is not elevated, eliminating the positive feedback. Consequently, when 0.4, patches can expand into the bare regions and eventually form a continuous meadow (1).
Our results revealed a similar threshold between 0.3 and 0.4. Specifically, when 0.3, the bare regions between patches exhibited higher near-bed velocity and greater bedload transport, potentially inhibiting vegetation regrowth and maintaining the existing vegetation distribution. However, when 0.4, both mean velocity and TKE sharply decreased, causing bedload transport to approach zero as increased (Figure 2B). The reduction in bedload transport would stabilize the channel bed, protecting the existing vegetation distribution and potentially facilitating vegetation expansion into the bare regions. Thus, our study aligns with previous studies suggesting that a threshold near 0.3 to 0.4 plays a key role in the evolution of vegetated landscapes.
4.3 Bedload transport prediction
The measured bedload transport was compared with the models introduced in Section 2, which were based on bed shear stress (Equation 1), near-bed TKE (Equation 4), and a combination of both (Equation 5). The bed drag coefficient (0.0050.001) and (0.11) were computed from measurements over a bare bed, as described in Section 2. For the bare bed condition, both the and models provided good prediction (blue triangles in Figures 4A, B), but the model significantly underestimated in the vegetated channels, with errors reaching up to two orders of magnitude (Figure 4A). This was because the time-averaged bed shear stress () did not account for vegetation-generated turbulence, which can play a critical role in bedload transport within vegetated channels (Tinoco and Coco, 2016, 2018; Zhao and Nepf, 2021). The model provided a better prediction for emergent canopies, compared to the model (see red markers in Figures 4A, B), but it performed poorly for submerged canopies (blue circles and triangle markers in Figure 4B). For submerged canopies, turbulence transported vertically from the top of the canopy contributed significantly to near-bed turbulence (Zhao and Nepf, 2024), leading to a weak correlation between near-bed velocity and TKE, with a correlation coefficient of just 0.03 (Supplementary Figure S2). In this case, neither the bed shear stress estimated from time-averaged velocity nor the TKE alone could adequately describe the flow characteristics influencing bedload transport.
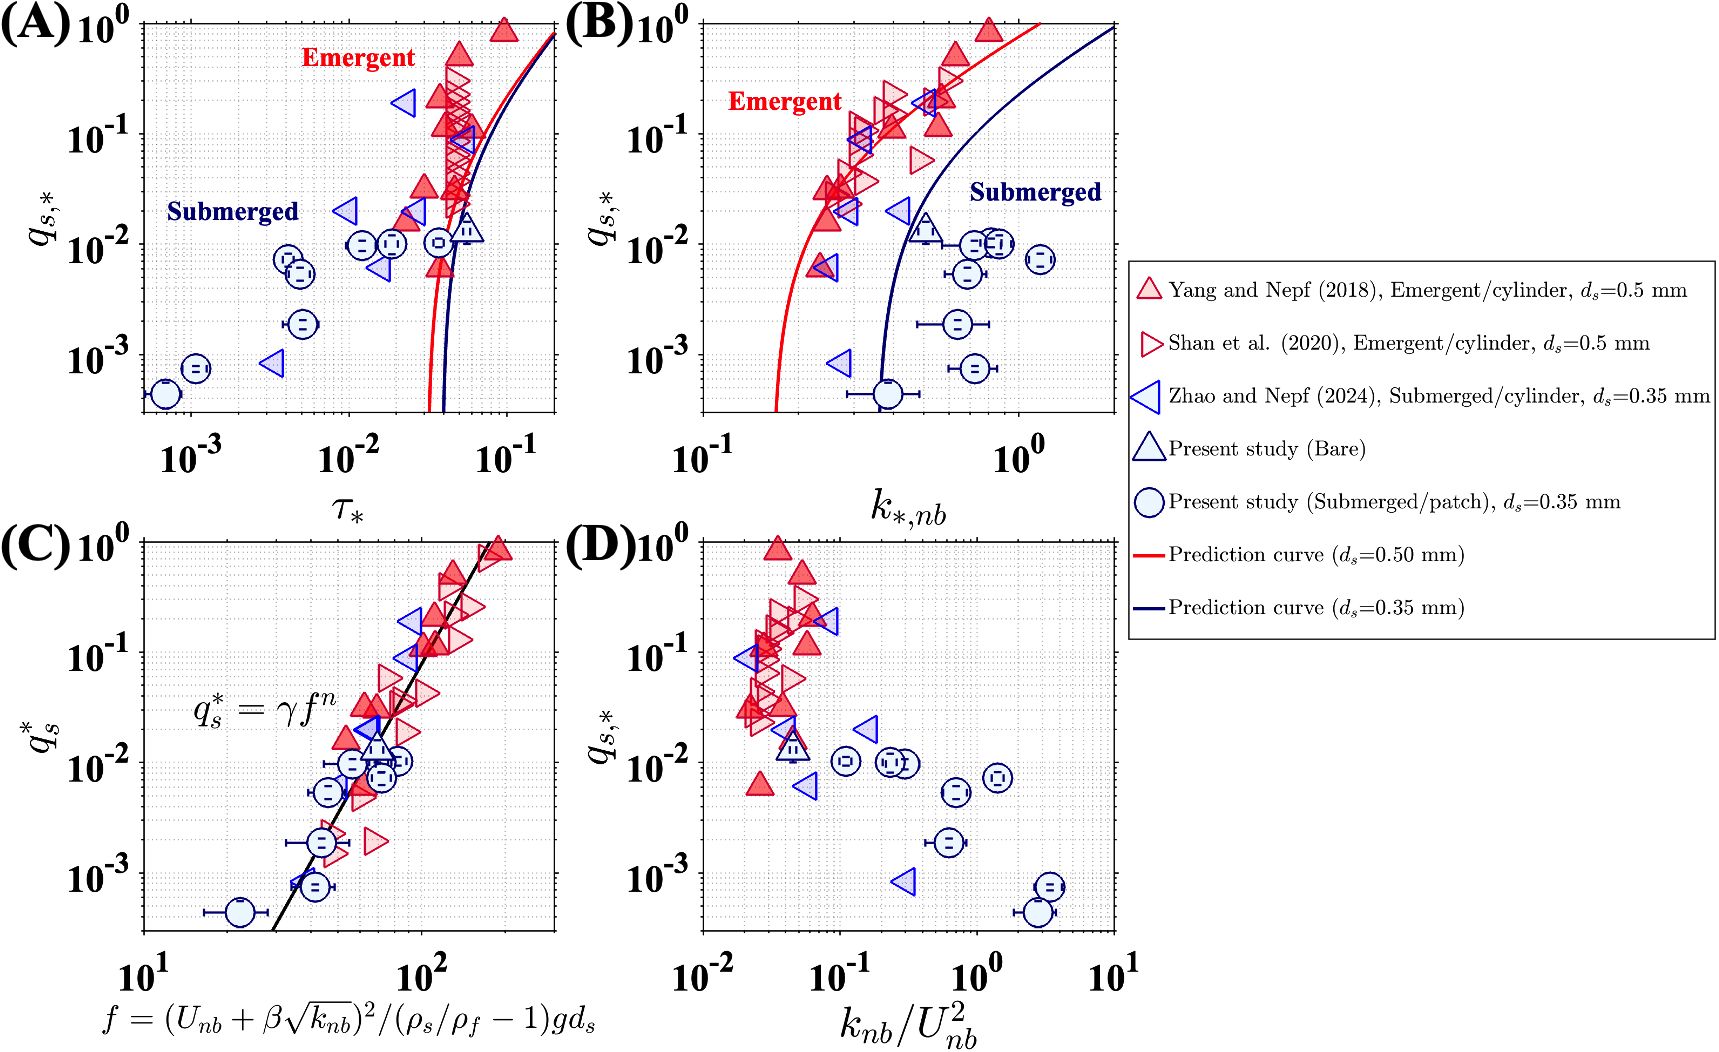
Figure 4. Nondimensional bedload transport rate () versus (A) mean bed shear stress, (Equation 2) (B) turbulent kinetic energy , (C) the hybrid parameter , and (D) normalized near-bed TKE, .
The hybrid model defined in Equations 5 and 6 provided a closer fit to observations for both bare and vegetated channels and, importantly, for both emergent and submerged canopies (Figure 4C). However, in this study, using patchy submerged vegetation models, the value of in Equation 5 was found to be 7, which was lower than the previously reported 10 in studies using both emergent and submerged cylinder arrays. The lower can be explained by the difference in canopy structure. Specifically, in patchy canopies, stronger and more pronounced regions of horizontal shear formed around individual patches compared to individual cylinders, which elevated turbulence levels and resulted in a higher compared to the cylinder arrays in previous studies (Figure 4D). The lower in the patchy canopy also implied that, under the same near-bed velocity and TKE conditions, the patchy canopy produced lower bedload transport compared to cylinder arrays. This could be attributed to the larger bedform development within the patchy canopy. While cylinder arrays generate localized scour holes around individual cylinders, the patchy canopy formed relatively large deposition regions downstream of individual patches (Figure 2A). These deposition zones did not contribute to channel-scale bedload transport, leading to a lower compared to cylinder arrays.
The present study considered a single sediment size (0.35 mm), and the results would likely be influenced by sediment characteristics that affect their response to turbulence. For example, the response timescale for a sand grain with 0.35 mm is 0.018 s, where is the dynamic viscosity. The near-bed turbulence timescale (), defined as the integral time scale, varied from 0.18 to 0.26 s across the experimental cases. These time scales resulted in Stokes numbers () below 0.1, indicating that the sediment grains could respond to the turbulent fluctuations (Brandon and Aggarwal, 2001). However, for 1.3 mm, the sediment response time would be longer than near-bed turbulence time scales (1), meaning individual grains would not respond to turbulent fluctuations, and sediment mobility would be governed solely by the time-mean bed stress. A similar time-scale control has been observed in biocohesive sediment. Specifically, biofilms can bind individual sediment grains together, increasing their response time (Malarkey et al., 2015). As observed by Deitrick et al. (2023), when the time scale of the vegetation-generated turbulence is shorter than the time needed to break biocohesion between sediment grains, the turbulence has no impact on sediment transport, and transport is best described by the mean shear stress.
5 Conclusion
Bedload transport within a submerged patchy canopy was investigated under varying patch densities and configurations. The bedload transport rate decreased as patch area density increased, with more significant reductions when exceeded 0.3. For 0.3, an increase in was associated with two opposing trends in near-bed flow characteristics: (1) reduction in near-bed velocity as more flow passed over the top of the canopy and (2) an increase in near-bed TKE due to both patch-generated turbulence and turbulence produced in the canopy-shear layer, which was transported toward the bed. These opposing trends resulted in a mild decrease in bedload transport as increased. However, for 0.3, a further increase in led to a decline in both velocity and turbulence, resulting in a sharp reduction in the bedload transport rate. At the same , channel-spanning patches exhibited a lower bedload transport rate compared to 3D distributed patches, as vegetation distributed in channel-spanning bands resulted in lower velocity near the bed.
Data availability statement
The original contributions presented in the study are included in the article/Supplementary Material. Further inquiries can be directed to the corresponding author.
Author contributions
HP: Data curation, Formal analysis, Visualization, Writing – original draft, Writing – review & editing. HN: Conceptualization, Investigation, Supervision, Writing – review & editing.
Funding
The author(s) declare financial support was received for the research, authorship, and/or publication of this article. This research was supported by the Basic Science Research Program through the National Research Foundation of Korea (NRF), funded by the Ministry of Education (2022R1A6A3A03068939).
Acknowledgments
Additional support was provided by the Martha and Donald Harleman Chair.
Conflict of interest
The authors declare that the research was conducted in the absence of any commercial or financial relationships that could be construed as a potential conflict of interest.
Generative AI statement
The author(s) declare that no Generative AI was used in the creation of this manuscript.
Publisher’s note
All claims expressed in this article are solely those of the authors and do not necessarily represent those of their affiliated organizations, or those of the publisher, the editors and the reviewers. Any product that may be evaluated in this article, or claim that may be made by its manufacturer, is not guaranteed or endorsed by the publisher.
Supplementary material
The Supplementary Material for this article can be found online at: https://www.frontiersin.org/articles/10.3389/fmars.2025.1531231/full#supplementary-material
References
Ancey C. (2020). Bedload transport: a walk between randomness and determinism. Part 1. state art. J. Hydraulic Res. 58, 1–17. doi: 10.1080/00221686.2019.1702594
Armanini A., Cavedon V. (2019). Bed-load through emergent vegetation. Adv. Water Resour. 129, 250–259. doi: 10.1016/j.advwatres.2019.05.021
Bennett S. J., Simon A. (2004). Riparian vegetation and fluvial geomorphology Vol. 8 (Washington, DC, USA: American Geophysical Union).
Biggs H. J., Nikora V. I., Gibbins C. N., Cameron S. M., Papadopoulos K., Stewart M., et al. (2019). Flow interactions with an aquatic macrophyte: a field study using stereoscopic particle image velocimetry. J. Ecohydraulics. 4 (2), 113–130. doi: 10.1080/24705357.2019.1606677
Brandon D. J., Aggarwal S. K. (2001). A numerical investigation of particle deposition on a square cylinder placed in a channel flow. Aerosol Sci. Technol. 34, 340–352. doi: 10.1080/02786820121279
Cameron S. M., Nikora V. I., Albayrak I., Miler O., Stewart M., Siniscalchi F. (2013). Interactions between aquatic plants and turbulent flow: a field study using stereoscopic PIV. J. Fluid Mechanics 732, 345–372. doi: 10.1017/jfm.2013.406
Celik A. O., Diplas P., Dancey C. L., Valyrakis M. (2010). Impulse and particle dislodgement under turbulent flow conditions. Phys. Fluids 22, 46601. doi: 10.1063/1.3385433
Chembolu V., Kakati R., Dutta S. (2019). A laboratory study of flow characteristics in natural heterogeneous vegetation patches under submerged conditions. Adv. Water Resour. 133, 103418. doi: 10.1016/j.advwatres.2019.103418
Cornacchia L., Folkard A., Davies G., Grabowski R. C., van de Koppel J., van der Wal D., et al. (2019). Plants face the flow in V formation: a study of plant patch alignment in streams. Limnol. oceanogr. 64, 1087–1102. doi: 10.1002/lno.11099
Cornacchia L., Lapetoule G., Licci S., Basquin H., Puijalon S. (2023). How to build vegetation patches in hydraulic studies: a hydrodynamic-ecological perspective on a biological object. J. Ecohydraulics 8, 105–120. doi: 10.1080/24705357.2023.2176375
Cornacchia L., Van De Koppel J., van der Wal D., Wharton G., Puijalon S., Bouma T. J. (2018). Landscapes of facilitation: How self-organized patchiness of aquatic macrophytes promotes diversity in streams. Ecology 99, 832–847. doi: 10.1002/ecy.2018.99.issue-4
Czarnomski N. M., Tullos D. D., Thomas R. E., Simon A. (2012). Effects of vegetation canopy density and bank angle on near-bank patterns of turbulence and Reynolds stresses. J. Hydraulic Eng. 138, 974–978. doi: 10.1061/(ASCE)HY.1943-7900.0000628
Deal E., Venditti J. G., Benavides S. J., Bradley R., Zhang Q., Kamrin K., et al. (2023). Grain shape effects in bed load sediment transport. Nature 613, 298–302. doi: 10.1038/s41586-022-05564-6
Deitrick A. R., Hovendon E. H., Ralston D. K., Nepf H. (2023). The influence of vegetation-generated turbulence on deposition in emergent canopies. Front. Mar. Sci. 10, 1266241. doi: 10.3389/fmars.2023.1266241
Dosskey M. G., Vidon P., Gurwick N. P., Allan C. J., Duval T. P., Lowrance R. (2010). The role of riparian vegetation in protecting and improving chemical water quality in streams 1. JAWRA J. Am. Water Resour. Assoc. 46, 261–277. doi: 10.1111/j.1752-1688.2010.00419.x
Folkard A. M. (2011). Flow regimes in gaps within stands of flexible vegetation: laboratory flume simulations. Environ. Fluid Mechanics 11, 289–306. doi: 10.1007/s10652-010-9197-5
Goring D. G., Nikora V. I. (2002). Despiking acoustic Doppler velocimeter data. J. hydraulic Eng. 128, 117–126. doi: 10.1061/(ASCE)0733-9429(2002)128:1(117)
Holzenthal E. R., Wengrove M. E., Hill D. F. (2022). Mechanisms of sediment transport around finite patches of submerged aquatic vegetation. Estuarine Coast. Shelf Sci. 273, 107905. doi: 10.1016/j.ecss.2022.107905
Hu Z., Lei J., Liu C., Nepf H. (2018). Wake structure and sediment deposition behind models of submerged vegetation with and without flexible leaves. Adv. Water Resour. 118, 28–38. doi: 10.1016/j.advwatres.2018.06.001
Ismail S. N., Abd Hamid M., Mansor M. (2018). Ecological correlation between aquatic vegetation and freshwater fish populations in Perak River, Malaysia. Biodiversitas J. Biol. Diversity 19, 279–284. doi: 10.13057/biodiv/d190138
Kondziolka J. M., Nepf H. M. (2014). Vegetation wakes and wake interaction shaping aquatic landscape evolution. Limnol. Oceanogr.: Fluids Environments 4, 106–119. doi: 10.1215/21573689-2846314
Larsen L. G., Harvey J. W. (2011). Modeling of hydroecological feedbacks predicts distinct classes of landscape pattern, process, and restoration potential in shallow aquatic ecosystems. Geomorphology 126, 279–296. doi: 10.1016/j.geomorph.2010.03.015
Le Bouteiller C., Venditti J. G. (2014). Vegetation-driven morphodynamic adjustments of a sand bed. Geophysical Res. Lett. 41, 3876–3883. doi: 10.1002/2014GL060155
Liu C., Hu Z., Lei J., Nepf H. (2018). Vortex structure and sediment deposition in the wake behind a finite patch of model submerged vegetation. J. Hydraulic Eng. 144, 04017065. doi: 10.1061/(ASCE)HY.1943-7900.0001408
Luhar M., Rominger J., Nepf H. (2008). Interaction between flow, transport and vegetation spatial structure. Environ. Fluid Mechanics 8, 423–439. doi: 10.1007/s10652-008-9080-9
Malarkey J., Baas J. H., Hope J. A., Aspden R. J., Parsons D. R., Peakall J., et al. (2015). The pervasive role of biological cohesion in bedform development. Nat. Commun. 6, 6257. doi: 10.1038/ncomms7257
Massicotte P., Bertolo A., Brodeur P., Hudon C., Mingelbier M., Magnan P. (2015). Influence of the aquatic vegetation landscape on larval fish abundance. J. Great Lakes Res. 41, 873–880. doi: 10.1016/j.jglr.2015.05.010
Meyer-Peter E., Müller R. (1948). “Formulas for bed load transport,” In Proceedings of the 2nd IAHR Congress, Stockholm, Sweden, IAHR: Delft, The Netherlands, Volume A2, pp. 1–26.
Neary V. S., Constantinescu S. G., Bennett S. J., Diplas P. (2012). Effects of vegetation on turbulence, sediment transport, and stream morphology. J. Hydraulic Eng. 138, 765–776. doi: 10.1061/(ASCE)HY.1943-7900.0000168
Nelson J. M., Shreve R. L., McLean S. R., Drake T. G. (1995). Role of near-bed turbulence structure in bed load transport and bed form mechanics. Water Resour. Res. 31, 2071–2086. doi: 10.1029/95WR00976
Ortiz A. C., Ashton A., Nepf H. (2013). Mean and turbulent velocity fields near rigid and flexible plants and the implications for deposition. J. Geophysical Res.: Earth Surface 118, 2585–2599. doi: 10.1002/2013JF002858
Park H., Hwang J. H. (2023). Effect of turbulent coherent motion on the onset of particle transport using synchronized 3D PIV and PTV. Adv. Water Resour. 182, 104579. doi: 10.1016/j.advwatres.2023.104579
Park H., Nepf H. (2025). Turbulence in a channel with a patchy submerged canopy: the impact of spatial configuration. J. Fluid Mechanics. doi: 10.1017/jfm.2025.12
Rietkerk M., Van de Koppel J. (2008). Regular pattern formation in real ecosystems. Trends Ecol. Evol. 23, 169–175. doi: 10.1016/j.tree.2007.10.013
Rubey W. W. (1933). Settling velocities of gravel, sand and silt particles. Am. J. @ Sci. 25, 325–338. doi: 10.2475/ajs.s5-25.148.325
Savio M., Vettori D., Biggs H., Zampiron A., Cameron S. M., Stewart M., et al. (2023). Hydraulic resistance of artificial vegetation patches in aligned and staggered configurations. J. Hydraulic Res. 61, 220–232. doi: 10.1080/00221686.2023.2180445
Schaefer R., Colarusso P., Simpson J., Novak A., Nepf H. (2025). Continual migration of patches within a Massachusetts seagrass meadow limits carbon accretion and storage. Commun. Earth Environ. 6, 129. doi: 10.1038/s43247-025-02049-y
Schnauder I., Sukhodolov A. N. (2012). Flow in a tightly curving meander bend: Effects of seasonal changes in aquatic macrophyte cover. Earth Surface Processes Landforms 37, 1142–1157. doi: 10.1002/esp.v37.11
Schoelynck J., Creëlle S., Buis K., De Mulder T., Emsens W. J., Hein T., et al. (2018). What is a macrophyte patch? Patch identification in aquatic ecosystems and guidelines for consistent delineation. Ecohydrol. Hydrobiol. 18, 1–9. doi: 10.1016/j.ecohyd.2017.10.005
Shan Y., Zhao T., Liu C., Nepf H. (2020). Turbulence and bed load transport in channels with randomly distributed emergent patches of model vegetation. Geophysical Res. Lett. 47, e2020GL087055. doi: 10.1029/2020GL087055
Tal M., Paola C. (2010). Effects of vegetation on channel morphodynamics: results and insights from laboratory experiments. Earth Surface Processes Landforms 35, 1014–1028. doi: 10.1002/esp.v35:9
Tinoco R. O., Coco G. (2014). Observations of the effect of emergent vegetation on sediment resuspension under unidirectional currents and waves. Earth Surface Dynamics 2, 83–96. doi: 10.5194/esurf-2-83-2014
Tinoco R. O., Coco G. (2016). A laboratory study on sediment resuspension within arrays of rigid cylinders. Adv. Water Resour. 92, 1–9. doi: 10.1016/j.advwatres.2016.04.003
Tinoco R. O., Coco G. (2018). Turbulence as the main driver of resuspension in oscillatory flow through vegetation. J. Geophysical Res.: Earth Surface 123, 891–904. doi: 10.1002/2017JF004504
Vollmer S., Kleinhans M. G. (2007). Predicting incipient motion, including the effect of turbulent pressure fluctuations in the bed. Water Resour. Res. 43, W05410. doi: 10.1029/2006WR004919
Wang J., He G., Dey S., Fang H. (2022). Influence of submerged flexible vegetation on turbulence in an open-channel flow. J. Fluid Mechanics 947, A31. doi: 10.1017/jfm.2022.598
Wolfe S. A., Nickling W. G. (1993). The protective role of sparse vegetation in wind erosion. Prog. Phys. Geogr. 17, 50–68. doi: 10.1177/030913339301700104
Yager E. M., Schmeeckle M. W. (2013). The influence of vegetation on turbulence and bed load transport. J. Geophysical Res.: Earth Surface 118, 1585–1601. doi: 10.1002/jgrf.v118.3
Yang J. Q., Chung H., Nepf H. M. (2016). The onset of sediment transport in vegetated channels predicted by turbulent kinetic energy. Geophysical Res. Lett. 43, 11–261. doi: 10.1002/2016GL071092
Yang J. Q., Nepf H. M. (2018). A turbulence-based bed-load transport model for bare and vegetated channels. Geophysical Res. Lett. 45, 10–428. doi: 10.1029/2018GL079319
Yang J. Q., Nepf H. M. (2019). Impact of vegetation on bed load transport rate and bedform characteristics. Water Resour. Res. 55, 6109–6124. doi: 10.1029/2018WR024404
Zanke U. C. E. (2003). On the influence of turbulence on the initiation of sediment motion. Int. J. sediment Res. 18, 17–31.
Zhao T., Nepf H. M. (2021). Turbulence dictates bedload transport in vegetated channels without dependence on stem diameter and arrangement. Geophysical Res. Lett. 48, e2021GL095316. doi: 10.1029/2021GL095316
Keywords: turbulence, bedload, sediment, vegetation, spatial configuration
Citation: Park H and Nepf H (2025) Bedload transport within a patchy submerged canopy with different patch densities and spatial configuration. Front. Mar. Sci. 12:1531231. doi: 10.3389/fmars.2025.1531231
Received: 20 November 2024; Accepted: 12 February 2025;
Published: 10 March 2025.
Edited by:
Chao Liu, Sichuan University, ChinaReviewed by:
Yining Chen, Ministry of Natural Resources, ChinaMaoxing Wei, Zhejiang University, China
Copyright © 2025 Park and Nepf. This is an open-access article distributed under the terms of the Creative Commons Attribution License (CC BY). The use, distribution or reproduction in other forums is permitted, provided the original author(s) and the copyright owner(s) are credited and that the original publication in this journal is cited, in accordance with accepted academic practice. No use, distribution or reproduction is permitted which does not comply with these terms.
*Correspondence: Hyoungchul Park, aHBhcms0MThAbWl0LmVkdQ==