
95% of researchers rate our articles as excellent or good
Learn more about the work of our research integrity team to safeguard the quality of each article we publish.
Find out more
ORIGINAL RESEARCH article
Front. Mar. Sci. , 13 March 2025
Sec. Marine Biogeochemistry
Volume 12 - 2025 | https://doi.org/10.3389/fmars.2025.1530207
This article is part of the Research Topic Deep-sea Material and Energy Cycles: Insights from Sediments, Fe-Mn Nodules, and Authigenic Carbonates, and Their Carbon Sequestration, Hydrocarbon Accumulation, and Ore-forming Significances View all 5 articles
 Hui Pan1,2
 Hui Xie1,2,3*
 Zhongxian Zhao4*
 Jinlong Liu4Guozhong Jiang1,3Ruilong Li5Yuanping Li6Eun Young Lee7Wen Yan4
The Baiyun deepwater region (Shenhu area) of the Pearl River Mouth Basin (PRMB), northern South China Sea (SCS), is characterized by the presence of abundant gas hydrate deposits and dense submarine canyons. However, the relationships between gas hydrate decomposition and formation of submarine canyons remain unclear. Based on the seismic and well data, the variations of the gas hydrate stability zone (GHSZ) thickness were quantitatively calculated. The results indicate that the thickness of the GSHZ, which ranges from 0 to 350m, is distributed in areas where the water depth exceeds 600m. Since ~2.5 Ma, there have been three combinations of sea level and bottom water temperature (BWT) changes that can significantly reduce the thickness of the GHSZ. These combinations have exerted control over the GHSZ thickness in this region: (1) a slight increase in sea level accompanied by a rapid increase in BWT; (2) a rapid decrease in sea level but a slight decrease in BWT; (3) a rapid increase in both sea level and BWT. It has been found that water depth exerts an influence on the variation of the thickness of GHSZ. The impact in shallow water areas (< 1000m) is more significant than that in deep water areas (> 1000m). Consequently, in the Shenhu area, where the water depth ranges from 500 to 1000 m, the reduction in the thickness of GHSZ is consistently much greater than that in deep water areas. It is hypothesized that during seawater warming or seal level dropping, the substantial decrease in the thickness of GHSZ in the Shenhu area leads to the dissociation of gas hydrates. This dissociation may have triggered methane seepage, resulting in the formation of pockmarks. The pockmarks likely weaken the slope sediments, and the subsequent rapid sea level fall promotes synchronous gravity erosion processes, thereby forming a chain of pockmarks (channel). Continuous gas seepage may further trigger slope failures, which can widen the channel. It is proposed that this iterative process contributes to the formation of the current Shenhu Canyon Group. Our study presents a plausible mechanism elucidating how the reduction in the thickness of GHSZ, the release of methane, and the formation of submarine pockmarks interact to influence and reshape the slope morphology, as well as drive the evolution of submarine canyons. This integrative analysis not only uncovers the complex geological processes at play in the study area but also offers valuable insights into the long term geomorphological development in submarine environments.
Submarine canyons are widely distributed along continental margins (Harris and Whiteway, 2011; Su et al., 2014; Hui et al., 2019; Li et al., 2022a; Wang et al., 2022) and serve as pivotal components of deep-sea erosional-depositional systems (Sun et al., 2018; Li et al., 2023). Nevertheless, the formation and evolution mechanisms of submarine canyons were still controversial. The Baiyun deepwater region (Shenhu area) of the Pearl River Mouth Basin (PRMB), northern South China Sea (SCS), is characterized by the presence of densely distributed submarine canyons. In the Shenhu area, various hypotheses have been proposed to elucidate origins of the Shenhu Canyon Group. These are as follows: (i) Tectonic faulting model. The model suggested the Shenhu Canyon Group may derive from gravitational erosion processes along the slope, which may be to a large extent regulated by tectonic faulting during the middle to late Miocene (Hui et al., 2019); (ii) Contour current model. The model proposed that the intermediate-water circulation can generate downslope-trending sediment waves, forming regular lateral migration spacing of the troughs between the sediment waves. Subsequently, under the influence of turbidity current erosion, these troughs developed into canyons (Wang et al., 2023); (iii) Rapid delta progradation model. The model hypothesized that the paleo-Pearl River shelf-edge delta propagated southeast since middle Miocene, a process that exerted control over the formation and migration of canyons (Huang et al., 2024). However, a set of deep-water sediments was identified above the Quaternary boundary, which exhibit continuous parallel seismic reflections with medium amplitude, suggesting that the paleo-canyons (before the Quaternary period) may have been buried and the current-canyons (after the Quaternary period) did not directly inherit the paleo-canyons, but may be instead newly developed above the deep-water sediments of the Quaternary period (Liu et al., 2016, 2019). In addition, the shape of the paleo-canyons was different from current-canyons, and the scale of the paleo-canyons was larger than the current-canyons (Huang et al., 2024). What is the formation mechanism of the Shenhu Canyon Group in the Quaternary period? Seismic data from the Shenhu Canyon Group indicated that the tectonic faulting ceased since the Quaternary period (Zhou et al., 2015; Li et al., 2023). Thus, the tectonic faulting model is not viable. The Shenhu Canyon Group in the Quaternary period are vertically superimposed on the paleo-canyons, and no characteristics of lateral migration have been found (Zhou et al., 2015). Thus, the contour current model is also untenable. Furthermore, During the Quaternary period, the Pearl River Delta is far from the Shenhu area (Huang et al., 2024). Therefore, the role played by rapid delta progradation model is also extremely limited.
Gas hydrates are ice-like compounds that form under low-temperature and high-pressure conditions in subsurface sediments, typically distributed at water depth of >300 meters below sea level (mbsl) and depths of< 400 meters below seafloor (mbsf) along continental margins (Shipley et al., 1979; Sloan and Koh, 2007; Hornbach et al., 2008; Sun et al., 2018; Jin et al., 2022; Liu et al., 2022; Zhao et al., 2023b). The zone within sub-seafloor sediments where gas hydrates are stable is known as Gas Hydrate Stability Zone (GHSZ) (Riboulot et al., 2018; Wang et al., 2021a). The Base of the Gas Hydrate Stability Zone (BGHSZ) is often visible in seismic data as a Bottom Simulating Reflection (BSR) (Yang et al., 2021). Gas hydrate formation relies on factors such as the availability of low molecular weight gas and water, pore-size distribution, pore-water salinity, geothermal gradient and seafloor temperature (Dickens and Quinby-Hunt, 1997; Moridis and Collett, 2003). Hydrate dissociation may occur in response to hydrostatic pressure reduction caused by sea-level decrease and deglaciation (Maslin et al., 2004; Tong et al., 2013), bottom water temperature (BWT) increase by ocean warming (Mienert et al., 2005; Marín-Moreno et al., 2013; Li et al., 2024) or salinity increase (Riboulot et al., 2018). Changes in geothermal gradient and localised rise of warm fluids may also be a factor in dissociating hydrate (Wang et al., 2021a). Gas hydrate dissociation is known to trigger methane leakage, which can increase pore pressure within sediment layers and destabilize the slope, ultimately resulting in slope failures (Sultan et al., 2004; Mienert et al., 2005; Nixon and Grozic, 2006, 2007). Large slope failures along the side of canyons can destroy gas hydrates, leading to methane leakage (Davies et al., 2012). However, the relationship between methane seepage induced by gas hydrate decomposition and the formation of submarine canyons in the Shenhu area during the Quaternary remains unclear.
Since 1999, China has been carrying out gas hydrates investigations in the northern SCS (Liu et al., 2021; Su et al., 2016; Wu et al., 2011; Zhang et al., 2014; Zhang et al., 2007, 2020a, 2020b). In the Shenhu area, gas hydrate samples were also recovered in the Shenhu Canyon Group (Su et al., 2016; Wu et al., 2011; Zhang et al., 2007, 2020a, 2020b), which may be important for investigating relationship between the evolution of gas hydrate and formation of Shenhu Canyon Group. In this study, seismic and well data are utilized to identify BSRs, free gas, seafloor pockmarks and pale-pockmarks, gas chimneys, turbidite deposits, Mass Transport Deposits (MTDs), slumps, and paleo- canyons, among others. The results obtained from the seismic and well data are further employed to calculate the GHSZ using the Miles (1995) method. Additionally, these results are used to analyze the impact of sea-level and BWT changes on the thickness of the GHSZ during the Quaternary. By integrating seismic interpretation, this study aims to explore the potential relationship between the reduction in GHSZ thickness, methane seepage, and the formation of submarine canyons. Our results can provide more constrains on the past and future evolution of Shenhu Canyon Group and submarine canyons in other regions of the world.
The study area is located in the deepwater area of the PRMB in the northern SCS (Figure 1A). The SCS is the largest marginal sea along the western Pacific and formed as a consequence of multi-phases of continental rifting along the margin of the South China Block from the Late Cretaceous to Paleocene (Holloway, 1982; Briais et al., 1993; Hayes and Nissen, 2005; Ding et al., 2018, 2020). During the Cenozoic era, the SCS underwent various tectonic events, including continental break-up, seafloor spreading, subduction along the Manila Trench, and uplift of the Taiwan Island, accompanying the formation of several sedimentary basins (Yao, 1996; Mi et al., 2018; Zhao et al., 2023a) (Figure 1A).
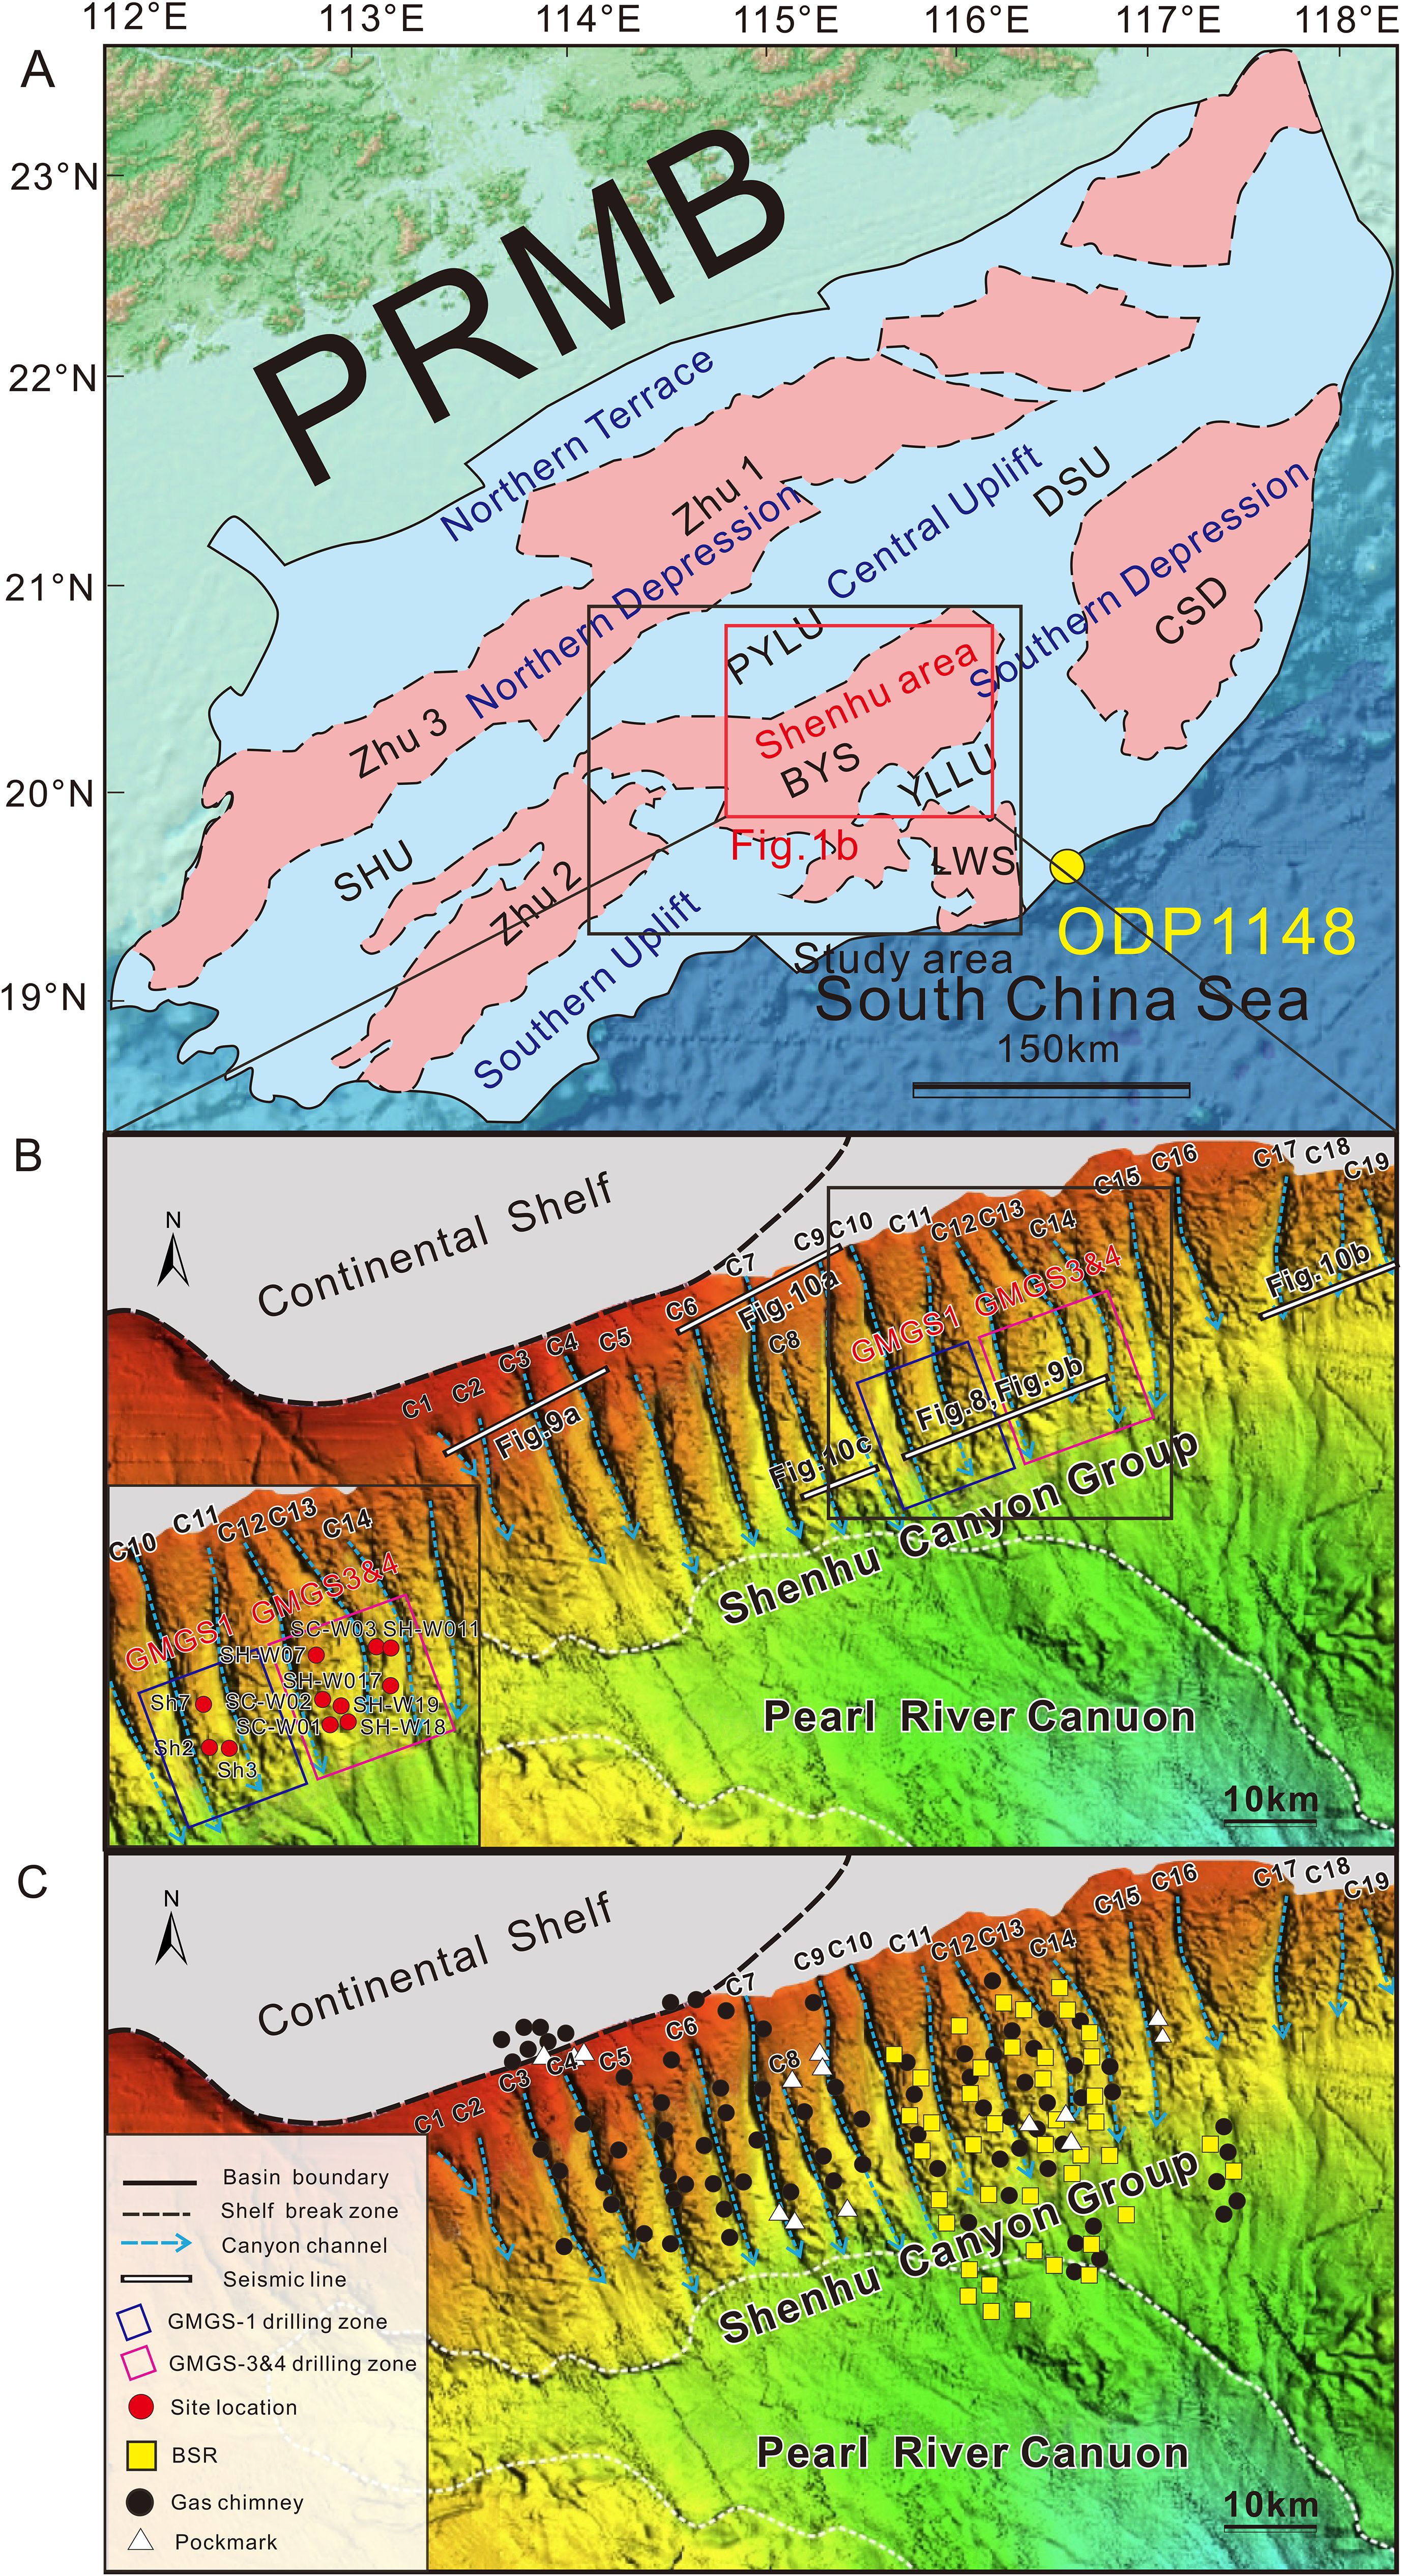
Figure 1. (A) Location and tectonic units of the Pearl River Mouth Basin (PRMB) of the northern South China Sea (SCS) [modified from (Xie et al., 2014)]; the black box is study area; (B) Multi-beam geomorphologic map of the Shenhu Canyon Group [modified from (He et al., 2022)]; the red box around Shenhu area (in a) is the zoom map on Shenhu Canyon Group provided in (B); The gas hydrate drilling areas of GMGS 1(blue rectangle) and GMGS 3 &4 (pink rectangle) are located in the Shenhu Canyon Group. The main drilling and coring sites are located at the canyon ridges (Zhang et al., 2007; Yang et al., 2008, 2015; Yang et al., 2017b). (C) Distribution of bottom simulating reflections (BSRs) (yellow square), gas chimneys (black dots), and pockmarks (white triangle) in the Shenhu Canyon Group (Chen et al., 2013, 2016; Yang et al., 2017a; Zhang et al., 2017; Yan et al., 2018; Sun et al., 2020; Jin et al., 2022). Zhu 1, Zhu 2, and Zhu 3 are depressions; CSD, Chaoshan Depression; SHU, Shenhu Uplift; PYLU, Panyu Low Uplift; DSU, Dongsha Uplift; BYS, Baiyun Sag; LWS, Liwan Sag; YLLU, Yunli Low Uplift; GMGS, Guangzhou Marine Geologic Survey.
The PRMB lies in the northern continental margin of the SCS, with a total area of 200,000 km2 (Figure 1A). The basin consists of two depression zones separated by three uplift zones. From north to south, these zones include the northern terrace, the northern depression zone (comprising the Zhu 3 and Zhu 1 depressions), the central uplift zone [comprising the Shenhu Uplift (SHU), Panyu Low Uplift (PYLU), and Dongsha Uplifts (DSU)], the southern depression zone [comprising the Zhu 2 and Chaoshan depressions (CSD)], and the southern uplift zone along the margin of the South China Sea Basin (SCSB) (Xie et al., 2014; Mao et al., 2020) (Figure 1A). The formation of the PRMB involved a syn-rift stage during the Eocene epoch (approximately 65 Ma to 32 Ma), followed by a phase of continental breakup in the Oligocene epoch (32 Ma to 23.8 Ma), and concluded with a final post-rift subsidence stage that has persisted since the Miocene epoch (23.8 Ma to the present) (Clift and Lin, 2001; Pang et al., 2008). At 23.8 Ma, a significant tectonic event known as the Baiyun Event occurred, which caused the shelf break zone to shift northward from the southern Baiyun Depression to the PYLU (Pang et al., 2009; Liu et al., 2011). This event also triggered a large-scale transgression in the northern SCS (Pang et al., 2009; Liu et al., 2011). Consequently, the Baiyun sag (BYS), the largest sag in the PRMB, transformed from a shelf environment to its current deep-water slope setting (Figure 1A).
The BYS is located in the southern PRMB (Zhou et al., 2009; Zhu et al., 2023) (Figure 1A), and appears as NE-trending depression covering an area of over 20,000 km2 (Xie et al., 2014). It is surrounded by the PYLU to the north, the Yunli Low Uplift (YLLU) to the south, the SHU to the west, and the DSU to the east (Xie et al., 2014) (Figure 1A). Numerous submarine canyons exhibiting characteristics of unidirectional migration have developed along the slope of the northern BYS (Gong et al., 2013; Li et al., 2023) (Figure 1B). Furthermore, the BYS is rich in hydrocarbon resources, such as gas hydrate (Yang et al., 2008, 2015, 2017a) (Figure 1B). The Wenchang (47.8 to 38 Ma) and Enping formations (38 to 33.9 Ma) serve as the main source rocks characterized by high maturity, which can yield huge amounts of deep thermogenic gas (He et al., 2013; Wang et al., 2018). The Zhujiang (23 to 16 Ma) and Hanjiang formations (16 to 10 Ma) with relatively lower maturity primarily generated biogenic gas (He et al., 2013; Mi, 2018; Wang et al., 2018).
The Shenhu Canyon Group is situated to the north of the BYS (Shenhu area), oriented in NNW-SSE direction (Figures 1A, B). The water depths in the Shenhu area range from 500 to 1000 meters, covering an approximate area of 400 km2 (Ding et al., 2013).It consists of 19 canyons, labeled as C1 to C19 from west to east along the slope region, which are positioned perpendicular to the continental slope (Li et al., 2023) (Figure 1B). The heads of these canyons are confined within the upper continental slope, south of the continental shelf with a width of 236 km (Huang et al., 1995). To the south, the Shenhu Canyon Group intersects with the EW trended Pearl River Canyon, which serves as one of the primary conduits for sediment sourced from onshore areas into deep-water basins (Ding et al., 2013) (Figure 1B).
The BYS in the PRMB has been identified as a hydrocarbon-rich basin (Yang et al., 2008; Wang et al., 2011) (Figure 1A). Three drilling expeditions have been conducted by the Guangzhou Marine Geologic Survey (GMGS-1, -3, and -4) at the Shenhu Canyon Group (Figure 1B). The gas hydrates, investigated during the GMGS-1 drilling expedition in 2007, were sampled at three sites located between C10 and C11 canyons (encompassing sites SH2, SH3, and SH7) (Zhang et al., 2007; Yang et al., 2008) (Figure 1C). The GMGS-3 and GMGS-4 expeditions, conducted in 2015 and 2016 respectively, focused in particular in the adjacent region spanning from C12 to C14 canyons. The gas hydrates were sampled at 8 sites (including SC-W01, SC-W02, SC-W03, SH-W07, SH-W11, SH-W17, SH-W18, and SH-W19) (Yang et al., 2015; Yang et al., 2017b) (Figure 1B).
The occurrence of BSR is a significant indicator of the presence of gas hydrate (Shedd et al., 2012; Wang et al., 2014). In the Shenhu Canyon Group, previous studies have revealed plenty of BSRs (Chen et al., 2016; Zhang et al., 2017, 2020a; Wang et al., 2021a; He et al., 2022), which are primarily distributed along canyon ridges between canyons C10-C14 and at the toe of canyon C10-C16 (Figure 1C). BSRs have been identified within both Pliocene layer and Quaternary layers (He et al., 2022) (Figure 1C). However, the presence of BSRs may not guarantee the existence of gas hydrate, as it can also arise from free gas-bearing sediments situated beneath an impermeable layer. Therefore, the identification of BSRs using seismic data must be corroborated with drilling well data to determine the presence of gas hydrate (Yang et al., 2015; Zhang et al., 2020a). Gas chimneys serve as significant pathway for the migration of deep gas to shallower GHSZ, which can provide an adequate gas source for the formation of gas hydrates (He et al., 2022) (Figure 1C). BSRs are generally recognized at top of gas chimneys (Zhang et al., 2020b; He et al., 2022). Pockmarks are seafloor notches typically formed by the release of methane gas from subsurface strata through migration channels (Mazzini et al., 2017). The formation of pockmarks is often associated with active fluid overpressure activities, particularly in gas hydrate-rich slope environments (Mazzini et al., 2017). The overpressure fluids that lead to the formation of pockmarks generally originate from the decomposition of gas hydrates (Mazzini et al., 2017). Consequently, pockmarks on the seafloor serve as significant indicators of the decomposition of gas hydrates (Figure 1C).
2-D and 3-D multi-channel seismic data were acquired by China National Offshore Oil Company (CNOOC) between 2009 and 2010, utilizing a grid of multi-channel seismic lines with spacing of 1 km between the lines, several 3D seismic patches, and data from 20 wells in the study area. A total of 19 third-order sequence boundaries, including the seabed, were identified, and the depths of these boundaries were determined through time-depth conversion using velocity spectrum analysis (Xie et al., 2014) (Figures 2A, D). In addition, well data made by GMGS are also used in this study, including resistivity, total drilling depth (mbsf), and depth of BSR (mbsf) and so on (Su et al., 2016; Zhang et al., 2020a; Song et al., 2022a).
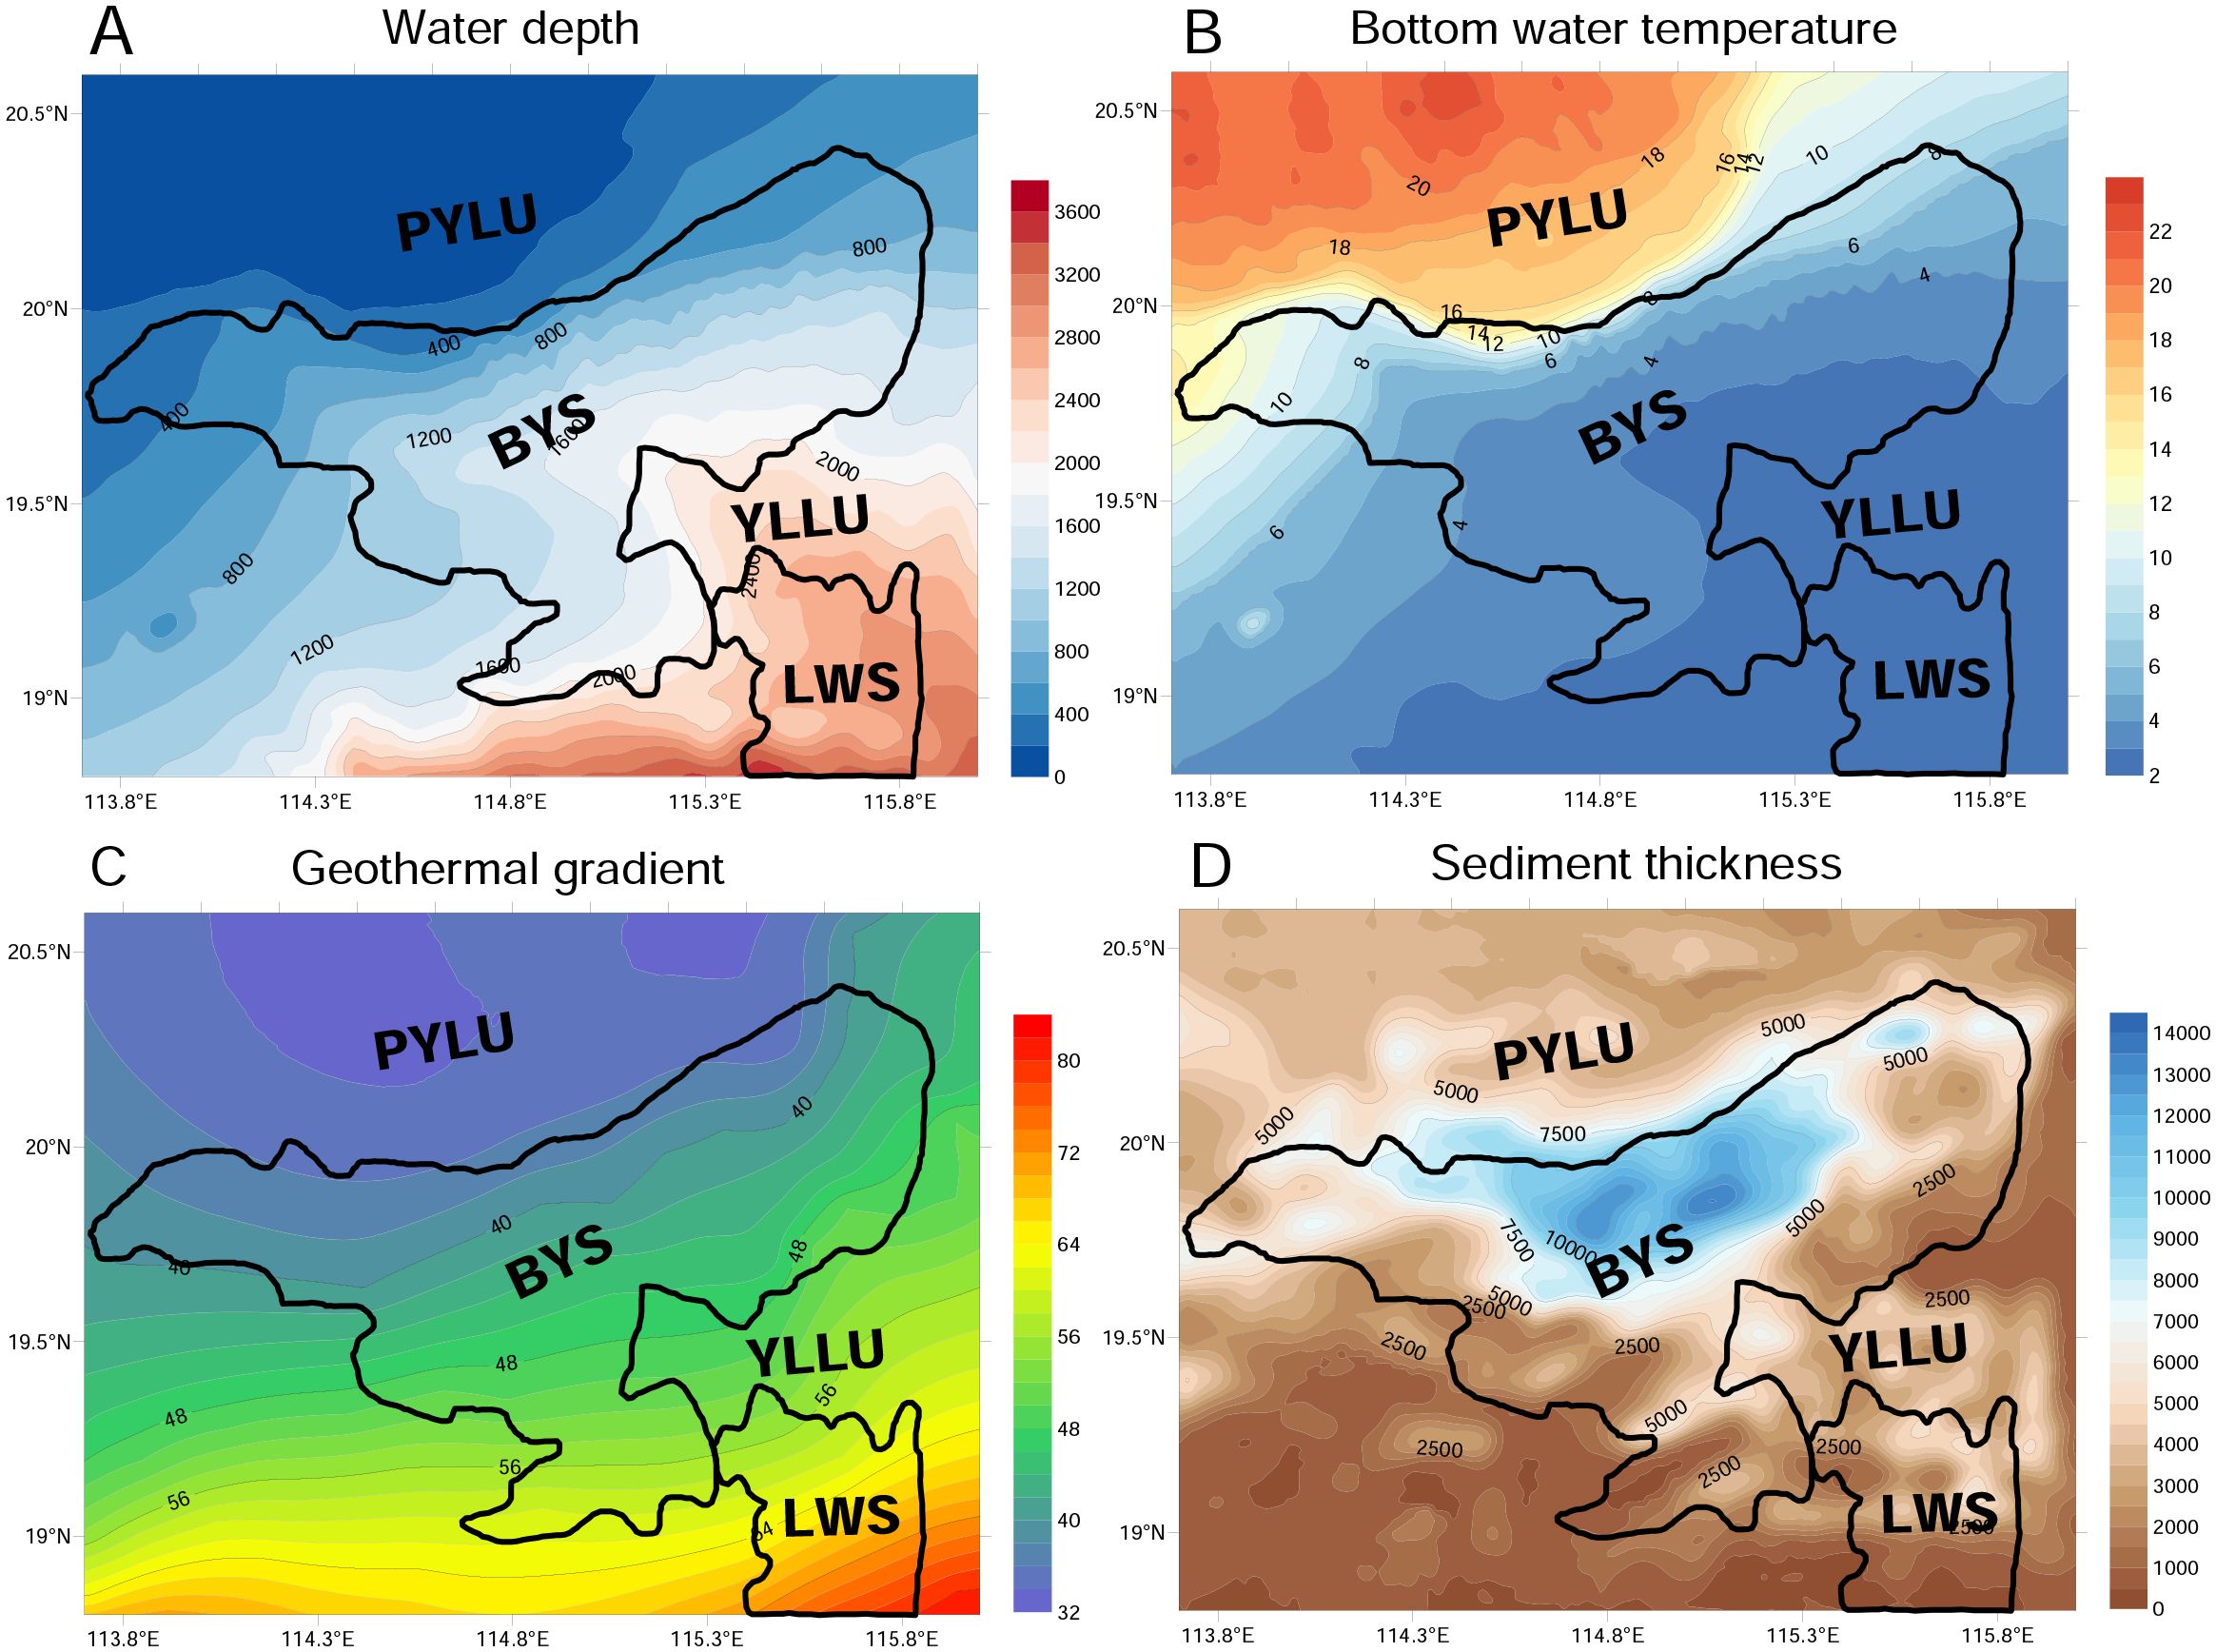
Figure 2. The contour maps of (A) water depth in m; (B) bottom water temperature (BWT) in °C (Chen et al., 2016; Yang et al., 2018); (C) geothermal gradient in °C/km (Mi, 2018); (D) sediment thickness in m (Xie et al., 2014).
A total of 158 BWT data in the SCS were measured using Heat Flow Probe (HFB), Conductivity-Temperature-Depth Profiler (CTD) and the Miniaturized Temperature Unit (MTU) mounted on the Ocean Bottom Seismometer (OBS), Sediments Box Core (SBC), Sediments Trap (ST), and Remotely Operated Vehicles (ROV) (Yang et al., 2018). The temperature measurement accuracy can reach 0.05 °C (Yang et al., 2018). Subsequently, the BWT data in the study area is computed by using an empirical relationship between BWT and water depth based on the 158 sets of BWT data with the application of the least square method (Yang et al., 2018) (Figure 2B). Geothermal gradient data are derived from previous studies combined with 108 drilling data in the BYS (Mi, 2018; Huang et al., 2022) (Figure 2C).
Gas hydrates are stable under conditions of low temperatures and high pressure. To calculate the GHSZ thickness (Miles, 1995), several input parameters are essential. These include water depth, sediment thickness, BWT, and geothermal gradient (Miles, 1995), which has been successfully applied to the neighboring Qiongdongnan Basin (Zhao et al., 2023b) and Dongsha area (Song et al., 2022b). Empirically, a fourth-order polynomial formula is utilized to determine the thickness of GHSZ with a pore-water salinity of 35 wt% and gas source can be assumed to be entire biogenic methane (Miles, 1995),
where a=l.559474×10-1; b=4.8275×10⁻²; c=-2.78083×10⁻³ and d=l.5922×10-4. Pb is the theoretical sediment hydrostatic pressure in MPa, indicating the minimum pressure at which gas and water are combined to form gas hydrates at temperature T in °C.
Sediment temperature is,
where Tz (°C) is the sediment temperature at depth z (meters below sea floor). is the geothermal gradient. T0 is the BWT.
The sediment hydrostatic pressure (MPa) is,
where Ps is the pressure in sediment, D = z0+z; z is sediment depth below seafloor in m; z0 is the water depth (m); C1=(5.92 + 5.25*sin2(Lat))×10-3; Lat is the latitude (in degrees); C2 = 2.21×10⁻⁶. Transform Equation 2 into Equation 3, then,
which is the sediment hydrostatic pressure-temperature relationship within the sediment in the same units as in (1). By equating Equations 1, 4, the sediment temperature Tz is calculated. Using Equation 2, we obtain the sediment depth z, which represents the thickness of GHSZ. The sediments are assumed to be isotropic here.
Subsequently, we can calculate the variations of GHSZ thickness during the Quaternary. Sea level fluctuation and BWT variation since 2.5 Ma in the study area are derived from the ODP Site 1148 (Bates et al., 2014) (Figure 1A). The sea level fluctuation in the study area since Quaternary is assumed to be equivalent to the change of water depth because of only 0-10 m tectonic subsidence occurred since Quaternary in the study area (Zhao et al., 2011; Xie et al., 2014). We also assume that the whole study area has the same BWT variation as the ODP site 1148 because our study area is relatively adjacent to this site. The sediment thickness variations since 2.5 Ma are reconstructed based on a sedimentation rate of 9.8 cm/ka at the LW3-1 well from the Pliocene to the Quaternary (Sun et al., 2022; Xie et al., 2021). Based on these data, the thickness variations of GHSZ in the whole study area since 2.5 Ma were calculated (Figure 3).
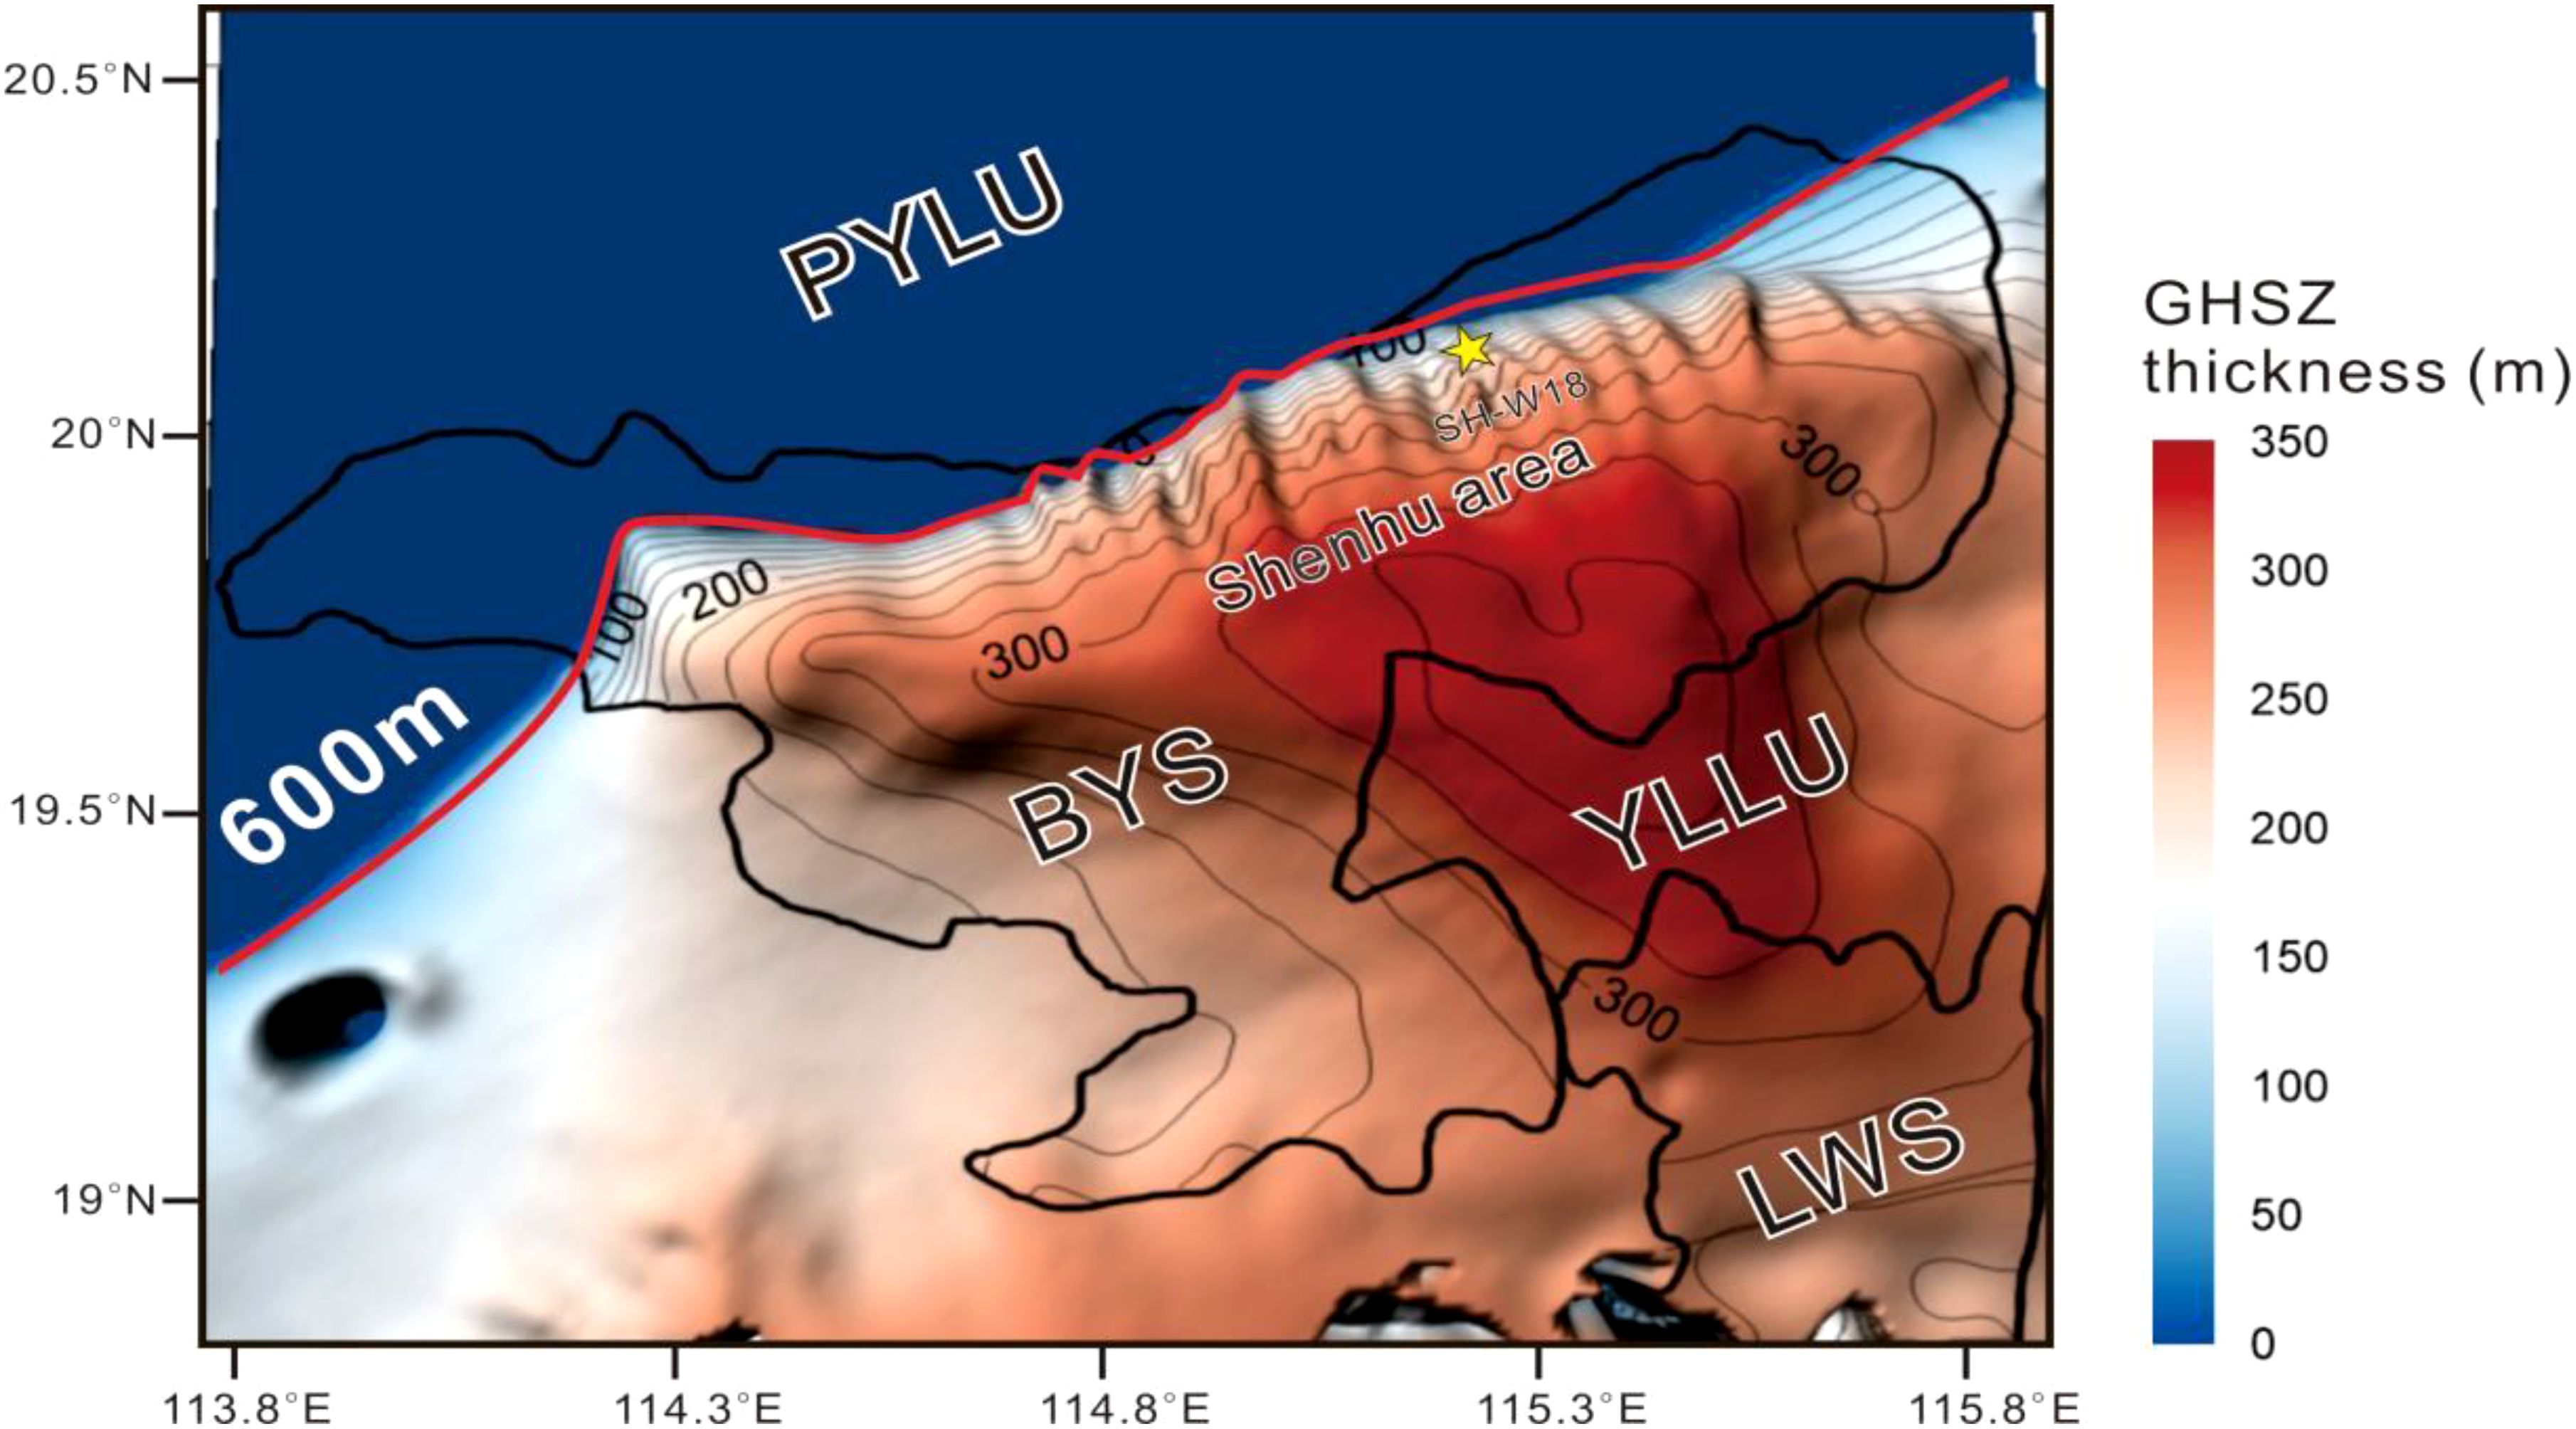
Figure 3. The contour map of present GHSZ thickness. Red line indicates a water depth of 600m and yellow star is the drilling well SH-W18.
The thickness of the present GHSZ calculated by using water depth, BWT, geothermal gradient and sediment thickness parameters is approximately 0 m at a water depth of 600 m, to the north of the BYS. Subsequently, it gradually increases, reaching a maximum thickness of 350 m in the YLLU. After that, the GHSZ thickness thins once more in the Liwan Sag (LWS) (Figure 3). Generally, the GHSZ of > 300-m-thick is mainly situated in the south of Shenhu, the southern BYS, the YLLU and the northern LWS (Figure 3).
The drilling well SH-W18 is located in the Shenhu area at a water depth of 1288 m below sea level (mbsl) where BWT is 4.84°C (Figure 3). The thickness of present GHSZ calculated using the Miles (1995) method is 161 m at drilling well SH-W18. On the basis of ODP site 1148, the reconstructed sea level and BWT variation since 2.5 Ma at well SH-W18 (Figure 4) shows that sea level rises or falls are synchronously with the changes of BWT (Figure 4A). However, the variation of sea level and BWT have opposite effects on the GHSZ thickness. As BWT decreases, GHSZ thickness increases, whereas as sea level drops, GHSZ thickness decreases. Due to differences in the magnitude of sea level and BWT changes since 2.5 Ma (Figure 4A), reduction in the GHSZ thickness is mainly controlled by three patterns of the variation of the sea level fluctuations and BWT (Figure 4). During the stage from 2.5 to 0.9 Ma, the reduction in GHSZ thickness was characterized by a slight rise in sea level and a rapid increase in the BWT (Figure 4A). The variation trend of GHSZ thickness caused by BWT change alone with the sea level staying constant at 2.5Ma extremely consistent with that caused by the combined changes of BWT and sea level, and the error is generally within 5m (Figure 4C). However, the variation trend of GHSZ thickness caused by sea level change alone with the BWT staying constant at 2.5Ma is significantly different from that caused by the combined changes of BWT and sea level (Figure 4C). During the stage from 0.9 to 0.02 Ma, the reduction in GHSZ thickness was characterized by a rapid drop in sea level and a slight decline in the BWT (Figure 4A). Compared with the variation trend of GHSZ thickness caused by BWT change alone with the sea level staying constant at 2.5Ma, the variation trend of GHSZ thickness caused by sea level change alone with the BWT staying constant at 2.5Ma is more consistent with the variation trend caused by the combined changes of BWT and sea level, and the error is generally within 5m (Figure 4C). During the stage from 0.02 to 0 Ma, the reduction in GHSZ thickness was characterized by a rapid increase both in the sea level and BWT (Figure 4A). The variation trend of the GHSZ thickness caused either by the sole change in BWT or by the sole change in sea level is significantly different from that caused by the combined changes of both (Figure 4C). Consequently, we selected three periods 2.27-2.26 Ma (increase by 3 m in sea level and 2°C in the BWT), 0.31-0.14 Ma (decrease by 100 m in sea level and 0.5°C in the BWT) and 0.02-0 Ma (increase by 120 m in sea level and 2.6°C in the BWT) (referred to as patterns 1 to 3 here) representing the most significant changes among the three stages to analyze how the GHSZ reduction distribute across the whole study area (Figures 5–7).
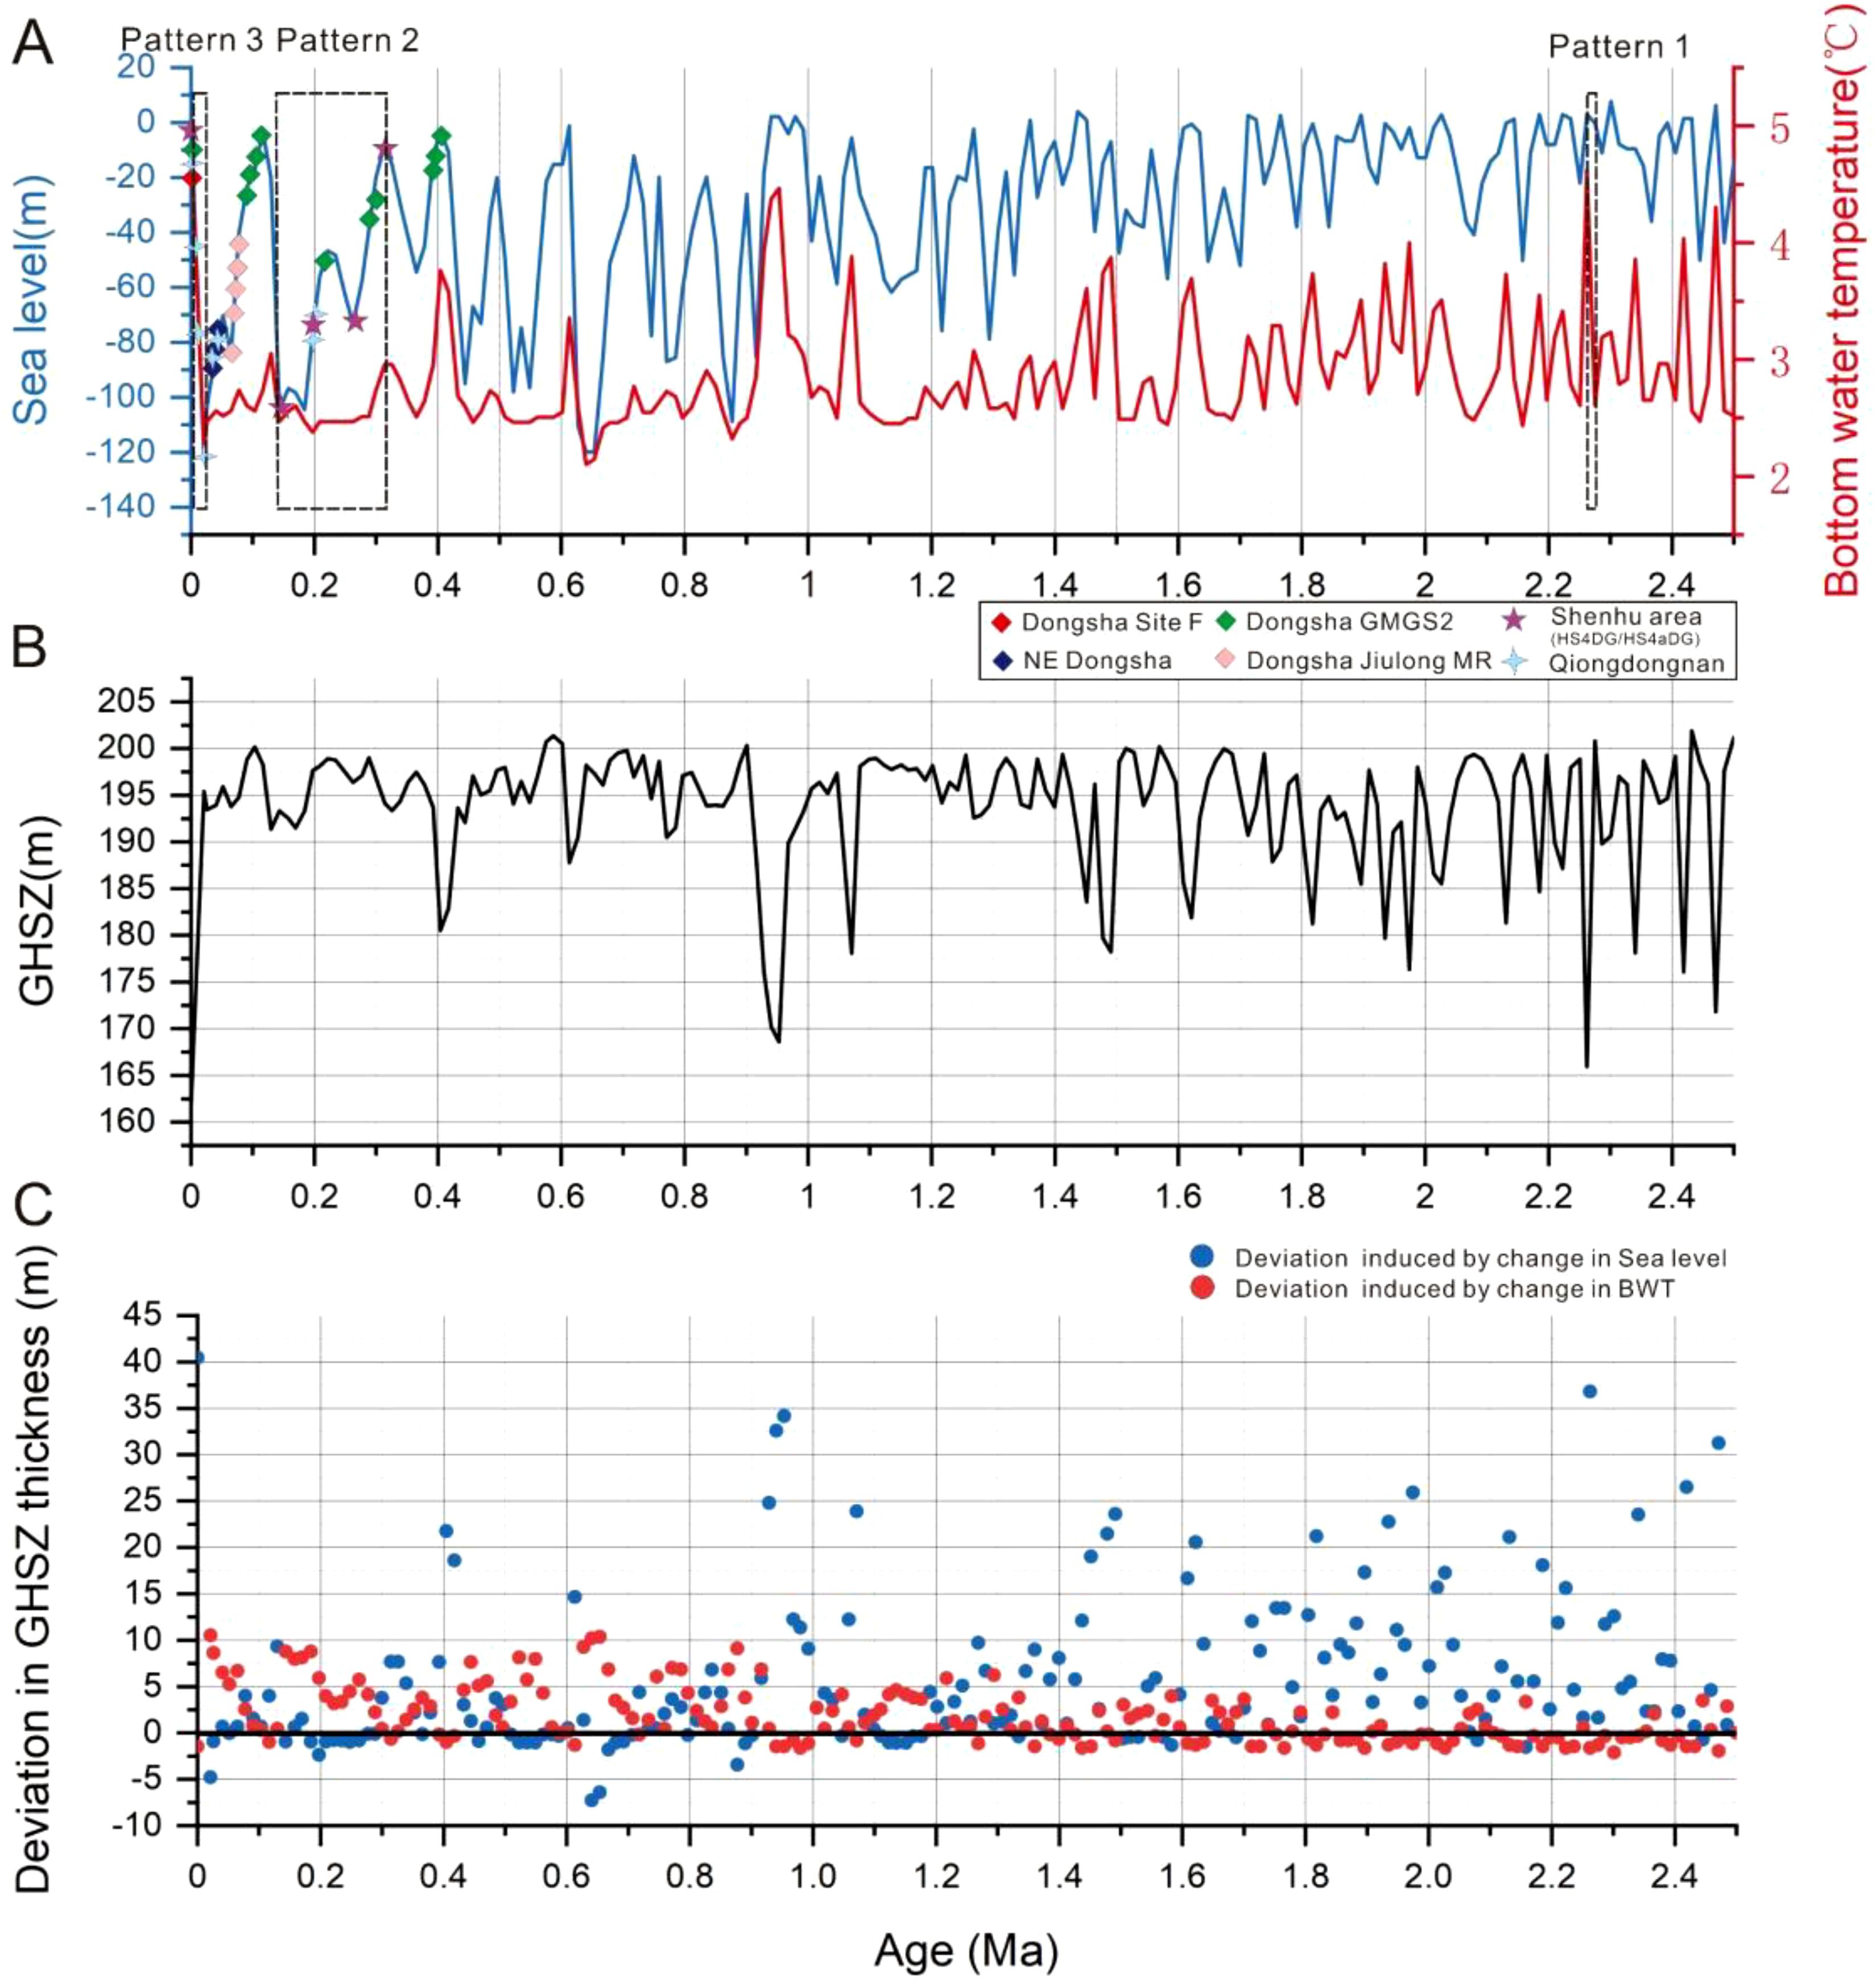
Figure 4. (A) Overlapped diagram of U/Th and 14C dating of seep carbonates (Tong et al., 2013), sea level fluctuation and BWT at well SH-W18 is restored on basis of ODP Site 1148 (Bates et al., 2014; Chen et al., 2016); seep carbonates are distributed in Dongsha area (diamonds), Shenhu area (purple stars) and Qiongdongnan basin (blue stars), northern SCS; (B) The GHSZ thickness variations since 2.5 Ma at well SH-W18; black dashed rectangles indicate three representative patterns to reduce the GHSZ thickness, including 2.27-2.26 Ma as pattern 1 (Figure 5), 0.31-0.14 Ma as pattern 2 (Figure 6) and 0.02-0 Ma as pattern 3 (Figure 7); (C) The diagram of the deviation in GHSZ thickness calculated based on sea level fluctuation and/or BWT change. Blue dots indicate the deviation in GHSZ thickness between the thickness due to only changes in sea level and the thickness due to both changes in sea level and BWT; Red dots indicate the deviation in GHSZ thickness between the thickness due to only changes in BWT and the thickness due to both changes in sea level and BWT.
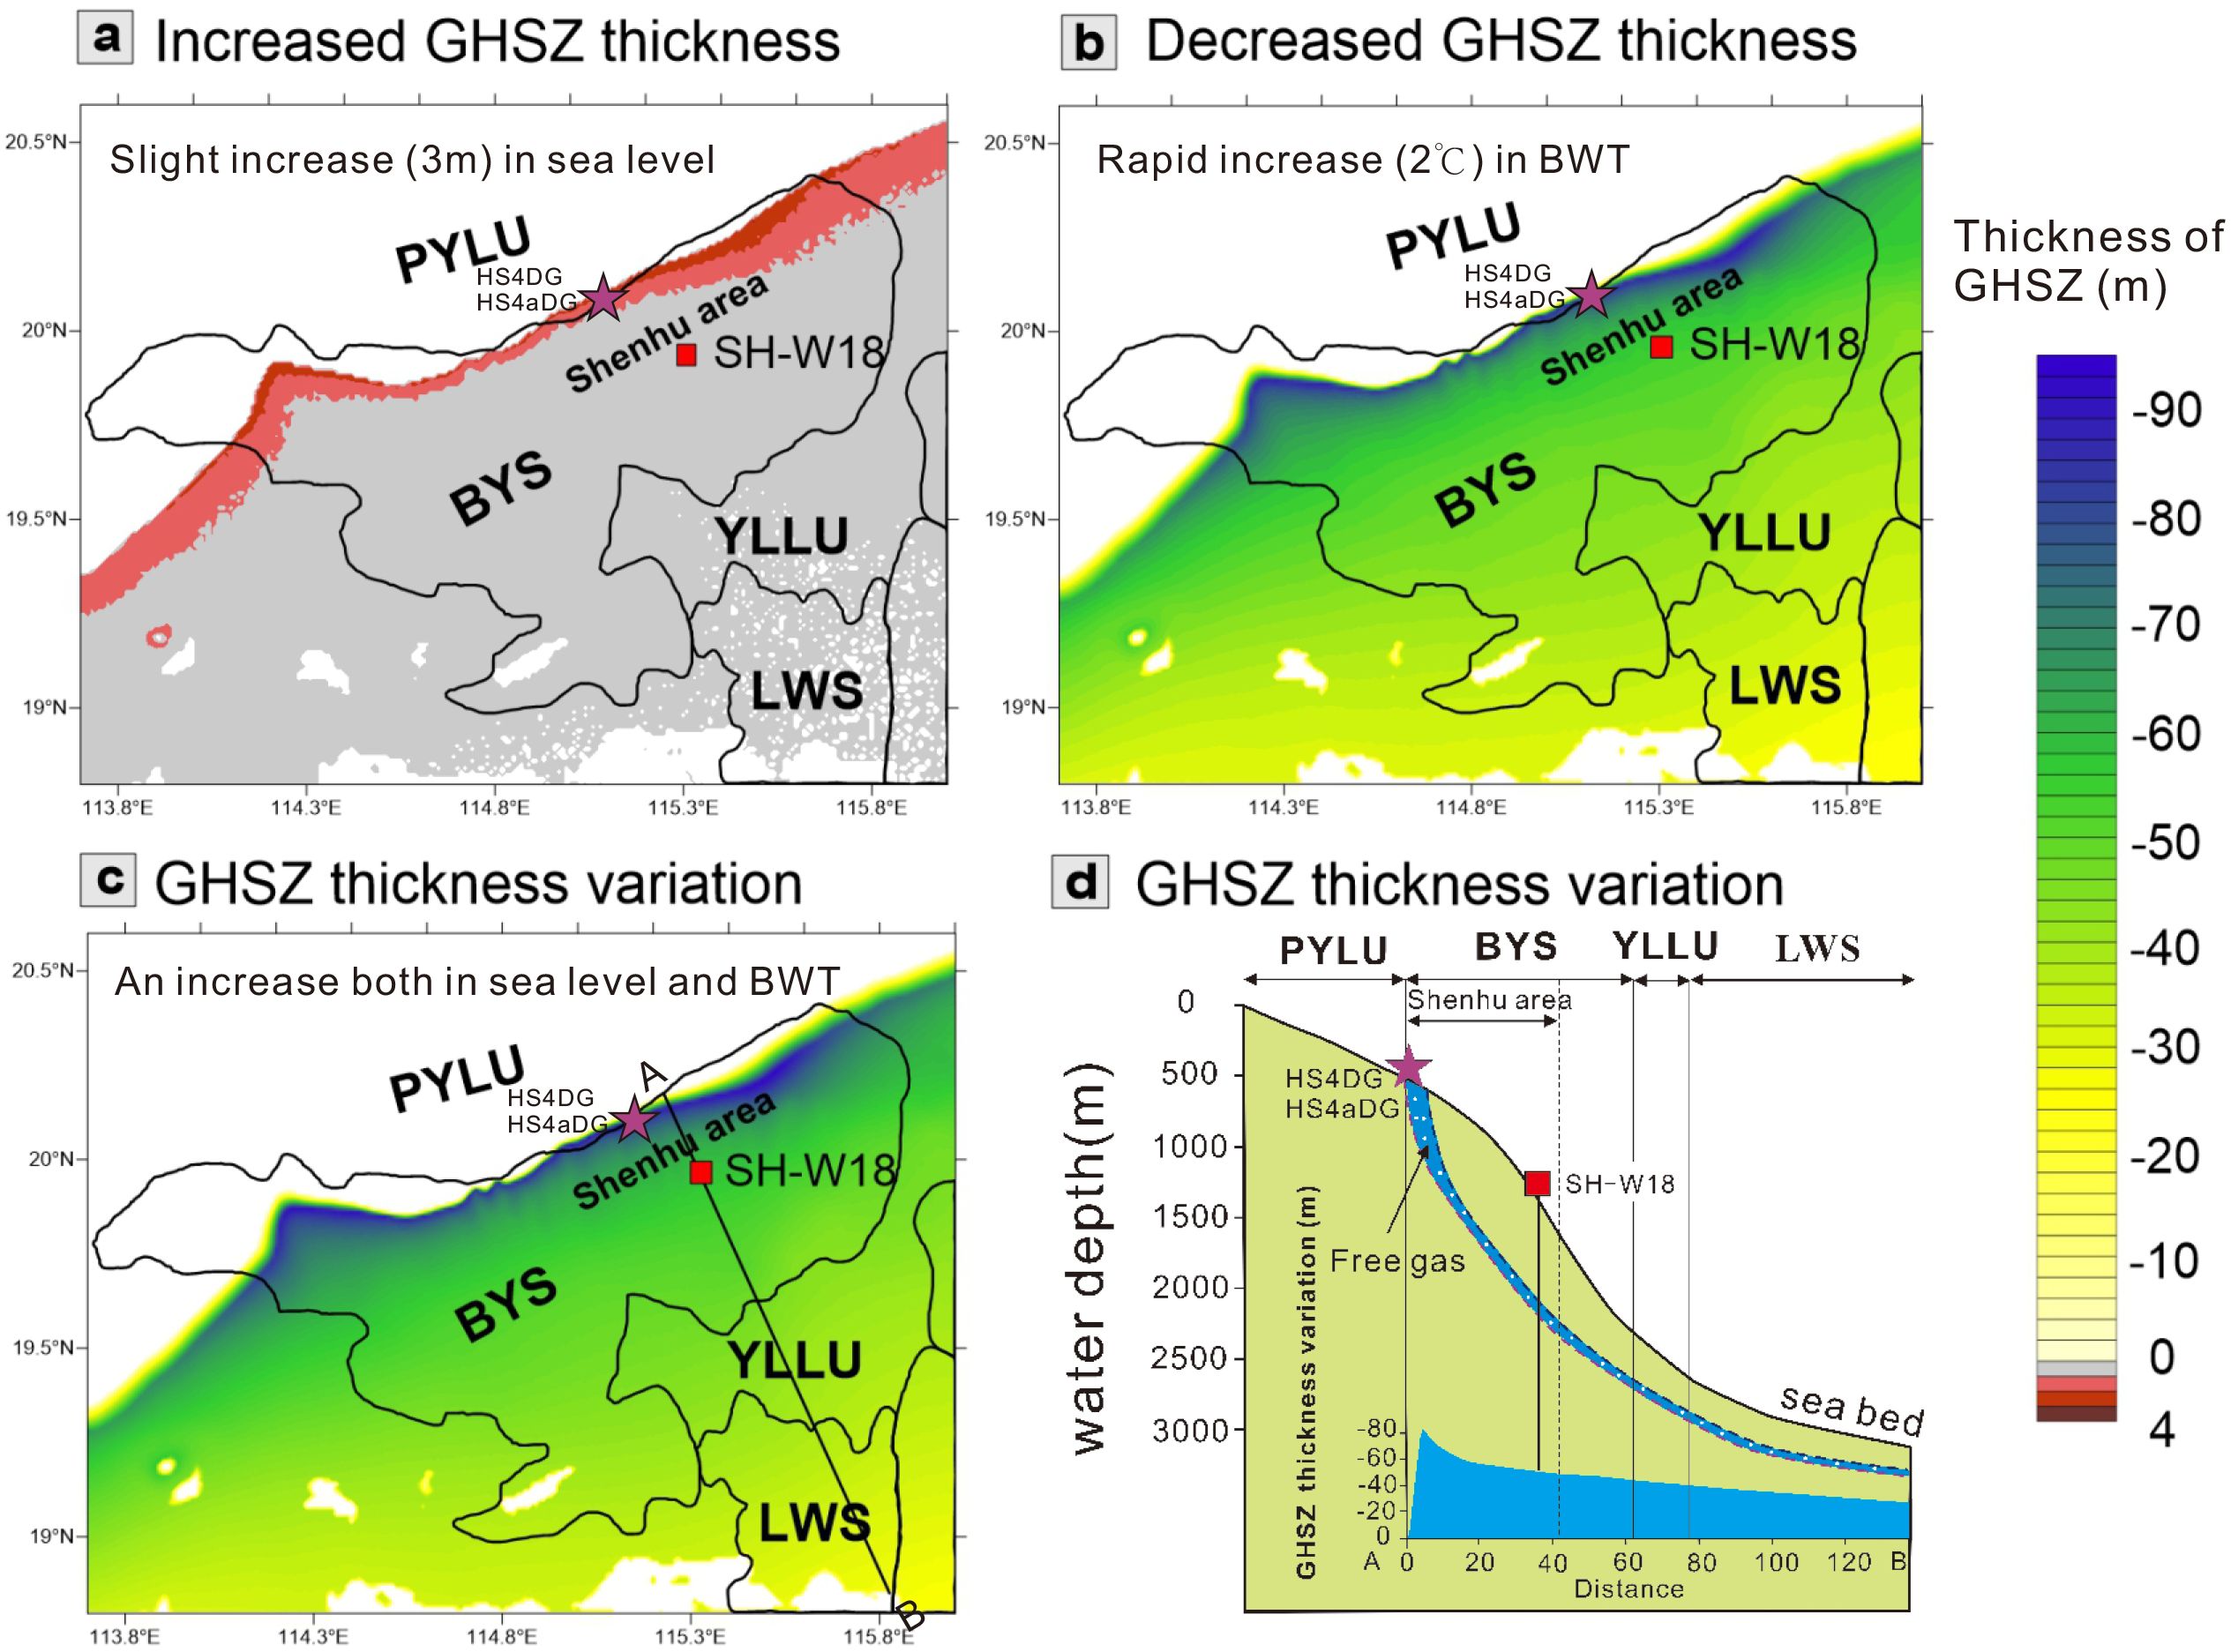
Figure 5. The GHSZ thickness variations in the pattern 1. (a) The increased GHSZ thickness due to slight rising sea level keeping the BWT unchanged; (b) The decreased GHSZ thickness due to rapid rising BWT keeping the sea level unchanged; (c) The GHSZ thickness variation due to both the synchronous rising sea level and BWT; (d) GHSZ thickness variation along the AB line (see location in Figure 5c). Red square indicates the location of well SH-W18; purple stars indicate the location of authigenic carbonates.
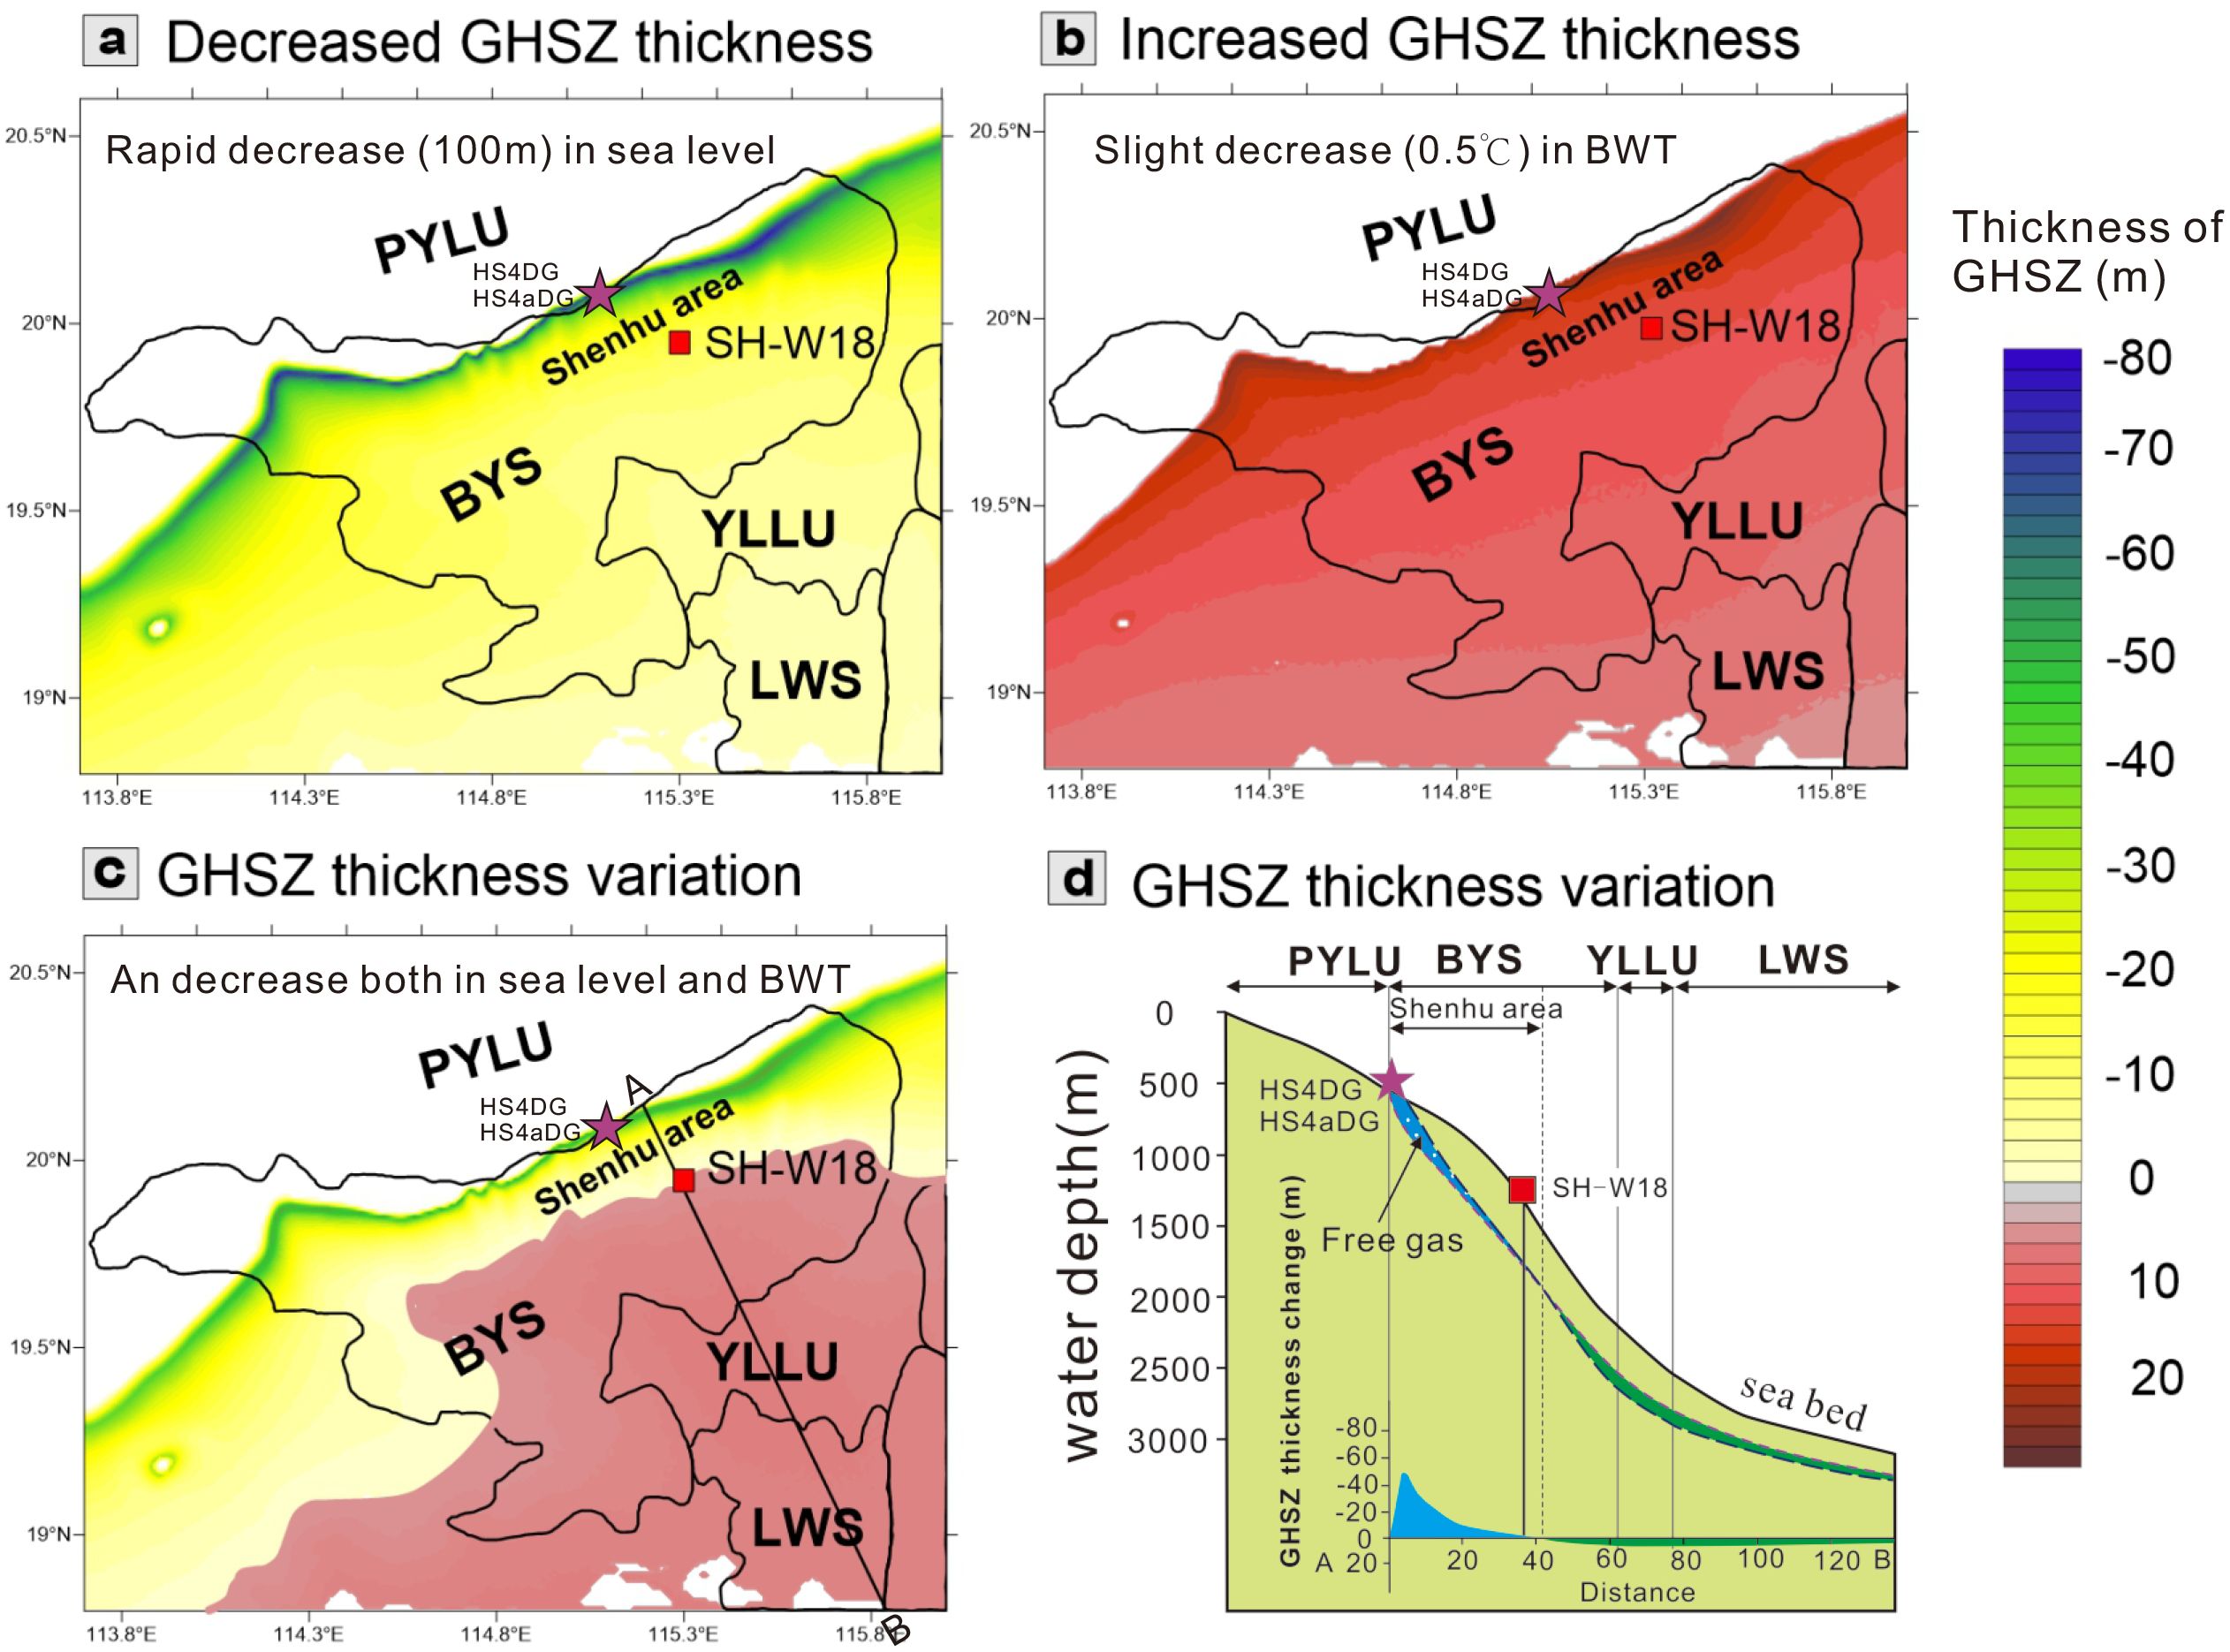
Figure 6. The GHSZ thickness variations in the pattern 2. (a) The decreased GHSZ thickness due to rapid falling sea level keeping the BWT unchanged; (b) The increased GHSZ thickness due to slight decreasing BWT keeping the sea level unchanged; (c) The GHSZ thickness variation due to both the synchronous falling sea level and BWT; (d) The GHSZ thickness variation along the AB line (see location in Figure 6c). Red square indicates the location of SH-W18; purple stars indicate the location of authigenic carbonates.
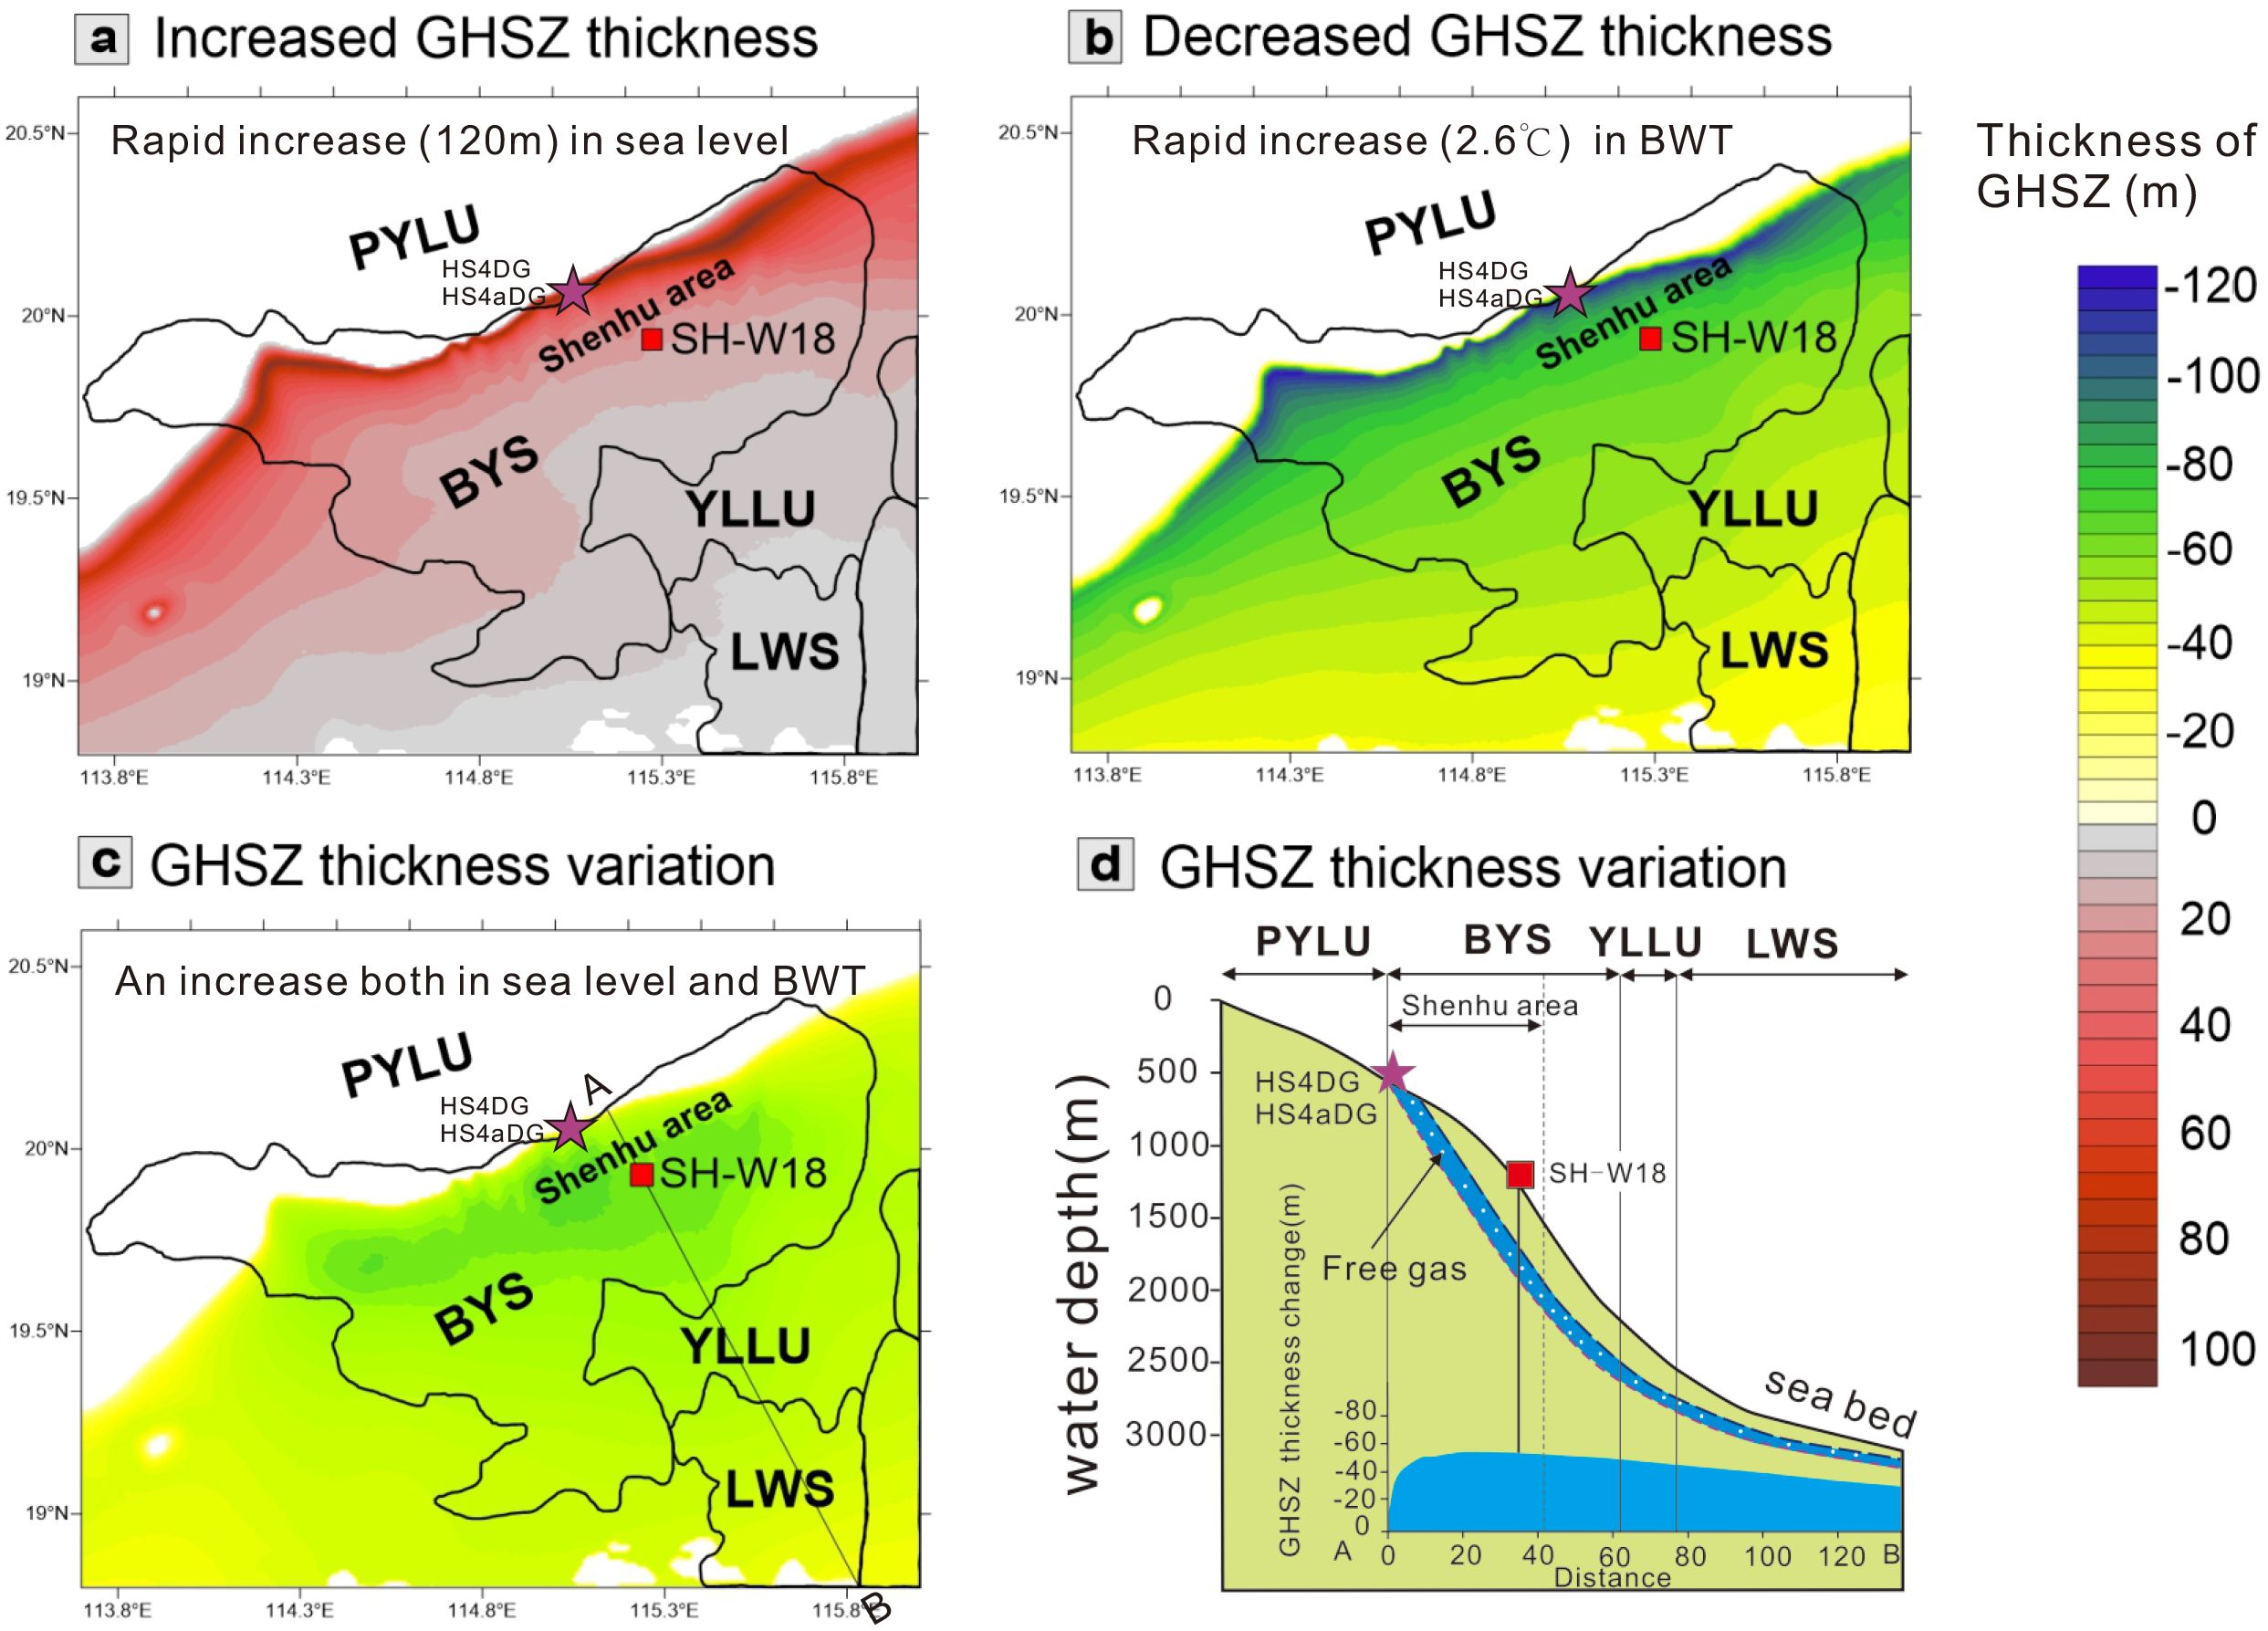
Figure 7. The GHSZ thickness variations in the pattern 3. (a) The increased GHSZ thickness due to rapid rising sea level keeping the BWT unchanged; (b) The decreased GHSZ thickness due to rapid rising BWT keeping the water depth unchanged; (c) The GHSZ thickness variation due to both the synchronous rising sea level and BWT; (d) GHSZ thickness variation along the AB line (see location in Figure 7c). Red square indicates the location of well SH-W18; purple stars indicate the location of authigenic carbonates.
In the pattern 1, the sea level rised by 3 m and the BWT increased by 2°C from 2.27 to 2.26 Ma in the study area (Figure 5). A slight rise in the sea level will thicken the GHSZ (Figure 5a), however, a rapid increase in BWT will reduce the GHSZ thickness (Figure 5b). A synchronous increase both in the sea level and BWT will reduce the GHSZ thickness (Figure 5c). Meanwhile, the maximum reduction in the GHSZ thickness occur in the relatively shallow water depth in the Shenhu area, and the least reduction in the GHSZ thickness occur in the relatively deep water depth in the LWS (Figures 5c, d).
In the pattern 2, the sea level dropped by about 100 m and the BWT decreased by 0.5°C from 0.31 to 0.14 Ma in the study area (Figure 6). The rapid drop in the sea level will reduce the GHSZ thickness (Figure 6a); however, the slight decrease in the BWT will increase the GHSZ thickness (Figure 6b). The synchronous decrease in both sea level and BWT will result in a GHSZ thickness reduction at relatively shallow water depths in the Shenhu area. However, it causes an increase in the GHSZ thickness at relatively deep water depths in the YLLU and LWS (Figures 6c, d).
In the pattern 3, the sea level rised by 120 m and the BWT increased by 2.6°C from 0.02 Ma to the present in the study area (Figure 7). The rapid rise in the sea level will thicken the GHSZ (Figure 7a); however, the rapid increase in the BWT will reduce the GHSZ thickness (Figure 7b). The synchronous increase of sea level and BWT will reduce the GHSZ thickness (Figures 7c, d). Along the AB line, the amount of decreased GHSZ thickness is more than 40 m at the relatively shallow water depth in the Shenhu area but decreased to 30 m at the relatively deep water depth in the LWS (Figures 7c, d).
In the Shenhu area, the seismic data show that the multi-stage canyon channels are superimposed on one another, characterized by migration from west to east (Figure 8). The drilling wells, which include Sh2, Sh3, Sh7, SC-W01, SC-W02, SH-W07, SH-W11, SH-W17, SH-W18 and SH-W19, are situated at the ridges of these canyons (Figures 1, 8D). Gas hydrates are recovered from these wells based on logging while drilling (LWD) and drilling operations during GMGS-1, -3 and -4 expedition (Figure 8D). BSRs have been recognized at the drilling wells Sh2, Sh3, SC-W01 and SH-W18 through seismic interpretation, exhibiting high amplitude reflections with opposite polarities and features of cutting the sedimentary strata (Figures 8A–C). Above the BSRs, a series of high-resistivity are interpreted as gas hydrates layers. In addition, enhanced reflections (ERs) are observed below the BSR, suggesting the accumulation of free gas. There are blank, chaotic reflections with low-amplitude below ERs, indicating the presence of gas chimneys (Figure 8A).
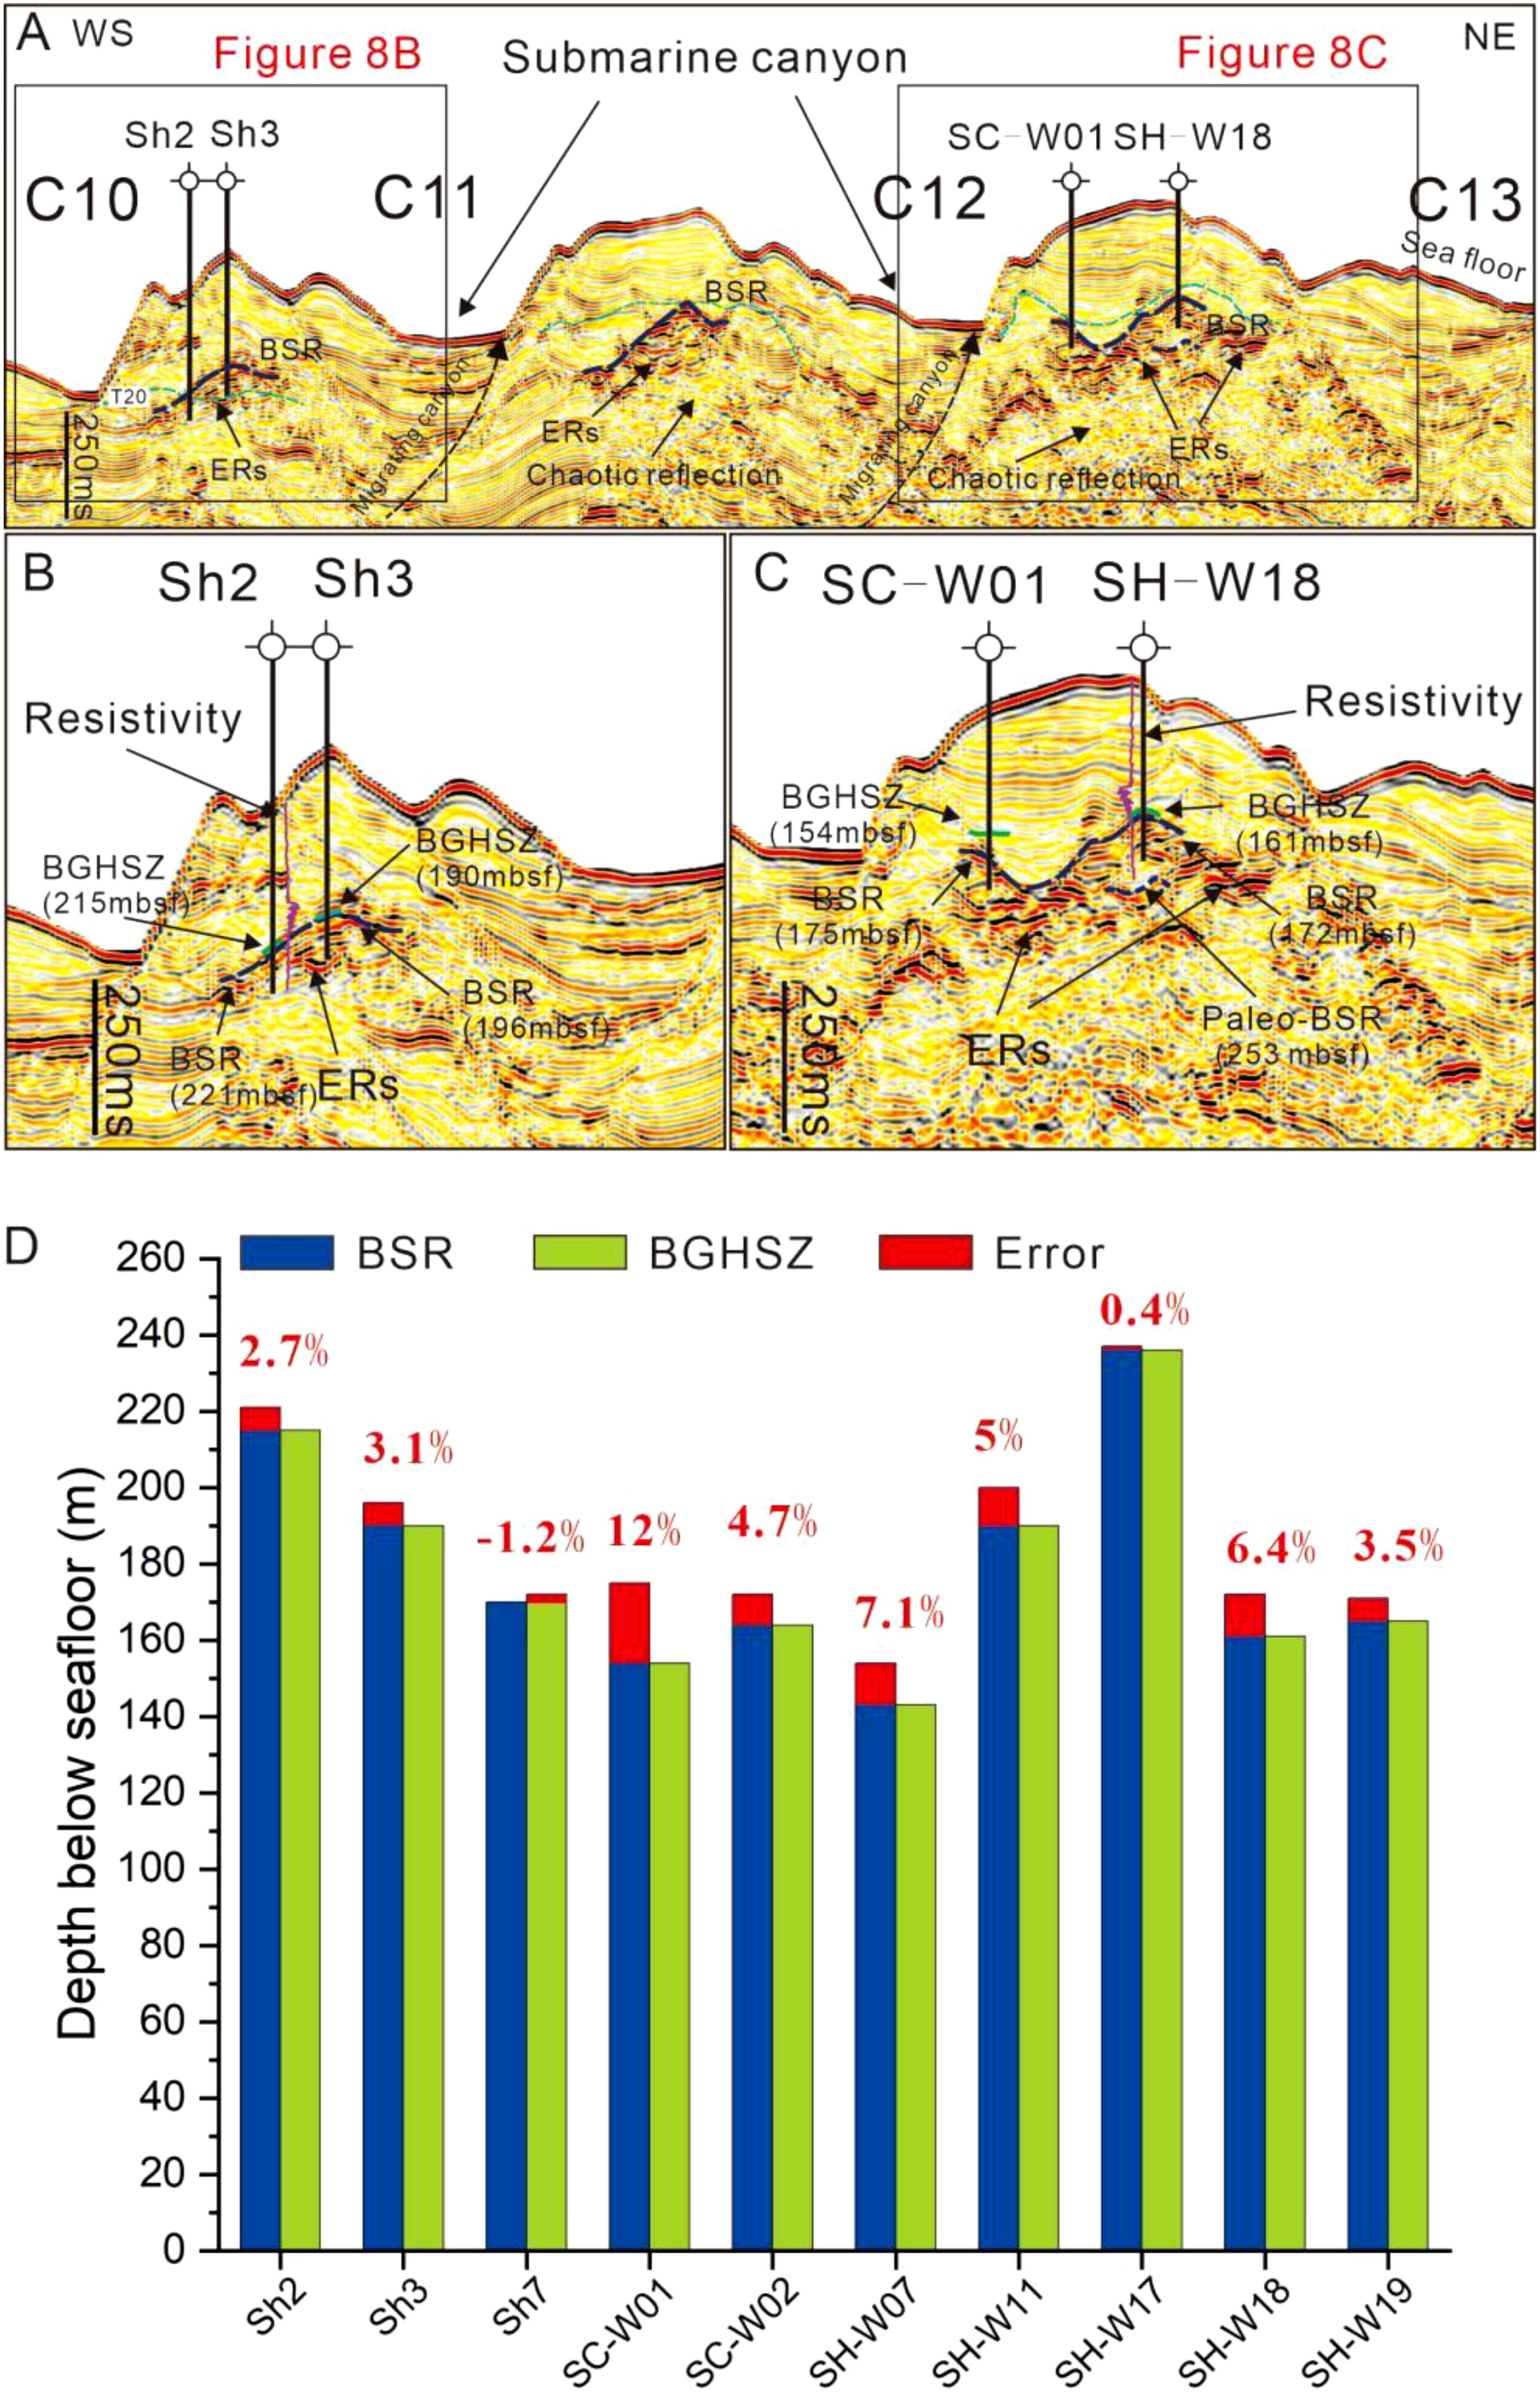
Figure 8. (A) High-resolution seismic profile across the Shenhu Canyon Group, C10 to C13 canyons (see Figure 1 for location) highlighting seismic anomalies, showing BSRs, Enhanced Seismic Reflections (ERs) and chaotic seismic reflections; (B) Zoomed locations of the drilling well Sh2 and Sh3 with resistivity curve anomaly; (C) Zoomed locations of the drilling well SC-W01 and SH-W18 with resistivity curve anomaly. Green solid lines indicate BSRs identified by logging while drilling (LWD) and drilling well (Su et al., 2016; Zhang et al., 2020a; Song et al., 2022a); blue solid lines indicate BGHSZ calculated by the study; pink lines represent the LWD electrical resistivity (Su et al., 2016; Zhang et al., 2020a). (D) Comparison of the depths of BSR and BGHSZ at the drilling wells. The blue represents the BSR depth at the drilling wells; the green represents the calculated BGHSZ depth in this study; and the red represents the error between the BSR and BGHSZ depths.
Double BSRs are identified at well SH-W18 based on the seismic interpretation (Figure 8C), referred to as BSR (upper) and paleo-BSR (lower). The paleo-BSR is located below BSR with depth at 253 mbsf and seismic reflection is similar to the upper BSR, exhibiting a high amplitude reflection and opposite polarities reflection, which indicate a seismic velocity decrease. ERs appear below the paleo-BSR, indicating accumulation of free gas (Figure 8C).
A gas chimney is a crucial structure closely associated with the presence of gas hydrates. It can carry a substantial amount of methane-rich fluid upward to the GHSZ (Wang et al., 2008; Sun et al., 2012; Li et al., 2021, 2022b). Generally, the fluids within gas chimney have a significant influence on seismic energy in seismic data, leading to absorption and scattering of the seismic energy during propagation, thereby weakening the seismic intensity (Coren et al., 2001). Consequently, gas chimneys are characterized by blank, chaotic reflections and low-amplitude seismic reflections, exhibiting pull-down reflections in the inner, which indicate presence of free gas (Figures 9A, B). The shape of a gas chimney is a pipe-shaped or mushroom-shaped. ERs are observed at the top and sides of the gas chimney, indicating the accumulation of free gas (Figure 9B). Gas chimneys are found in both the eastern and western regions of the canyon, with a primary concentration in the eastern canyon (C10-C14) (Figure 1B), where the BSRs are located above the gas chimneys (Figure 9B). In contrast, no BSR is observed above the western gas chimneys (Figure 9A).
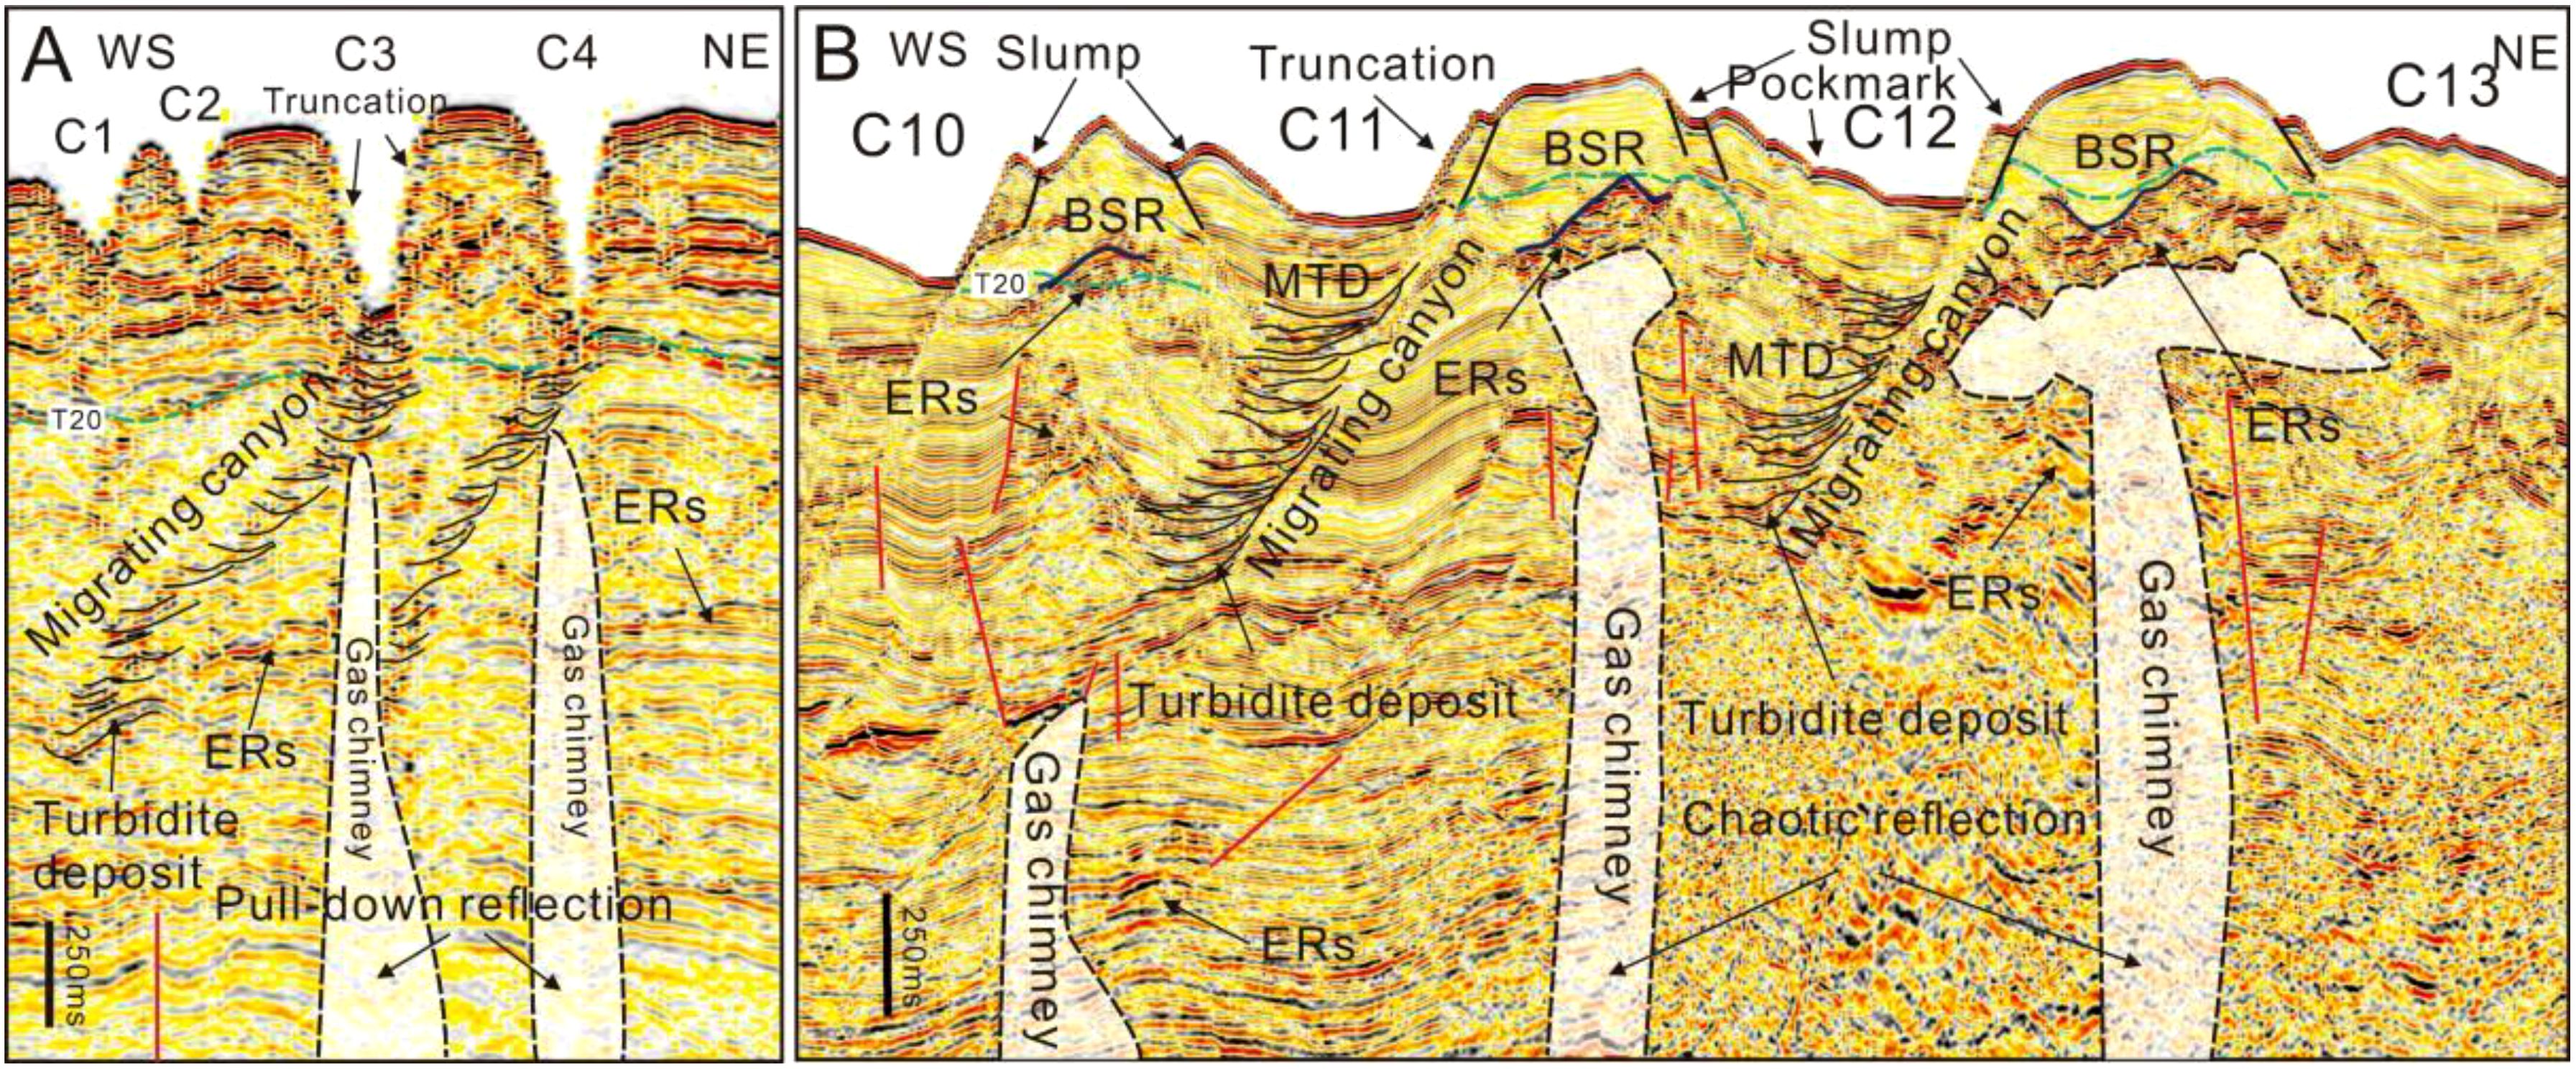
Figure 9. (A) High-resolution seismic profile across the Shenhu Canyon Group, C1 to C4 canyons (see Figure 1 for location); (B) High-resolution seismic profile across the Shenhu Canyon Group, C10 to C13 canyons (see Figure 1 for location). They show BSRs, migrating canyons, gas chimneys and turbidite deposits, slumps, mass transport deposits (MTD) and pockmarks. ERS, Enhanced Seismic Reflections. Blue solid lines indicate BSRs identified by logging while drilling (LWD) and drilling well (Su et al., 2016; Zhang et al., 2020a; Song et al., 2022a).
On the western canyon flanks, continuous seismic reflections are truncated, presenting an erosional feature (Figure 9A). In contrast, on the eastern canyon flanks, aside from the truncation features, slumps are interpreted. These slumps are characterized by continuous, low to moderate reflections and wave-like reflections. These reflections exhibit a dip from the canyon ridge towards the canyon thalweg, indicating that these geological bodies are in an unstable state (Figure 9B). Turbidity deposits are characterized by continuous, high amplitude reflections that terminate on both flanks of canyons (Figures 9A, B). MTDs, which are present within turbidite deposits, result from the remobilization of sedimentary units (Sun et al., 2018) and are characterized by chaotic, low amplitude reflections, that exhibit a deposition feature (Figure 9B).
The seismic data from C6-C9 canyons show that buried canyons (referred to as paleo-canyons here) are observed under T20 interface, exhibiting a migration feature from west to east (Figure 10A). Additionally, turbidity deposits can be observed in the paleo-canyons (Figures 10A, B). Buried channels are identified above the T20 interface, with the top of the channels covered by a series of sediments, characterized by continuous, parallel, and moderate amplitude reflections. This suggest that the current submarine canyons are not directly inherited from the buried paleo-canyons (Figure 10A). A similar phenomenon is noted in C17-C19 canyons (Figure 10B). In the seismic data from C8-C9 canyons, the canyons cut deeply across T20 interface. Buried pockmarks (referred to as paleo-pockmark here) are identified above the T20 interface, displaying U-shaped profile, with the interior characterized by high amplitude reflections, indicating the presence of turbidity deposit fillings. Paleo- pockmarks are mainly distributed on both flanks of the canyons, and seafloor pockmarks are developing directly above them. (Figures 8B, 10C).
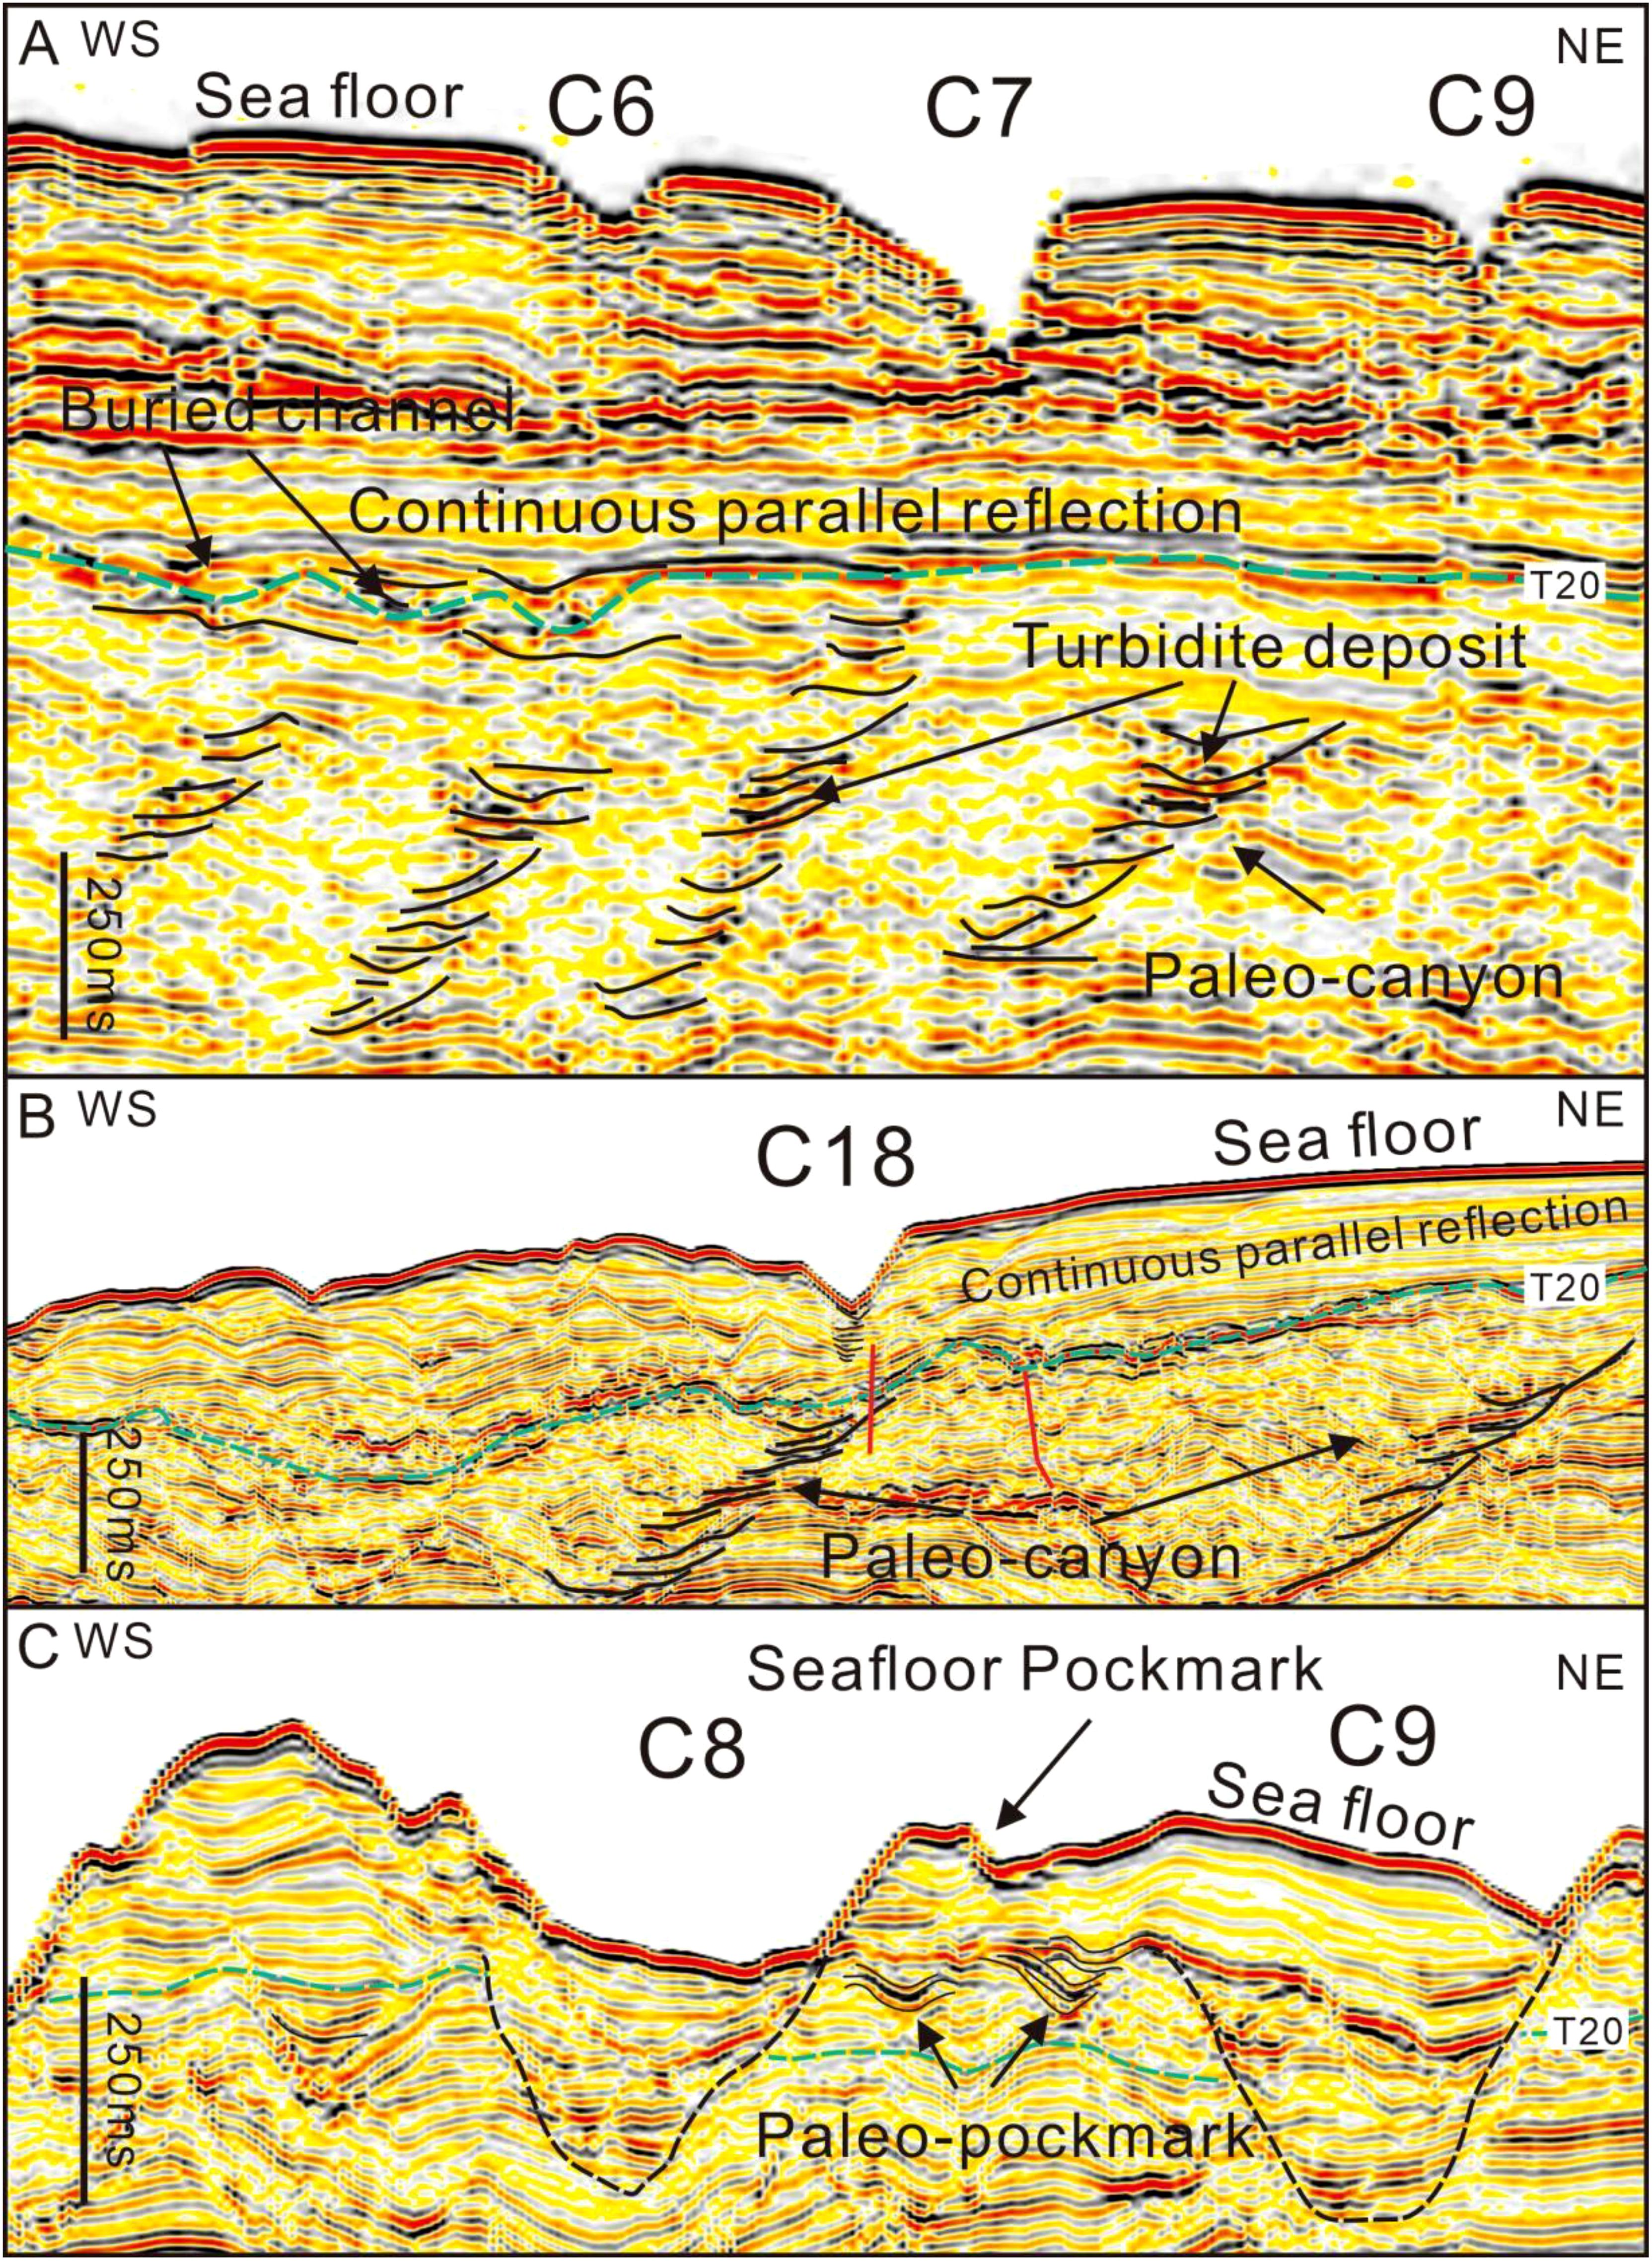
Figure 10. (A) High-resolution seismic profile across the Shenhu Canyon Group, C6 to C9 canyons (see Figure 1 for location); (B) High-resolution seismic profile across the Shenhu Canyon Group, C17 to C19 canyons (see Figure 1 for location); (C) High-resolution seismic profile across the Shenhu Canyon Group, C8 to C9 canyons (see Figure 1 for location). They show paleo-canyon, paleo-pockmarks and turbidite deposits.
The BGHSZ is generally regarded as the bottom of the GHSZ, where gas hydrates can exist stably. The BGHSZ is generally visible in seismic data as a BSR (Yang et al., 2021). Based on the water depth, in situ BWT and geothermal gradient data from wells Sh2, Sh3, SC-W01 and SH-W18 (Su et al., 2016; Song et al., 2022a), the GHSZ thickness is calculated by using Miles (1995) method. Subsequently, the BGHSZ was determined and delineated on the seismic profile through the application of a time-depth conversion equation (Su et al., 2018; Wang et al., 2021a) (Figure 8). At Site Sh2, the BSR is located at 221 mbsf (meter below sea floor) based on LWD (Su et al., 2016) with the BGHSZ at 215 mbsf (Figure 8B). For Site Sh3, the BSR is at 196 mbsf (Su et al., 2016) with the BGHSZ at 190 mbsf (Figure 8B). At SC-W01, the BSR is at 175 mbsf (Song et al., 2022a) with the BGHSZ at 154 mbsf (Figure 8C). Similarly, at SC-W18, the BSR is at 172 mbsf (Zhang et al., 2020a) while the modeled BGHSZ (assuming 100% CH4) at well SH-W18 is located at 161 mbsf (Figure 8C), which is consistent with the results calculated by Zhang et al. (2020a) using the Sloan method (Sloan, 1998). By comparing of the depths of BSR and BGHSZ at the drilling wells, the results demonstrate that the calculated depths of the BGHSZ are strikingly similar (error generally less than 7%) to the seismically interpreted BSRs (Figure 8D). However, the depths of the seismically interpreted BSRs are constantly slightly deeper than that of the modeled BGHSZ.
The gas composition of the study area is important to the numerical calculation for GHSZ thickness. Geochemical analyses of pore water obtained from core samples by GMGS1 expedition suggest that methane concentrations ranged from 98.90% to 99.96%, with minor quantities of ethane and propane (Wu et al., 2008; Su et al., 2016). These scholars believe that gas hydrates are mainly derived from biogenic methane (Wu et al., 2011; Zhu et al., 2013). Geochemical analysis of core samples by GMGS-3 and 4 indicates that the gas composition was predominantly methane gas. Heavy hydrocarbons, including ethane, propane, were also detected in some samples (Wei et al., 2018; Zhang et al., 2019); however, the content of heavy hydrocarbons is at a relatively low level. These scholars contend that gas hydrates are mainly derived from thermogenic methane (Zhang et al., 2019). The deeper depths of seismically interpreted BSRs than the modeled BGHSZ may be explained by the presence of heavy hydrocarbons in the gas composition at these stations, which may potentially cause the BSR to shift downward (Zhang et al., 2020a). Zhang et al. (2019) showed that the modeled BGHSZ (assuming 100% CH4 as Structure I gas hydrates) is shallower than BSR, the depth of which is consistent with the modeled BGHSZ (assuming 99% CH4 and 1% C2H6 as Structure II gas hydrate). The Result suggested both Structure I and II gas hydrate may coexist in the Shenhu area (Zhang et al., 2019). Wei et al. (2018) confirmed coexistence of the Structure I and II gas hydrate at well SC-W01 in the Shenhu area using Raman spectra analysis based on LWD data and gas hydrate samples obtained by GMGS-4 and suggested that existence of Structure II gas hydrate potentially deepen the base of Structure I gas hydrate (Wei et al., 2018). Qian et al. (2018) reported that Structure II gas hydrate and free gas are interbedded and can coexists below Structure I gas hydrate using well log and core data at well SH-W07 (Qian et al., 2018) (Figure 1C). Consequently, our results of the GHSZ are reasonably sound, with the error generally within 7%. The primary cause of the error is the heterogeneity of natural gas components in the study area.
As far as we know, the GHSZ is primarily controlled by temperature and pressure conditions (Chen et al., 2019; Ketzer et al., 2020; Davies et al., 2021; Deng et al., 2021; Li et al., 2024). However, our results show that the reduction in the thickness of the GHSZ in shallow water areas is always more significant than that in deep water areas (Figures 5-7). Thus, a series of tests are meticulously carried out to investigate the variations in the thickness of the GHSZ in relation to the alterations in sea level and BWT at diverse water depths (Figures 11).
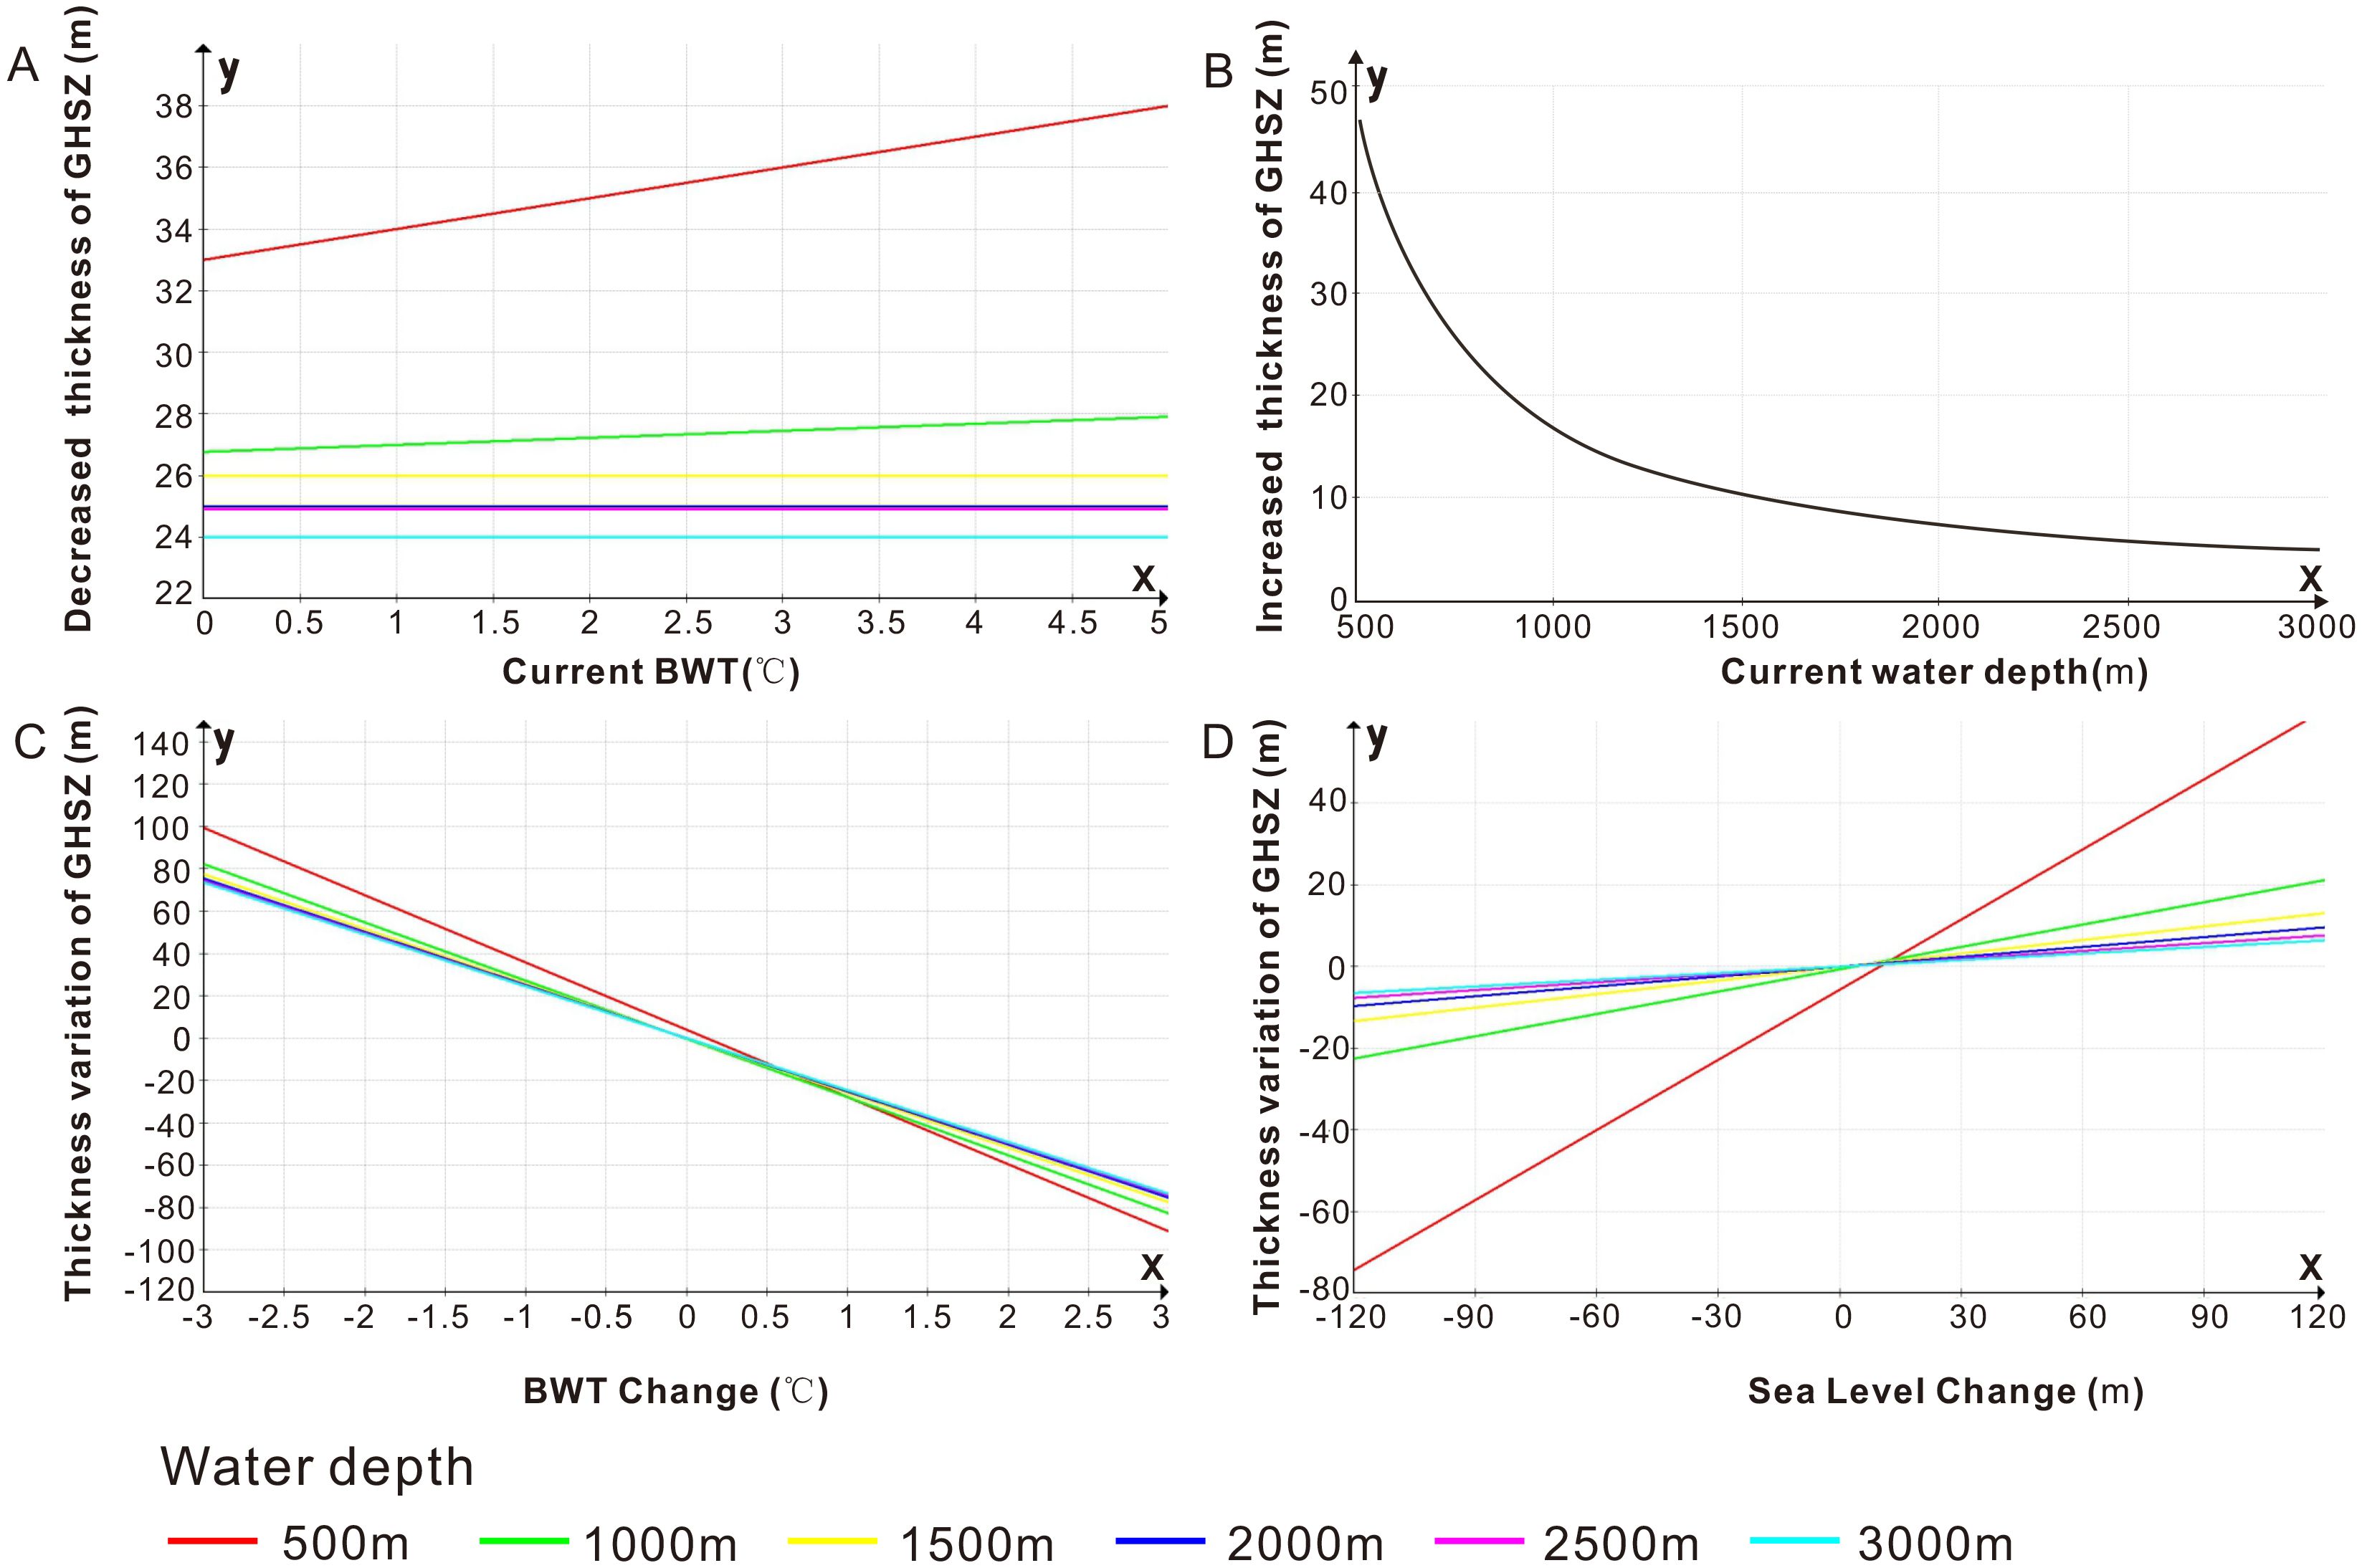
Figure 11. (A) The relationship between current BWT and decreased thickness of GHSZ with increased BWT by 1°C; (B) The relationship between current water depth and increased thickness of GHSZ with increased water depth by 100 m; (C) The relationship between BWT change and thickness variation of GHSZ; (D) The relationship between sea level change and thickness variation of GHSZ. Different colors indicate different water depths.
In Figure 11A, the higher the BWT, the greater the reduction in the thickness of the GHSZ. Moreover, in shallow water areas, especially those with a water depth of less than 1000m, the reduction in the thickness of the GHSZ is significantly more pronounced than that in deep water areas. In Figure 11B, for the same amount of water depth change (for example, an increase of 100m), the change in the thickness of the GHSZ in shallow water areas is always greater than that in deep water areas. The thickness of the GHSZ varies with changes in BWT and sea level. However, in shallow water regions, particularly those with a water depth less than 1000m, the variation in the thickness of the GHSZ is consistently more evident than that in deep water regions. As indicated by the slopes of the lines in Figure 11, The slopes of the lines in shallow water areas, especially those with a water depth of less than 1000m, are always greater than that in deep water areas.
The Shenhu area is characterized by a shallow water depth ranging from 500 to 1000m and a relatively high current BWT of 3-5 °C. In contrast, the YLLU and LWS areas feature a deep water depth exceeding 1500m and a relatively low current BWT below 3°C (Figures 2A, B). The shallow water depths (< 1000m) always have a larger effect on the GHSZ thickness variation than the deep water depths (>1000m) and that is why the Shenhu area always shows a larger reduction in the GHSZ thickness compared to the YLLU and LWS (Figures 5-7).
Reduction in GHSZ thickness may lead to gas hydrate decomposition accompanied by the seepage of methane (Marín-Moreno et al., 2013; Ketzer et al., 2020; Davies et al., 2021; Deng et al., 2021; Cooke et al., 2023; Li et al., 2024). Authigenic carbonates were revealed on the seafloor in the Shenhu area (Qiu et al., 2018; Chen et al., 2022; Zhang et al., 2022). The enriched 18O suggests that the presence of authigenic carbonate is linked to the decomposition of gas hydrates, a process accompanied by methane seepage (Tong et al., 2013). This phenomenon is also observed in the Dongsha area and the Qiongdongnan Basin (Zhang et al., 2023; Li et al., 2024) (Figure 4A). Methane seepage can breach the seafloor and form seafloor pockmarks (Mazzini et al., 2017; Qiu et al., 2018). Observations of seismic profiles reveal seafloor pockmarks are presented on both sides of the Shenhu Canyon Group, with some situated above the BSR, suggesting that gas hydrates may have decomposed or be currently decomposing (Chen et al., 2016) (Figures 9B, 10C). Paleo-pockmarks have also been observed in seismic profiles (Figure 10C), suggesting that fluid seepage activity occurred in the past (Wang et al., 2021b; Shen et al., 2023). So far, the history of methane leakage in the northern SCS has been recorded for only 0.4 Ma (Tong et al., 2013; Qiu et al., 2018; Chen et al., 2019; Deng et al., 2021; Chen et al., 2022; Zhang et al., 2022, 2023; Li et al., 2024) (Figure 4A). During this period, methane leakage occurred either during sea level falls (Figure 6) or BWT increase (Figures 5, 7), which is consistent with our findings (Figures 4-7). Consequently, methane leakage occured in the Shenhu area due to the decomposition of gas hydrates. Apart from the influence of the BWT and sea level fluctuations, water depth is a crucial factor affecting gas hydrate decomposition. In shallow water areas, especially those with a water depth of less than 1000 m, gas hydrate decomposition is consistently more significant than that in deep water areas.
Our findings reveal significant fluctuations in the GHSZ thickness since 2.5 Ma, with multiple thinning periods controlled by the above-mentioned three combinations of sea level and BWT variations (Figures 5-7). Due to predominant influence of shallow water area on the variation of GHSZ thickness (Figure 11), the reduction of GHSZ thickness, contributing to gas hydrates leakage, have occurred frequently in the Shenhu area (Figures 4). Evidences of double BSRs, free gas, seafloor pockmarks, paleo-pockmark in Seismic data (Figures 10–12) and authigenic carbonates (Tong et al., 2013; Chen et al., 2022; Zhang et al., 2022) prove that gas hydrate leakage has occurred in the Shenhu area.
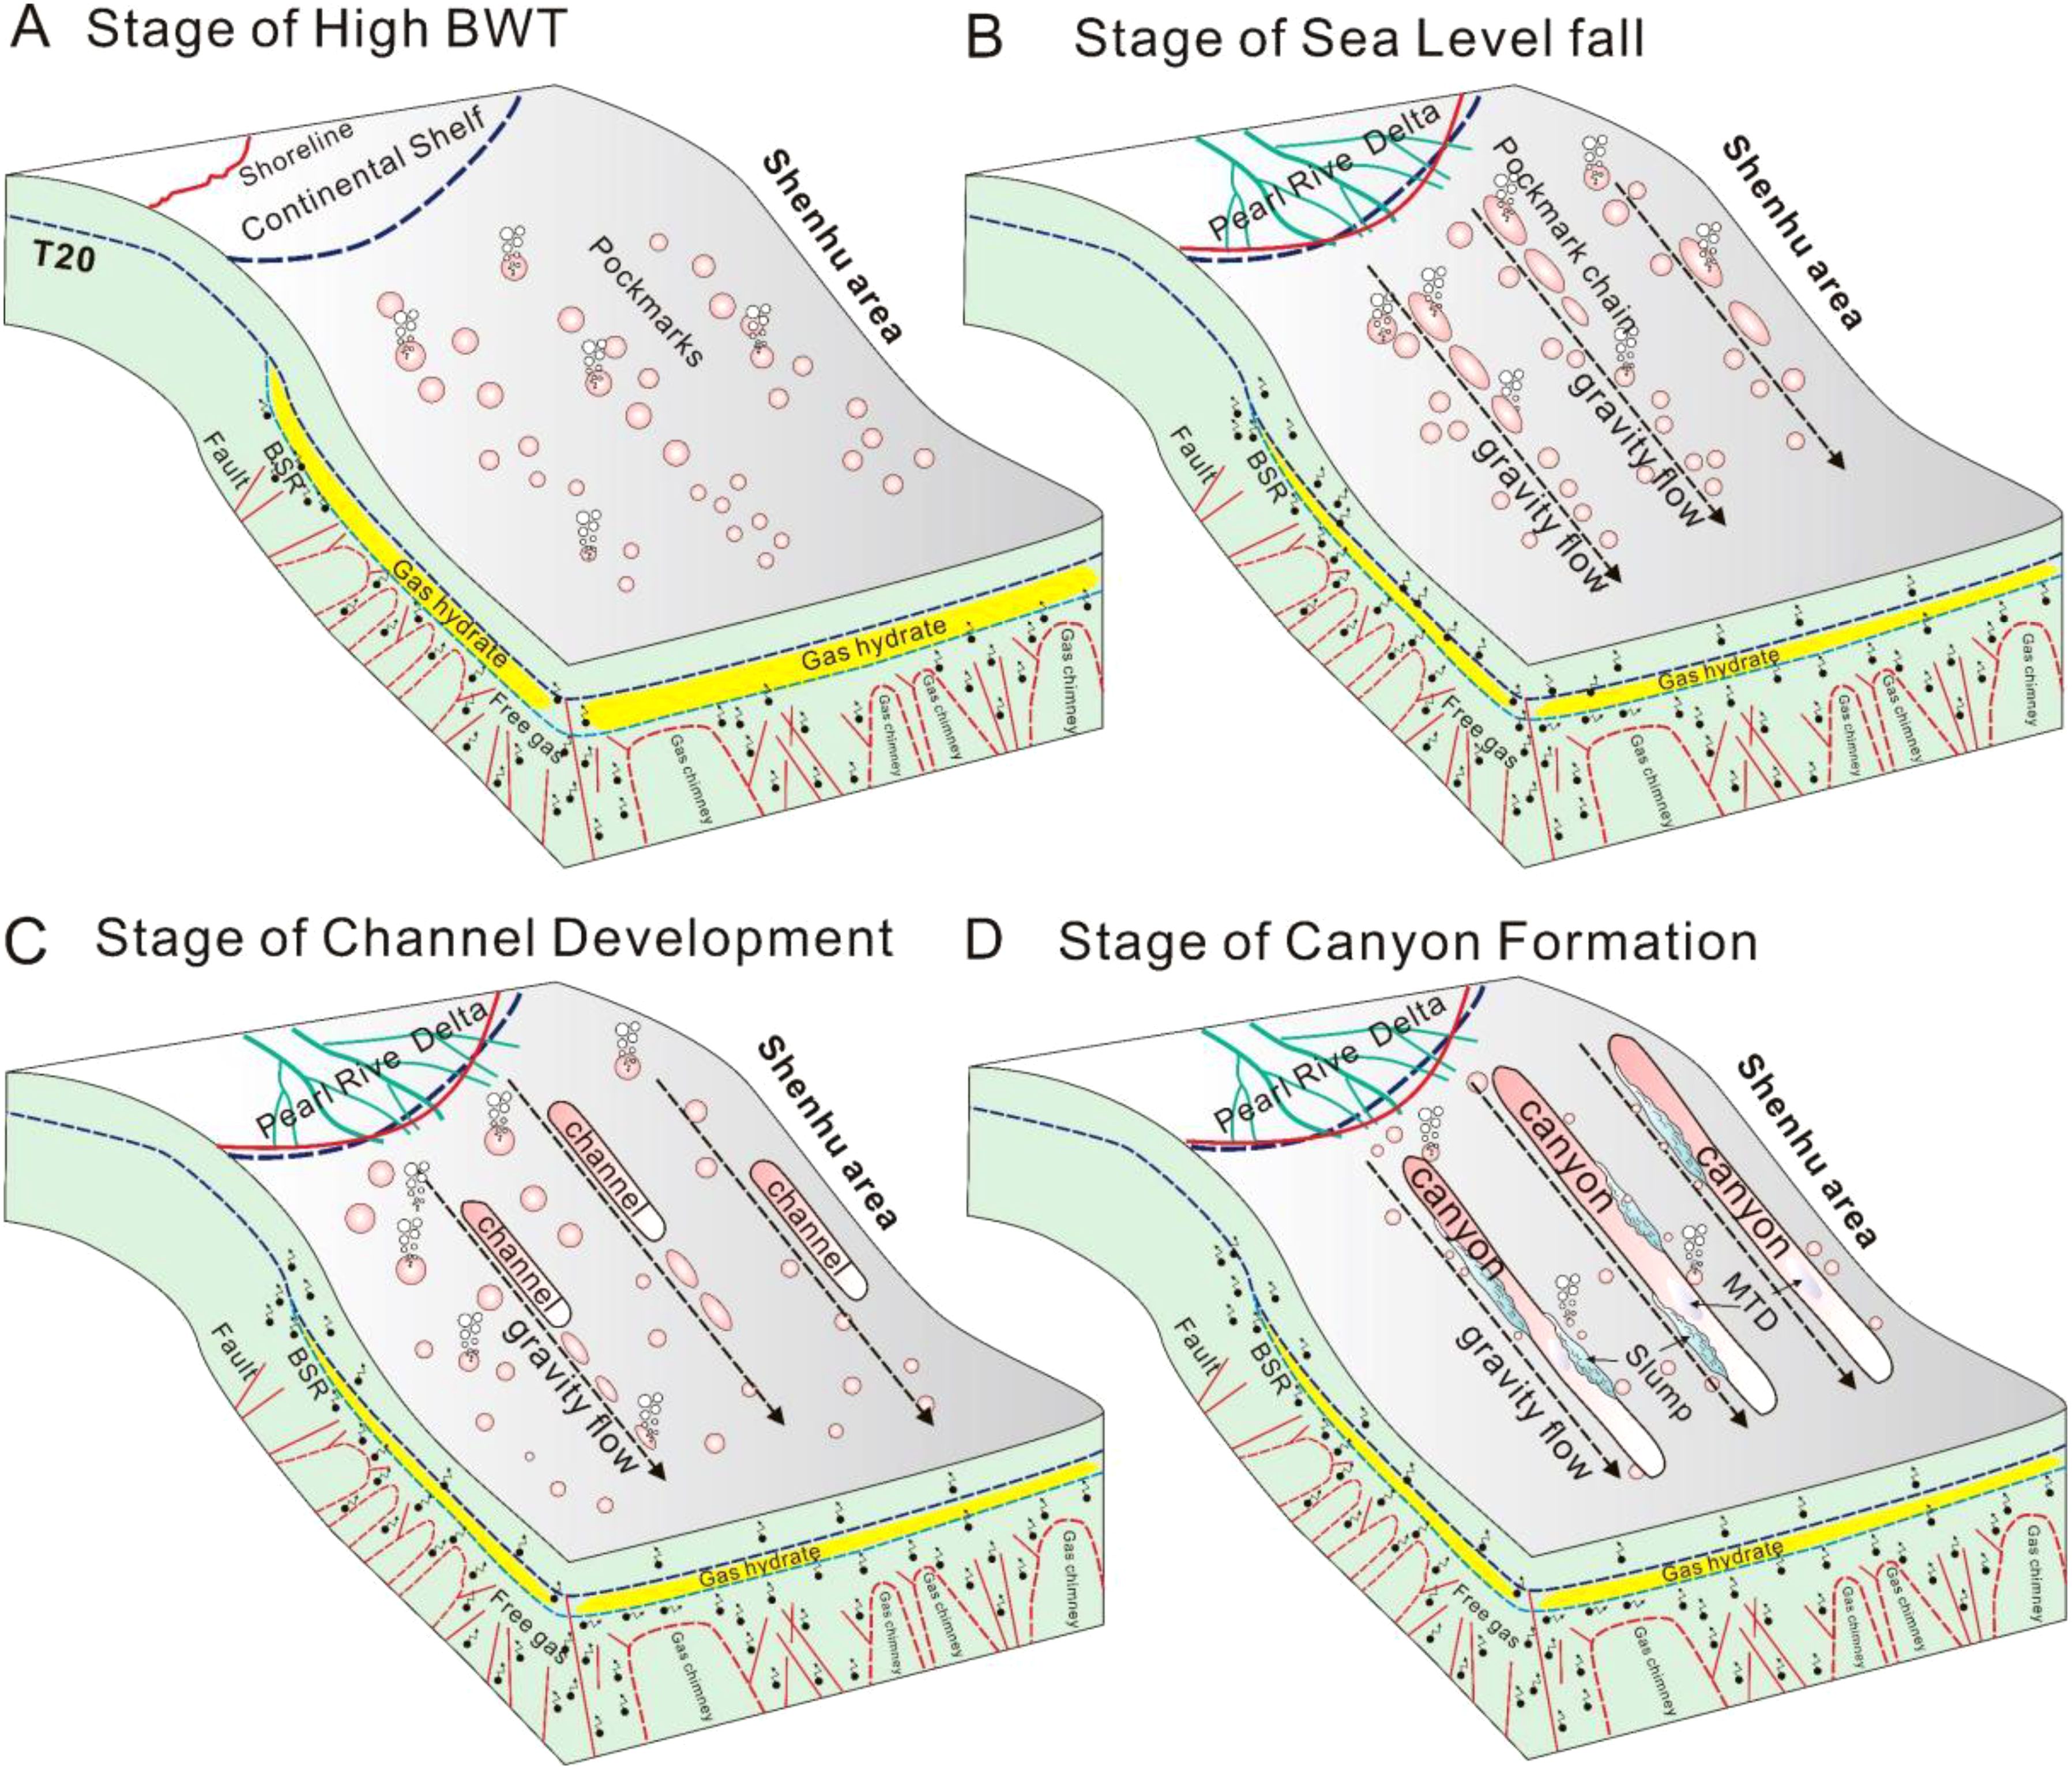
Figure 12. Schematic diagram showing the formation of Shenhu Canyon Group during the Quaternary. (A) The stage of high BWT, methane seepage occurred; (B) The stage of sea level fall, gravity flow erode pockmark; (C) The stage of channel development; (D) The stage of canyon formation.
Gas hydrate dissociation is known to trigger methane leakage and form pockmarks (Chen et al., 2019; Ketzer et al., 2020; Davies et al., 2021; Deng et al., 2021; Chen et al., 2022; Zhang et al., 2022; Cooke et al., 2023; Panieri et al., 2023; Zhang et al., 2023; Li et al., 2024). The leakage can increase pore pressure within sediment layers and destabilize the slope, ultimately resulting in slope failures (Sultan et al., 2004; Mienert et al., 2005; Nixon and Grozic, 2006, 2007). Slope failures were observed in both sides of canyon walls (Figure 9B). Yu et al. (2023) carried out numerical simulations to reconstruct the erosional process of pockmarks induced by bottom currents in the northwestern SCS. The simulation results clearly demonstrated that the decomposition of gas hydrates and the seepage of methane can result in the formation of pockmarks on the seafloor. Moreover, specific bottom current velocities are capable of eroding these pockmarks, causing them to connect with one another and form trains of pockmarks. Eventually, a canyon will be formed.
Thus, we propose a possible formation mechanism for the Shenhu Canyon Group, which is as follows:
A. In the early Quaternary period, the sea level remained at a high level, and multiple seawater warming events occurred in the Shenhu area. Since the water depth in the study area generally does not exceed 1000m, recurrent decomposition of gas hydrates and methane leakage will occur intensely. The released methane gas then migrated upward to the seafloor, resulting in the formation of pockmarks (Figure 12A).
B. In the Late Pleistocene Epoch, the BWT changes were relatively gentle, while the sea level experienced multiple significant rises and falls. When sea level drop, the continental shelf becomes exposed. The development of gravity flows originating from the Pearl River delta contributed to the deformation of these pockmarks and the development of interconnected chains of pockmarks (Figures 9B, 10C). Seismic data has revealed turbidity deposits and MTDs within the canyons, indicating active gravity flow (Figures 9A, B, 10A, B). Gravity flow erode the pockmarks, altering their morphology and ultimately resulting in the formation of pockmarks chain (Yu et al., 2023)(Figure 12B). Based on bathymetric and three-dimensional seismic characteristics, both pockmarks and pockmark chains were identified in the Shenhu Canyon Group (Chen et al., 2016).
C. During the Holocene Epoch, both the BWT and sea level rose sharply. The decomposition of gas hydrates and methane leakage would occur violently. Thus, the adjacent pockmarks merged over time due to erosion of gravity flow, which led to the development of initial channels (Yu et al., 2023)(Figure 12C). The relationship between canyon initiation and methane seepage is confirmed by the presence of the MTDs associated with BSRs, turbidites and pockmarks etc (Li et al., 2022a).
D. The above processes were further signified by the periodicity of sea level fluctuations and BWT changes and the continued formation and expansion of these channels (León et al., 2010; Yu et al., 2021). The methane seepage can further cause slope failures, such as slumps, which would play a significant role in widening the canyons (Figure 9B). This iterative process culminates in the formation of the Shenhu Canyon Group as we observe at present (Figure 12D).
1. Our results of the GHSZ are reasonably sound, with the error generally within 7%. The primary cause of the error is the heterogeneity of natural gas components in the study area. The present GHSZ extends from 600 to 3000 m water depth, reaching a maximum thickness of 350 m in the southern BYS and YLLU.
2. Methane leakage occured in the Shenhu area due to the decomposition of gas hydrates. Apart from the influence of the BWT and sea level fluctuations, water depth is a crucial factor affecting gas hydrate decomposition. In shallow water areas, especially those with a water depth of less than 1000 m, gas hydrate decomposition is consistently more significant than that in deep water areas…
3. It is proposed that during periods of seawater warming or sea level decline, the marked reduction in the thickness of the GHSZ in the Shenhu area induces the dissociation of gas hydrates. This dissociation event is likely to trigger methane seepage, which in turn gives rise to the formation of pockmarks on the seafloor. These pockmarks have the potential to weaken the slope sediments. Subsequently, the rapid sea level fall promotes concurrent gravity induced erosion processes. As a result, a chain of pockmarks is formed. Moreover, continuous gas seepage may further instigate slope failures. These slope failure incidents, characterized by phenomena such as slumps, act to widen the channel. It is postulated that this repetitive and iterative process has been instrumental in the formation of the Quaternary Shenhu Canyon Group.
The original contributions presented in the study are included in the article/supplementary material. Further inquiries can be directed to the corresponding authors.
HP: Conceptualization, Formal analysis, Investigation, Validation, Visualization, Writing – original draft. HX: Conceptualization, Funding acquisition, Project administration, Resources, Supervision, Validation, Writing – review & editing. ZZ: Conceptualization, Methodology, Project administration, Resources, Software, Supervision, Validation, Writing – review & editing. JL: Supervision, Writing – review & editing. GJ: Formal analysis, Investigation, Writing – review & editing. RL: Formal analysis, Investigation, Writing – review & editing. YL: Resources, Supervision, Writing – review & editing. EL: Supervision, Writing – review & editing. WY: Project administration, Supervision, Writing – review & editing.
The author(s) declare that financial support was received for the research and/or publication of this article. This work was jointly supported by Youth Innovation Promotion Association CAS, the Guangdong Basic and Applied Basic Research Foundation (No. 2023A151500124, 2016A030310331), National Key Research and Development Program of China (No. 2021-06), National Natural Science Foundation of China (No. 41606065, 42076077), Key Laboratory of Ocean and Marginal Sea Geology, Chinese Academy of Sciences (No. MSGL15-02), and the Program for Scientific Research Start-up Funds of Guangdong Ocean University (No.E15173) and Marine Science Research Team Project of Guangdong Ocean University (No.002026002004), the National Natural Science Foundation of China (42006179).
The authors would like to express sincere gratitude to the editor, Dr. Pengfei Ma and the two reviewers, Dr. Zhilei Sun and Dr. Yanlong Li for professional evaluation of the manuscript. Their comments are invaluable and very helpful for revising and improving the manuscript.
The authors declare that the research was conducted in the absence of any commercial or financial relationships that could be construed as a potential conflict of interest.
The author(s) declare that no Generative AI was used in the creation of this manuscript.
All claims expressed in this article are solely those of the authors and do not necessarily represent those of their affiliated organizations, or those of the publisher, the editors and the reviewers. Any product that may be evaluated in this article, or claim that may be made by its manufacturer, is not guaranteed or endorsed by the publisher.
Bates S. L., Siddall M., Waelbroeck C. (2014). Hydrographic variations in deep ocean temperature over the mid-Pleistocene transition. Quaternary Sci. Rev. 88, 147–158. doi: 10.1016/j.quascirev.2014.01.020
Briais A., Patriat P., Tapponnier P. (1993). Updated interpretation of magnetic anomalies and seafloor spreading stages in the South China Sea: Implications for the Tertiary tectonics of Southeast Asia. J. Geophysical Research: Solid Earth 98, 6299–6328. doi: 10.1029/92JB02280
Chen C., Zhong L., Wan Z., Cheng C., Zhou W., Xu X. (2022). Geochemical characteristics of cold-seep carbonates in Shenhu area, South China Sea. J. Oceanology Limnology 40, 969–985. doi: 10.1007/s00343-021-1112-z
Chen D., Wang X., Völker D., Wu S., Wang L., Li W., et al. (2016). Three dimensional seismic studies of deep-water hazard-related features on the northern slope of South China Sea. Mar. Petroleum Geology 77, 1125–1139. doi: 10.1016/j.marpetgeo.2016.08.012
Chen F., Su X., Zhou Y. (2013). Late Miocene-Pleistocene calcareous nannofossil biostratigraphy of Shenhu gas hydrate drilling area in the South China Sea and variations in sedimentation rates. Earth Science–Journal China Univ. Geosciences 38, 1–9. doi: 10.3799/dqkx.2013.001
Chen F., Wang X., Li N., Cao J., Bayon G., Peckmann J., et al. (2019). Gas hydrate dissociation during sea-level highstand inferred from U/Th dating of seep carbonate from the South China Sea. Geophysical Res. Lett. 46, 13928–13938. doi: 10.1029/2019GL085643
Clift P., Lin J. (2001). Preferential mantle lithospheric extension under the South China margin. Mar. Petroleum Geology 18, 929–945. doi: 10.1016/S0264-8172(01)00037-X
Cooke F., Plaza-Faverola A., Bünz S., Sultan N., Ramachandran H., Bedle H., et al. (2023). Sedimentary deformation relating to episodic seepage in the last 1.2 million years: a multi-scale seismic study from the Vestnesa Ridge, eastern Fram Strait. Front. Earth Sci. 11, 1188737. doi: 10.3389/feart.2023.1188737
Coren F., Volpi V., Tinivella U. (2001). Gas hydrate physical properties imaging by multi-attribute analysis—Blake Ridge BSR case history. Mar. Geology 178, 197–210. doi: 10.1016/S0025-3227(01)00156-6
Davies R. J., Maqueda M.Á.M., Li A., Ireland M. (2021). Climatically driven instability of marine methane hydrate along a canyon-incised continental margin. Geology 49, 973–977. doi: 10.1130/G48638.1
Davies R. J., Thatcher K. E., Mathias S. A., Yang J. (2012). Deepwater canyons: An escape route for methane sealed by methane hydrate. Earth Planetary Sci. Lett. 323, 72–78. doi: 10.1016/j.epsl.2011.11.007
Deng Y., Chen F., Guo Q., Hu Y., Chen D., Yang S., et al. (2021). Possible links between methane seepages and glacial-interglacial transitions in the South China Sea. Geophysical Res. Lett. 48, e2020GL091429. doi: 10.1029/2020GL091429
Dickens G. R., Quinby-Hunt M. S. (1997). Methane hydrate stability in pore water: a simple theoretical approach for geophysical applications. J. Geophysical Research: Solid Earth 102, 773–783. doi: 10.1029/96JB02941
Ding W., Li J., Li J., Fang Y., Tang Y. (2013). Morphotectonics and evolutionary controls on the Pearl River canyon system, South China Sea. Mar. Geophysical Res. 34, 221–238. doi: 10.1007/s11001-013-9173-9
Ding W. W., Sun Z., Dadd K., Fang Y. X., Li J. B. (2018). Structures within the oceanic crust of the central South China Sea basin and their implications for oceanic accretionary processes. Earth Planetary Sci. Lett. 488, 115–125. doi: 10.1016/j.epsl.2018.02.011
Ding W. W., Sun Z., Mohn G., Nirrengarten M., Tugend J., Manatschal G., et al. (2020). Lateral evolution of the rift-to-drift transition in the South China Sea: Evidence from multi-channel seismic data and IODP Expeditions 367&368 drilling results. Earth Planetary Sci. Lett. 531, 115932. doi: 10.1016/j.epsl.2019.115932
Gong C., Wang Y., Zhu W., Li W., Xu Q. (2013). Upper Miocene to Quaternary unidirectionally migrating deep-water channels in the Pearl River mouth Basin, northern South China Sea. AAPG Bull. 97, 285–308. doi: 10.1306/07121211159
Harris P. T., Whiteway T. (2011). Global distribution of large submarine canyons: Geomorphic differences between active and passive continental margins. Mar. Geology 285, 69–86. doi: 10.1016/j.margeo.2011.05.008
Hayes D. E., Nissen S. S. (2005). The South China Sea margins: Implications for rifting contrasts. Earth Planetary Sci. Lett. 237, 601–616. doi: 10.1016/j.epsl.2005.06.017
He J., Yan W., Zhu Y., Zhang W., Gong F., Liu S., et al. (2013). Bio-genetic and sub-biogenetic gas resource potential and genetic types of natural gas hydrates in the northern marginal basins of South China Sea. Natural Gas Industry 33, 121–134. doi: 10.3787/j.issn.1000-0976.2013.06.023
He Y., Kuang Z., Cheng C., Jiang T., Zhang C., Lu B., et al. (2022). Effects of depositional processes in submarine canyons and distribution of gas chimneys on gas hydrate accumulation in the Shenhu sea area, northern South China Sea. Energies 16, 234. doi: 10.3390/en16010234
Holloway N. (1982). North Palawan block, Philippines—its relation to Asian mainland and role in evolution of South China Sea. AAPG Bull. 66, 1355–1383. doi: 10.1306/AD461449-16F7-11D7-8645000102C1865D
Hornbach M. J., Saffer D. M., Holbrook W. S., Van Avendonk H. J., Gorman A. R. (2008). Three-dimensional seismic imaging of the Blake Ridge methane hydrate province: Evidence for large, concentrated zones of gas hydrate and morphologically driven advection. J. Geophysical Research: Solid Earth 113 (B7). doi: 10.1029/2007JB005392
Huang Y., Long Z., Zhu J., Shi C., Zhang B., Zhang X., et al. (2022). Geothermal field characteristics and maturity history of source rocks in Baiyun Sag, pearl river estuary basin. Geoscience 36, 130. doi: 10.19657/j.geoscience.1000-8527.2021.174
Huang Z.-g., Zhang W.-q., Chai F. (1995). The submerged Zhujiang delta. Acta Geographica Sinica-Chinese Edition- 50, 205–214. doi: 10.11821/xb199503002
Huang K., Zhong G., He M., Zhu W., Wu Z. (2024). Migration and controls of Shenhu submarine canyons in the upper continental slope of northern South China Sea: Insights from three-dimensional seismic data mapping. Sedimentology 71 (6), 2009–2034. doi: 10.1111/sed.13201
Hui G., Li S., Guo L., Somerville I. D., Wang P., Wang Q. (2019). Mechanisms of submarine canyon formation on the northern continental slope of the South China Sea. Geological J. 54, 3389–3403. doi: 10.1002/gj.v54.6
Jin J., Wang X., Zhang Z., He M., Magee C., Li J., et al. (2022). Shallow gas and gas hydrate accumulations influenced by magmatic complexes in the Pearl River Mouth Basin, South China Sea. Mar. Geology 453, 106928. doi: 10.1016/j.margeo.2022.106928
Ketzer M., Praeg D., Rodrigues L. F., Augustin A., Pivel M. A., Rahmati-Abkenar M., et al. (2020). Gas hydrate dissociation linked to contemporary ocean warming in the southern hemisphere. Nat. Commun. 11, 3788. doi: 10.1038/s41467-020-17289-z
León R., Somoza L., Medialdea T., Hernández-Molina F. J., Vázquez J. T., Díaz-del-Rio V., et al. (2010). Pockmarks, collapses and blind valleys in the Gulf of Cádiz. Geo-Marine Lett. 30, 231–247. doi: 10.1007/s00367-009-0169-z
Li J., Li W., Alves T. M., Rebesco M., Wang X., Li S., et al. (2023). Controls on the morphology of closely spaced submarine canyons incising the continental slope of the northern South China Sea. Geomorphology 432, 108712. doi: 10.1016/j.geomorph.2023.108712
Li D., Liu X., Cheng H., Liang J., Xu S., Dong G., et al. (2022a). Development of submarine canyons on the continental slope of the Okinawa Trough with potential origin related to methane seepage. Ore Geology Rev. 149, 105088. doi: 10.1016/j.oregeorev.2022.105088
Li N., Wang X., Feng J., Chen F., Zhou Y., Wang M., et al. (2024). Intermediate water warming caused methane hydrate instability in South China Sea during past interglacials. Bulletin 136, 917–927. doi: 10.1130/B36859.1
Li Y., Wu N., He C., Sun Z., Zhang Z., Hao X., et al. (2021). Nucleation probability and memory effect of methane-propane mixed gas hydrate. Fuel 291, 120103. doi: 10.1016/j.fuel.2020.120103
Li Y., Wu N., Liu C., Chen Q., Ning F., Wang S., et al. (2022b). Hydrate formation and distribution within unconsolidated sediment: Insights from laboratory electrical resistivity tomography. Acta Oceanologica Sin. 41, 127–136. doi: 10.1007/s13131-021-1972-2
Liu B., Chen J., Pinheiro L. M., Yang L., Liu S., Guan Y., et al. (2021). An insight into shallow gas hydrates in the Dongsha area, South China Sea. Acta Oceanologica Sin. 40, 136–146. doi: 10.1007/s13131-021-1758-6
Liu L., Chu F., Wu N., Zhang L., Li X., Li H., et al. (2022). Gas sources, migration, and accumulation systems: the shallow subsurface and near-seafloor gas hydrate deposits. Energies 15, 6921. doi: 10.3390/en15196921
Liu H., Lin C., Zhang Z., Zhang B., Jiang J., Tian H., et al. (2019). Quaternary sequence stratigraphic evolution of the Pearl River Mouth Basin and controlling factors over depositional systems. Mar. Geology Quaternary Geology 39, 25–37. doi: 10.16562/j.cnki.0256-1492.2017060201
Liu B., Pang X., Yan C., Liu J., Lian S., He M., et al. (2011). Evolution of the Oligocene-Miocene shelf slope-break zone in the Baiyun deep-water area of the Pearl River Mouth Basin and its significance in oil-gas exploration. Acta Petrolei Sin. 32, 234. doi: 10.7623/syxb201102007
Liu J., Su M., Qiao S. (2016). Forming mechanism of the slope-confined submarine canyons in the Baiyun Sag. Pearl River Mouth Basin 34, 940–950.
Mao Y., Zhao Z., Sun Z. (2020). Extensional thinning mechanism of the western continental margin of the Pearl River Mouth Basin. Earth Sci. 45, 1622–1635. doi: 10.3799/dqkx.2019.160
Marín-Moreno H., Minshull T. A., Westbrook G. K., Sinha B., Sarkar S. (2013). The response of methane hydrate beneath the seabed offshore Svalbard to ocean warming during the next three centuries. Geophysical Res. Lett. 40, 5159–5163. doi: 10.1002/grl.v40.19
Maslin M., Owen M., Day S., Long D. (2004). Linking continental-slope failures and climate change: testing the clathrate gun hypothesis. Geology 32, 53–56. doi: 10.1130/G20114.1
Mazzini A., Svensen H. H., Forsberg C. F., Linge H., Lauritzen S.-E., Haflidason H., et al. (2017). A climatic trigger for the giant Troll pockmark field in the northern North Sea. Earth Planetary Sci. Lett. 464, 24–34. doi: 10.1016/j.epsl.2017.02.014
Mi L. (2018). Continuous breakthroughs on petroleum exploration of the eastern South China Sea with innovative understanding: review of recent exploration progress. China offshore Oil gas 30, 1–10. doi: 1011935/j.issn.1673-1506.2018.01.001
Mi L., Zhang Z., Pang X., Liu J., Zhang B., Zhao Q., et al. (2018). Main controlling factors of hydrocarbon accumulation in Baiyun Sag at northern continental margin of South China Sea. Petroleum Explor. Dev. 45, 963–973. doi: 10.1016/s1876-3804(18)30100-9
Mienert J., Vanneste M., Bünz S., Andreassen K., Haflidason H., Sejrup H. P. (2005). Ocean warming and gas hydrate stability on the mid-Norwegian margin at the Storegga Slide. Mar. petroleum geology 22, 233–244. doi: 10.1016/j.marpetgeo.2004.10.018
Miles P. R. (1995). Potential distribution of methane hydrate beneath the European continental margins. Geophysical Res. Lett. 22, 3179–3182. doi: 10.1029/95GL03013
Moridis G., Collett T. (2003). Strategies for gas production from hydrate accumulations under various geologic conditions. PROCEEDINGS, TOUGH Symposium 2003 Lawrence Berkeley National Laboratory.
Nixon M. F., Grozic J. L. (2006). A simple model for submarine slope stability analysis with gas hydrates. Norwegian J. Geology/Norsk Geologisk Forening 86 (3), 309–316.
Nixon M., Grozic J. L. (2007). Submarine slope failure due to gas hydrate dissociation: a preliminary quantification. Can. Geotechnical J. 44, 314–325. doi: 10.1139/t06-121
Pang X., Chen C., Peng D., Zhou D., Shao L., He M., et al. (2008). Basic geology of Baiyun deep-water area in the Northern South China Sea. China Offshore Oil Gas 20, 215–222.
Pang X., Chen C., Zhu M., He M., Shen J., Lian S., et al. (2009). Baiyun movement: a significant tectonic event on Oligocene/Miocene boundary in the northern South China Sea and its regional implications. J. Earth Sci. 20, 49–56. doi: 10.1007/s12583-009-0005-4
Panieri G., Knies J., Vadakkepuliyambatta S., Lee A. L., Schubert C. J. (2023). Evidence of Arctic methane emissions across the mid-Pleistocene. Commun. Earth Environ. 4, 109. doi: 10.1038/s43247-023-00772-y
Qian J., Wang X., Collett T. S., Guo Y., Kang D., Jin J. (2018). Downhole log evidence for the coexistence of structure II gas hydrate and free gas below the bottom simulating reflector in the South China Sea. Mar. Petroleum Geology 98, 662–674. doi: 10.1016/j.marpetgeo.2018.09.024
Qiu Z., Han X., Wang Y. (2018). Methane seepages in the northern South China Sea: evidence from in situ measurements. J. oceanology limnology 36, 1556–1561. doi: 10.1007/s00343-018-7052-6
Riboulot V., Ker S., Sultan N., Thomas Y., Marsset B., Scalabrin C., et al. (2018). Freshwater lake to salt-water sea causing widespread hydrate dissociation in the Black Sea. Nat. Commun. 9, 117. doi: 10.1038/s41467-017-02271-z
Shedd W., Boswell R., Frye M., Godfriaux P., Kramer K. (2012). Occurrence and nature of “bottom simulating reflectors” in the northern Gulf of Mexico. Mar. Petroleum Geology 34, 31–40. doi: 10.1016/j.marpetgeo.2011.08.005
Shen A., Sun Q., Cai D., Xing Z. (2023). Characteristics, classification and genetic mechanism of pockmarks. Bull. Geological Sci. Technol. 42, 204–217. doi: 10.19509/j.cnki.dzkq.2022.0144
Shipley T. H., Houston M. H., Buffler R. T., Shaub F. J., Mcmillen K. J., Laod J. W., et al. (1979). Seismic evidence for widespread possible gas hydrate horizons on continental slopes and rises. AAPG Bull. 63, 2204–2213. doi: 10.1306/2F91890A-16CE-11D7-8645000102C1865D
Sloan E. D. (1998). Gas hydrates: review of physical/chemical properties. Energy fuels 12 (2), 191–196. doi: 10.1021/ef970164
Sloan J. E. D., Koh C. A. (2007). Clathrate hydrates of natural gases (Boca Raton: CRC press). doi: 10.1201/9781420008494
Song Y., Lei Y., Zhang L., Cheng M., Li C., Liu N. (2022a). Spatial-temporal evolution of the gas hydrate stability zone and accumulation patterns of double BSRs formation in the shenhu area. Front. Earth Sci. 10, 880933. doi: 10.3389/feart.2022.880933
Song Y., Lei Y., Zhang L., Cheng M., Miao L., Li C., et al. (2022b). Spatial-temporal variations of the gas hydrate stability zone and hydrate accumulation models in the Dongsha region, China. Front. Mar. Sci. 9, 982814. doi: 10.3389/fmars.2022.982814
Su P., Liang J., Peng J., Zhang W., Xu J. (2018). Petroleum systems modeling on gas hydrate of the first experimental exploitation region in the Shenhu area, northern South China sea. J. Asian Earth Sci. 168, 57–76. doi: 10.1016/j.jseaes.2018.08.001
Su M., Wang H., Sha Z., Liang J., Wu N., Qiao S., et al. (2016). Gas hydrates distribution in the Shenhu Area, northern South China Sea: comparisons between the eight drilling sites with gas-hydrate petroleum system. Geologica Acta 14, 0079–0100. doi: 10.1344/GeologicaActa2016.14.2.1
Su M., Zhang C., Xie X., Wang Z., Jiang T., He Y., et al. (2014). Controlling factors on the submarine canyon system: A case study of the Central Canyon System in the Qiongdongnan Basin, northern South China Sea. Sci. China Earth Sci. 57, 2457–2468. doi: 10.1007/s11430-014-4878-4
Sultan N., Cochonat P., Foucher J.-P., Mienert J. (2004). Effect of gas hydrates melting on seafloor slope instability. Mar. geology 213, 379–401. doi: 10.1016/j.margeo.2004.10.015
Sun Q., Cartwright J., Xie X., Lu X., Yuan S., Chen C. (2018). Reconstruction of repeated Quaternary slope failures in the northern South China Sea. Mar. Geology 401, 17–35. doi: 10.1016/j.margeo.2018.04.009
Sun L., Wang X., He M., Jin J., Li J., Yuanping L., et al. (2020). Thermogenic gas controls high saturation gas hydrate distribution in the Pearl River Mouth Basin: Evidence from numerical modeling and seismic anomalies. Ore Geology Rev. 127, 103846. doi: 10.1016/j.oregeorev.2020.103846
Sun Q., Wang Q., Shi F., Alves T., Gao S., Xie X., et al. (2022). Runup of landslide-generated tsunamis controlled by paleogeography and sea-level change. Commun. Earth Environ. 3 (1), 244. doi: 10.1038/s43247-022-00572-w
Sun Y., Wu S., Dong D., Lüdmann T., Gong Y. (2012). Gas hydrates associated with gas chimneys in fine-grained sediments of the northern South China Sea. Mar. Geology 311, 32–40. doi: 10.1016/j.margeo.2012.04.003
Tong H., Feng D., Cheng H., Yang S., Wang H., Min A. G., et al. (2013). Authigenic carbonates from seeps on the northern continental slope of the South China Sea: New insights into fluid sources and geochronology. Mar. petroleum geology 43, 260–271. doi: 10.1016/j.marpetgeo.2013.01.011
Wang X., Cai F., Sun Z., Li Q., Li A., Sun Y., et al. (2022). Tectonic and oceanographic controls on the slope-confined dendritic canyon system in the Dongsha Slope, South China Sea. Geomorphology 410, 108285. doi: 10.1016/j.geomorph.2022.108285
Wang X., Collett T. S., Lee M. W., Yang S., Guo Y., Wu S. (2014). Geological controls on the occurrence of gas hydrate from core, downhole log, and seismic data in the Shenhu area, South China Sea. Mar. Geology 357, 272–292. doi: 10.1016/j.margeo.2014.09.040
Wang X., Hutchinson D. R., Wu S., Yang S., Guo Y. (2011). Elevated gas hydrate saturation within silt and silty clay sediments in the Shenhu area, South China Sea. J. Geophysical Res. 116 (5). doi: 10.1029/2010JB007944
Wang X., Kneller B., Sun Q. (2023). Sediment waves control origins of submarine canyons. Geology 51, 310–314. doi: 10.1130/G50642.1
Wang L., Wang B., Li J., Yu K., Zhao F. (2021b). Morphology characteristics and formation mechanisms of submarine pockmarks in the northern Zhongjiannan Basin, South China Sea. J. Trop. Oceanography 40, 72–84. doi: 10.1016/j.marpetgeo.2021.105279
Wang X., Wu S., Dong D., Gong Y., Chai C. (2008). Characteristics of gas chimney and its relationship to gas hydrate in Qiongdongnan basin. Mar. Geology Quaternary Geology 28, 103–108. doi: 10.16562/j.cnki.0256-1492.2008.03.021
Wang J., Wu S., Sun J., Feng W., Li Q. (2021a). Influence of seafloor topography on gas hydrate occurrence across a submarine canyon-incised continental slope in the northern margin of the South China Sea. Mar. Petroleum Geology 133, 105279. doi: 10.1016/j.marpetgeo.2021.105279
Wang C., Zeng J., Zhang Z., Shi N., Lao M., Zhao Q., et al. (2018). Origin and distribution of natural gas and oil in the Baiyun Depression, Pearl River Mouth Basin, South China Sea. J. Petroleum Sci. Eng. 170, 467–475. doi: 10.1016/j.petrol.2018.06.056
Wei J., Fang Y., Lu H., Lu H., Lu J., Liang J., et al. (2018). Distribution and characteristics of natural gas hydrates in the Shenhu Sea Area, South China Sea. Mar. Petroleum Geology 98, 622–628. doi: 10.1016/j.marpetgeo.2018.07.028
Wu N., Yang S., Zhang H., Liang J., Wang H., Su X., et al. (2008). Preliminary discussion on gas hydrate reservoir system of Shenhu Area, North Slope of South China Sea. in: The 6. international conference on gas hydrates: ICGH 2008. (Canada), 1–7. doi: 10.14288/1.0041054
Wu N., Zhang H., Yang S., Zhang G., Liang J., Lu J.a., et al. (2011). Gas hydrate system of Shenhu area, northern South China Sea: geochemical results. J. Geological Res. 2011, 370298. doi: 10.1155/2011/370298
Xie H., Zhou D., Li Y. P., Pang X., Li P. C., Chen G. G., et al. (2014). Cenozoic tectonic subsidence in deepwater sags in the Pearl River Mouth Basin, northern South China Sea. Tectonophysics 615, 182–198. doi: 10.1016/j.tecto.2014.01.010
Xie H., Zhou D., Shi H., Kong D., Li Y., Li F., et al. (2021). Lithospheric stretching-style variations and anomalous post-rift subsidence in the deep water sub-basins of the Pearl River Mouth Basin, northern South China Sea. Mar. Petroleum Geology 131, 105140. doi: 10.1016/j.marpetgeo.2021.105140
Yan C., Shi H., Li Y. (2018). Identification and accumulation control factors of natural gas hydrate and shallow gas in Baiyun Sag. Pearl River Mouth Basin. China Offshore Oil Gas 30, 25–32. doi: 10.11935/j.issn.1673-1506.2018.06.003
Yang S., Lei Y., Liang J., Holland M., Schultheiss P., Lu J., et al. (2017b) “Concentrated gas hydrate in the Shenhu Area, South China Sea: Results from drilling expeditions GMGS3 & GMGS4,” in Proceedings of 9th International Conference on Gas Hydrates, 25–30.
Yang J., Lu M., Yao Z., Wang M., Lu S., Qi N., et al. (2021). A geophysical review of the seabed methane seepage features and their relationship with gas hydrate systems. Geofluids 2021, 1–26. doi: 10.1155/2021/9953026
Yang X. Q., Shi X. B., Zhao J. F., Yu C. H., Gao H. F., Chen A. H., et al. (2018). Bottom water temperature measurements in the South China Sea, eastern Indian Ocean and western Pacific Ocean. J. Trop. Oceanography 37, 86–97. doi: 10.11978/2017113
Yang J., Wang X., Jin J., Li Y., Li J., Qian J., et al. (2017a). The role of fluid migration in the occurrence of shallow gas and gas hydrates in the south of the Pearl River Mouth Basin, South China Sea. Interpretation 5, SM1–SM11. doi: 10.1190/INT-2016-0197.1
Yang S., Zhang M., Liang J., Lu J., Zhang Z., Holland M., et al. (2015). Preliminary results of China’s third gas hydrate drilling expedition: a critical step from discovery to development in the South China Sea. Center Natural Gas Oil 412, 386–7614.
Yang S., Zhang H., Wu N., Su X., Schultheiss P., Holland M., et al. (2008). “High concentration hydrate in disseminated forms obtained in Shenhu area, North Slope of South China Sea”. In: Proceedings of the 6th International Conference on Gas Hydrates (ICGH 2008). (Canada). doi: 10.14288/1.0041052
Yao B. (1996). Tectonic evolution of the South China Sea in cenozoic. Mar. Geology Quaternary Geology 16, 1–13.
Yu K., Miramontes E., Alves T. M., Li W., Liang L., Li S., et al. (2021). Incision of submarine channels over pockmark trains in the South China Sea. Geophysical Res. Lett. 48 (24), e2021GL092861. doi: 10.1029/2021GL092861
Yu K., Lefebvre A., Li W., Zhan W., Miramontes E. (2023). Channel inception through bottom-current erosion of pockmarks revealed by numerical simulation. Earth Surface Processes Landforms 48, 2246–2259. doi: 10.1002/esp.v48.11
Zhang G., Cao J., Deng Y., Lai H., Jiang X., Fang Y., et al. (2023). A 209,000-year-old history of methane seepage activity controlled by multiple factors in the South China Sea. Mar. Petroleum Geology 151, 106200. doi: 10.1016/j.marpetgeo.2023.106200
Zhang G., Yang S., Zhang M., Liang J., Lu J., Melanie H., et al. (2014). GMGS2 expedition investigates rich and complex gas hydrate environment in the South China Sea. Fire Ice 14 (1), 1–5.
Zhang W., Liang J., Jing’an L., Jiangong W., Pibo S., Yunxin F., et al. (2017). Accumulation features and mechanisms of high saturation natural gas hydrate in Shenhu Area, northern South China Sea. Petroleum Explor. Dev. 44, 708–719. doi: 10.1016/S1876-3804(17)30082-4
Zhang W., Liang J., Wei J., Su P., Lin L., Huang W. (2019). Origin of natural gases and associated gas hydrates in the Shenhu area, northern South China Sea: Results from the China gas hydrate drilling expeditions. J. Asian Earth Sci. 183, 103953. doi: 10.1016/j.jseaes.2019.103953
Zhang W., Liang J., Wei J., Su P., Lin L., Huang W., et al. (2020a). Geological and geophysical features of and controls on occurrence and accumulation of gas hydrates in the first offshore gas-hydrate production test region in the Shenhu area, Northern South China Sea. Mar. Petroleum Geology 114, 104191. doi: 10.1016/j.marpetgeo.2019.104191
Zhang W., Liang J., Yang X., Su P., Wan Z. (2020b). The formation mechanism of mud diapirs and gas chimneys and their relationship with natural gas hydrates: insights from the deep-water area of Qiongdongnan Basin, northern South China Sea. Int. Geology Rev. 62, 789–810. doi: 10.1080/00206814.2018.1491014
Zhang Q., Wu D., Jin G., Xu X., Yang C., Liu L. (2022). Methane seep in the Shenhu area of the South China sea using geochemical and mineralogical features. Mar. Petroleum Geology 144, 105829. doi: 10.1016/j.marpetgeo.2022.105829
Zhang H., Yang S., Wu N., Su X., Holland M., Schultheiss P., et al. (2007). Successful and surprising results for China’s first gas hydrate drilling expedition. Fire Ice: Methane Hydrate Newslett. 7, 6–9.
Zhao Z. X., Qiu N., Sun Z., Yan W., Long G. Y., Li P. C., et al. (2023b). Spatial distribution and inventory of natural gas hydrate in the Qiongdongnan Basin, northern South China Sea. J. Oceanology Limnology 41, 729–739. doi: 10.1007/s00343-022-2106-1
Zhao Z., Sun Z., Qiu N., Zhao M., Zhang J., Li F., et al. (2023a). The paleo-lithospheric structure and rifting-magmatic processes of the northern South China Sea passive margin. Gondwana Res. 120, 162–174. doi: 10.1016/j.gr.2022.06.015
Zhao Z.-X., Sun Z., Xie H., Yan C.-Z., Li Y.-P. (2011). Baiyun deepwater Cenozoic subsidence and lithospheric stretching deformation. Chin. J. Geophysics 54, 3336–3343. doi: 10.3969/j.issn.0001-5733.2011.12.031
Zhou D., Sun Z., Liao J., Zhao Z., He M., Pang W. X. (2009). Filling history and post-breakup acceleration of sedimentation in Baiyun Sag, deepwater northern South China Sea. J. Earth Sci. 20, 160–171. doi: 10.1007/s12583-009-0015-2
Zhou W., Wang Y., Gao X., Zhu W., Xu Q., Xu S., et al. (2015). Architecture, evolution history and controlling factors of the Baiyun submarine canyon system from the middle Miocene to Quaternary in the Pearl River Mouth Basin, northern South China Sea. Mar. petroleum Geology 67, 389–407. doi: 10.1016/j.marpetgeo.2015.05.015
Zhu Y., Huang X., Fu S., Su P. (2013). Gas sources of natural gas hydrates in the Shenhu Drilling Area, South China Sea: geochemical evidence and geological analysis. Acta Geologica Sinica-English Edition 87, 767–776. doi: 10.1111/1755-6724.12088
Keywords: gas hydrate stability zone, submarine canyons, gas hydrate decomposition, Baiyun deepwater area, Pearl River Mouth Basin
Citation: Pan H, Xie H, Zhao Z, Liu J, Jiang G, Li R, Li Y, Lee EY and Yan W (2025) Quaternary gas hydrate dissociation promotes the formation of Shenhu Canyon Group in the South China Sea. Front. Mar. Sci. 12:1530207. doi: 10.3389/fmars.2025.1530207
Received: 18 November 2024; Accepted: 20 February 2025;
Published: 13 March 2025.
Edited by:
Pengfei Ma, Tongji University, Shanghai, ChinaReviewed by:
Zhilei Sun, Qingdao Institute of Marine Geology (QIMG), Qingdao, ChinaCopyright © 2025 Pan, Xie, Zhao, Liu, Jiang, Li, Li, Lee and Yan. This is an open-access article distributed under the terms of the Creative Commons Attribution License (CC BY). The use, distribution or reproduction in other forums is permitted, provided the original author(s) and the copyright owner(s) are credited and that the original publication in this journal is cited, in accordance with accepted academic practice. No use, distribution or reproduction is permitted which does not comply with these terms.
*Correspondence: Hui Xie, eGllaHVpaGFvYmFAMTYzLmNvbQ==; Zhongxian Zhao, enh6aGFvQHNjc2lvLmFjLmNu
Disclaimer: All claims expressed in this article are solely those of the authors and do not necessarily represent those of their affiliated organizations, or those of the publisher, the editors and the reviewers. Any product that may be evaluated in this article or claim that may be made by its manufacturer is not guaranteed or endorsed by the publisher.
Research integrity at Frontiers
Learn more about the work of our research integrity team to safeguard the quality of each article we publish.