 Bokun Chen
 Hui Song
 Ge Xu3
 Gang Li
- 1Institute of Marine Science and Technology, Shandong University, Qingdao, China
- 2Qingdao Key Laboratory of Ocean Carbon Sequestration and Negative Emission Technology, Shandong University, Qingdao, China
- 3Marine Environmental Monitoring Centre of Ningbo, East China Sea Bureau of Ministry of Natural Resources, Ningbo, China
- 4Daya Bay Marine Biology Research Station, South China Sea Institute of Oceanology, Chinese Academy of Sciences, Guangzhou, China
The positive or negative effect of a decrease in dissolved O2 on the photophysiology of phytoplankton is determined by the duration of light exposure. To uncover the underlying mechanisms, the marine model diatom Thalassiosira pseudonana was cultured under three dissolved O2 levels (8.0 mg L-1, ambient O2; 4.0 mg L-1, low O2; and 1.3 mg L-1, hypoxia) to compare its growth, cell composition, and physiology between the light and dark periods. The results showed that the growth rate under ambient O2 was 0.60 ± 0.02 day-1, which was half of the growth rate during light period and 15-fold of the growth rate during dark period. Decreasing O2 increased the growth rate during light period but decreased it during dark period and decreased the cell pigment content in both the light and dark periods. In the light, low O2 increased cell carbon (C) content, while hypoxia decreased it, with the degree of increase and decrease being greater in the dark. Low O2 had no significant effect on cell nitrogen (N) content, but hypoxia decreased it. Low O2 had no significant effect on photosynthetic efficiency but decreased the dark respiration rate. In darkness, low O2 had no significant effect on cell C loss rate but decreased N loss rate, leading to an increase in the POC/PON ratio. In addition, hypoxia exacerbated cell mortality and sinking, suggesting that diatom-derived carbon burial may be accelerated due to marine deoxygenation in the future.
1 Introduction
Deoxygenation in global marine ecosystems is increasing in scope and severity due to anthropogenic activities and climate change (Keeling et al., 2010). According to Breitburg et al. (2018), the total dissolved O2 (DO) content in the ocean has decreased by 2% in recent decades (Breitburg et al., 2018) and will decrease by a further 1% to 7% by the end of this century (Long et al., 2016; Schmidtko et al., 2017), leading to a sharp increase in the frequency and severity of marine hypoxia (dissolved O2 <2.0 mg L−1) (Schmidtko et al., 2017; Rabalais and Turner, 2019; Wang et al., 2023). Hypoxia affects most marine aerobic organisms through inhibiting visual function, reproduction, and population development (e.g., McCormick and Levin, 2017; Wang et al., 2016) and the photoautotrophic macroalgae through photosystem (e.g., Peckol and Rivers, 1995; Alamoudi et al., 2022) and seagrasses through chlorophyll (e.g., Che et al., 2022). Recently, many field studies have shown that marine phytoplankton that dwell in hypoxic zones are also experiencing the low O2 level occasionally (Li et al., 2018; Sun et al., 2022) or permanently (Gomes et al., 2014; Xiang et al., 2019); therefore, many laboratory experiments have been conducted to explore how hypoxia affects phytoplankton (Chen et al., 2021; Zhao et al., 2022; Eom et al., 2024; Chen et al., 2024; Tong et al., 2024). One of the reasons for this widespread interest is that phytoplankton, apart from their important role as the main primary producer in the ocean, require exogenous O2 to maintain respiratory metabolism at night (Li et al., 2016), although this challenge can be met by photosynthesis during the day.
Although marine phytoplankton contribute to about half of the global photosynthetic O2 (Field et al., 1998), the death of extensively bloomed phytoplankton often accelerates the formation of hypoxic environments in the water column through O2 depletion by increasing respiration themselves and the nitrification of microbes supported by organic matter released by the phytoplankton cells (Chen et al., 2007). In this scenario, phytoplankton are also affected by the lowered O2 level when they fall into the O2-deficient layer due to their own sinking or vertical mixing of the water column, especially in the shallower coastal or estuarine regions (Li et al., 2018; Zhai et al., 2021). Theoretically, lowering O2 level benefits photoautotrophic organisms as it increases the likelihood of CO2 molecules binding to ribulose-1, 5-bisphosphate carboxylase/oxygenase (RubisCO) (Gao and Campbell, 2014). It is therefore generally believed that lowering O2 can promote the photosynthetic production of phytoplankton cells (Pruder and Bolton, 1980; Raven and Larkum, 2007) and decrease the consumption of the photosynthates by mitochondrial respiration (Reinfelder et al., 2000; Giordano et al., 2005), allowing them to store more products for growth (Sun et al., 2022). On the other hand, lowering O2 levels is known to decrease the production of harmful reactive oxygen species (ROS) which often inactivate many cellular enzymes and thus block the cell growth (Pérez-Pérez et al., 2012). However, many studies demonstrated the negative effects of lowered O2 on phytoplankton, such as decreasing the cell size and cell growth of diatoms (Wu et al., 2012; Zhao et al., 2022), decreasing the cell carbon content of coccolithophores (Tong et al., 2024) and increasing the cell mortality of dinoflagellates (Eom et al., 2024). An inhibitory effect of lowering O2 was also observed on cellular nitrogen metabolism (Chen et al., 2023) and calcification (Tong et al., 2024). These results indeed illustrate the effects of lowering O2 on phytoplankton physiology but are highly contradictory.
Phytoplankton, like heterotrophic organisms, require exogenous O2 to sustain their respiration at night. Therefore, the duration of light exposure together with light intensity has been found to influence the responses of phytoplankton to a decrease in O2, such as the increase in growth of the diatom Thalassiosira pseudonana at short photoperiod or low light intensity, while the growth decreases inversely at long photoperiod or high light intensity (Chen et al., 2021, 2023, 2024). These studies mainly focused on the effects of lowered O2 in the light state and neglected the effects in the dark that phytoplankton often experience in nature, including the rhythmic dark state due to the Earth’s rotation or the long-term darkness when sinking out of the euphotic layer. To address this gap, we cultured a representative diatom, Thalassiosira pseudonana, under three O2 levels (8.0, 4.0, and 1.3 mg L-1) and comparatively studied its physiochemical differences between the light and dark periods, with emphasis to the changes in biochemical composition and sinking rate of cells during a long-term darkness (84 h). We selected this diatom as a target species because it is one of the dominant groups in hypoxic zones (Gomes et al., 2014; Xiang et al., 2019; Sun et al., 2022), and it can also serve as food to enhance the survival of heterotrophs in hypoxic environments (Eom et al., 2024). On the other hand, the diatoms have siliceous shells that allow them to settle more easily into the deep layer in nature and encounter low O2 (Bannon and Campbell, 2017).
2 Materials and methods
2.1 Culture protocol
In this study, the centric diatom Thalassiosira pseudonana (CCMP 1335), originally from the Provasoli-Guillard National Center of Marine Phytoplankton (NCMP), was cultured semi-continuously with 400 mL of sterilized enriched artificial seawater (EASW, NO3- 550 μM and PO43- 23 μM) (Berges et al., 2001) in a 500-mL conical flask at 18°C in a plant growth chamber (Zhichu, Shanghai, China). The growth light in the chamber was set to 150 μmol photons m-2 s-1 with a 12:12 light/dark cycle. This light intensity is approximately the optimal growth light for T. pseudonana (Chen et al., 2023, 2024; Li et al., 2018) and was measured using a microspherical quantum sensor (Hansatech, Norfolk, UK) in a culture flask filled with medium. During cultivation, commercially produced air (Qingdao Jinpeng Gas, Qingdao, China) was gently bubbled in the cultures with three O2 concentrations to maintain dissolved O2 (DO) at 8.0 ± 0.65 (ambient O2), 4.0 ± 0.31 (low O2), and 1.3 ± 0.21 mg L−1 (hypoxia), respectively (Chen et al., 2021, 2023, 2024). These DO concentrations cover a range of O2 concentrations in natural hypoxia zones (Li et al., 2018; Xiang et al., 2019) and were measured using an optode sensor controlled by the Oxygen Logger software (PyroScience, Aachen, Germany). For each treatment, three replicates were used. Considering the shock effects of the changes in temperature and DO on cell’s physiology during medium replacement, the initial medium was kept in the chamber and pre-bubbled with an air stream filtered through a 0.2-µm micro-filter before bubbling into the cultures.
To determine the different responses of T. pseudonana to lowered O2 levels during day and night, aliquots of the cultures were taken at the end of cultivation at the beginning (8:00 a.m.) and at the end of illumination (20:00 p.m.) to determine cell composition and physiological parameters as described below.
2.2 Growth rate
During cultivation, 3.0 mL of culture was taken from each flask every morning (8:00 a.m.) before and after replacing with fresh medium and taken again at the end of illumination (20:00 p.m.). The optical density of each sample was measured at 680 nm (OD680) using a molecular device (BioTec, Dorset, UK). The growth rate of total (8:00 a.m. to next 8:00 a.m.) and during the light (8:00 a.m. to 20:00 p.m.) and dark periods (20:00 p.m. to next 08:00 a.m.) was calculated as follows:
where N1 and N0 represent the OD680 at time T1 and T0, respectively.
During cultivation, chlorophyll a concentration (Chl a) in the cultures was maintained at 0.40–0.95 μg mL-1. After nine generations of cultivation, aliquots of the cultures were taken to measure the physio-chemical parameters of T. pseudonana and then harvested for measurement of cell composition and physiological parameters as described below.
2.3 Cell compositions
To measure the cell number, duplicate 5-mL cultures were taken from each flask after gentle shaking and fixed with glutaraldehyde to a final concentration of 1%. The cell number was then counted using a flow cytometer (Becton-Dickinson, Franklin Lakes, USA).
To measure the cell pigments, 30 mL of culture was vacuum-filtered onto a Whatman GF/F glass fiber filter (25 mm in diameter) and extracted with 4 mL of 90% acetone (v/v) saturated with magnesium carbonate overnight at 4°C in the dark. After centrifugation for 10 min (10,000 g), the optical absorbance of the supernatant was measured spectrophotometrically at 470, 630, 645, 664, and 750 nm. The concentration of Chl a and carotenoids (Car) (μg mL−1) was calculated as follows:
To measure the content of particle organic carbon (POC) and nitrogen (PON), 30 mL of cultures was filtered onto a pre-combusted (450°C, 5 h) Whatman GF/F filter. The filters containing the cells were exposed to HCl fumes for 3 h, freeze-dried for 24 h, and stored in a desiccator for later analysis. The N and C content was measured using an elemental analyzer (NC Technologies, Marseille, France) with a detection limit for C of 0.002 mg (R2 > 0.99) and for N of 0.005 mg (R2 > 0.99), respectively. In addition, triplicate 50 mL medium was filtrated on the pre-combusted GF/F filters, dried, and measured as a blank, which was subtracted for the POC and PON calculation.
2.4 Photosynthetic parameters
To measure chlorophyll fluorescence, 5 mL of culture was taken from each flask and dark-acclimated for 15 min at growth temperature in the cuvette of a portable fluorometer (AquaPen-C, Photon Systems Instruments, Czech Republic), followed by measurement of maximum (FM) and minimum fluorescence (FO) with a saturating light pulse (3,000 μmol photons m−2 s−1, 1 s). The maximum photochemical quantum yield (FV/FM) of Photosystem II (PSII) was calculated as follows:
Meanwhile, the relative electron transport rate (rETR) in actinic light of 0, 10, 20, 50, 100, 300, and 500 μmol photon m−2 s−1 was determined to obtain the rapid light curve (RLC) as follows:
where FM′ and Ft are maximum and instantaneous fluorescence under each of the seven actinic lights. The photosynthetic parameters derived from the RLC, i.e., light utilization efficiency (α), maximum rETR (rETRmax), and saturation irradiance (EK, μmol photons m−2 s−1), were calculated as follows:
where a, b, and c are adjusted parameters.
To measure the rate of photosynthetic O2 evolution, 5 mL of culture was taken from each flask and dark-acclimated for 5 min at 18°C, followed by measurement of changes in O2 concentration in growth light and in the dark using a liquid oxygen electrode (Chlorolab 2, Hansatech Instrument Ltd., UK). The cell-based photosynthetic O2 rate (Pn, fmol O2 cell−1 min−1) and respiration rate (Rd, fmol O2 cell−1 min−1) was calculated by normalizing the O2 increase/decrease rate to cell concentration.
2.5 Sinking rate
To investigate how T. pseudonana responds to lowered O2 in the dark, we supplemented the remaining cultures with fresh media to 400 mL at the end of 12:12 L/D cultivation and continued cultivating. During the cultivation, samples were taken after 0, 12, 24, 36, 48, 60, 72, and 84 h to measure the cell number and C/N content, and the sinking rate (5 mL) was determined at 0, 48, and 84 h.
The rate of sinking was determined using an innovative method described in detail in Bannon and Campbell (2017) based on changes in Chl a fluorescence monitored using a molecular device (Cytation5, BioTek, USA). In brief, the collected sample was placed in a 12-well plate (3 mL per well with a depth of 10 mm), which was placed in the molecular device. Fluorescence (excitation: 445 nm, emission: 680 nm) was measured with the photodiode detector from the top of each well every 0.5 h for a total duration of 4 h. As the cells sank, the fluorescence signal decreased from the initial maximum value to the final minimum value according to the inverse square law and did not change after the cells reached the bottom of the well. Thus, we can collect the relative fluorescence (RFU) of nine detected time-point (RFUt) and scale them as follows:
where RFU′ is the scaled RFUt. Due to the shielding effect between the cells, the RFU′ mainly refers to the uppermost cells, which sink to the bottom of the well according to the inverse square law:
where t is the elapsed time of cell sinking and s is the scaled sinking rate. We can further simplify the formulation by geometric series as follows:
where sqrt is the square root. The resulting linear formulation can finally be coupled with the well depth (10 mm) and the measurement time (4 h) to determine the actual sinking velocity (cm day-1).
2.6 Statistical analysis
Data were presented as mean and standard deviations (mean ± SD) in the figures. Paired t-test, one-way analyses of variance (ANOVA) with Tukey post-tests (Prism 10, Graphpad software), and comparisons of linear curve fits were used to detect the significant difference between the cultures of combined O2 levels and growth light/dark conditions. The confidence level for statistical test was set at 0.05.
3 Results
The growth rate of T. pseudonana of total and during the light and dark periods is shown in Figure 1. The total growth rate under ambient O2 was 0.60 ± 0.02 day-1 and showed no significant difference from that under low O2 (p = 0.29), while it was decreased by 15% by hypoxia. Under ambient O2, the growth rate during light period was about two times the total growth rate, but the growth rate during dark period was only 6% of the total growth rate. Comparing to ambient O2, the growth rate during light period was increased by 10% by low O2 (p < 0.05) but showed no significant effect by hypoxia, while the growth rate during dark period was significantly decreased by both low O2 and hypoxia (p < 0.01).
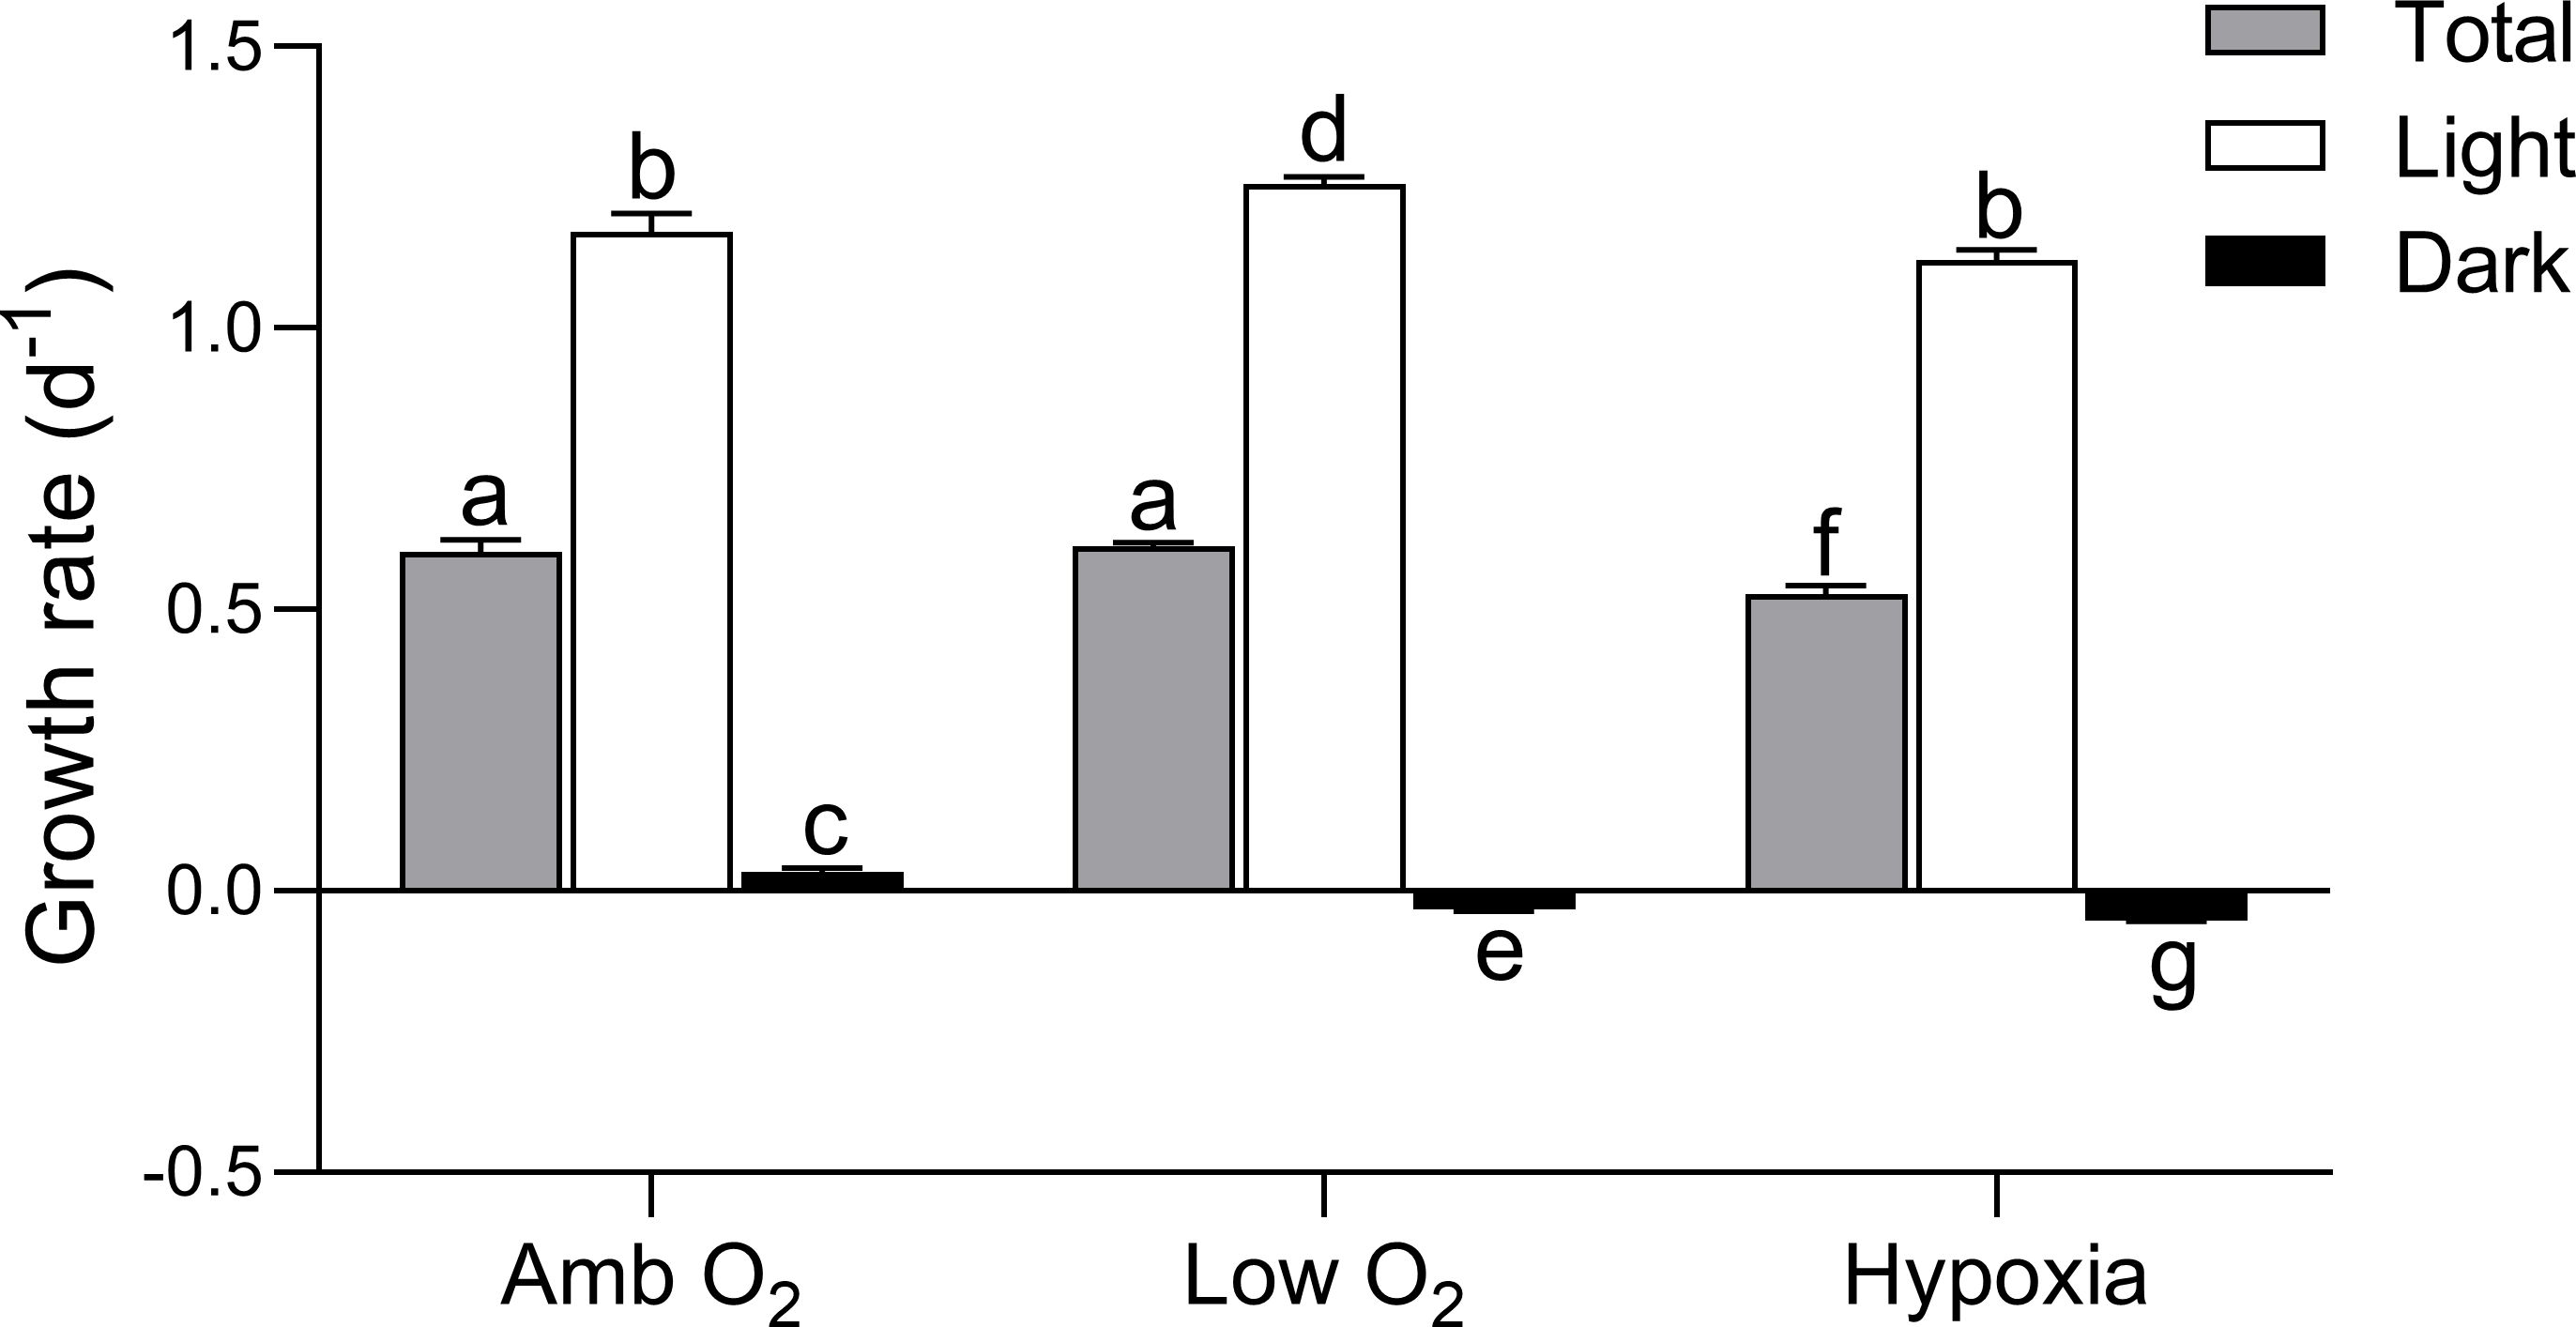
Figure 1. Cell growth rate (day−1) of T. pseudonana grown under ambient O2, low O2, and hypoxia during the total, light, and dark periods. The vertical bar shows one standard deviation of three growth determinations on independently grown cultures (n = 3), and different letters on the top of the bars indicate significant differences (p < 0.05).
During the light period, cellular Chl a content under ambient O2 was 0.41 ± 0.02 pg cell-1 and was decreased by 7% and 20% by low O2 and hypoxia, respectively (Figure 2A). Chl a content under ambient O2 during the dark period was 20% lower than that during the light period and was further decreased by 12% and 26% by low O2 and hypoxia, respectively (Figure 2A). Car content was 0.41 ± 0.02 pg cell-1 under ambient O2 and showed a similar trend of lowered O2 effect as Chl a during both light and dark periods (Figure 2B). POC content during the light period was 10.7 ± 0.14 pg cell-1 under ambient O2, being increased by 15% by low O2 but decreased by 15% by hypoxia. The POC in the dark period was 20% lower than that in the light period and was increased by 21% by low O2 but decreased by 17% by hypoxia (Figure 2C). By contrast, the PON content during light (i.e., 1.30 ± 0.09 pg cell-1) and dark periods (i.e., 0.95 ± 0.09 pg cell-1) showed no significant difference between ambient and low O2 treatment (light period: p = 0.27; dark period: p = 0.33) (Figure 2D). However, the PON was decreased by 21% and 33% by hypoxia during the light and dark periods, respectively.
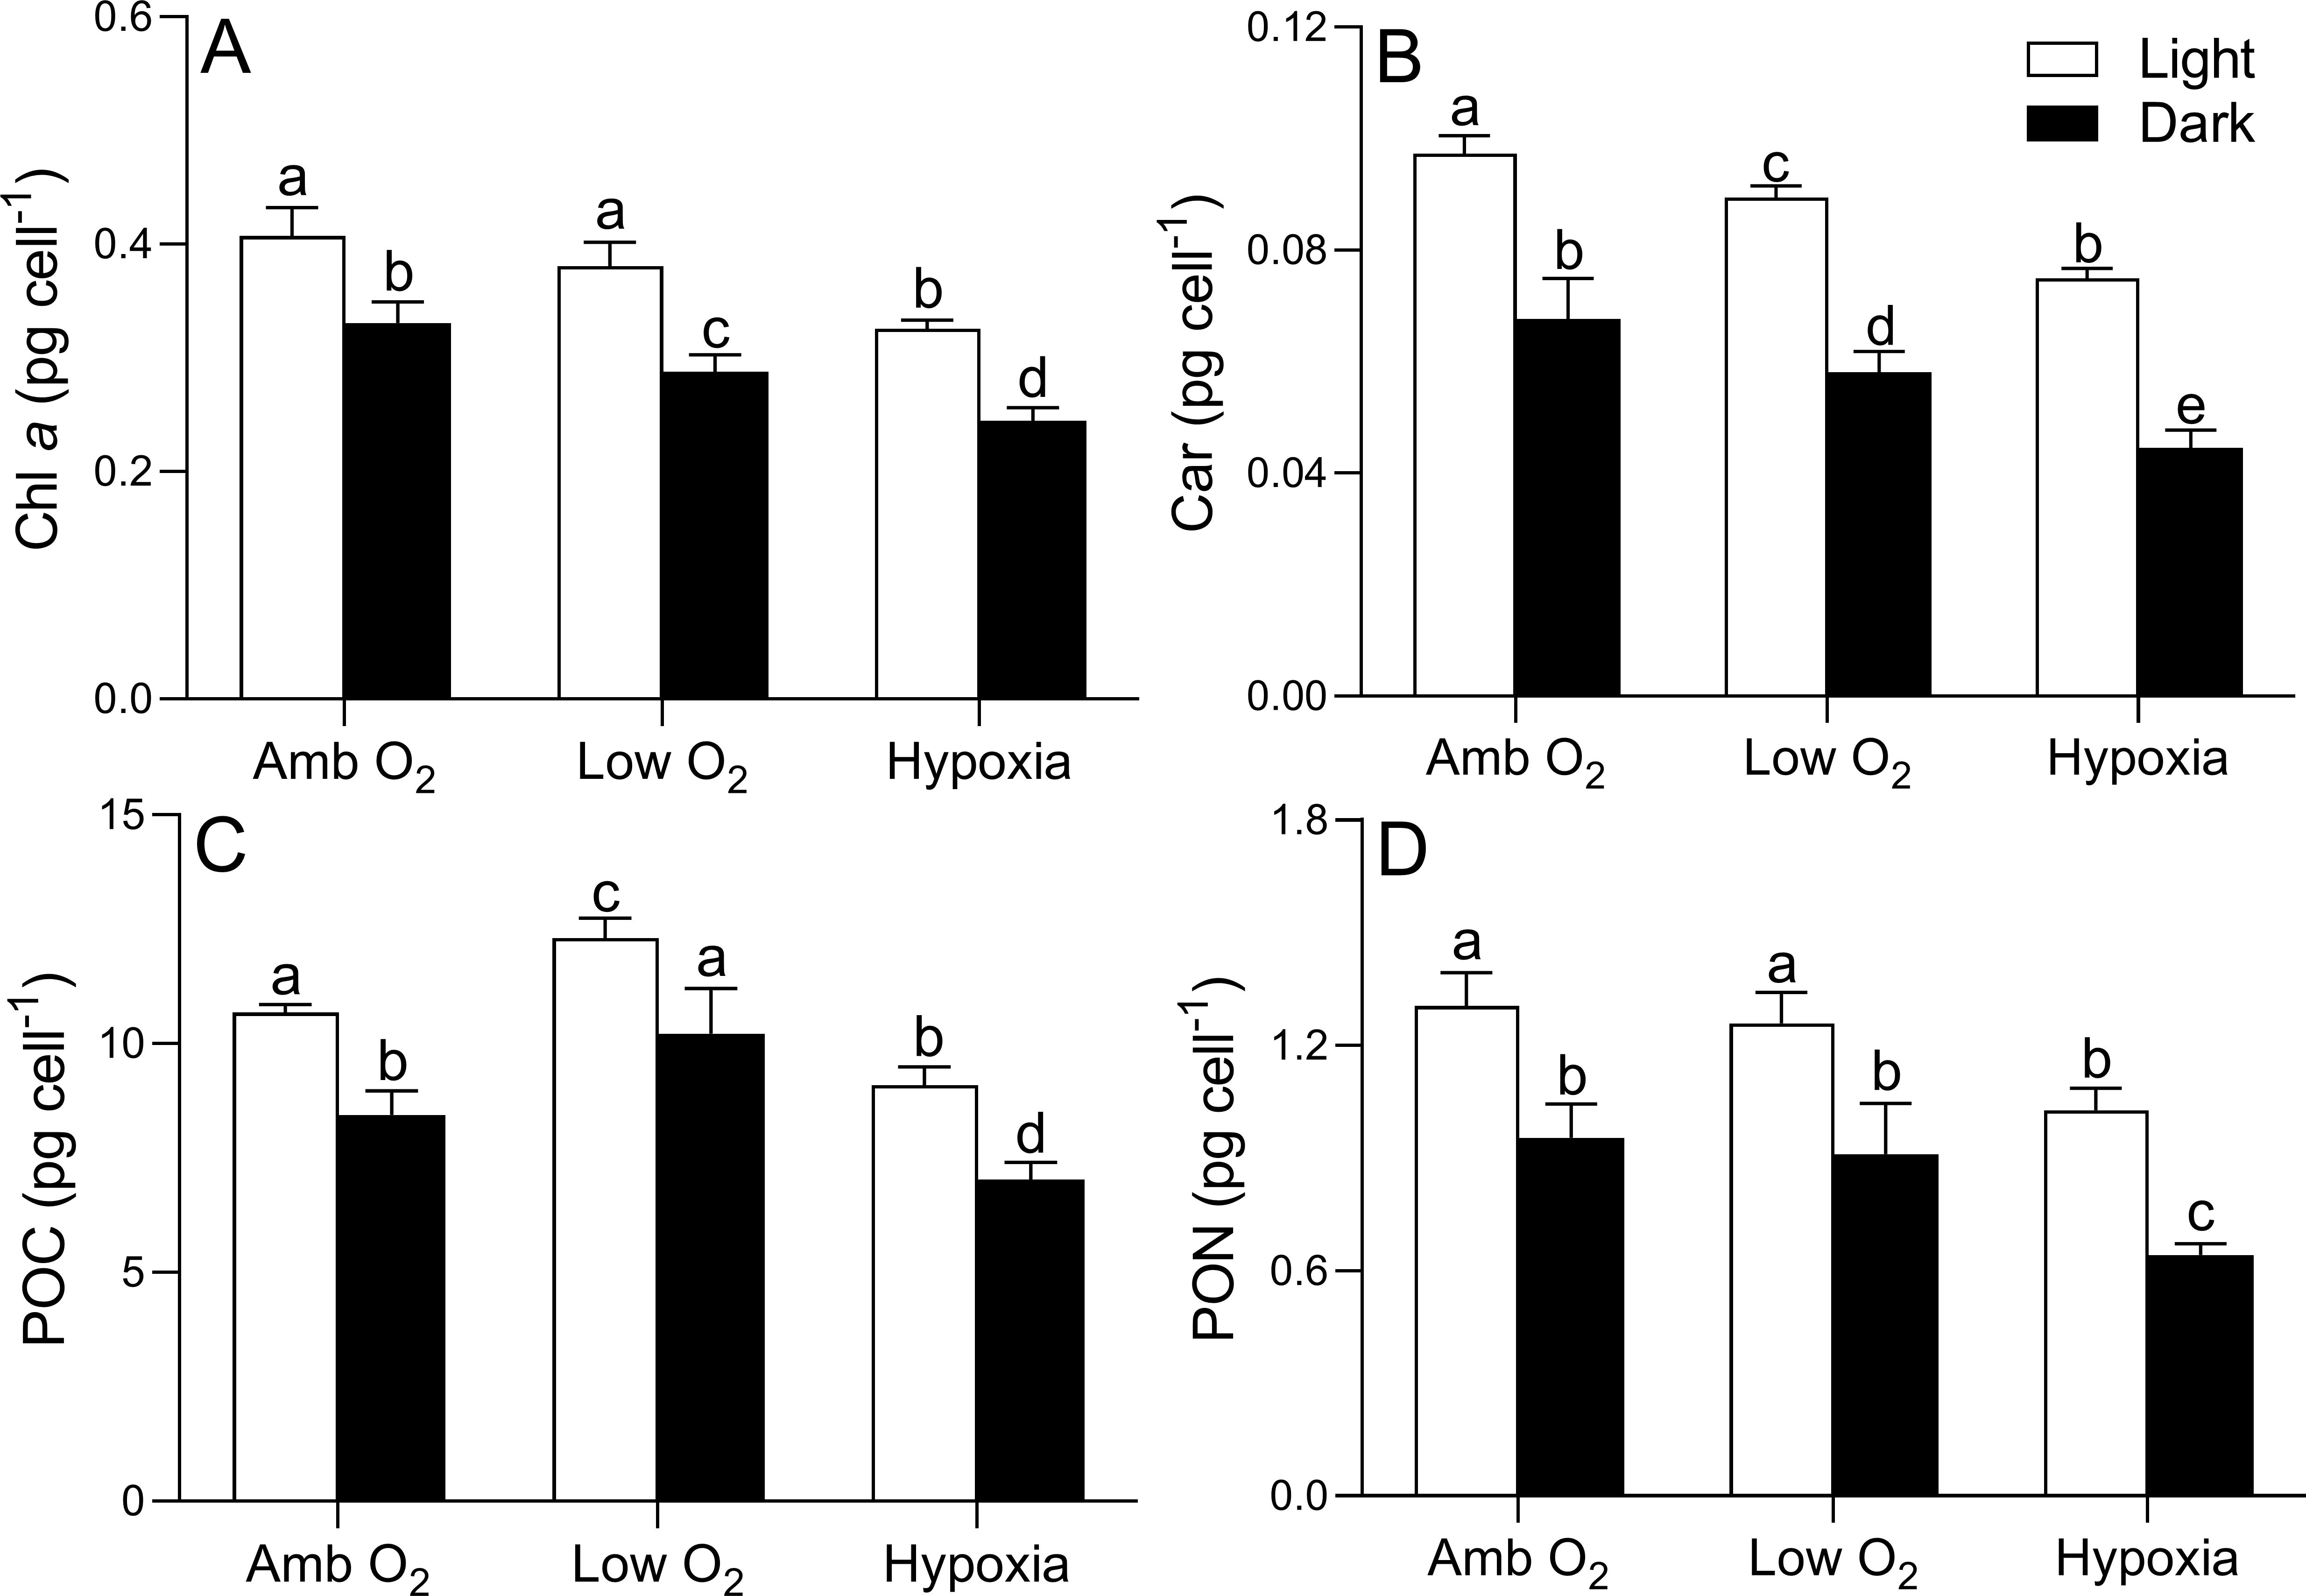
Figure 2. Cellular content (pg cell-1) of chlorophyll a (Chl a, A), carotenoid (Car, B), particulate organic carbon (POC, C), and particulate organic nitrogen (PON, D) of T. pseudonana grown under ambient O2, low O2, and hypoxia during the light and dark periods. The vertical bar shows one standard deviation of three growth determinations on independently grown cultures (n = 3), and different letters on the top of the bars indicate significant differences (p < 0.05).
The maximum photochemical quantum yield (FV/FM) of PSII of T. pseudonana was 0.65 ± 0.01 and 0.73 ± 0.01 during the light and dark periods, respectively, and showed no significant effect of lowering O2 (one-way ANOVA, F2,6 = 2.33, p = 0.18) (Figure 3A), although the negative effects by lowering O2 on the RLC-derived light utilization efficiency (α), maximum relative electron transport rate (rETRmax), and saturation light (EK) occurred under both light and dark conditions (Table 1). However, the photosynthetic O2 evolution rate (Pn, 2.13 ± 0.09 fmol O2 cell-1 min-1) under growth light was reduced by 11% and 26% by low O2 and hypoxia, respectively (Figure 3B). The dark respiration rate (Rd) was 0.58 ± 0.04 and 0.45 ± 0.02 fmol O2 cell-1 min-1 under growth light and dark conditions, respectively, and decreased with lowering O2 in both light and dark conditions (Figure 3C).
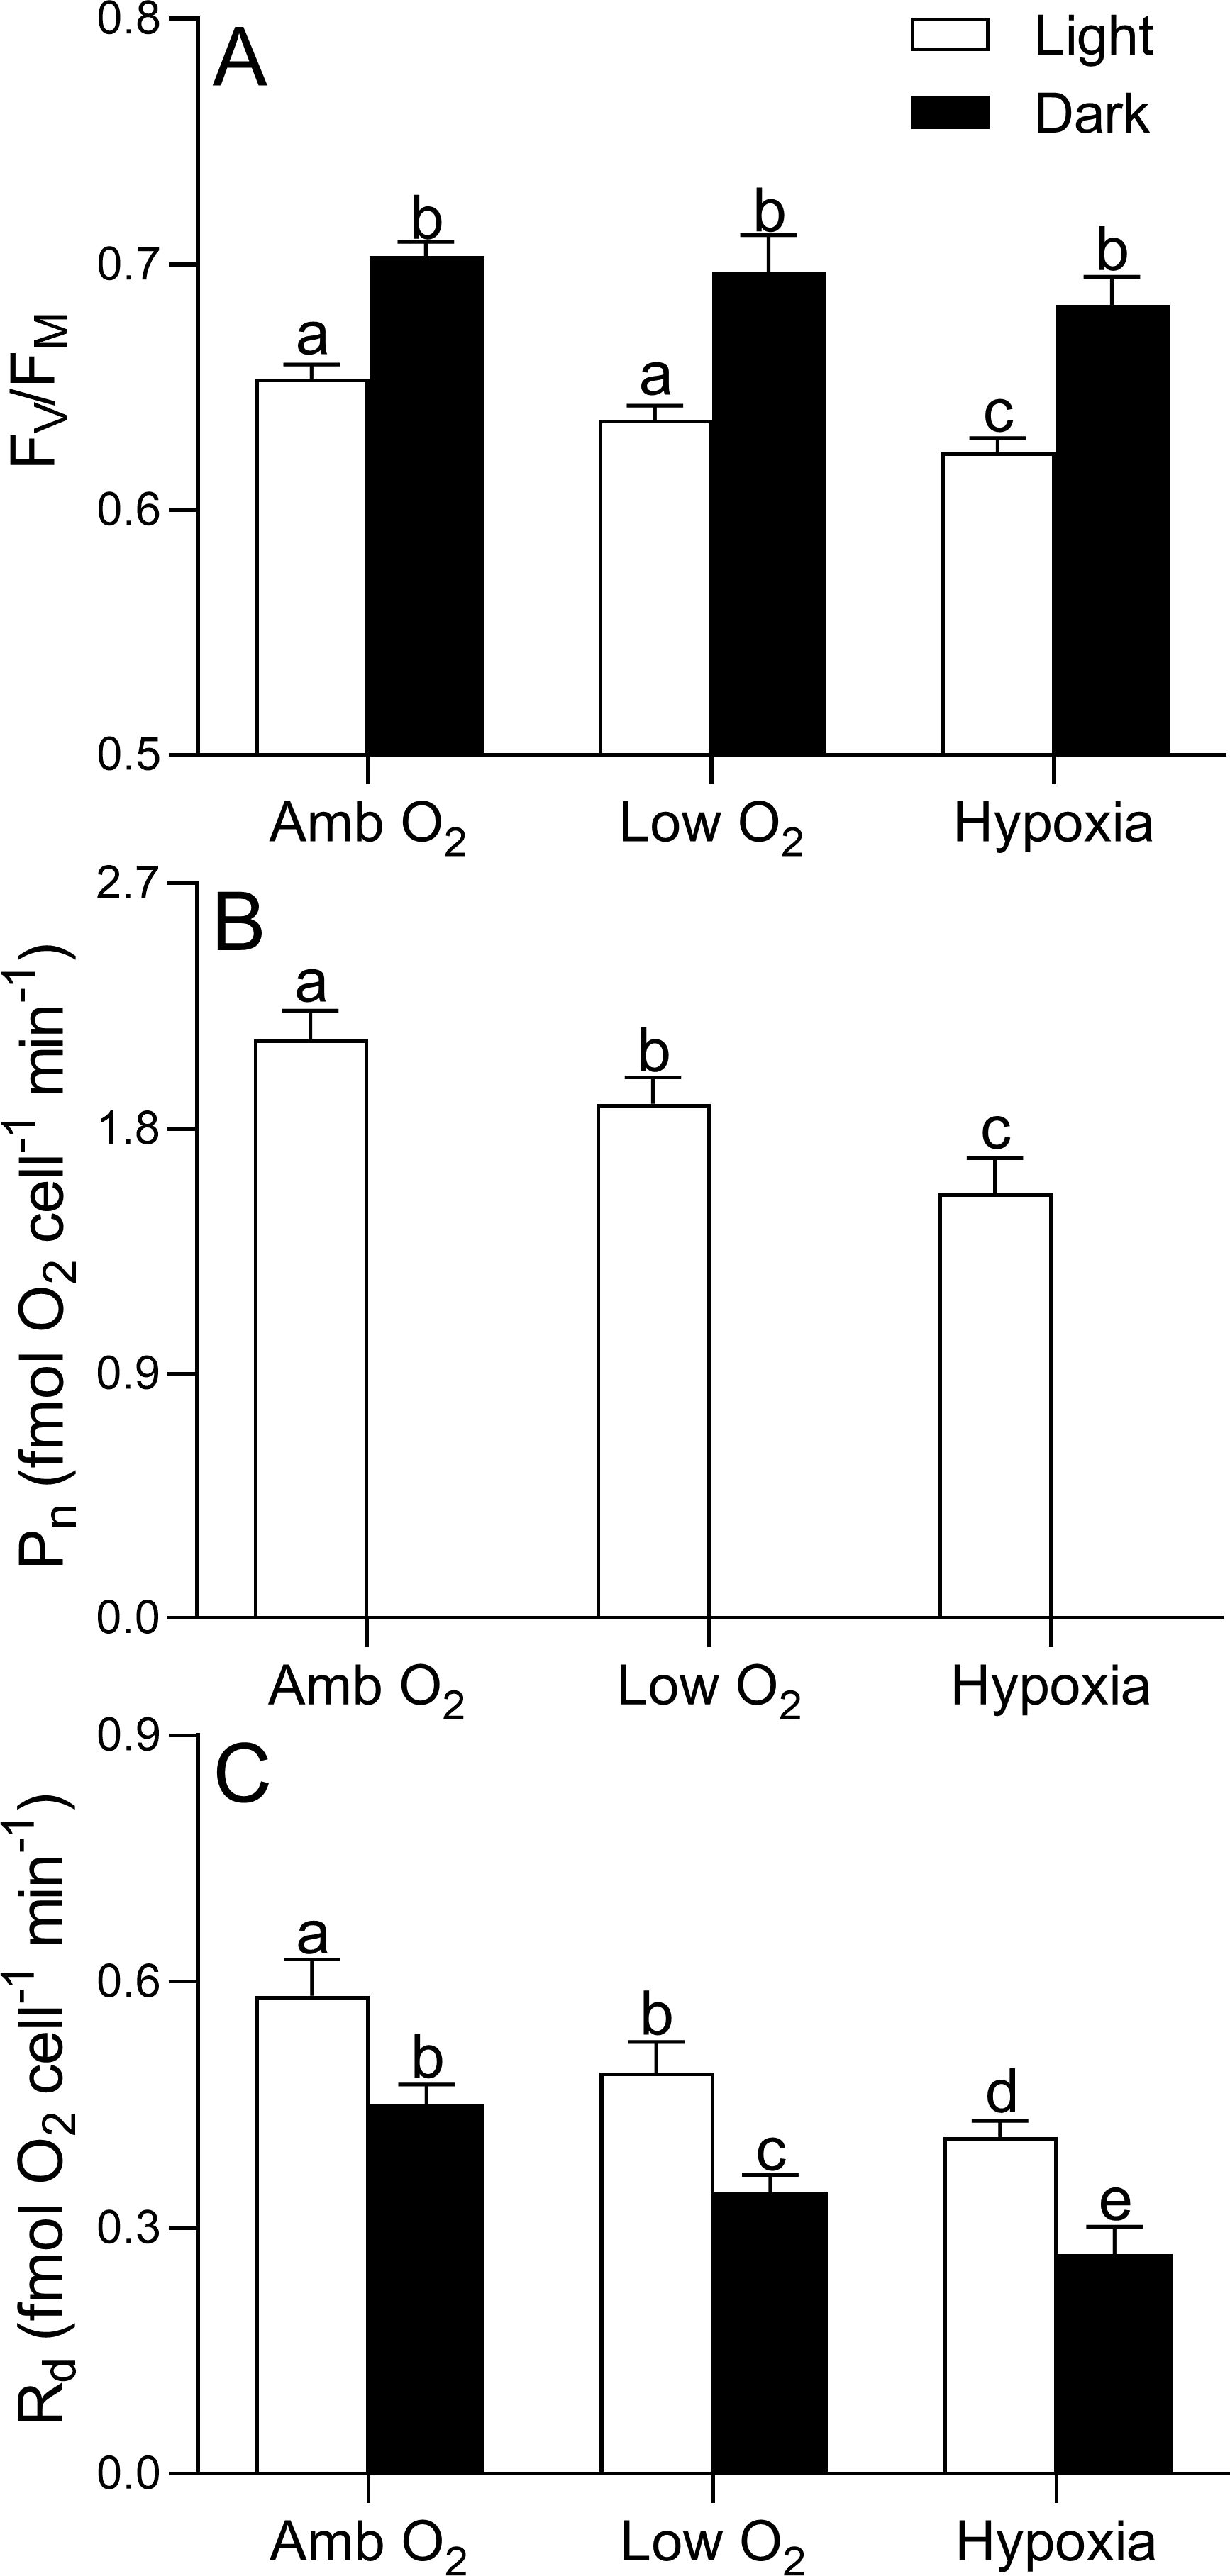
Figure 3. Maximal photochemical quantum yield of PSII (FV/FM, A) and the ratio (fmol O2 cell-1 min-1) of photosynthetic O2 evolution (Pn, B) and dark respiration (Rd, C) of T. pseudonana grown under ambient O2, low O2, and hypoxia during the light and dark periods. The vertical bar shows one standard deviation of three growth determinations on independently grown cultures (n = 3), and different letters on the top of the bars indicate significant differences (p < 0.05).
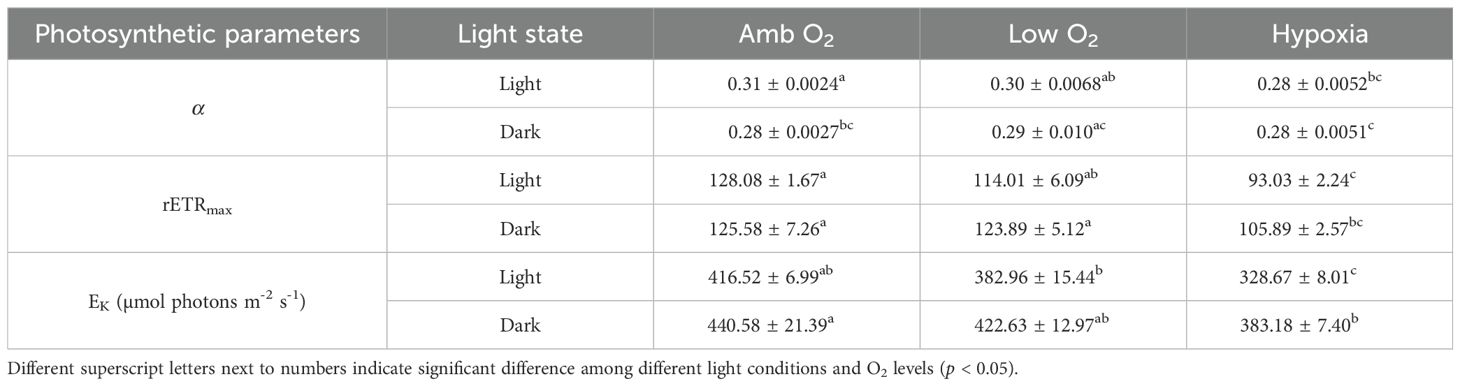
Table 1. Photosynthetic parameters derived from rapid light curve (RLC), i.e., light utilization efficiency (α, slope), maximum relative electron transfer rate (rETRmax), and saturation irradiance (EK, µmol photons m−2 s−1) of diatom Thalassiosira pseudonana grown under light and dark conditions at ambient O2, low O2, and hypoxia.
To study the metabolism of diatoms that had dropped out of the euphotic zone, we cultured T. pseudonana in the dark for 84 h (Figure 4). At ambient O2, the cell density decreased from 1,678 ± 56 to 513 ± 95 cell mL-1 from T0 to T84, with a cell mortality rate of 14 cell mL-1 h-1 (Figure 4A). Low O2 significantly reduced the mortality rate by 30%, while hypoxia exacerbated it by 40%. At ambient O2, cellular carbon content (POC) decreased from 10.4 ± 0.97 to 4.34 ± 0.29 pg cell-1 from T0 to T84, with a C loss rate of 0.066 pg cell-1 h-1 (Figure 4B), while nitrogen content (PON) decreased from 1.14 ± 0.05 to 0.33 ± 0.03 pg cell-1, with a N loss rate of 0.011 pg cell-1 h-1 (Figure 4C). Lowering O2 showed no significant effect on the C loss rate (F = 0.39, p = 0.68) but significantly decreased the N loss rate (F = 3.65, p = 0.031) (Figure 4C). In addition, a greater decrease in C loss rate than N loss rate led to an increase in the POC/PON ratio with the duration of dark time (Figure 4D). At T0, T48, and T84, cells at ambient O2 settled in a rate of 4.88 ± 0.07, 5.12 ± 0.08, and 5.88 ± 0.19 cm day-1, respectively (Figure 5). Low O2 showed no significant effect on sinking rate at T0 and T48 but decreased it by 10% at T84; hypoxia, however, increased the sinking rate by 13%. In addition, there was an interactive effect of lowered O2 and dark duration on the cell sinking rate (two-way ANOVA, F4,12 = 15.68, p < 0.01).
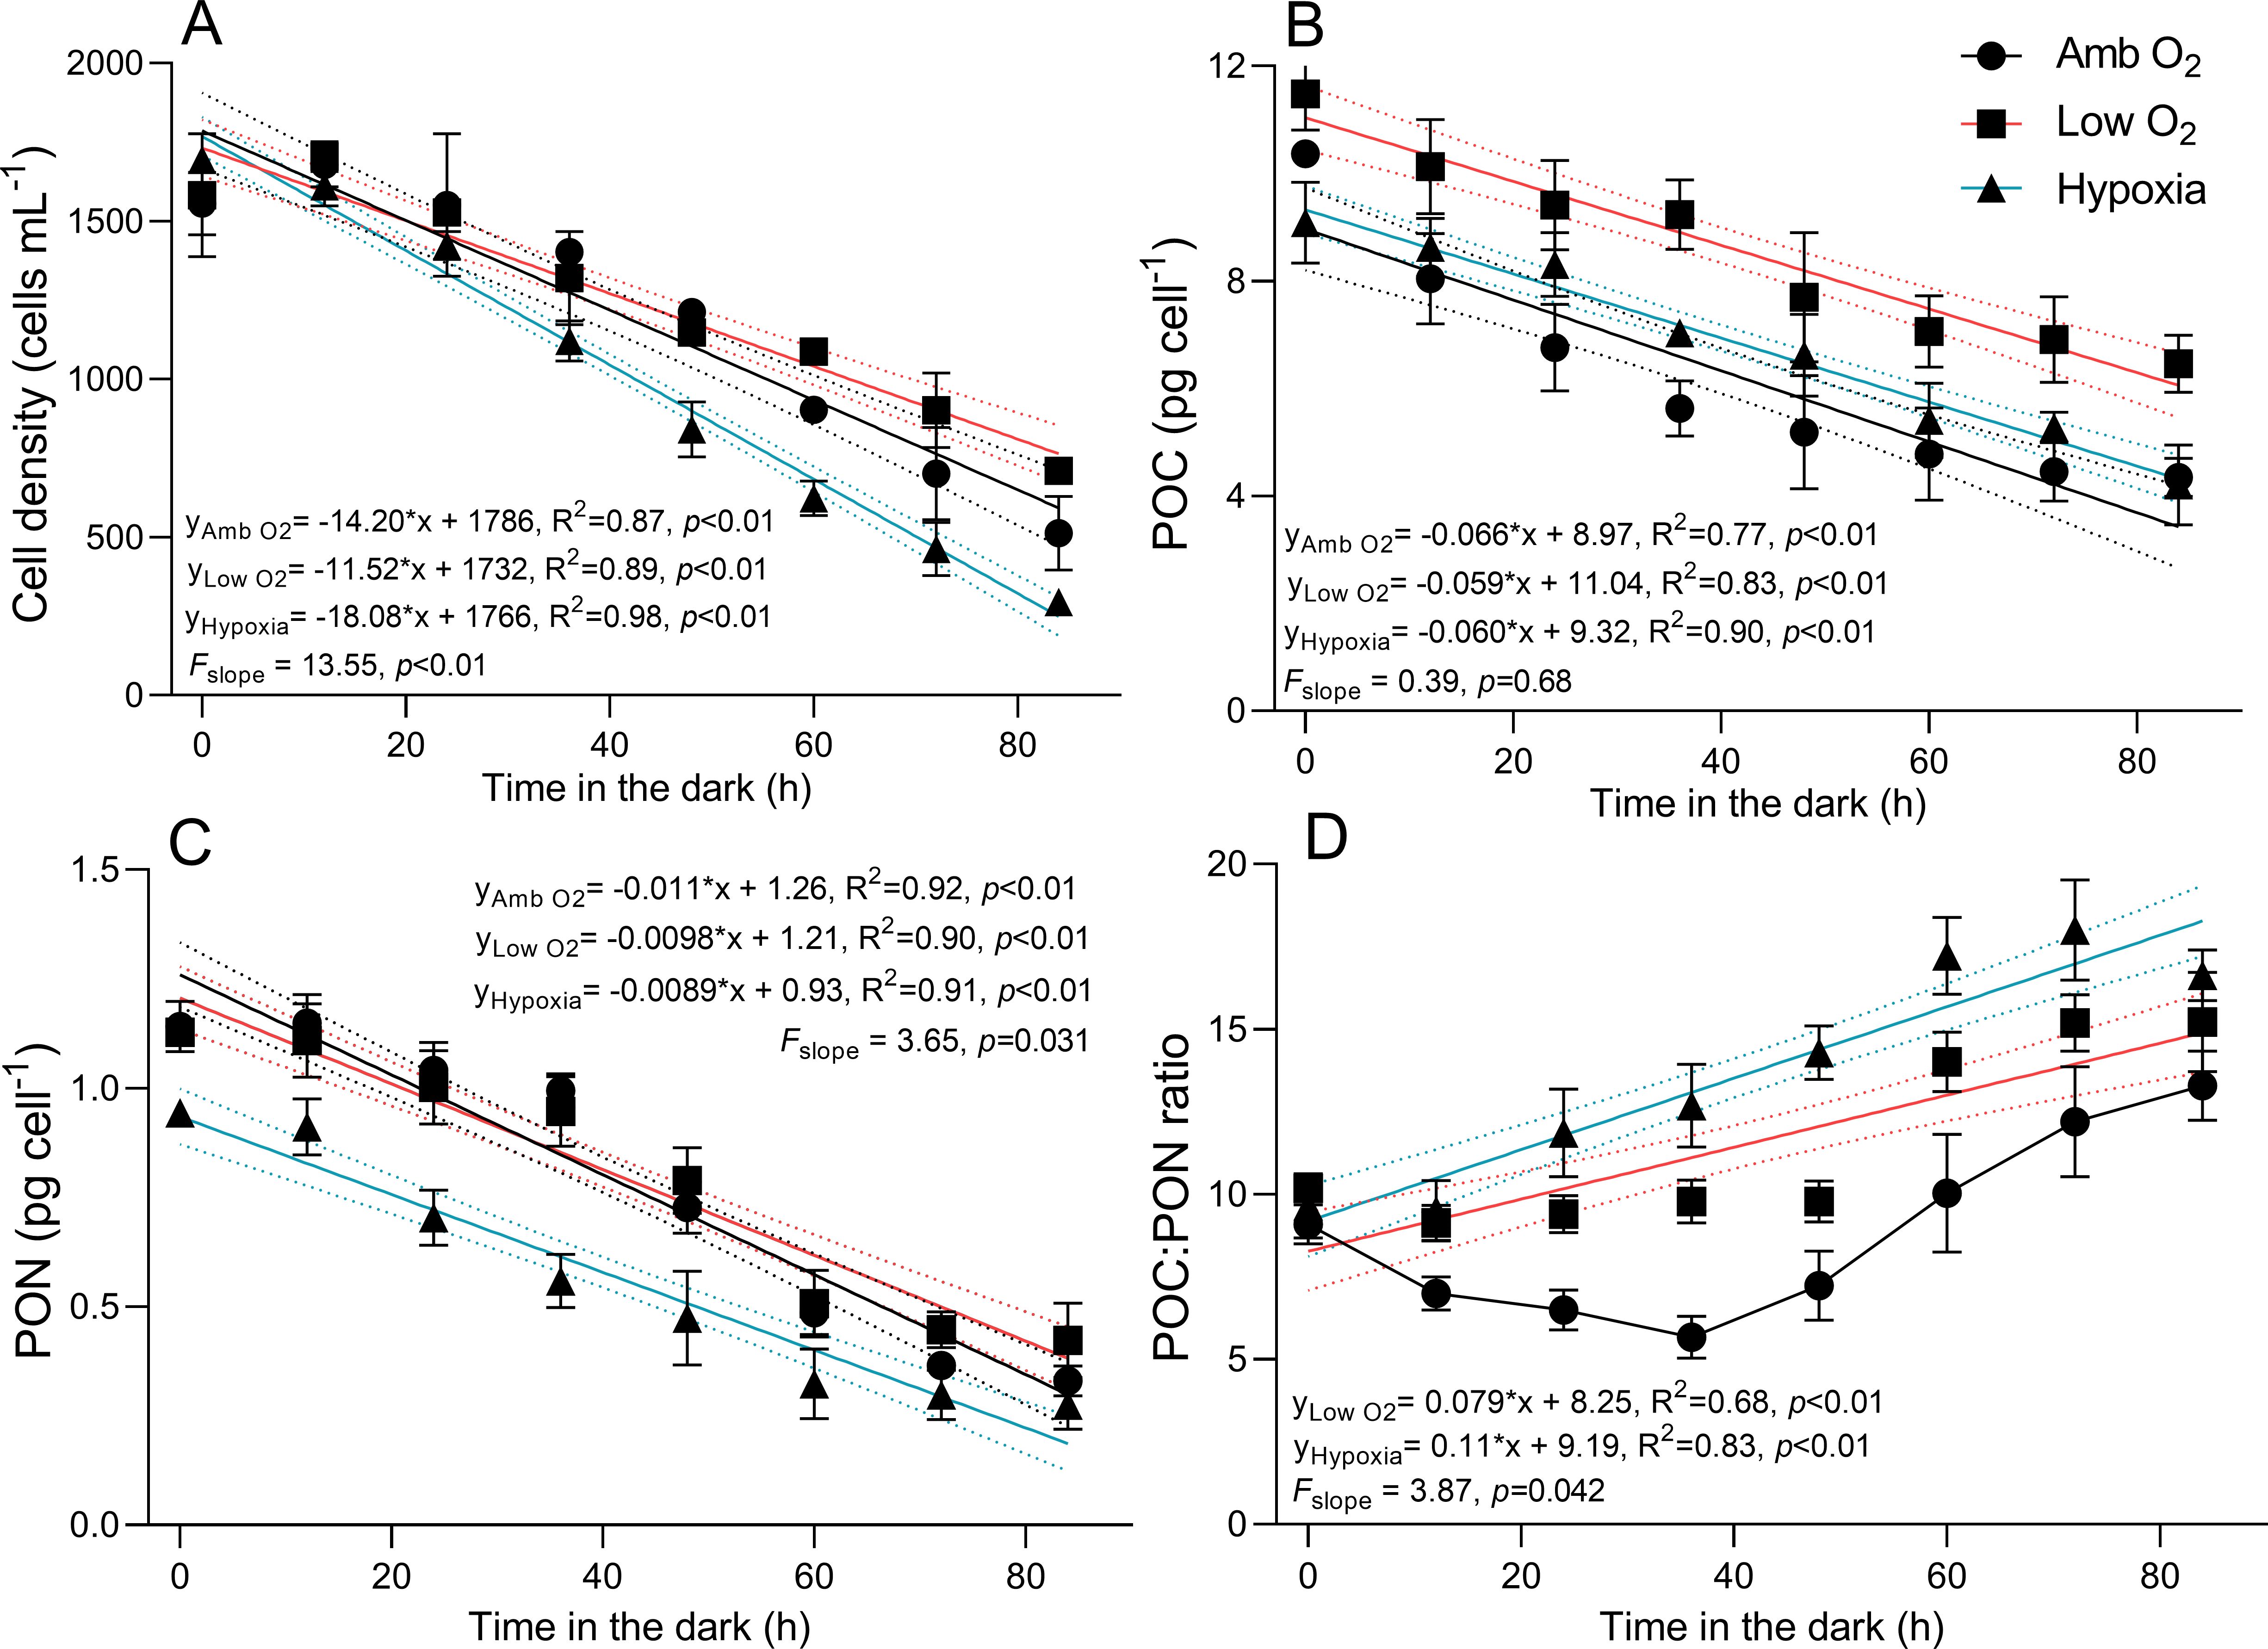
Figure 4. Cell density (cells mL-1, A), cellular content (pg cell-1) of particulate organic carbon (POC, B) and particulate organic nitrogen (PON, C) and POC:PON ratio (D) of T. pseudonana grown under ambient O2, low O2, and hypoxia during the 84-h cultivation in the dark. The vertical bars show the standard deviation of three growth determinations on independently grown cultures (n = 3). The solid lines show a linear relationship, and the dotted lines show 95% confidence intervals of the fitted lines.
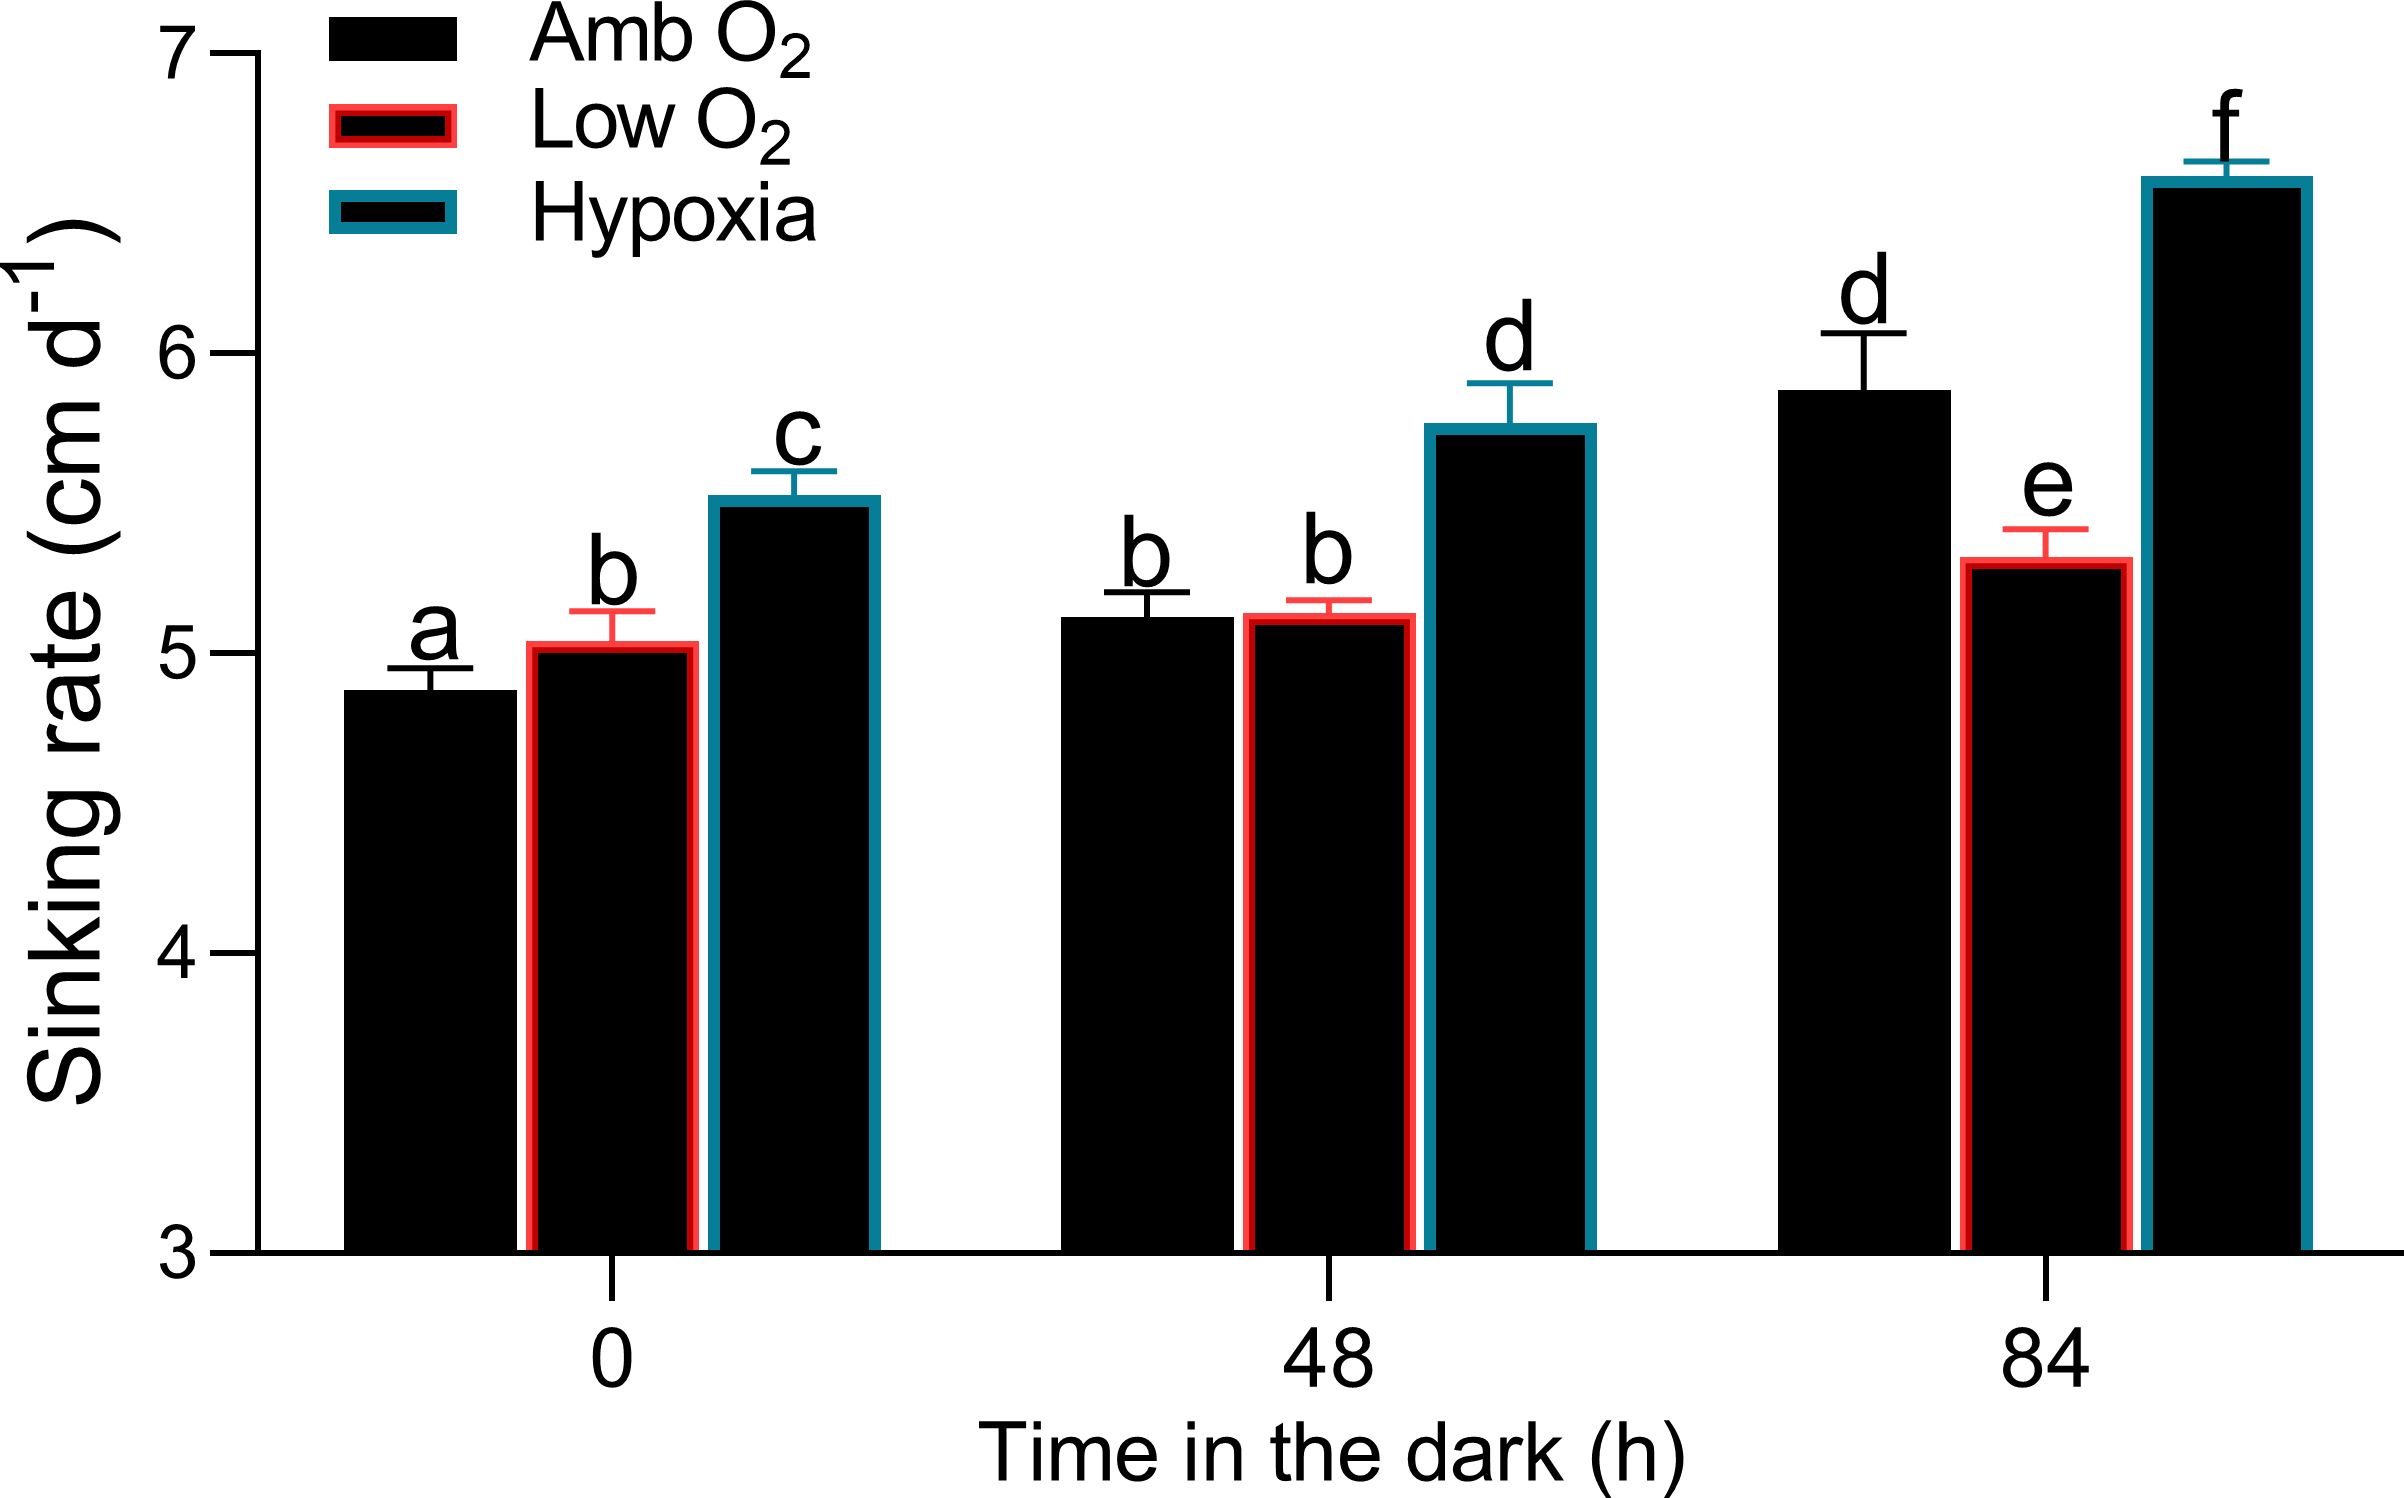
Figure 5. Sinking rate (cm day-1) of T. pseudonana grown under ambient O2, low O2, and hypoxia during the 84-h cultivation in the dark. The vertical bar shows one standard deviation of three growth determinations on independently grown cultures (n = 3), and different letters on the top of the bars indicate significant differences (p < 0.05).
4 Discussion
The effects of lowering O2 levels on the physiological and metabolic processes of marine aerobic organisms are well documented (e.g., Wang et al., 2016; McCormick and Levin, 2017). Many studies have also shown the different photophysiological responses of diatoms to a decrease in O2 level at different light intensities (Pruder and Bolton, 1980; Wu et al., 2012; Zhao et al., 2022; Sun et al., 2022; Chen et al., 2023, 2024) and at different light exposure times, i.e., photoperiod (Chen et al., 2021). In this study, we further showed that the diatom T. pseudonana responds differently to lowered O2 level during the day and at night.
Lowering O2 was generally thought to benefit the photosynthetic carbon fixation of phytoplankton (Raven and Larkum, 2007), as the carboxylation efficiency of ribulose-1, 5-bisphosphate carboxylase/oxygenase (RubisCO), a rate-limiting enzyme of carbon fixation, was directly relevant to the O2/CO2 ratio (Gao and Campbell, 2014). Low O2 means a fewer O2 molecules that compete for the binding site of RubisCO with CO2 and thus less energy cost to maintain CO2 concentrating mechanisms (CCMs) (Reinfelder et al., 2000; Giordano et al., 2005), which could make cells allocate more carbon (Figure 2C) to support growth (Figure 1). It is consistent with previous reports on the field phytoplankton communities (Sun et al., 2022) and laboratory individual species (Chen et al., 2021; Sun et al., 2022; Chen et al., 2024). However, previous studies have also noted the negative effects of lowered O2 on Photosystem II (PS II), especially at a longer photoperiod and a higher light intensity (Chen et al., 2021, 2024). During the transformation of photosynthetic electron, oxidization of harmful reactive oxygen species (ROS), and inactivation of photosynthetic components such as the PsbA protein (Pérez-Pérez et al., 2012), diatoms had to additionally allocate by up to 15% total nitrogen to repair the damaged PS II (Li et al., 2015). In this situation, the inhibited nitrogen metabolism by lowered O2 might further disrupt the balance between damage and repair of PSII (Chen et al., 2023), resulting in a more significant decrease in photosynthetic capacity during the day (Figure 3A; Table 1).
Aerobic metabolic processes of diatoms, such as mitochondrial respiration and the tricarboxylic acid cycle (TCA cycle), are vital for cells to obtain and allocate energy that is normally required to support other metabolic processes, such as nutrient uptake and assimilation (Lomas and Gilbert, 1999; Clark et al., 2002) and fatty acid synthesis (Chen et al., 2024), whose activities are directly related to available O2 (Chen et al., 2021; Zhao et al., 2022). These metabolic processes are therefore more sensitive to lowered O2 levels compared to photosynthesis (Figure 3) and are additionally inhibited and even blocked at night, leading to increased degradation of cellular organic matter (Figures 4B, C) and even cell death (Figure 1). Furthermore, our results showed that the decreased degradation of organic C and N caused by lowered O2 is disproportionate, such that the C/N ratio increases with the duration of darkness (Figure 4D). According to Wu et al. (2012), hypoxia can also decrease the adenylate energy charge of diatom [AEC = (ATP + 0.5 ADP)/(ATP + ADP + AMP)] by ~50%, suggesting the inhibition of ATPase and thus a decrease in cellular protein and fatty acid content (Chen et al., 2023, 2024) as well as a decrease in chlorophyll and organic N and C content (Figure 3). Such a decrease in chlorophyll content and Chl a/Chl b ratio due to hypoxia was also observed in the seagrass Enhalus acoroides at night (Che et al., 2022).
In the dark, diatoms normally decomposed the organic substances of, e.g., sugars and fatty acids via the TCA cycle first to obtain energy for their survival, followed by precious proteins (Cheng et al., 2022; Chen et al., 2023). Thus, how low O2 affects cell growth depends on the net accumulation of cell composition. Our findings showed that low O2 decreases dark respiration (Figure 3C), simultaneously promotes cellular C accumulation (Figure 4B), and decreases the mortality of cells (Figure 4A). However, under hypoxia, the cellular fatty acid content of diatom T. pseudonana was reduced by up to ~40% (Chen et al., 2024), which may have forced the cells to obtain more energy by decomposing functional proteins (Chen et al., 2023), thus leading to a linear increase in POC/PON ratio (Figure 4D). Such a phenomenon of changing metabolic substrate preference in response to environmental changes was also observed in the diatom S. dohrnii (Cheng et al., 2022).
The sinking speed of T. pseudonana was estimated to be ~5.0 cm day-1, which is comparable to other studies (Waite et al., 1997; Bannon and Campbell, 2017), and increased with duration of darkness (Figure 5). Low O2 decreased the sinking rate while hypoxia accelerated it, which can be explained by the lower mortality of cells in the former and higher mortality in the latter condition compared to the ambient O2 condition. On the other hand, diatoms normally aggregate multi-cellularly in nature and accumulate fatty acids to decrease gravity and avoid sinking from the euphotic zone (Ge et al., 2014; Janssen et al., 2014). The increased sinking rate under hypoxia could be related to the decrease in cell activity and cell composition as found here (Figures 2, 4) or in other studies (Chen et al., 2024). Such an increase in sinking rate combined with increasing mortality under hypoxic conditions suggests that the diatom-derived carbon burial may be accelerated under the marine deoxygenation scenario in the future (Figure 6). In addition, our results from individual diatom species grown in the laboratory should be taken with caution, although they provide a potentially mechanistic understanding of the effects of decreasing O2. Further studies with a phytoplankton community or multiple species closer to field conditions need to be conducted.
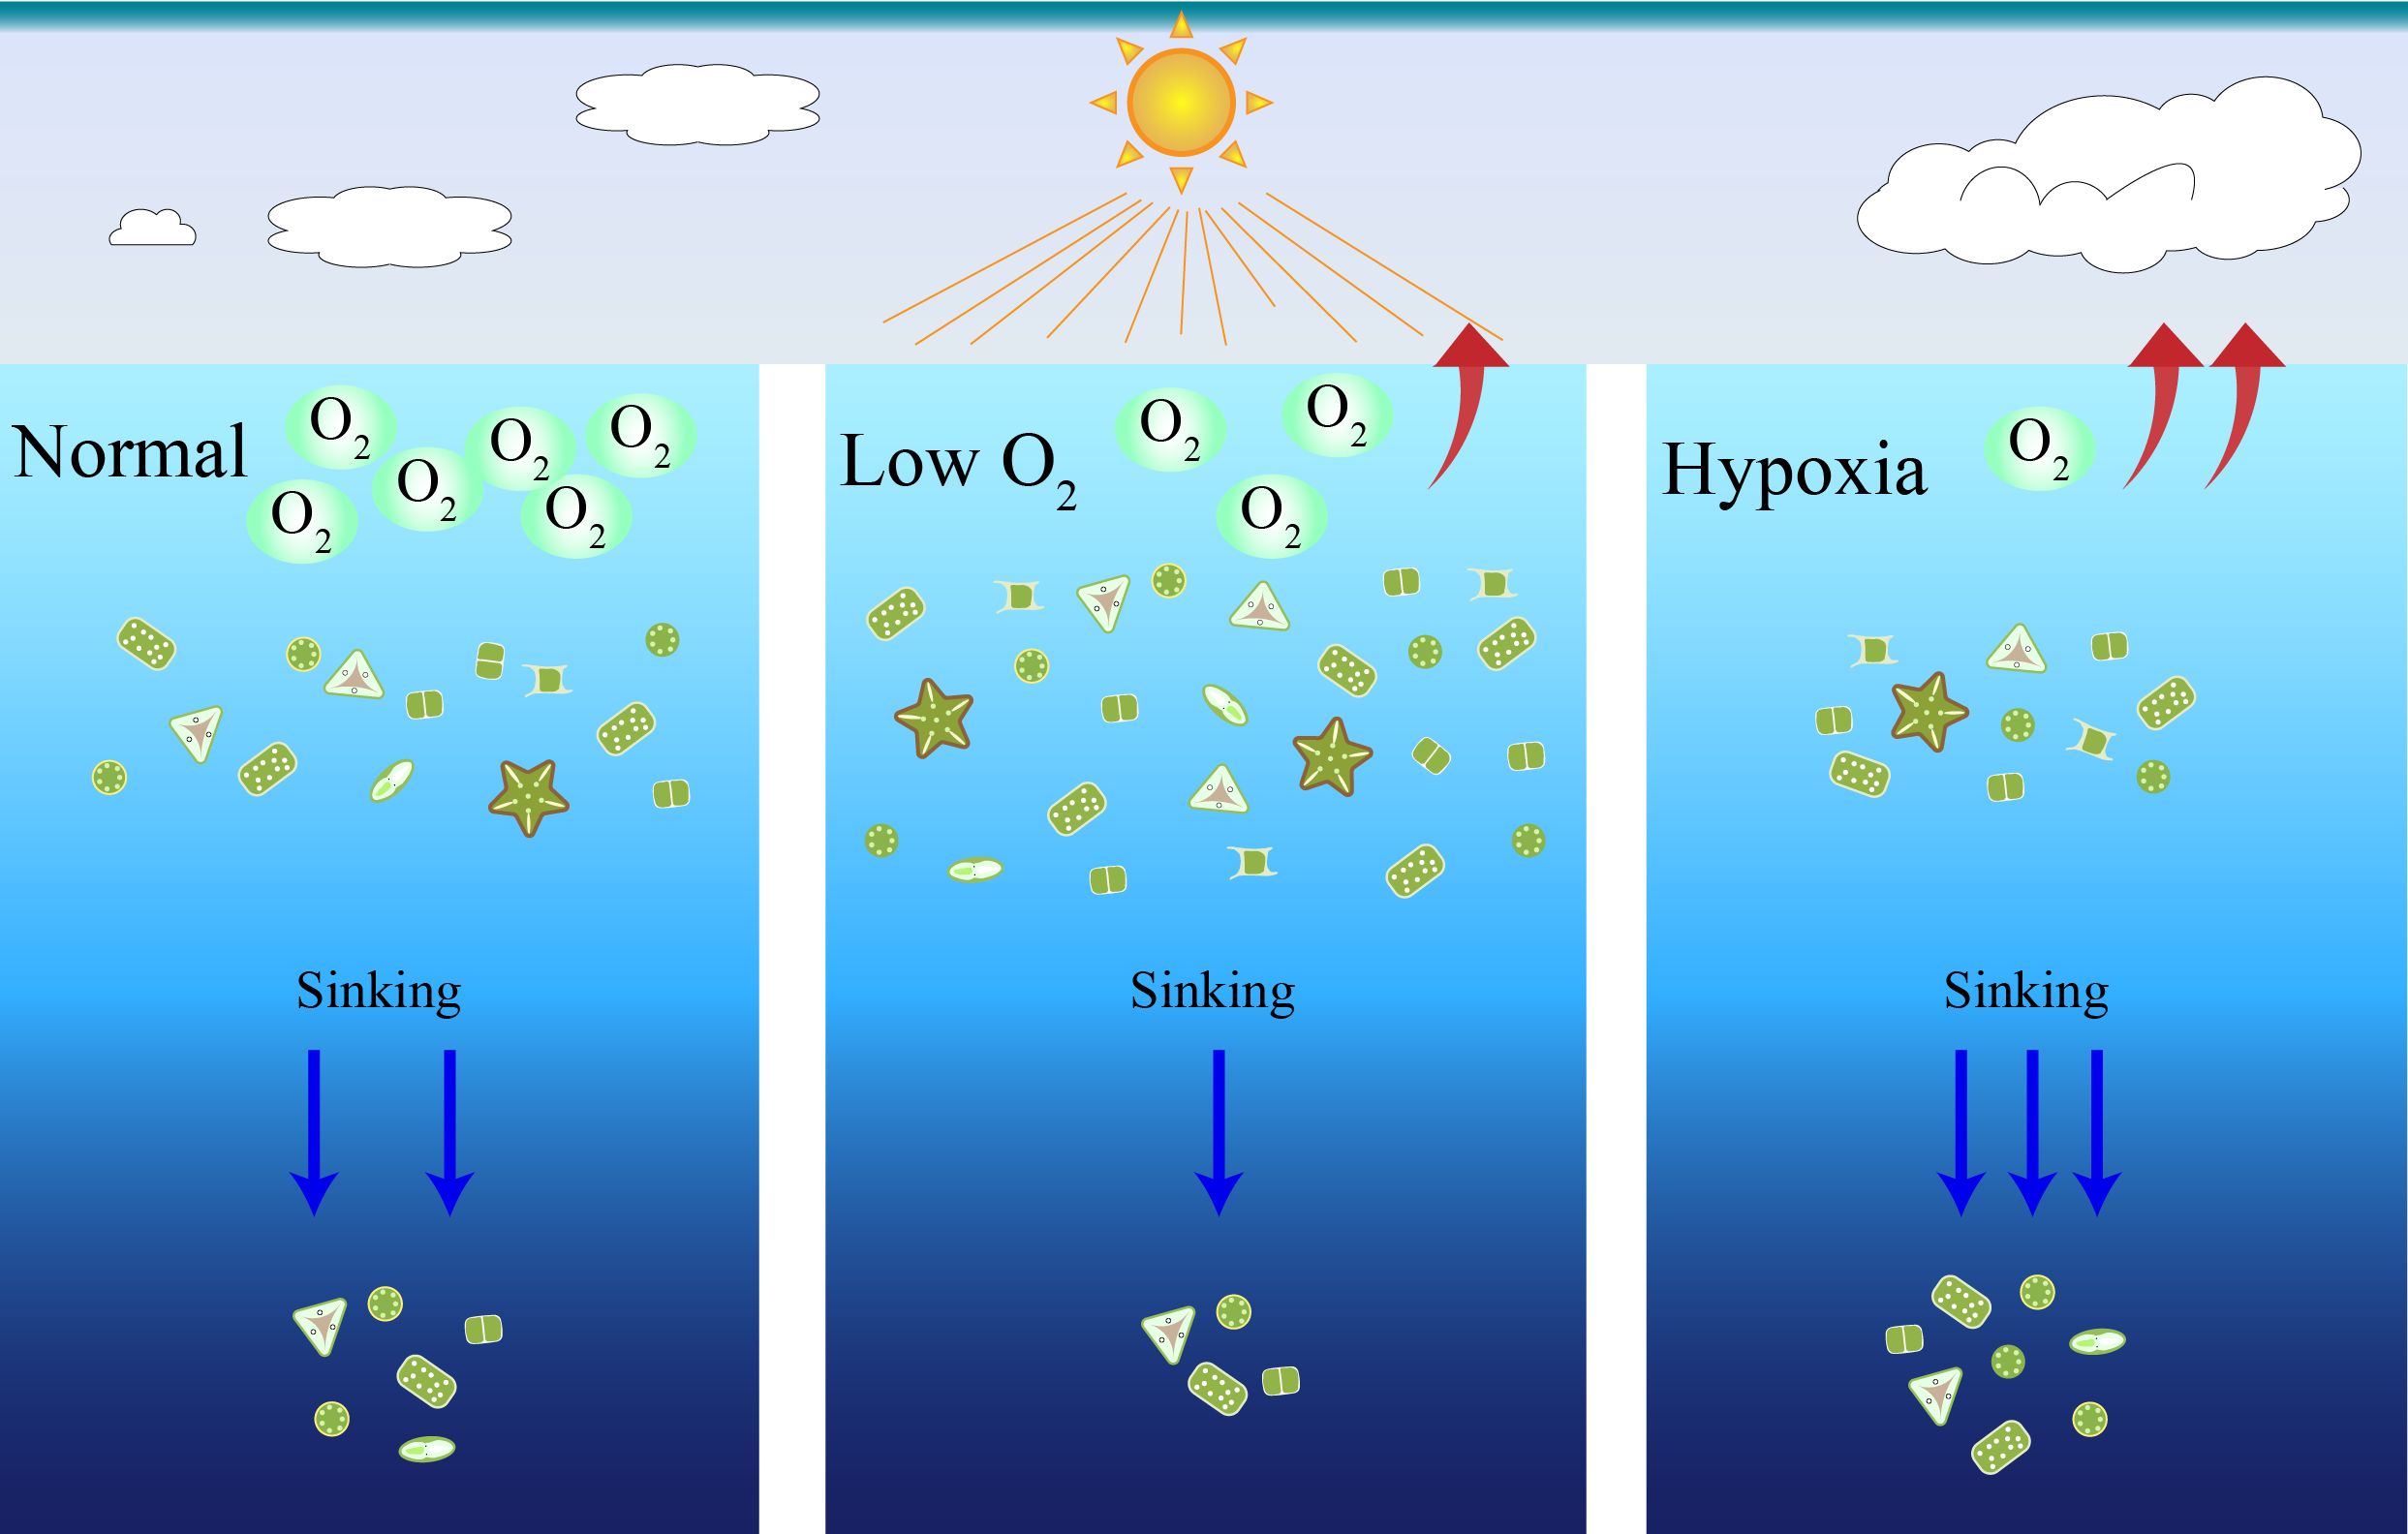
Figure 6. Simplified representation of decreasing O2 which affected the cell growth and sinking rate of marine diatom, suggesting the carbon burial derived from diatom being accelerated due to marine deoxygenation.
Data availability statement
The original contributions presented in the study are included in the article/supplementary material. Further inquiries can be directed to the corresponding authors.
Author contributions
BC: Writing – original draft. HS: Writing – review & editing. GX: Writing – original draft. HJ: Writing – original draft. XY: Writing – original draft. GL: Writing – review & editing.
Funding
The author(s) declare financial support was received for the research, authorship, and/or publication of this article. This work was funded by the National Natural Science Foundation of China (42430405, 32371665), Natural Science Foundation of Guangdong Province (2022A1515011461), and Natural Science Foundation of Shandong Province (ZR2024QC354).
Acknowledgments
We thank Zhao Wei from the Institute of Marine Science and Technology, Shandong University, for assistance with data analysis and measurement of cellular nitrogen and carbon content.
Conflict of interest
The authors declare that the research was conducted in the absence of any commercial or financial relationships that could be construed as a potential conflict of interest.
The author(s) declared that they were an editorial board member of Frontiers, at the time of submission. This had no impact on the peer review process and the final decision.
Generative AI statement
The author(s) declare that no Generative AI was used in the creation of this manuscript.
Publisher’s note
All claims expressed in this article are solely those of the authors and do not necessarily represent those of their affiliated organizations, or those of the publisher, the editors and the reviewers. Any product that may be evaluated in this article, or claim that may be made by its manufacturer, is not guaranteed or endorsed by the publisher.
References
Alamoudi T., Steckbauer A., Klein S. G., García J. V., Arossa S., Parry A. J., et al. (2022). Impacts of nighttime hypoxia on the physiological performance of Red Sea macroalgae under peak summer temperature. Front. Mar. Sci. 9. doi: 10.3389/fmars.2022.1034436
Bannon C. C., Campbell D. A. (2017). Sinking towards destiny: High throughput measurement of phytoplankton sinking rates through time-resolved fluorescence plate spectroscopy. PloS One 12, e0185166. doi: 10.1371/journal.pone.0185166
Berges J. A., Franklin D. J., Harrison P. J. (2001). Evolution of an artificial seawater medium: improvements in enriched seawater, artificial water over the last two decades. J. Phycol. 37, 1138–1145. doi: 10.1046/j.1529-8817.2001.01052.x
Breitburg D., Levin L. A., Oschlies A., Grégoire M., Chavez F. P., Conley D. J., et al. (2018). Declining oxygen in the global ocean and coastal waters. Science 359, eaam7240. doi: 10.1126/science.aam7240
Che X., Zhang T., Li H., Liu J. G. (2022). Effect of hypoxia on Photosystem II of tropical seagrass Enhalus acoroides in the dark. Photochem. Photobiol. 98, 421–428. doi: 10.1111/php.13522
Chen C. C., Gong G. C., Shiah F. K. (2007). Hypoxia in the East China Sea: one of the largest coastal low-oxygen areas in the world. Mar. Environ. Res. 64, 399–408. doi: 10.1016/j.marenvres.2007.01.007
Chen B. K., Liu J. H., Song H., Xu G., Zhao W., Li G. (2024). Decreasing available O2 interacts with light to alter the growth and fatty acid content in a marine diatom. Environ. Exp. Bot. 220, 105667. doi: 10.1016/j.envexpbot.2024.105667
Chen B. K., Liu J. H., Xu G., Li G. (2021). Lowering pO2 interacts with photoperiod to alter physiological performance of the coastal diatom Thalassiosira pseudonana. Microorganisms 12, 2541. doi: 10.3390/microorganisms9122541
Chen B. K., Song H., Yang X., Xu G., Zhao W., Meng Y., et al. (2023). Decreasing O2 availability reduces cellular protein contents in a marine diatom. Sci. Total Environ. 887, 164032. doi: 10.1016/j.scitotenv.2023.164032
Cheng L. M., Zhang S. F., Xie Z. X., Li D. X., Lin L., Wang M. H., et al. (2022). Metabolic adaptation of a globally important diatom following 700 generations of selection under a warmer temperature. Environ. Sci. Technol. 56, 5247–5255. doi: 10.1021/acs.est.1c08584
Clark D. R., Flynn K. J., Owens N. J. P. (2002). The large capacity for dark nitrate-assimilation in diatoms may overcome nitrate limitation of growth. New Phytol. 155, 101–108. doi: 10.1046/j.1469-8137.2002.00435.x
Eom S. H., Jeong H. J., Ok J. H., Park S. A., Kang H. C., You J. H. (2024). Combined effects of hypoxia and starvation on the survival and growth rates of autotrophic, mixotrophic, and heterotrophic dinoflagellates. Mar. Biol. 171, 42. doi: 10.1007/s00227-023-04363-5
Field C. B., Behrenfeld M. J., Randerson J. T., Falkowski P. (1998). Primary production of the biosphere: integrating terrestrial and oceanic components. Science 281, 237–240. doi: 10.1126/science.281.5374.237
Gao K., Campbell D. A. (2014). Photophysiological responses of marine diatoms to elevated CO2 and decreased pH: a review. Funct. Plant Biol. 41, 449–459. doi: 10.1071/FP13247
Ge F., Huang W., Chen Z., Zhang C. Y., Xiong Q., Bowler C., et al. (2014). Methylcrotonyl-CoA carboxylase regulates triacylglycerol accumulation in the model diatom Phaeodactylum tricornutum. Plant Cell 26, 1681–1697. doi: 10.1105/tpc.114.124982
Giordano M., Beardall J., Raven J. A. (2005). CO2 concentrating mechanisms in algae: mechanisms, environmental modulation, and evolution. Annu. Rev. Plant Biol. 56, 99–131. doi: 10.1146/annurev.arplant.56.032604.144052
Gomes H. D., Goes J. I., Matondkar S. G., Buskey E. J., Basu S., Parab S., et al. (2014). Massive outbreaks of Noctiluca scintillans blooms in the Arabian Sea due to spread of hypoxia. Nat. Commun. 5, 4862. doi: 10.1038/ncomms5862
Janssen D. J., Conway T. M., John S. G., Christian J. R., Kramer D. I., Pedersen T. F., et al. (2014). Undocumented water column sink for cadmium in open ocean oxygen-deficient zones. P. Natl. Acad. Sci. U. S. A. 111, 6888–6893. doi: 10.1073/pnas.1402388111
Keeling R. E., Krtzinger A., Gruber N. (2010). Ocean deoxygenation in a warming world. Annu. Rev. Mar. Sci. 2, 199–229. doi: 10.1146/annurev.marine.010908.163855
Li G., Brown C. M., Jeans J. A., Donaher N. A., McCarthy A., Campbell D. A. (2015). The nitrogen costs of photosynthesis in a diatom under current and future pCO2. New Phytol. 205, 533–543. doi: 10.1111/nph.13037
Li G., Liu J. X., Diao Z. H., Jiang X., Li J. J., Ke Z. X., et al. (2018). Subsurface low dissolved oxygen occurred at fresh- and saline-water intersection of the Pearl River estuary during the summer period. Mar. pollut. Bull. 126, 585–591. doi: 10.1016/j.marpolbul.2017.09.061
Li G., Woroch A. D., Donaher N. A., Cockshutt A. M., Campbell D. A. (2016). A hard day’s night: Diatoms continue recycling Photosystem II in the dark. Front. Mar. Sci. 3. doi: 10.3389/fmars.2016.00218
Lomas M. W., Gilbert P. M. (1999). Temperature regulation of nitrate uptake: A novel hypothesis about nitrate uptake and reduction in cool-water diatoms. Limnol. Oceanogr. 44, 556–572. doi: 10.4319/lo.1999.44.3.0556
Long M. C., Deutsch C., Ito T. (2016). Finding forced trends in oceanic oxygen. Global Biogeochem. Cy. 30, 381–397. doi: 10.1002/2015GB005310
McCormick L. R., Levin L. A. (2017). Physiological and ecological implications of ocean deoxygenation for vision in marine organisms. Philos. T. R. Soc A 375, 20160322. doi: 10.1098/rsta.2016.0322
Peckol P., Rivers J. S. (1995). Physiological responses of the opportunistic macroalgae Cladophora vagabunda (L.) van den Hoek and Gracilaria tikvahiae (McLachlan) to environmental disturbances associated with eutrophication. J. Exp. Mar. Biol. Ecol. 190, 1–16. doi: 10.1016/0022-0981(95)00026-N
Pérez-Pérez M. E., Lemaire S. D., Crespo J. L. (2012). Reactive oxygen species and autophagy in plants and algae. Plant Physiol. 160, 156–164. doi: 10.1104/pp.112.199992
Pruder G. D., Bolton E. T. (1980). Differences between cell division and carbon fixation rates associated with light intensity and oxygen concentration: Implications in the cultivation of an estuarine diatom. Mar. Biol. 59, 1–6. doi: 10.1007/BF00396976
Rabalais N. N., Turner R. E. (2019). Gulf of Mexico hypoxia: past, present and future. Limnol. Oceanogr. Bull. 28, 117–124. doi: 10.1002/lob.10351
Raven J. A., Larkum A. (2007). Are there ecological implications for the proposed energetic restrictions on photosynthetic oxygen evolution at high oxygen concentrations? Photosynth. Res. 94, 31–42. doi: 10.1007/s11120-007-9211-z
Reinfelder J. R., Kraepiel A. M. L., Morel F. M. (2000). Unicellular C-4 photosynthesis in a marine diatom. Nature 407, 996–999. doi: 10.1038/35039612
Schmidtko S., Stramma L., Visbeck M. (2017). Decline in global oceanic oxygen content during the past five decades. Nature 542, 335–339. doi: 10.1038/nature21399
Sun J., Wang T., Huang R., Yi X., Zhang D., Beardall J., et al. (2022). Enhancement of diatom growth and phytoplankton productivity with reduced O2 availability is moderated by rising CO2. Commun. Biol. 5, 54. doi: 10.1038/s42003-022-03006-7
Tong S. Y., Xu D., Qiao H. J., Ye N. H. (2024). Decreased calcification to photosynthesis ratio in coccolithophores under reduced O2 and elevated CO2 environment. Can. J. Fish. Aquat. Sci. 81, 28–37. doi: 10.1139/cjfas-2023-0073
Waite A., Fisher A., Thompson P. A., Harrison P. J. (1997). Sinking rate versus cell volume relationships illuminate sinking rate control mechanisms in marine diatoms. Mar. Ecol. Prog. Ser. 157, 97–108. doi: 10.3354/meps157097
Wang S., Lau K., Lai K., Zhang J., Tse A., Li J., et al. (2016). Hypoxia causes transgenerational impairments in reproduction of fish. Nat. Commun. 7, 12114. doi: 10.1038/ncomms12114
Wang F., Li X. G., Tang X. H., Sun X. X., Zhang J. L., Yang D. Z., et al. (2023). The seas around China in a warming climate. Nat. Rev. Earth Env. 4, 535–551. doi: 10.1038/s43017-023-00453-6
Wu R., Wo K. T., Chiu J. (2012). Effects of hypoxia on growth of the diatom Skeletonema costatum. J. Exp. Mar. Biol. Ecol. 420, 65–68. doi: 10.1016/j.jembe.2012.04.003
Xiang C. H., Tan Y. H., Zhang H. C., Liu J. X., Ke Z. X., Li G. (2019). The key to dinoflagellate (Noctiluca scintillans) blooming and outcompeting diatoms in winter off Pakistan, northern Arabian Sea. Sci. Total Environ. 694, 133396. doi: 10.1016/j.scitotenv.2019.07.202
Zhai F. G., Liu Z. Z., Li P. L., Gu Y. Z., Sun L. Y., Hu L. Y., et al. (2021). Physical controls of summer variations in bottom layer oxygen concentrations in the coastal hypoxic region off the Northeastern Shandong peninsula in the Yellow sea. J. Geophys. Res.-Oceans 126, e2021JC017299. doi: 10.1029/2021JC017299
Keywords: lowering O2, light and dark, diatom, cell composition, sinking rate
Citation: Chen B, Song H, Xu G, Ji H, Yang X and Li G (2025) Hypoxia lowers cell carbon and nitrogen content and accelerates sinking of a marine diatom Thalassiosira pseudonana. Front. Mar. Sci. 12:1529163. doi: 10.3389/fmars.2025.1529163
Received: 19 November 2024; Accepted: 15 January 2025;
Published: 06 February 2025.
Edited by:
Fuminori Hashihama, Tokyo University of Marine Science and Technology, JapanCopyright © 2025 Chen, Song, Xu, Ji, Yang and Li. This is an open-access article distributed under the terms of the Creative Commons Attribution License (CC BY). The use, distribution or reproduction in other forums is permitted, provided the original author(s) and the copyright owner(s) are credited and that the original publication in this journal is cited, in accordance with accepted academic practice. No use, distribution or reproduction is permitted which does not comply with these terms.
*Correspondence: Hui Song, c29uZ2h1aTIwMThAZm94bWFpbC5jb20=; Gang Li, bGlnYW5nQHNjc2lvLmFjLmNu