
95% of researchers rate our articles as excellent or good
Learn more about the work of our research integrity team to safeguard the quality of each article we publish.
Find out more
ORIGINAL RESEARCH article
Front. Mar. Sci. , 03 February 2025
Sec. Marine Ecosystem Ecology
Volume 12 - 2025 | https://doi.org/10.3389/fmars.2025.1522723
This article is part of the Research Topic Bridging Knowledge Gaps in Marine Biological Invasions View all 7 articles
 Juan Sempere-Valverde1,2*
 Eva Aylagas1
 Vitaly Syomin1,3
 Marcos A. L. Teixeira1Glafira D. Kolbasova1,4
 Sofía Ruiz-Velasco2
 Sahar Chebaane1Arthur Anker1
 João Curdia1Ronald Cadiz1
 Dylan M. Cottrell1
 Andrea Desiderato5
 Luiz F. Andrade5
 Chakkiath Paul Antony1Carolina Bocanegra-Castano1Matilde Marzucchi1
 Angelo Poliseno1Doaa Baker1Basmah Alabdulaziz1
 Flor Torres6Ameer A. Eweida7,8
 Susana Carvalho1,9*
Introduction: Maritime traffic and coastal urbanisation significantly contribute to the introduction and proliferation of non-indigenous species (NIS). However, the lack of information might prevent effective monitoring in data-limited regions, particularly in areas experiencing demographic growth, where monitoring biofouling communities could offer crucial insights into the dynamics of NIS invasions. This study represents a baseline characterization of the biofouling communities in the northern Saudi Arabian Red Sea (NEOM region) prior to extensive urban, industrial, and commercial development.
Methods: Samples were collected in November 2023 and February 2024 from seven sites within the region. At each site and time, three settlement structures, each with a PVC panel attached to a brick and rope, were sampled after 3-months deployment. Panels were analysed with photo quadrat analysis (PhQd), examined to manually collect sessile macroinvertebrate specimens for taxonomic identification using morphological and DNA barcoding analysis, and scraped for bulk DNA analyses using DNA metabarcoding. Five water samples were also collected for environmental DNA (eDNA) analysis. The environmental characteristics of each site were obtained by deploying temperature data loggers and through an environmental risk assessment.
Results: Community patterns observed from the PhQd and bulk DNA datasets revealed a clear separation of two sites within Sharma lagoon from the remaining sites. The eDNA analysis of seawater confirmed these spatial differences, also detecting a variation between sampling times that was not observed with the other approaches. A total of 20 NIS and 18 cryptogenic species were recorded, from which 12 were identified morphologically and the remaining detected with molecular methods only. The generally low NIS coverage confirms that the NEOM region is less affected by marine biological invasions compared to other anthropized habitats within the Red Sea. However, sites in the Sharma lagoon showed high human pressure levels and comparatively higher coverage of cryptogenic bryozoans on panels.
Discussion: This study provides the first detailed assessment of biofouling communities in NEOM, establishing a baseline and contributing to a regional species reference library for non-indigenous and cryptogenic species. As coastal development spreads, it presents both challenges and opportunities, highlighting the need for sustainable, ecosystem-based approaches to protect valuable natural areas. This baseline is essential for future monitoring of biofouling dynamics as the region develops.
Coastal urbanisation plays a pivotal role in shaping coastal marine ecosystems, contributing to habitat destruction and modification, and is a major cause of biodiversity loss globally (Bulleri and Chapman, 2010; Firth et al., 2016; Sempere-Valverde et al., 2023). This process involves the proliferation of artificial coastal structures, such as hardened shorelines, trade and leisure infrastructure and activities, such as aquaculture and maritime traffic, all of which facilitate the introduction, establishment and spread of non-indigenous species (NIS) (Ros et al., 2023; Sempere-Valverde et al., 2023). These species are typically transported via maritime vectors, such as ballast water discharge and biofouling on hulls, as well as through commercial activities like aquaculture trade (Bailey et al., 2020). They possess the potential to become invasive, resulting in significant and often irreversible ecological, economic, and social consequences (Carlton and Geller, 1993; Campbell et al., 2017; Komyakova et al., 2022). While some countries have developed and enforced regulations to mitigate the risks posed by biofouling, a comprehensive understanding of how marine systems respond glogally to human pressures remains incomplete (Borja et al., 2016; Korpinen and Andersen, 2016; Ros et al., 2023). The natural complexity of marine ecosystems, characterized by diverse biological interactions, habitat variability, and intricate ecological processes, presents significant challenges in studying the effects of coastal urbanisation and maritime traffic. Coastal urbanization often transforms natural habitats into artificial structures, altering species composition and creating new niches that can facilitate marine bioinvasions. Meanwhile, maritime traffic contributes to the introduction and spread of NIS through vectors such as ballast water discharge and hull biofouling (Todd et al., 2019; Espinosa, 2023).
The early detection and monitoring of NIS can be achieved through various collection methods and species identification techniques (Carvalho et al., 2023). These include (1) rapid assessment surveys, which usually involve collecting mature biofouling communities from existing underwater structures (e.g., Campbell et al., 2007; Ferrario et al., 2017; Chebaane et al., 2019), (2) the deployment of experimental structures for recruitment, such as settlement panels and collectors (e.g., Marraffini et al., 2017; Ros et al., 2020; Tempesti et al., 2022a), and (3) the collection of water and sediment samples (Couton et al., 2022; Aylagas et al., 2024). These methods are followed by morphological and/or molecular techniques for species identification, including DNA metabarcoding of biofouling assemblages or environmental samples such as water and sediment (Rey et al., 2020; Couton et al., 2022). When combined, these techniques can synergistically enhance the detection, monitoring and management of NIS (Holland, 2000; Couton, 2020; Carvalho et al., 2023; Ros et al., 2023).
The early detection and monitoring of NIS depend on comprehensive knowledge on species taxonomy, ecology, natural history and distribution (Puillandre et al., 2012; Ojaveer et al., 2014; Marchini and Cardeccia, 2017). This expertise is essential for identifying species and species complexes, disentangling the native and non-indigenous distribution of species, as well as predicting their risk of spread, proliferation and impact (Ros et al., 2023). However, this knowledge must be combined with a continuous surveillance of marine regions and habitats to ensure sustained monitoring of NIS and early detection of colonisation events (Carvalho et al., 2023). Due to the difficulty of accessing and sampling large subtidal ecosystems, the use of molecular tools is a cost-efficient for monitoring multiple habitats simultaneously and through time. Molecular methods, particularly DNA metabarcoding-based surveillance techniques, are advancing rapidly for monitoring NIS in marine coastal habitats (Zaiko et al., 2018; Duarte et al., 2021a; Carvalho et al., 2023). These techniques allow the detection of NIS during both early life and initial biological invasion stages, when populations are sparsely distributed and occur at low densities (Couton, 2020; van den Heuvel-Greve et al., 2021). However, the effectiveness of this approach depends on the availability, taxonomic coverage, and reliability of DNA reference libraries (Couton et al., 2022; Ros et al., 2023). Incomplete and often inaccurate molecular reference libraries limit our understanding of the distribution and diversity of NIS and hinder the development of effective strategies to manage marine bioinvasions (Wheeler et al., 2004; Graells et al., 2021; Ros et al., 2023). This limitation is particularly pronounced in understudied regions, such as the Red Sea (Carvalho et al., 2023), and for certain taxonomic groups, like non-coral invertebrates (Berumen et al., 2013), which usually dominate biofouling on artificial structures (Ros et al., 2023). Therefore, the development and update of reference libraries is a priority in NIS management.
The Red Sea, with its unique hydrography and history, is a marine biodiversity and endemism hotspot (DiBattista et al., 2016). This area experiences intense maritime traffic, and is undergoing a period of rapid demographic growth and urban development (e.g., Chalastani et al., 2020; NEOM, 2024). Since the opening of the Suez Canal, this basin has been a transit area between the Indo-Pacific basin and the Mediterranean Sea (e.g., Goren and Klausewitz, 1978; Malaquias et al., 2016; Fernandez et al., 2022). Despite this, research specifically focused on NIS in the Red Sea remains considerably scarce (Aylagas et al., 2024). This knowledge gap is more acute in pristine or minimally disturbed areas such as NEOM, a largely undeveloped region in Saudi Arabia’s northern Red Sea. NEOM is slated for substantial urban, industrial, and commercial development, which has prompted an extensive study on the region’s biodiversity as part of the conservation measures associated with this project (NEOM, 2024).
In this study, we aim to provide the first comprehensive assessment of biofouling assemblages in the NEOM region of the northern Saudi Arabia Red Sea, which will serve as a baseline for future research, policymaking and ecosystem-based management (Ojaveer et al., 2018; Rey et al., 2020; NEOM, 2024). Due to its proximity to the Suez Canal, this region is a potential stepping stone of NIS transfer. With a special focus on NIS and cryptogenic species, our specific objectives are to: (1) initiate a local DNA reference library that captures the diversity of biofouling species in the region, using both morphological and molecular identification methods to ensure accurate species detection; (2) establish a baseline for the occurrence and distribution of NIS in the region by combining morphological and molecular methods, a critical step for future assessments as a response to ongoing coastal modification projects; (3) investigate the structure and dynamics of early biofouling communities across sites with different environmental status and pressures; and (4) assess the effectiveness of the methodologies employed for NIS and cryptogenic species detection, providing insights and recommendations to enhance biosecurity monitoring and management strategies in this ecologically and economically significant region.
The study was conducted across seven sites within the NEOM region (Figure 1A). Two of these, Taba Lagoon (GATL, 28.1729391, 34.6386982) and Wadi Her Lagoon (WHER, 27.6231429, 35.5193011), are located in undisturbed natural habitats, and are designated for future development (NEOM, 2024). Tabouk Fisheries (TBKF, 27.7750223, 35.4262782) is adjacent to fish aquaculture facilities, and Al Muwaileh Coast Guard (AMCG, 27.6736321, 35.4749303) is located in a natural embayment used as a harbour by fishing boats. Almujawah Lagoon (GAAL, 28.26643, 34.6778419) serves as an outpost of the coast guard authorities in a largely unpopulated area. In Sharma lagoon, Gayal Coast Guard (GACG, 28.1202196, 35.0113805) is positioned in a mooring area for fishing boats, while Vista Pier (VISP, 28.0541481, 35.1980001) is located on the beach of a resort.
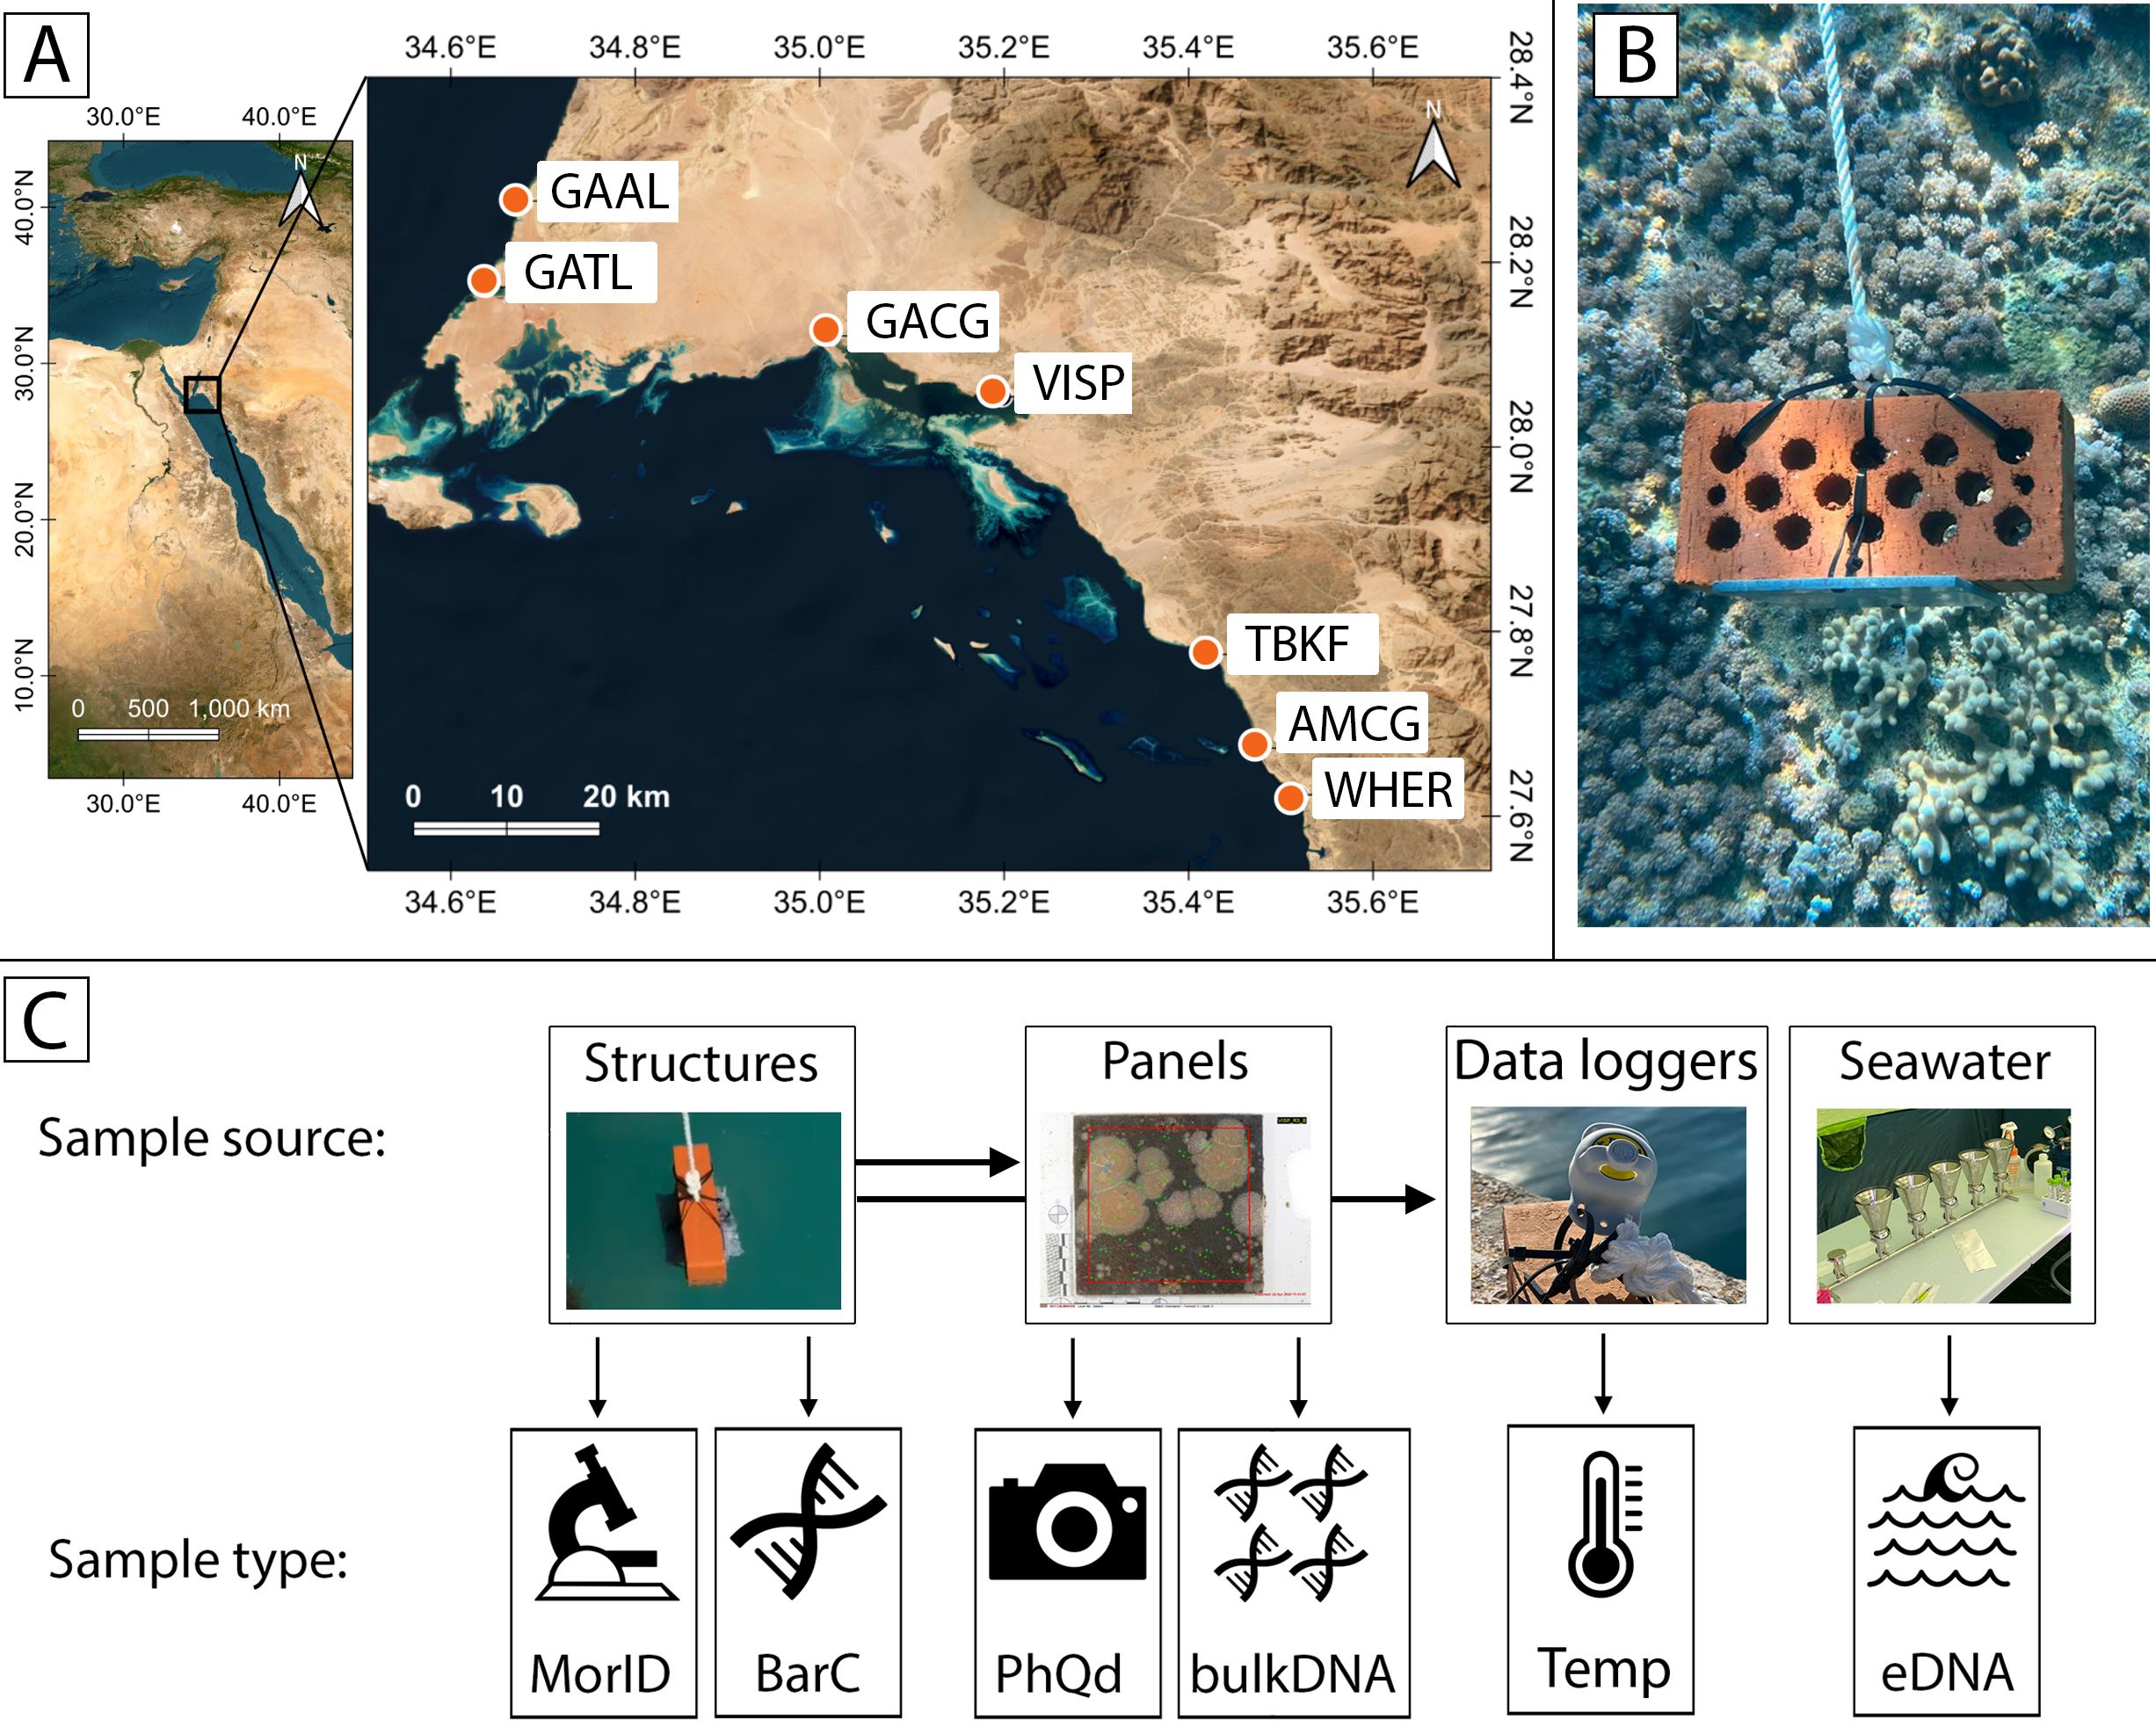
Figure 1. (A) Study sites in the northern Red Sea (NEOM, Kingdom of Saudi Arabia). (B) Image of one of the experimental settlement structures used in this study. (C) Overview of the different methods and type of samples collected in this study: Structures: The entire structure (panels, bricks, and ropes) was used to collect macroinvertebrates for morphological identification (MorID) and DNA barcoding (BarC). Panels: Each PVC panel from the structures was photographed to analyse biofouling coverage (PhQd). Biofouling was then scraped from the panel, homogenised and processed for bulk DNA analysis (bulk DNA). Data loggers: a HOBO logger was attached to one structure per site to record temperature data every 30 minutes (Temp). Seawater: Five 2-litre samples were collected and filtered for environmental DNA analyses (eDNA). GAAL, Almujawah Lagoon; GATL, Taba Lagoon; GACG, Gayal Coast Guard; VISP, Vista Pier; AMCG, Al Muwaileh Coast Guard; TBKF, Tabouk Fisheries; WHER, Wadi Her Lagoon.
An Environmental Risk Assessment (ERA) was conducted for each site using the product of the indexes environmental state (St) and environmental pressure (Pr), as proposed by Gómez et al. (2019) (ERA = Pr * St). The Pr index was calculated as the sum of the Navigation Activity (NV) or density of boats (berths/m2), the Port Activity (PT), which reflects the presence or absence of dry docks and refuelling facilities in the site (PT = 1 and PT = 0, respectively), and the External activity (EX), which depends on the main land use within a one km radius from the studied site (Pr = NV + PT + EX). An EX value of 1 was given for industrial and mining land uses, 0.5 for residential and agricultural uses, and 0 for other uses. The dredging activity (DG), as defined by Gómez et al. (2019), was not used to calculate Pr in this study, as all sites were estimated to have the same DG probability (DG = 0). The St index was calculated as the sum of the susceptibility or flushing capacity of the water body, calculated as the Complexity Tidal Range Index (CTRI), as in Gómez et al. (2017), and the Naturalness (NA), which indicates the level of modification of the site’s water body (St = CTRIi/CTRImax + NA; see Gómez et al., 2019). For the CTRI, the medium tidal range was set at 0.6 m at all sites due to their geographical proximity. The information to calculate NV, PT, EX and NA values was based on observations during sample collection at each site. Google Earth images from the year 2022 were used to confirm NV, EX and NA, and to measure each site’s water body area, maximum width and entrance width for the calculation of CTRIi. As for DG, the Ecological Value (EV) or number of ecological singular elements in a 1 km buffer distance around the water surface where the port activity takes place was estimated to be similar for all sites and was not used to calculate St.
Three 14 x 14 cm polyvinyl chloride (PVC) settlement panels were deployed at each site in two consecutive three-month periods following Janiak (2021) (Figure 1B): from August 2023 to November 2023, and from November 2023 to February 2024. The deployment followed a standardised protocol developed by the Smithsonian Environmental Research Centre (Marraffini et al., 2017), which is widely adopted for NIS monitoring in port environments (see Ruiz and Hewitt, 2002; Ros et al., 2023). In this study, the passive collector (substrate) was composed of an unsanded PVC settlement panel attached horizontally to a brick and suspended facing down at a depth of 1-2 m below the surface using a rope. At GAAL, panels were hanging under a concrete dock. At GACG and VISP, they were attached to floating pontoons. Due to the lack of artificial structures at GATL, AMCG, TBKF and WHER, panels were suspended from overhangs of shallow coral reefs in these locations. An Onset HOBO TidbiT MX Temperature 400-ft Data Logger (MX2203) was deployed at 1 metre depth at each site and temperatures recorded at 30-minute intervals, from August 2023 to February 2024. These were attached to one of the settlement structures at each site (Figure 1C).
After retrieval, each panel was detached from the brick, moved to a tray and covered with local seawater Panels were then photographed using a Canon R5 camera with two external flashes. Raw pictures were processed and cropped to the same size and resolution and used for point count analysis (Figure 1C, PhQd). A digital quadrat with 50 random points, stratified within a 5 x 5 grid, was placed over the images, covering the centre of the panel and discarding a 2 cm border. Taxa coverage on panels, on a scale from 0 to 50, was obtained by quantifying species presence at each of the 50 points. An additional 0.5 coverage value was given to species present on panels but that were not represented by point-count coverage. Points on areas of the panels without biofouling were marked as bare. The species list used for photo-analysis was obtained after collecting and identifying specimens from panels (see following paragraph for details). Image analyses were carried out using PhotoQuad v1_4 (Trigonis and Sini, 2012).
After photographing, panels were examined under a binocular stereoscope to collect macroinvertebrate specimens (>1 mm). Additionally, the brick and rope of each settlement structure were visually examined to increase the baseline voucher collection (see Figure 1C). These additional specimens were not included in the statistical analysis. At least one, but preferably three specimens (or colony portions) of each morphospecies, were collected at each sampling site. Whenever possible, at least one specimen or a portion of a colony was left on the plate for downstream processing. Before fixation, some taxa were anaesthetised using MgCl2 (polychaetes and molluscs) and menthol (ascidians) to facilitate the observation of morphological characters. For ascidian vouchers, a tissue subsample for molecular processing was taken in the field and stored in 96% ethanol, whereas the remaining animal was preserved in 10% formalin for morphological analysis. For all other taxa, vouchers were preserved in 96% ethanol in the field, and subsampled later in the laboratory. Tissue was subsampled using a sterile blade. In summary, each collected specimen generated one voucher sample for morphological identification (MorID), and a subsample for molecular processing (BarC). Where possible, morphological identification was conducted to the species level; otherwise morphospecies were designated, defined as unique, morphologically homogeneous groups, and identified to a lowest possible taxonomic level (MorID). Morphospecies were, if possible, confirmed by molecular analysis (BarC).
After the collection of voucher specimens, the biofouling assemblages attached to the panel were scraped off using a spatula, homogenised and preserved in 96% ethanol at ratio of 1 part of biological material to 4 parts ethanol. Ethanol was replaced after 24 hours to remove the excess of water before long-term storage at 4°C for downstream sample processing (Refer to Section 2.6. ‘Processing of panel scrapings (bulk DNA) and water samples (eDNA)’). All instruments used during retrieval and further sampling/subsampling were sterilised by rinsing them successively with 10% bleach, MilliQ water and 96% ethanol.
The DNA of voucher subsamples was extracted using the QuickExtract™ DNA Extraction Solution kit (Lucigen). A piece of tissue and 50 µL of the lysis buffer were placed in a sterile tube, which was then incubated in a heat block for 30 minutes at 65°C, followed by an additional 2 minutes at 95-98°C. DNA extracts were used to amplify a fragment of about 658 bp of the cytochrome c oxidase subunit I (COI) gene. Successful PCR products were then purified using ExoSAP-IT™ PCR Product Cleanup protocol, according to manufacturer instructions and cleaned up amplicons were sent to KAUST CoreLabs Sanger service for forward sequencing (BarC). Unsuccessful PCR products were discarded and amplification was repeated with 1:10 or 1:100 dilutions of the DNA extracts. LOBO primers were used as default for COI amplification, and Folmer primers were used for samples that failed repeatedly with LOBO (Supplementary File 1: Table S.1.1).
The trace files obtained from the voucher tissue subsamples (BarC) were inspected and edited using Geneious Prime software (ver. 2024.0.27; www.geneious.com). All sequences shorter than 500 bp or with poor quality (i.e., with evidence of contamination) were discarded. Sequences of non-indigenous species (NIS) and cryptogenic species (refer to Section 2.8 for details on how the biogeographical status of species was assigned) were searched against the NCBI-nt database using the Basic Local Alignment Tool (BLAST) provided by National Centre for Biotechnology with default parameters (https://blast.ncbi.nlm.nih.gov/Blast.cgi). The dataset was aligned using MAFFT online with default parameters (ver. 7.0, https://mafft.cbrc.jp/alignment/server/; Katoh and Standley, 2013). The DNA alignment GenBank accession numbers and its metadata can be accessed at the BOLD Systems (see project DOI at Data Availability section).
Assemble Species by Automatic Partitioning (ASAP) was used to obtain Molecular Operational Taxonomic Units (MOTUs) (Puillandre et al., 2021). This analysis was implemented via a web interface (https://bioinfo.mnhn.fr/abi/public/asap/asapweb.html) with default settings using the Kimura (K80) distance matrix. The lower the score, the better the partition. Neighbour Joining (NJ) phylogenetic analyses were performed using Molecular Evolutionary Genetic Analysis (MEGA, ver. 7, https://www.megasoftware.net/; Kumar et al., 2016). The phylogenetic tree was inferred using the Kimura 2 - Parameter model (K2P). Branch support for the estimated tree was assessed using 500 bootstrap. The final version of the tree was visualised and edited with Inkscape (v. 1.2; see https://www.inkscape.org).
At each site, five water samples were collected during each retrieval event by submerging 2-litre Nalgene bottles just below the water surface (Figure 1C). Samples were transported on ice to the laboratory for immediate processing (maximum time from collection to filtration was 1 hour) or filtered on site when possible. Filtration of water samples was done using a 0.22 μm (47 mm diameter) Millipore filter membrane placed on a 6-branch aluminium manifold Vacuum Filtration System. Negative controls consisting of 500 ml of MilliQ water were filtered following the same conditions as experimental water samples. Each filter was placed into a 5 ml cryovial, submerged in liquid nitrogen (LN2) and transported to the laboratory where they were stored at -80°C until DNA extraction.
Two different sources of DNA were analysed: the DNA extracted from the biofouling samples (i.e., scraping from the panels) and referred to as bulk DNA, and environmental DNA extracted from the filters used for water collections, referred to as eDNA. For bulk DNA, between 0.4-0.6 grams of material were used for DNA extraction using the DNeasy PowerLyzer PowerSoil Kit (QIAGEN) with an overnight incubation at 56°C (Leray et al., 2013). For eDNA, extraction was done as in Aylagas et al. (2024). Blanks were included in each extraction. Each DNA sample was normalised to 5 ng/μL using nuclease-free water and stored at −20°C until further processing.
A two-step PCR procedure was followed for COI and nuclear small subunit ribosomal DNA (18S rRNA) genes library preparation. Each sample was amplified in triplicate using the universal primers mlCOIint/jgHCO2198 (Leray et al., 2013) and Uni18SF/Uni18SR (Zhan et al., 2013), in a 25 μL PCR reaction consisting of 1 μL of 10 μM of each forward and reverse primer, 12.5 μL of KAPA HiFi HotStart DNA Polymerase (HotStart and Ready Mix formulation, KAPA Biosystems), 8.5 μL of RNA free water, and 2 μL of genomic DNA. PCR conditions are detailed in Supplementary File 1 (Table S.1.2).
A second PCR was used to attach a unique combination of Illumina dual indexes (Nextera™ XT Index Kit) to the Illumina sequencing adapters of each pooled sample. Final quality control, including library quantification, normalisation, and pooling, was done using a Bioanalyzer DNA 1000 chip and qPCR. Bulk DNA and eDNA libraries were loaded into the Illumina MiSeq and NovaSeq 6000 sequencing platform (v3 chemistry), respectively, at KAUST (Bioscience CORE Labs) to determine sequence reads. Twenty percent phiX was included for internal control. Sequence data were automatically demultiplexed using MiSeq Reporter (v2), and forward and reverse reads were assigned to samples.
The standard DADA2 pipeline (Callahan et al., 2016) was used to process the 18S rRNA and COI gene-based amplicon libraries. This process is detailed at Supplementary File 1 (Text S.1). After the filtering steps, a total of 3307 and 13197 COI ASVs, and a total of 2936 and 19079 18S ASVs were retained for bulk DNA and eDNA, respectively.
The datasets containing taxa coverage on panels (PhQd) and DNA metabarcoding analysis results (i.e., bulk DNA and eDNA, both COI and 18S) were used for multivariate analyses. The PhQd dataset was square-root transformed before analyses, as coverages ranged from 1 to 50. Bulk DNA and eDNA datasets, with ASV read abundances ranging from 1 to tens-of-thousands, were fourth-root transformed before analyses. After transformation, datasets were used to calculate Bray-Curtis dissimilarity resemblance matrixes. PERMDISP and PERMANOVA analyses with 1999 permutations were carried out for each dataset, testing the orthogonal fixed factors Time (2 levels: November and February) and Site (7 levels: AMCG, GAAL, GACG, GATL, TBKF, VISP and WHER) using Type III sum of squares (Anderson et al., 2008). Pairwise comparisons were tested for significant factors and interactions (P(perm) threshold <0.05). Pairwise analyses were carried out using Monte Carlo tests due to the low number of permutations (<100) allowed by the existing number of replicates. Data was visualised using Principal Coordinates Analysis ordinations (PCOs). Species with a Pearson correlation of >0.5 with any of the PCO axes were added as vectors to the PCO plots. For bulk DNA and eDNA, only those ASVs that were assigned to species level for COI and to genus level for 18S were used for the PCO vectors. To do that, ASVs assigned to the same taxa were merged before being added as vectors to the PCOs. Finally, all taxa from untransformed PhQd dataset were summed to obtain total biofouling coverage on panels, which was used to test the same Site x Time design with univariate PERMDISP and PERMANOVA using Euclidean distances. Analyses were carried out using PRIMER 7 +PERMANOVA (Anderson et al., 2008; Clarke and Gorley, 2015).
Each species was individually screened for their native and non-native ranges. The taxonomic assignments from COI and 18S ASVs of bulk DNA and eDNA were compared against an updated version of the potential marine NIS list for the Red Sea (Aylagas et al., 2024). The biogeographical status was revised for the species that matched this list, as well as for voucher samples identified to the species level with morphological methods. The status ‘non-indigenous’ was assigned to species not historically present in the Red Sea and who’s presence in the study region likely resulted from human-mediated introductions (Carlton and Schwindt, 2024). Taxa with unknown or poorly known evolutionary and biogeographical origin, which could potentially be non-native to the Red Sea were classified as ‘cryptogenic’ (Carlton and Schwindt, 2024). This category also included unresolved species complexes non-historically present in the Red Sea, which were considered as cryptogenic, with their native range designated as ‘unknown’, despite the existence of previous publications suggesting possible native ranges. Special consideration was given to species from the Indian Ocean that could have been introduced to the Red Sea when collecting evidence on historical distribution of species.
The sites inside Sharma lagoon, GACG and VISP, had the highest environmental risk (Figure 2A). In particular, GACG was the site under the highest environmental pressure (Pr) and, along with VISP, the site with a more vulnerable environmental status (St) (Supplementary File 1: Table S.1.3). Despite their lower naturalness, the complexity tidal range index (CTRI) was much higher for GACG and VISP than the rest of sites, which resulted in an increase of St. This reflects the higher vulnerability of semi-enclosed lagoons to impacts (e.g., pollutants, spills and eutrophication). Finally, the higher human presence at and south of Sharma lagoon resulted in higher Pr values for GACG, VISP, TBKF and AMCG, while GATL and GAAL (both in Gulf of Aqaba) had the lowest environmental risk because of their remoteness to the impacted sites (low Pr).
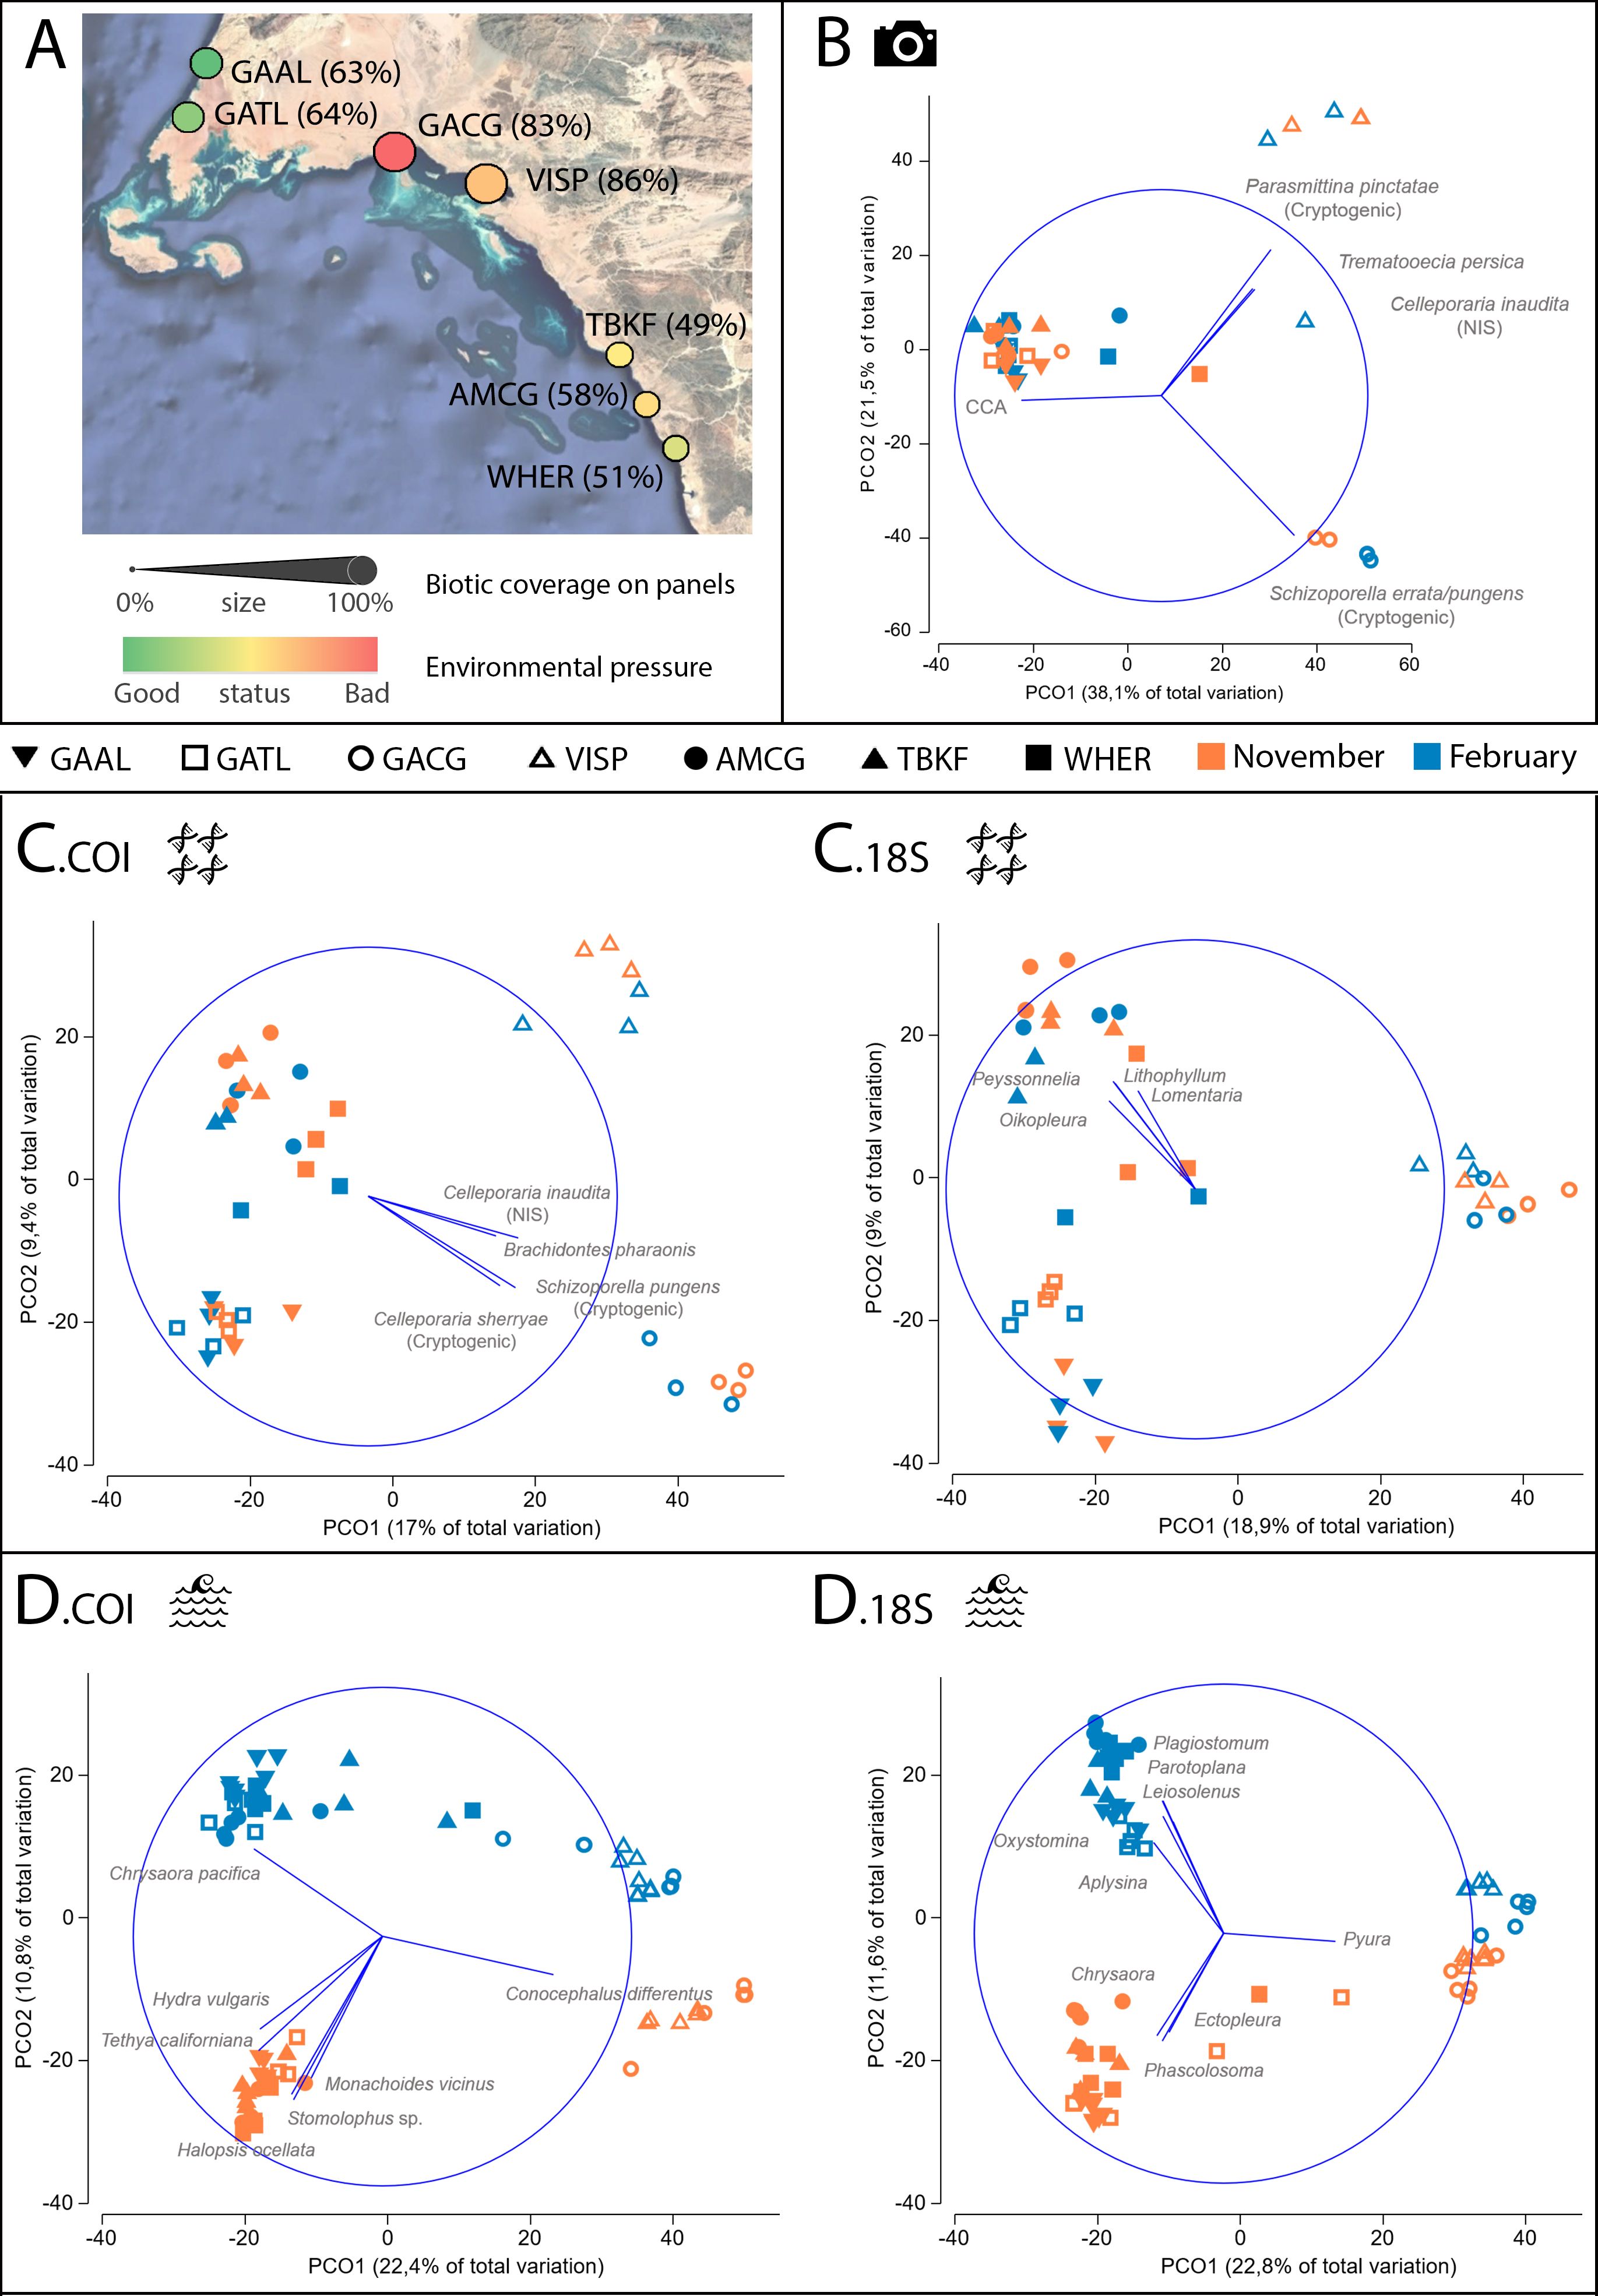
Figure 2. (A) Map of study sites. Site colour denotes the environmental risk assessment (ERA) results (colour gradient obtained from Supplementary File 1, Table S.1.3), while the size of the site marker indicates average percent biotic coverage on panels. (B) Principal coordinates ordination (PCO) for biofouling coverage on panels, obtained from the point count analysis of images (PhQd = camera icon). Taxa with a Pearson correlation (r) >0.5 with any of the PCO axes are displayed as blue vectors; the blue circumference represents the maximum possible correlation (r = 1) on the ordination plot. (C) PCO plots of panel scrapings (bulk DNA) for COI (C.COI) and 18S (C.18S) datasets (bulk DNA = DNA strands icon). (D) PCO plots of water collections (eDNA) for COI (D.COI) and 18S (D.18S) datasets (eDNA = waves icon). Sites: GAAL, Almujawah Lagoon; GATL, Taba Lagoon; GACG, Gayal Coast Guard; VISP, Vista Pier; AMCG, Al Muwaileh Coast Guard; TBKF, Tabouk Fisheries; WHER, Wadi Her.
In all sites, the highest water temperatures were recorded in September 2023 and the lowest temperatures in February 2024 (Figure 3). Temperature variation was greatest in the sites located in the coastal lagoon (GACG and VISP), where the highest and lowest values were recorded: from 34°C to 15°C and from 35°C to 19°C, respectively. In contrast, sites in the Gulf of Aqaba (GAAL and GATL) had the lowest maximum temperatures (30°C), with minimum temperatures of 20°C, while AMCG, TBKF and WHER showed the highest minimum temperatures, ranging from 33°C to 22°C.
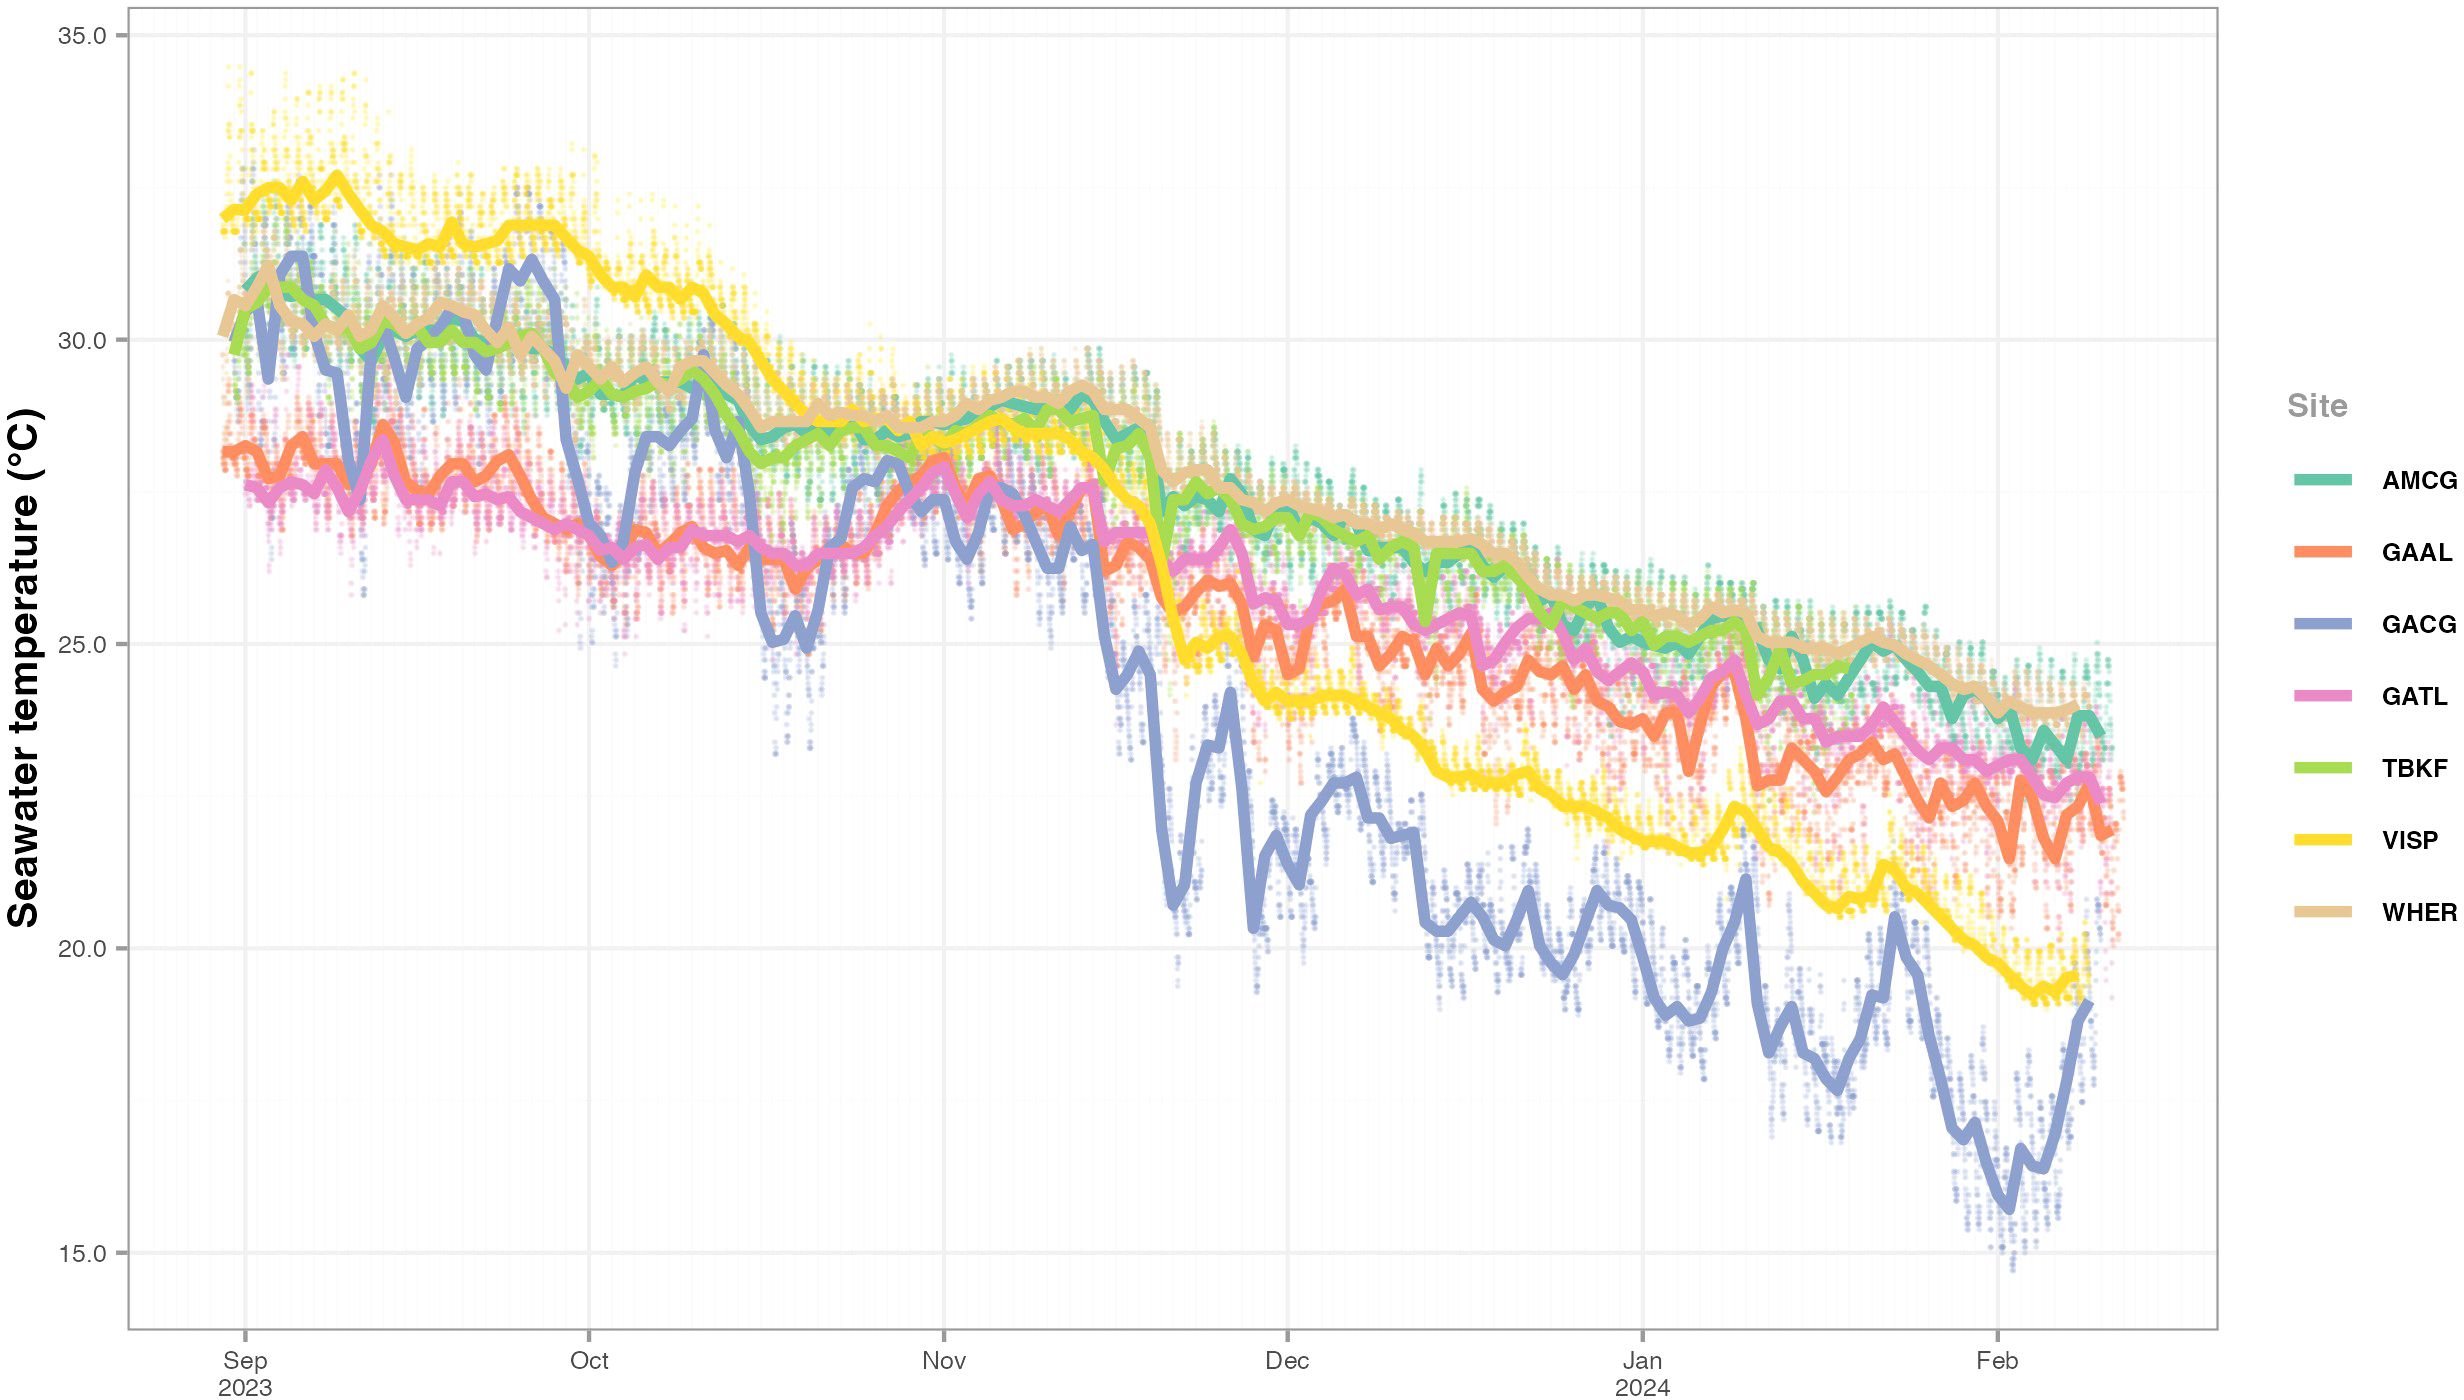
Figure 3. Temperature values recorded at each site for the duration of the study. Dots indicate discrete measurements, obtained every 30 minutes, and lines indicating daily median values. Sites: GAAL, Almujawah Lagoon; GATL, Taba Lagoon; GACG, Gayal Coast Guard; VISP, Vista Pier; AMCG, Al Muwaileh Coast Guard; TBKF, Tabouk Fisheries; WHER, Wadi Her.
Significant variation in total biofouling coverage on settlement panels was observed across sites (Pseudo-F = 3.67, P(perm) 0.013; Supplementary File 1: Table S.1.4). The two sites in Sharma lagoon (GACG and VISP) had the highest biofouling coverage, while TBKF and WHER showed the lowest values (Figure 2A). For the biofouling structure on panels from image analysis (PhQd), the main source of assemblage variation was explained by differences among sites (see MS in Table 1A). Remarkably, no NIS or cryptogenic species were visible on PhQd images at any site outside Sharma lagoon. The panels of sites outside Sharma lagoon were mainly associated with crustose coralline algae (CCA) and had a low coverage of heterotrophs, whereas VISP had an average 18% coverage of NIS and cryptogenic bryozoans (Celleporaria inaudita, Schizoporella errata/pungens and Parasmittina pinctatae), and GACG had an average 62% coverage of S. errata/pungens (Figure 2B).

Table 1. Multivariate PERMANOVA results for Time and Site using PhQd, bulk DNA and eDNA datasets.
Panel scraping analyses (bulk DNA) revealed patterns similar to PhQd, with GACG and VISP having assemblage compositions distinct from sites outside Sharma lagoon (Figure 2C, Table 1B). Results were clearer for the COI dataset compared to the 18S dataset. Likewise, the contribution of ASVs assigned to the encrusting bryozoans C. inaudita, C. sherryae and S. errata/pungens species complex, and the mytilid Brachidontes pharaonis was higher in Sharma lagoon (particularly at GACG) than in the rest of sites. The bulk DNA additionally segregated those sites in Gulf of Aqaba (GAAL and GATL) from the southernmost sites (TBKF, AMCG and WHER). In the case of 18S, ASVs assigned to several benthic macroalgae of the family Florideophyceae and the planktonic tunicate Oikopleura were associated with these differences, with TBKF, AMCG and WHER having a higher contribution of these ASVs (see Figure 2C).
While the differences in biofouling assemblages on settlement panels (PhotoQuad and bulk DNA analyses) mainly occurred among sites (Table 1), pairwise comparisons of the eDNA dataset also showed differences between sampling times, across all sites (Table 1C). For the COI dataset, the main species associated with these differences were Medusozoa (Halopsis ocellata, Chrysaora pacifica and Stomolophus sp.) and Demospongiae (Tethya californiana), which had a higher contribution in November except for C. pacifica that was more prevalent in some of the sites in February. In this case, sites from Sharma lagoon (GACG, VISP) also segregated from the rest of sites despite all sites being different from each other. However, there were species involved in the spatio-temporal differences in this dataset that could reflect misidentifications or residual DNA from terrestrial sources such as the freshwater hydrozoan Hydra vulgaris, and the terrestrial gastropod Monachoides viridis and hemipteran Conocephalus differentus (Figure 2D). For 18S, all genera correlated to the PCO axes were marine, with Platyhelminthes (Plagiostomum and Parotoplana), Bivalvia (Leiosolenus), Nematoda (Oxystomina) and Demospongiae (Aplysina) having a higher contribution in November than February. Contrary to the eDNA COI dataset, Chrysaora had a higher contribution in February than in November, as did the medusozoan Ectopleura and the sipunculid Phascolosoma. Finally, Ascidiacea (Pyura) was more associated with differences among sites, with more ASVs in GACG and VISP (Figure 2D).
A total of 39 settlement structures were retrieved. However, three structures were lost before retrieval: one from WHER in November, and one each from TBKF and WHER in February. A total of 204 macroinvertebrate species and morphospecies (hereinafter referred to as ‘morphospecies’ altogether), belonging to 99 families, 49 orders and 9 phyla, were identified from the voucher samples collected from the structures, including ropes, bricks and panels (see full morphospecies list at Supplementary File 2: Table S.2.1, summarised in Table 2). Annelida was the richest phylum, with Phyllodocida (67 morphospecies) being the most represented order (see Table 2A). Arthropoda was the second richest phylum, and it was composed mostly of Decapoda (48 morphospecies) and Amphipoda (45 morphospecies). The sites GATL and GACG had the highest number of taxa, with 77 and 75 morphospecies, respectively. GACG had an especially high number of Annelida taxa (41 morphospecies), followed by GATL, with 23 morphospecies. The highest number of families (53) occurred in GATL, followed by VISP and GACG (43 and 41, respectively) (see Table 2A).
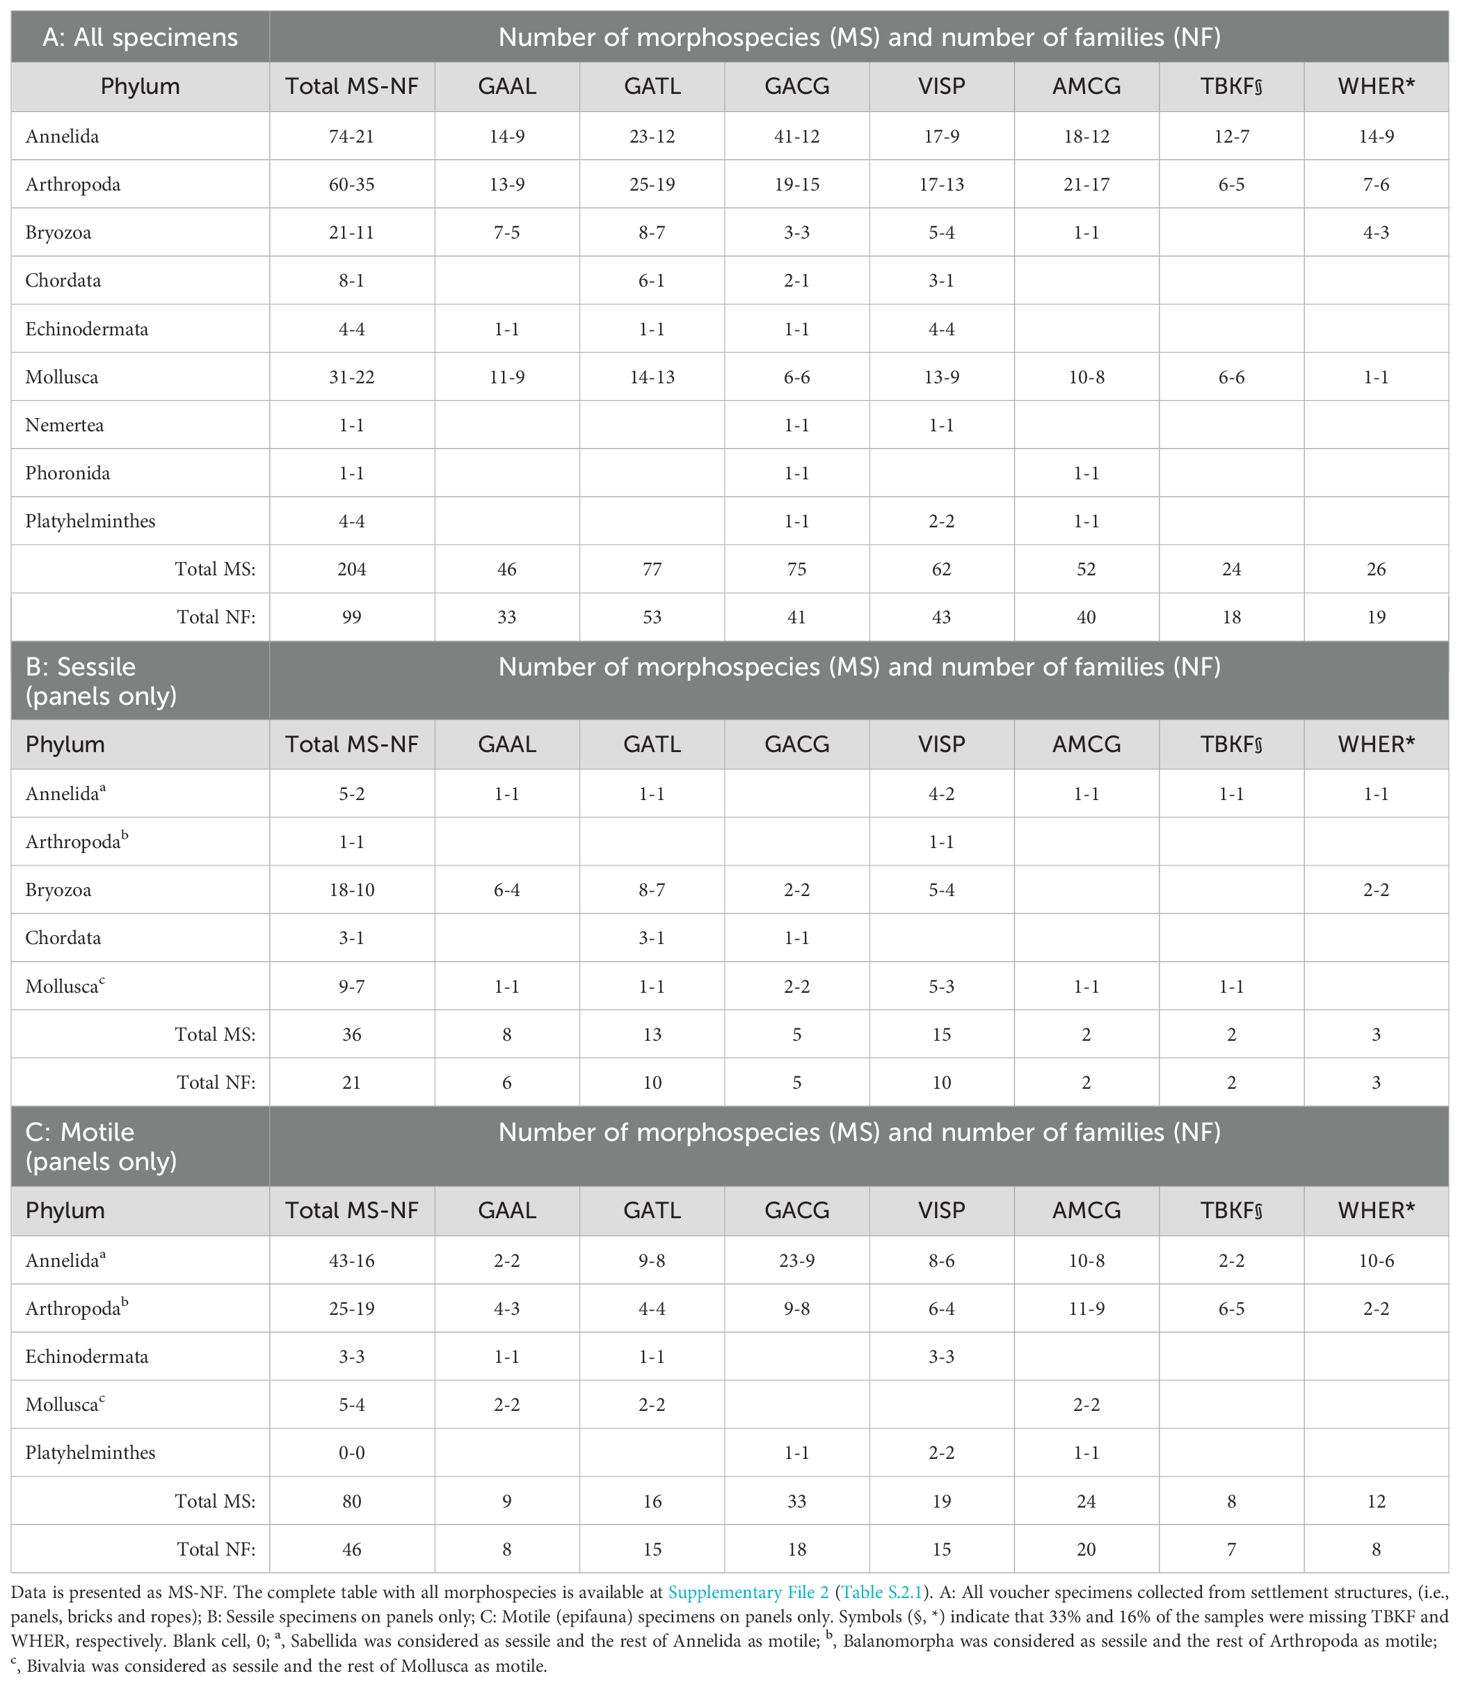
Table 2. Number of macroinvertebrate species and morphospecies (MS) and families (NF) that were morphologically identified for each phylum and site.
Average success of amplification of voucher sequences was around 80%, with most phyla having a success between 75% and 90% except for Echinodermata (94%), Mollusca (50%) and Ascidiacea (30%). Low success rates for the latter two groups were due to the use of general extraction and amplification methods, and universal primers for marine metazoans. In total, 494 sequences were generated by the BarC dataset, representing a total of 184 MOTUs, with Annelida and Arthropoda being the most represented phyla (see Figure 4).

Figure 4. (A) Neighbour-Joining circular Phylogenetic Tree using Kimura 2-parameters model for the BarC dataset, rooted to Deuterostomia (Echinodermata). A total of 488 sequences are displayed, where each colour corresponds to the respective major group and subgroup. Bootstrap values lower than 85% are not displayed. Other = Nemertea (4 sequences and 4 MOTUs) and Phoronida (1 sequence and 1 MOTU); Other within Arthropoda = Mysida and Pycnogonida (2 sequences each). (B) Unrooted Neighbour-Joining Phylogenetic Tree using Kimura 2-parameters model for Ascidiacea (ascidians were not included in the main tree due to very divergent sequences). Numbers next to major groups and subgroups indicate the number of sequences. The number of total Molecular Operational Taxonomic Units (MOTUs) for major groups are also indicated.
The addition of bricks and ropes to the collection of specimens resulted in the detection of 76% more morphospecies and 48% more families than when considering only panels (Table 2). For the macrofauna on panels, sessile fauna was dominated by Bryozoa, with 18 morphospecies in total, and the highest number of taxa detected was at GATL. However, the site with highest overall richness on structures was VISP, particularly because of Annelida and Mollusca (see Table 2B). The motile fauna was dominated by Annelida (highest at GACG), followed by Arthropoda (Table 2C).
For the bulk DNA from panel scrapings, a total of 67 species, belonging to 48 families, 31 orders, and 11 phyla, were identified using COI; and 122 genera, belonging to 104 families, 79 orders, and 20 phyla using 18S (see full ASVs list for bulk DNA and eDNA datasets in Supplementary File 3). For the eDNA ASVs from seawater samples, a total of 880 species, belonging to 445 families, 198 orders, and 24 phyla, were identified using COI; and 275 genera, belonging to 222 families, 151 orders, and 30 phyla using 18S.
A total of 20 NIS and 18 cryptogenic species were recorded from structures and seawater samples (see Table 3). However, only five NIS and seven cryptogenic species were identified from the 204 morphospecies in MorID dataset (Supplementary File 2, Table S.2.1), thus confirming their presence in NEOM’s waters. From those, three species could not be barcoded (BarC), although two from these three were detected in the bulk DNA dataset (Table 3); from MorID, only Phallusia nigra was not confirmed with molecular methods. The remaining 26 species were detected only in both bulk DNA and/or eDNA datasets. Overall, each method used for species detection was informative for the detection of NIS and cryptogenic species, and each one registered four to six species that were not detected with the other methods (see Figure 5). Only 5.3% of the species were detected by all methods, whereas 71% were detected with only molecular methods (bulk DNA and eDNA).
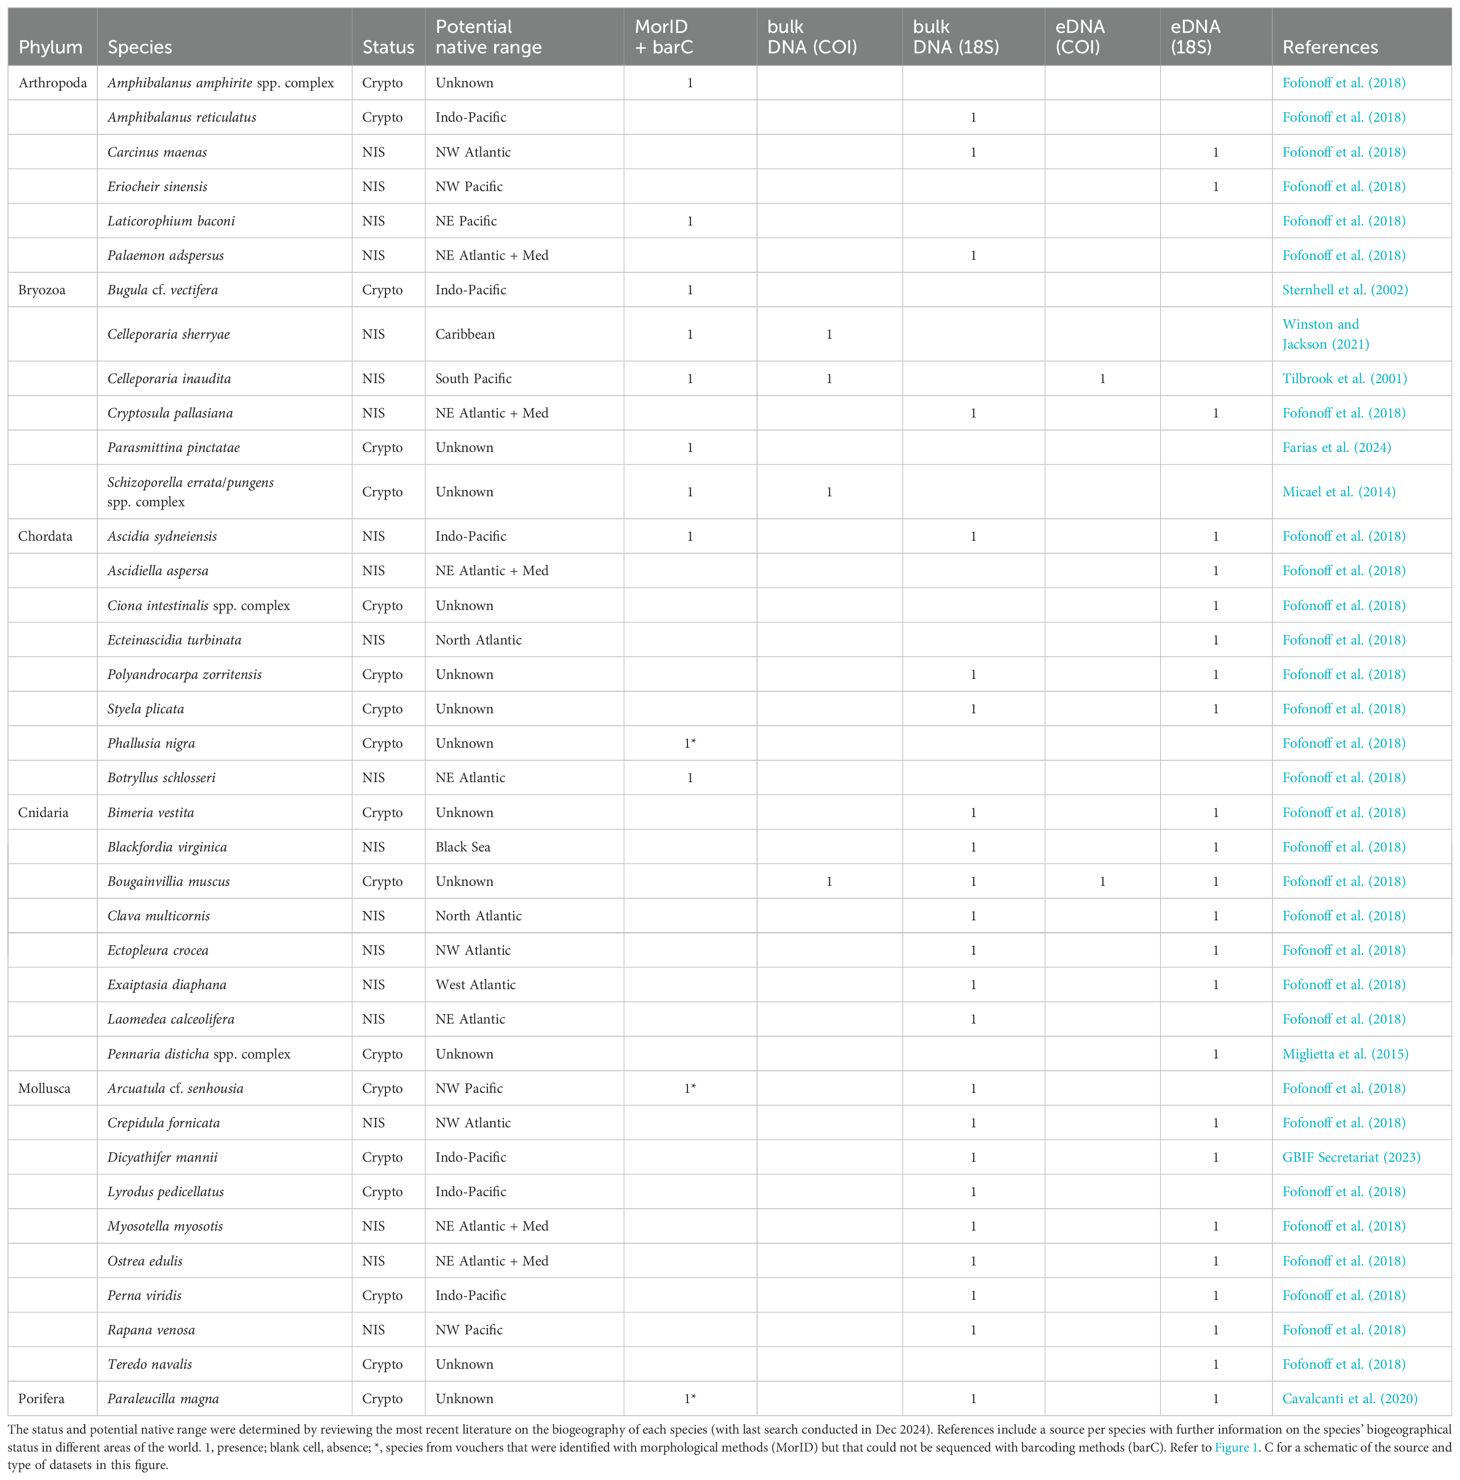
Table 3. List of cryptogenic species (Crypto) and non-indigenous species (NIS) detected with different methods: vouchers collections identification and barcoding (Morpho-ID + COI), bulk DNA analyses of panel scrapings (bulk DNA: COI and 18S), and eDNA analyses from water samples (eDNA: COI and 18S).
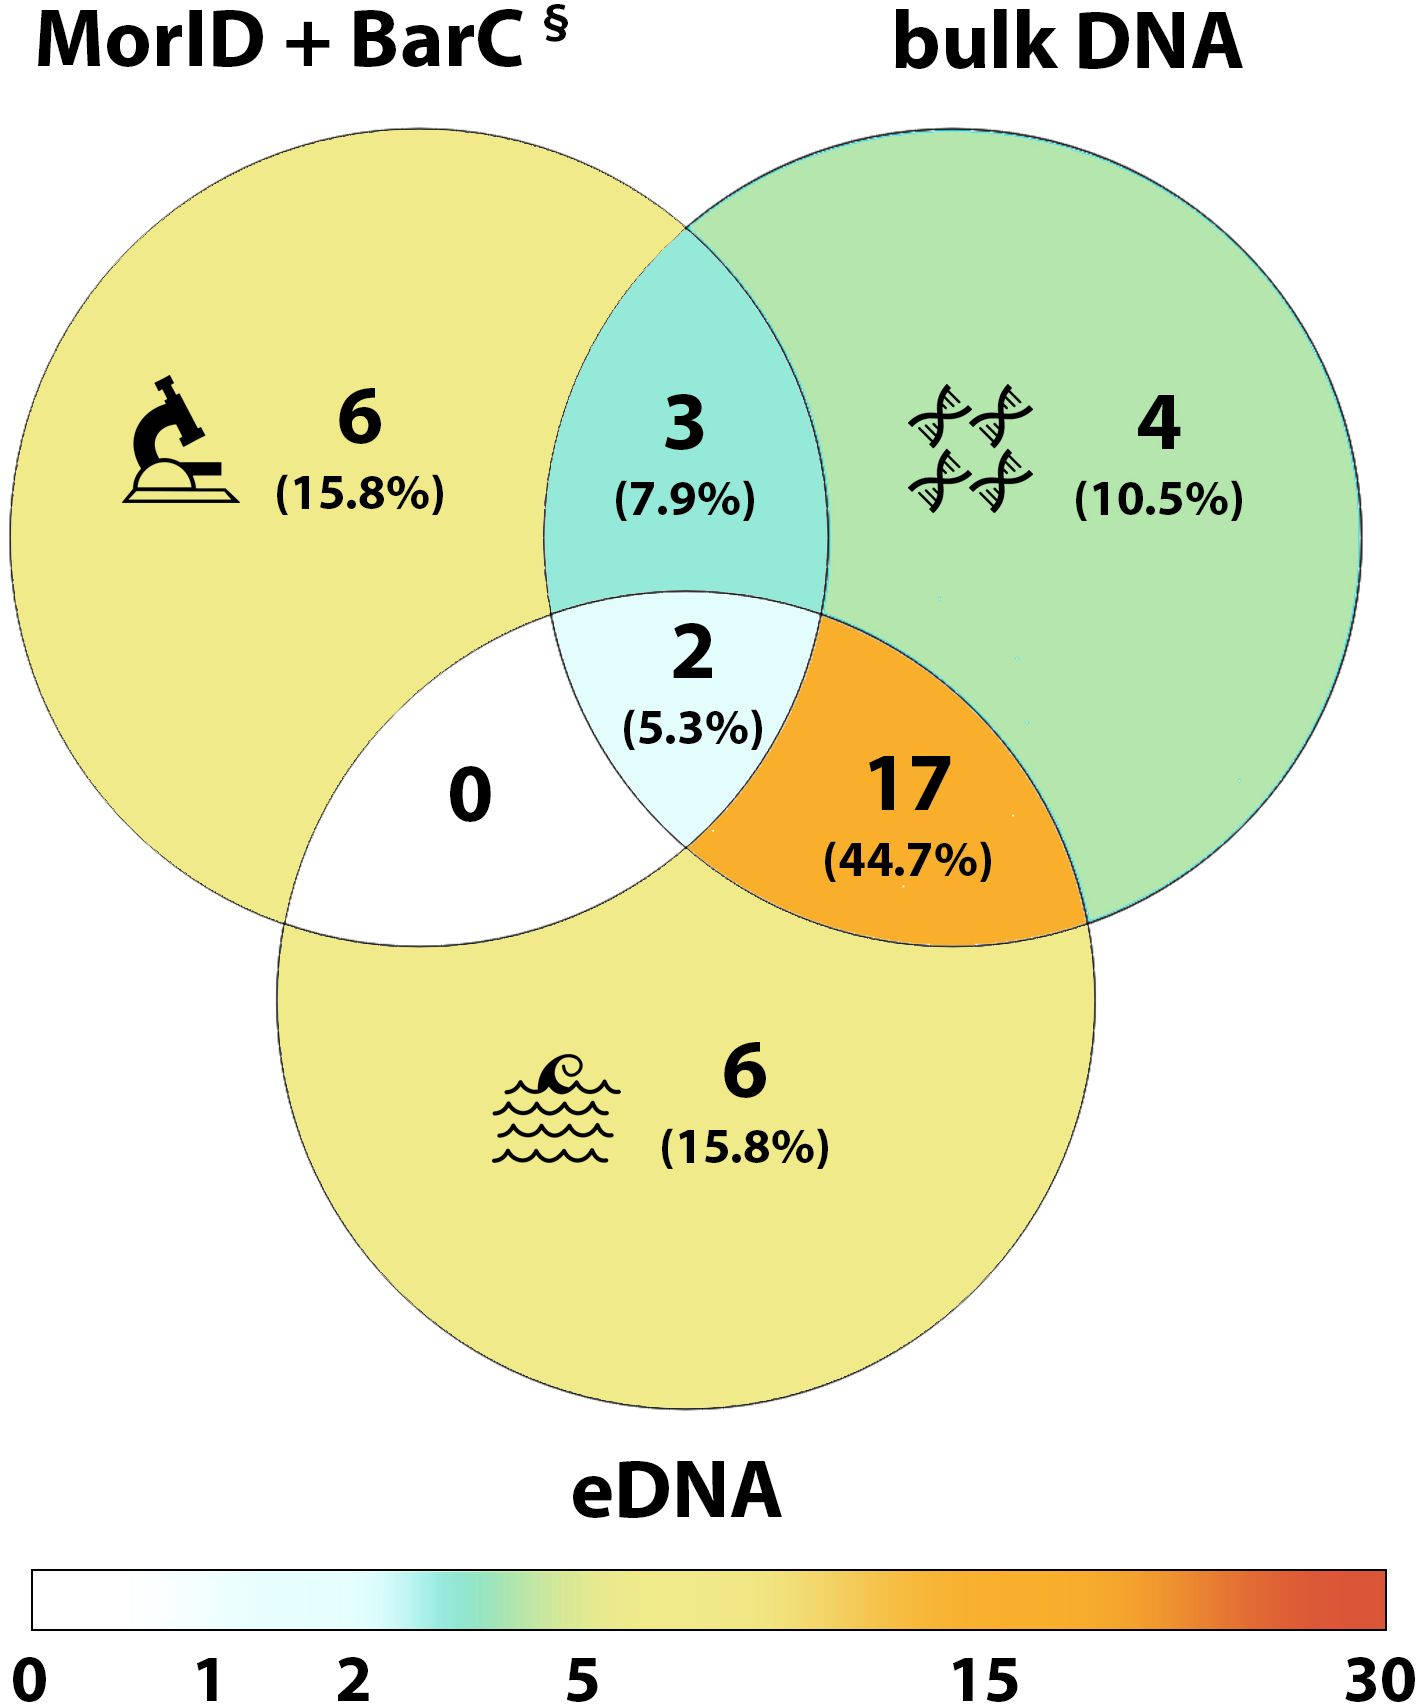
Figure 5. Venn diagram showing the number and percentage of non-indigenous and cryptogenic species detected with each method: vouchers collection and identification through morphological investigation and COI barcoding (MorID + BarC), bulk DNA of panel scrapings (bulk DNA), and environmental DNA from water samples (eDNA). Background colour in the Venn diagram indicates the number of species in each category, from white (0) to orange (17). Bulk DNA and eDNA include both COI and 18S results. § = three of the morphologically identified species could not be sequenced, although two of them were detected from bulk DNA of panel scrapings (see Table 3).
Despite being largely an undisturbed region, NEOM hosts a diverse array of non-indigenous and cryptogenic species. Overall, the findings of this study provide valuable insights into the structure and dynamics of biofouling communities in the NEOM region prior to extensive development activities. Studies performed before interventions are infrequent, making NEOM an ideal case for investigating the ecological impacts of large-scale development on marine communities. Our findings are in line with other studies showing a higher abundance (i.e. percent cover on panels) of non-indigenous species (NIS) and cryptogenic species in areas with higher environmental vulnerability, such as estuaries and coastal lagoons, which typically also have higher human pressures and habitat modification (i.e., Rodríguez-Gallego et al., 2017; Chebaane et al., 2023; Sempere-Valverde et al., 2023, 2024; this study). These factors are likely promoting the dominance of NIS and cryptogenic species in the region, in particular bryozoans, highlighting NEOM’s susceptibility to bioinvasions (Fernandez et al., 2022; this study). As NIS abundance is closely linked to human density, ongoing demographic growth is likely to further increase bioinvasion levels in the region (Castro et al., 2022; Ros et al., 2023; Sempere-Valverde et al., 2023; NEOM, 2024). Given NEOM’s proximity to the Suez Canal, a major conduit for NIS transfer, its vulnerability is expected to intensify as construction progresses. The management of bioinvasions will require the implementation of sustained biofouling surveillance programs as an integral part of the ongoing conservation framework in NEOM (Carvalho et al., 2023). This can be implemented by the incorporation of biofouling management within sustainable development strategies, such as ecological engineering solutions (Guerra-García and García-Gómez, 2005; Firth et al., 2016; Sempere-Valverde et al., 2023). This will be crucial to mitigate bioinvasion risks in this developing region, thereby contributing to the protection of NEOM’s ecological integrity and economic interests. Moving forward, the combination of molecular and traditional methods, essential for the surveillance and monitoring of NIS occurrence and distribution, will be crucial for mitigation and conservation as coastal modifications in NEOM continue.
Despite the environmental heterogeneity among sites, reflected in differences on water temperature and the variables of the Environmental Risk Assessment (ERA), the main source of fouling assemblages’ variation across sites (based on photo analysis of sessile communities (PhQd) and bulk DNA) occurred between sites inside and outside Sharma lagoon. Panels deployed in Sharma lagoon (at GACG and VISP) were exposed to unique environmental conditions characteristic of semi-enclosed water bodies. Similar to ports and marinas, coastal lagoons in arid areas experience higher temperature and salinity stress, lower hydrodynamic stress, increased effects from anthropogenic pressures, and different larval inputs and food availability when compared to open coastal waters (Pérez-Ruzafa et al., 2011a, b; Ansari et al., 2015; Rodríguez-Gallego et al., 2017; Albarakati and Ahmad, 2019). Coastal lagoons are among the most productive habitats in the Red Sea, providing a generally higher abundance of resources for invertebrates (El-Wahab et al., 2005; Alsaffar et al., 2020a); however, their semi-enclosed nature also results in increased residence time of terrestrial inputs (i.e. nutrients and pollution), which increases their vulnerability to human impacts (Ghandourah et al., 2023; Sempere-Valverde et al., 2023; this study). These conditions may have contributed to the faster growth of invertebrates and a lower coverage of crustose coralline algae on sites inside Sharma lagoon (Tâmega and Figueiredo, 2007; Svensson and Marshall, 2015). However, the faster recruitment and growth of macroinvertebrates, particularly NIS, might also have been promoted by the settlement structures being attached to floating substrates in both GACG and VISP, contrary to the rest of the sites.
Multiple studies have pointed out that floating substrates provide a novel habitat for fouling species, ultimately promoting macroinvertebrate and NIS growth when compared to fixed non-floating structures (Connell, 2000, 2001; Glasby, 2001; Holloway and Connell, 2002; Dafforn et al., 2009; Sempere-Valverde et al., 2024). While also located in a semi-enclosed water body, GATL showed a low coverage of sessile macroinvertebrates on panels but the highest number of morphospecies and families. These differences in richness could have resulted from the structures being attached to natural reefs, plus a generally better environmental status and lower human disturbance from ERA, which might be linked to more oligotrophic conditions and lower pollution levels at GATL than either GACG or VISP. This may have reduced macroinvertebrates and NIS dominance, favouring the settlement of more diverse assemblages outside Sharma lagoon. In addition to this, elevated water temperatures in Sharma lagoon (up to 35°C at VISP and 34°C at GACG) might also have accelerated the growth of sessile invertebrates. Warmer waters enhance metabolic rates and reproductive processes, leading to faster larval settlement and growth in tropical opportunistic species (Anderson, 1993; Whalan and Webster, 2014; Khosravi et al., 2019). This is consistent with findings from other regions, where higher temperatures significantly increased biofouling coverage (Greene and Grizzle, 2007; Rao, 2010; Sokołowski et al., 2017). Khosravi et al. (2019) showed that a 2°C rise in seawater temperature in the Arabian Gulf resulted in a 1.5-fold increase in biofouling. This is generally consistent with results inside Sharma lagoon. However, GACG showed the lowest temperatures among sites in February, but it still had a high coverage of biofouling, suggesting that temperature might have contributed to fouling growth, but was not the main driver of biofouling coverage.
While spatial variations were clearly observed for panels and scrapings, time emerged as a main driver of variation in the eDNA dataset, highlighting the high intra-annual variability of tropical shallow-water habitats (e.g., Berry et al., 2019; Alsaffar et al., 2020a). Overall, temporal variation in eDNA assemblages could be due to the combination of spawning events and the rapid degradation of DNA in aquatic systems, which increases eDNA’s sensitivity to seasonal patterns (Barnes et al., 2014). While panels were recording the recruitment events occurring during our three-months deployment period, eDNA would have only captured the immediate presence of eggs and larvae in the water during samplings, including low-abundant species, potential new records and early life stages. Therefore, monitoring and management plans should not only include different collection and identification techniques, but also be replicated at both spatial and temporal scales to better capture species diversity in the area.
As the NEOM region develops and the modification of coastal water bodies increases (see Ansari et al., 2015), faster growth and coverage of macroinvertebrate fouling might be expected, as it has been observed in other regions under similar conditions (Poloczanska and Butler, 2009; Ansari et al., 2015; Khosravi et al., 2019). This agrees with the results of this study, as the sites under higher environmental risk, according to ERA, exhibited higher coverage of macroinvertebrates, as well as NIS and cryptogenic species. This colonisation may be exacerbated by increasing temperatures resulting from climate change scenarios and could result in diversity shifts of native species and an increase in NIS coverage and dominance (Castro et al., 2021, 2022; Tempesti et al., 2022b; Zaiko et al., 2024). Along with the increase of fouling biomass, we could expect a similar increase in their associated epifauna. This was observed in GACG, where the high coverage of the semi-encrusting bryozoan Schizoporella errata/pungens on panels, likely increased spatial heterogeneity and refugia on the panels surface, contributing to a higher number and abundance of motile taxa, particularly Annelida (see Cocito et al., 2000; Morgado and Tanaka, 2001; Sellheim et al., 2010). Overall, these pioneer communities can provide new habitats for biofouling species and create favourable conditions for other NIS to establish and spread, accelerating their impact on native ecosystems and potentially triggering an invasion meltdown (Firth et al., 2021; Beshai et al., 2023). On the contrary, diverse assemblages contribute to overall biotic resistance (which refers to the ability of native species and ecosystems to resist invasion) due to higher functional trait richness and lower dominance levels, and therefore should be promoted as part of NEOM’s conservation and mitigation efforts (Beshai et al., 2023; Zaiko et al., 2024).
The high number of NIS and cryptogenic species detected using bulk DNA and eDNA confirms the potential of molecular tools for the identification of NIS (Fonseca et al., 2023). These techniques detected the majority of NIS and cryptogenic species reported in this study compared to morphological identification of the species, therefore we strongly recommend that molecular methods should be further expanded in the region. However, special attention should be given to the conclusions derived from molecular-based assessments, especially those relying on eDNA. Challenges associated with DNA degradation, transport, temperature, flow rate of the water or time since eDNA was released until it was captured can influence the detection of species (Fonseca et al., 2023; Aylagas et al., 2024). False positives are a likely potential risk, due to cross-contamination, errors during PCR and sequencing, and misidentifications on databases (Ficetola et al., 2015; Xiong et al., 2016; Duarte et al., 2021b; Gauff et al., 2023). It is not unusual to detect sequences of taxa that are non-native to the study sites, with blank and positive controls being key tools to confirm reliability of these records (Darling and Mahon, 2011; Couton et al., 2022).
This study followed protocols to minimise false positives by including the sequencing of field controls and laboratory DNA extraction blanks. However, the presence of terrestrial and freshwater species in the eDNA datasets indicates that external inputs (e.g., DNA input from water runoff and contamination) and/or misassignments of species are possible. Therefore, we suggest that identifications based on molecular data alone should be interpreted with caution, particularly those that constitute new records of NIS or cryptogenic species for a region such as NEOM or the Red Sea. The collection of specimens and ecological data should therefore remain critical for accurately assessing the bioinvasion status of these species (Xiong et al., 2016; Couton et al., 2022). For instance, previous studies have followed this approach in which species were first identified using DNA-based methodologies and only later confirmed through morphological identification (Thomsen et al., 2012; Borrell et al., 2018; Guerra-Garcia et al., 2023). Should this approach be established, it would be only after living individuals are collected that a NIS species’ presence in the region can be considered as confirmed.
An example of a potential false positive is the common Atlantic shore crab, Carcinus maenas, detected in this study from the 18S dataset and recently reported in the Red Sea using same marker (Aylagas et al., 2024). This globally invasive crab has a single historic record from the Red Sea, decades before the construction of Suez Canal (Savigny, 1817; Carlton and Cohen, 2003), with several subsequent authors including the Red Sea in the species’ distribution range (see short summary in Klunzinger, 1913). Since C. maenas is a large, conspicuous, shore-inhabiting crab, it would have been easily detectable. Therefore, considering the absence of recent records of C. maenas from the Red Sea, its detection using molecular tools and by only one marker should be interpreted carefully and be confirmed with further studies to conclude that an established population of this species exists in the region (Frederich and Lancaster, 2024). More generally, due to the low taxonomic resolution of the 18S genetic marker for species level identification (Zhang et al., 2018; Lee et al., 2023) it may not be the most suitable marker for accurate NIS detection. The same issue is exemplified by two other decapod species detected with 18S, Palaemon adspersus and Eriocheir sinensis, which are rather unlikely to be present in the study area. Consequently, assessing the suitability of 18S as a NIS-detection marker gene is a topic that deserves further research.
The identification of possible NIS is often hampered by the lack of accurate biogeographic information of species, which results in the characterization of many species as cryptogenic (Carvalho et al., 2023; Ros et al., 2023). Without dedicated studies using molecular data (i.e. DNA barcoding) from several different regions, it is challenging to differentiate between cosmopolitan species, cryptic species complexes, NIS and cryptogenic species. In the case of cryptic species complexes, some taxa may have a particular molecular lineage(s) with a widespread distribution, while others have more restricted ranges or even unique locations (Nygren, 2014). Examples of this can be seen in the Annelida dataset based on mobile Polychaeta (Supplementary File 4). Pseudonereis gallapagensis, originally described from Galapagos (Kinberg, 1865), has a documented distribution ranging three different oceans (Atlantic, Pacific and Indian oceans; WoRMS, Read and Fauchald, 2024). Our sequences from the northern Red Sea are molecularly distinct from Colombian Pacific specimens based on unpublished GenBank COI data, but morphologically similar to the syntype redescription by Bakken (2007) and the description by Conde-Vela (2018) using material from Peru and Chile. If correctly identified by all parties, our specimens are most likely a new undescribed species from the P. gallapagensis complex, which is apparently endemic to the Red Sea. However, data from surrounding areas, including the Indian Ocean, are needed to confirm this hypothesis. A similar example is observed in our specimens identified as Ceratonereis tentaculata. However, in this case, two separate Red Sea lineages were found both divergent from unpublished Genbank sequences from topotypical specimens from Hawaii (USA). This may be a case where further investigations on these deeply divergent lineages lead to the recognition of diagnostic morphological features that were previously overlooked (e.g., Teixeira et al., 2022, 2023).
The DS-BINIS BOLD project that resulted from this study (see Data Availability section) represents a critical advancement in biosecurity efforts by initiating and establishing a local DNA reference library for biofouling in the NEOM region. By using both morphological and molecular identification methods, it sets a baseline that will be continuously refined through updates and examination of voucher collections. This baseline is critical for improving molecular detection and increasing the accuracy of monitoring tools (Carvalho et al., 2023; Ros et al., 2023). The molecular sequences resulting from this study can help increase accuracy in future assessments, although the improvement of identification and biogeographical status assignment will depend on the continuous update and examination of voucher collections. This will benefit from more diverse sampling efforts, such as the collection of vouchers from different habitats (e.g., mature biofouling from existing structures), collector types (e.g., baited traps and habitat collectors) and sampling times, focusing on understudied taxonomic groups and including a more comprehensive assessment of the species taxonomy and biogeography (Puillandre et al., 2012; Berumen et al., 2013; Normant-Saremba et al., 2020; Ros et al., 2023). An example of increasing sampling effort is provided in this study by using bricks and ropes to collect specimens, which led to detecting twice as many morphospecies compared to that from using only panels. This not only provided a larger sampling surface, but different habitat characteristics, potentially leading to the presence of a different array of species than those found on panels. In addition, the detection and monitoring of species can also be improved by increasing the effort when processing molecular samples. For example, by using multiple markers and primers specific for taxonomic groups that might have been underrepresented, such as algae, ascidians and annelids (Iannotta et al., 2007; Sun, 2017; van der Loos & Nijland, 2021; Duarte et al., 2021b). Finally, more than 50% of ASVs from bulk DNA and eDNA datasets were not assigned to any family during analyses. Therefore, building curated regional barcode libraries and focusing on dedicated studies using integrative taxonomy to explore undescribed and cryptic lineages will be important for the continued improvement of molecular detection and biomonitoring tools (Carvalho et al., 2023).
The study of biofouling communities in areas under intense demographic growth and urban development will enhance our understanding on how coastal sprawl influences ecological dynamics and bioinvasion processes. Coastal development and increased exploitation of Saudi Arabia’s Red Sea resources, as planned and underway at several sites along the coast, are inevitable (Robitzch et al., 2023). However, this should not compromise biodiversity and ecosystem functioning, on which the long-term viability of a sustainable economy largely depends (Robitzch et al., 2023).
Lagoons have been proposed as singular ecosystems and biodiversity hotspots within the Red Sea (Alsaffar et al., 2020a, b). Lagoons are among the most impacted ecosystems by coastal constructions around the globe (Rodríguez-Gallego et al., 2017; Sempere-Valverde et al., 2023). In NEOM, Sharma lagoon is slated for development (NEOM, 2024), and the floating structures in this area are already dominated by potentially introduced species, which raises concerns about the bioinvasion status in natural habitats. For example, Schizoporella cf. errata and Celleporaria inaudita were abundant within the assemblages in Sharma lagoon, sometimes monopolizing the space on panels and the lateral surface of floating pontoons (pers. obs. JS-V). However, the extent and prevalence of these and other potentially introduced species in natural habitats is unknown, which limits our ability to detect and quantify possible bioinvasion processes and impacts. Therefore, Sharma lagoon should be a priority area for the mitigation of impacts and the conservation of native biodiversity. Nevertheless, the importance of preserving undisturbed areas in NEOM should not be overlooked, as some of these areas, such as Taba lagoon (GATL), as well as GAAL and AMCG, hosted a high diversity of morphospecies and families. As the region develops, the use of informed development and sustainable growth will be crucial for the conservation of Sharma lagoon and other NEOM coastal habitats (Robitzch et al., 2023).
Particular importance should be given to the elaboration of updated risk assessment for the NIS and cryptogenic species in NEOM to rank their priority in a biosecurity framework (e.g., Molnar et al., 2008; Clarke et al., 2020; Carvalho et al., 2023). These assessments require knowledge on the ecological status of species in different habitats. This study establishes a preliminary baseline that must be expanded to enhance understanding of the region’s biodiversity and improve tools for ecosystem and biosecurity management (Mandrak and Cudmore, 2015; Carvalho et al., 2023; Aylagas et al., 2024).
This study expands the knowledge of biofouling community composition and structure in the northern Red Sea, providing a preliminary list of non-indigenous and cryptogenic species in the area. It updates the current lists of biofouling NIS in the Red Sea (e.g., Aylagas et al., 2024) and sets the baseline for future studies and monitoring efforts not only in the NEOM region but in the whole of the Red Sea. However, much work is still needed to disentangle cryptic lineages and resolve the biogeographical history of species, particularly those native to the west Indo-Pacific but cryptogenic to the Red Sea. Future efforts should not only focus on monitoring coastal habitats and developing biosecurity strategies, but also on the identity and native range of species. This will improve our ability to assess and monitor biodiversity, perform bioinvasion risk and impact assessments and guide biosecurity management efforts (Carvalho et al., 2023). As coastal constructions expand, natural undisturbed areas such as NEOM are becoming both natural laboratories and conservation areas of global priority (Robitzch et al., 2023). These challenges also come with the opportunity to focus on an ecosystem-based management of coastal sprawl, through the implementation of nature-based engineering, circular economy, and sustainable growth (Firth et al., 2016; Robitzch et al., 2023).
The datasets presented in this study can be found in the Supplementary Material. The DNA alignment GenBank accession numbers and their metadata can be accessed at the BOLD Systems under the publicly available project “Characterization of biofouling organisms and potential NIS in NEOM: NEOM - NIS” (DS-BINIS) (DOI: https://dx.doi.org/10.5883/DS-BINIS). The raw reads from the sequencing of COI and 18S rRNA gene-based amplicons in this study are publicly available at the European Nucleotide Archive (ENA) under the study accession numbers PRJEB81309 and PRJEB81310, respectively.
JS-V: Data curation, Formal analysis, Investigation, Conceptualization, Visualization, Writing – original draft, Writing – review & editing. EA: Conceptualization, Data curation, Formal analysis, Funding acquisition, Investigation, Methodology, Project administration, Resources, Supervision, Validation, Writing – review & editing, Writing – original draft. VS: Data curation, Formal analysis, Investigation, Methodology, Validation, Writing – review & editing, Writing – original draft. MT: Data curation, Formal analysis, Investigation, Methodology, Validation, Visualization, Writing – review & editing, Writing – original draft. GK: Data curation, Investigation, Methodology, Writing – review & editing. SR-V: Data curation, Methodology, Writing – review & editing. SCh: Data curation, Investigation, Methodology, Writing – review & editing. AA: Data curation, Investigation, Methodology, Writing – review & editing, Writing – original draft. JC: Data curation, Investigation, Methodology, Software, Visualization, Writing – review & editing. RC: Investigation, Methodology, Writing – review & editing. DC: Data curation, Investigation, Methodology, Writing – review & editing. AD: Data curation, Investigation, Methodology, Writing – review & editing. LA: Investigation, Methodology, Writing – review & editing. CA: Data curation, Formal analysis, Methodology, Writing – review & editing. CB-C: Data curation, Formal analysis, Methodology, Writing – review & editing. MM: Investigation, Writing – review & editing. AP: Data curation, Investigation, Methodology, Writing – review & editing. DB: Data curation, Formal analysis, Investigation, Writing – review & editing. BA: Data curation, Formal analysis, Investigation, Writing – review & editing. FT: Resources, Writing – review & editing. AE: Resources, Writing – review & editing. SCa: Conceptualization, Funding acquisition, Investigation, Methodology, Project administration, Resources, Supervision, Validation, Writing – review & editing.
The author(s) declare financial support was received for the research, authorship, and/or publication of this article. This research has been supported by King Abdullah University of Science and Technology baseline grant to Susana Carvalho (BAS/1/1109-01-01) NEOM research grant #5209 "Biodiversity baseline assessment and monitoring" (RGC/3/5209-01-01). Sofía Ruiz-Velasco was supported by a predoctoral grant awarded by ‘Ministerio de Universidades’ (Reference FPU21/02406).
This is contribution 148 from the Smithsonian’s MarineGEO and Tennenbaum Marine Observatories Network. We would like to thank Sultan Dari and the rest of the NEOM (OSSARI) team: Arwa Hassan, Jon Lapeyra and Enjey Ghazzawi, for their help and assistance during samplings and the two reviewers for their valuable comments and suggestions, which greatly improved the final version of this manuscript.
The authors declare that the research was conducted in the absence of any commercial or financial relationships that could be construed as a potential conflict of interest.
The authors declared that they were an editorial board member of Frontiers, at the time of submission. This had no impact on the peer review process and the final decision.
The author(s) declare that no Generative AI was used in the creation of this manuscript.
All claims expressed in this article are solely those of the authors and do not necessarily represent those of their affiliated organizations, or those of the publisher, the editors and the reviewers. Any product that may be evaluated in this article, or claim that may be made by its manufacturer, is not guaranteed or endorsed by the publisher.
The Supplementary Material for this article can be found online at: https://www.frontiersin.org/articles/10.3389/fmars.2025.1522723/full#supplementary-material
Albarakati A. M. A., Ahmad F. (2019). “Red Sea Coastal Lagoons: Their Dynamics and Future Challenges,” in Oceanographic and Biological Aspects of the Red Sea. Eds. Rasul N., Stewart I. (Springer Oceanography. Springer, Cham). doi: 10.1007/978-3-319-99417-8_7
Alsaffar Z., Cúrdia J., Irigoien X., Carvalho S. (2020a). Composition, uniqueness and connectivity across tropical coastal lagoon habitats in the Red Sea. BMC Ecol. 20, 1–17. doi: 10.1186/s12898-020-00329-z
Alsaffar Z., Pearman J. K., Curdia J., Ellis J., Calleja M. L., Ruiz-Compean P., et al. (2020b). The role of seagrass vegetation and local environmental conditions in shaping benthic bacterial and macroinvertebrate communities in a tropical coastal lagoon. Sci. Rep. 10, 13550. doi: 10.1038/s41598-020-70318-1
Anderson D. T. (1993). Barnacles: Structure, function, development, and evolution (Springer Science & Business Media). Available at: https://link.springer.com/book/9780412444203 (Accessed October 15, 2024).
Anderson M. J., Gorley R. N., Clarke K. R. (2008). PERMANOVA+ for PRIMER: Guide to software and statistical methods (Plymouth, UK: PRIMER-E), 214.
Ansari A. A., Ghanim S. A., Trivedi S., Rehman H., Abbas Z. K., Saggu S. (2015). Seasonal dynamics in the trophic status of water, floral and faunal density along some selected coastal areas of the Red Sea, Tabuk, Saudi Arabia. Int. Aquat. Res. 7, 337–348. doi: 10.1007/s40071-015-0118-6
Aylagas E., Shchepanik H., Pearman J. K., Parisi B., Curdia J., Berumen M. L., et al. (2024). Disentangling eukaryotic biodiversity patterns from man-made environments (port and marina) and nearby coral reefs in the Red Sea: A focus on the surveillance of non-indigenous species. Environ. DNA 6, e583. doi: 10.1002/edn3.583
Bailey S. A., Brown L., Campbell M. L., Canning-Clode J., Carlton J. T., Castro N., et al. (2020). Trends in the detection of aquatic non-indigenous species across global marine, estuarine and freshwater ecosystems: a 50-year perspective. Diversity Distributions 26, 1780–1797. doi: 10.1111/ddi.13167
Bakken T. (2007). Revision of pseudonereis (Polychaeta, nereididae). Zoological J. Linn. Soc. 150, 145–176. doi: 10.1111/j.1096-3642.2007.00289.x
Barnes M. A., Turner C. R., Jerde C. L., Renshaw M. A., Chadderton W. L., Lodge D. M. (2014). Environmental conditions influence eDNA persistence in aquatic systems. Environ. Sci. Technol. 48, 1819–1827. doi: 10.1021/es404734p
Berry T. E., Saunders B. J., Coghlan M. L., Stat M., Jarman S., Richardson A. J., et al. (2019). Marine environmental DNA biomonitoring reveals seasonal patterns in biodiversity and identifies ecosystem responses to anomalous climatic events. PloS Genet. 15, e1007943. doi: 10.1371/journal.pgen.1007943
Berumen M. L., Hoey A. S., Bass W. H., Bouwmeester J., Catania D., Cochran J. E. M., et al. (2013). The status of coral reef ecology research in the Red Sea. Coral Reefs 32, 737–748. doi: 10.1007/s00338-013-1055-8
Beshai R. A., Truong D. A., Henry A. K., Sorte C. J. (2023). Biotic resistance or invasional meltdown? Diversity reduces invasibility but not exotic dominance in southern California epibenthic communities. Biol. Invasions 25, 533–549. doi: 10.1007/s10530-022-02932-1
Borja A., Elliot M., Andersen J. H., Berg T., Carstensen J., Halpern B. S., et al. (2016). Overview of integrative assessment of marine systems: The ecosystem approach in practice. Front. Front. Mar. Sci. 3. doi: 10.3389/fmars.2016.00020
Borrell Y. J., Miralles L., Mártinez-Marqués A., Semeraro A., Arias A., Carleos C. E., et al. (2018). Metabarcoding and post-sampling strategies to discover non-indigenous species: A case study in the estuaries of the central south Bay of Biscay. J. Nat. Conserv. 42, 67–74. doi: 10.1016/j.jnc.2017.07.002
Bulleri F., Chapman M. G. (2010). The introduction of coastal infrastructure as a driver of change in marine environments. J. Applied Ecol. 47, 26–35. doi: 10.1111/j.1365-2664.2009.01751.x
Callahan B. J., McMurdie P. J., Rosen M. J., Han A. W., Johnson A. J. A., Holmes S. P. (2016). DADA2: High-resolution sample inference from Illumina amplicon data. Nat. Methods 13, 581–583. doi: 10.1038/nmeth.3869
Campbell M. L., Gould B., Hewitt C. L. (2007). Survey evaluations to assess marine bioinvasions. Mar. Poll. Bull. 55, 360–378. doi: 10.1016/j.marpolbul.2007.01.015
Campbell M. L., King S., Heppenstall L. D., van Gool E., Martin R., Hewitt C. L. (2017). Aquaculture and urban marine structures facilitate native and non-indigenous species transfer through generation and accumulation of marine debris. Mar. Poll. Bull. 123, 304–312. doi: 10.1016/j.marpolbul.2017.08.040
Carlton J. T., Cohen A. N. (2003). Episodic global dispersal in shallow water marine organisms: the case history of the European shore crabs, Carcinus maenas and C. aestuarii. J. Biogeogr. 30, 1809–1820. doi: 10.1111/j.1365-2699.2003.00962.x
Carlton J. T., Geller J. B. (1993). Ecological roulette: the global transport of nonindigenous marine organisms. Science 261, 78–82. doi: 10.1126/science.261.5117.78
Carlton J. T., Schwindt E. (2024). The assessment of marine bioinvasion diversity and history. Biol. Invasions 26, 237–298. doi: 10.1007/s10530-023-03172-7
Carvalho S., Shchepanik H., Aylagas E., Berumen M. L., Costa F. O., Costello M. J., et al. (2023). Hurdles and opportunities in implementing marine biosecurity systems in data-poor regions. BioScience 73, 494–512. doi: 10.1093/biosci/biad056
Castro N., Gestoso I., Marques C. S., Ramalhosa P., Monteiro J. G., Costa J. L., et al. (2022). Anthropogenic pressure leads to more introductions: Marine traffic and artificial structures in offshore islands increases non-indigenous species. Mar. pollut. Bull. 181, 113898. doi: 10.1016/j.marpolbul.2022.113898
Castro N., Ramalhosa P., Cacabelos E., Costa J. L., Canning-Clode J., Gestoso I. (2021). Winners and losers: prevalence of non-indigenous species under simulated marine heatwaves and high propagule pressure. Mar. Ecol. Prog. Ser. 668, 21–38. doi: 10.3354/meps13710
Cavalcanti F. F., Padua A., Cunha H., Halasz M., Nikolić V., Barreto S., et al. (2020). Population differentiation supports multiple human-mediated introductions of the transatlantic exotic sponge Paraleucilla magna (Porifera, Calcarea). Hydrobiologia 847, 3571–3590. doi: 10.1007/s10750-020-04368-x
Chalastani V. I., Manetos P., Al-Suwailem A. M., Hale J. A., Vijayan A. P., Pagano J., et al. (2020). Reconciling tourism development and conservation outcomes through marine spatial planning for a Saudi giga-project in the red Sea (The red Sea project, vision 2030). Front. Mar. Sci. 7. doi: 10.3389/fmars.2020.00168
Chebaane S., Freestone A. L., Des Pérez A., Sempere-Valverde J., Chainho P., Monteiro J. G., et al. (2023). Predation facilitates the abundance of biofouling non-indigenous species in estuarine marinas in NE Atlantic Portugal. Mar. pollut. Bull. 188, 114724. doi: 10.1016/j.marpolbul.2023.114724
Chebaane S., Sempere-Valverde J., Dorai S., Kacem A., Sghaier Y. R. (2019). A preliminary inventory of alien and cryptogenic species in Monastir Bay, Tunisia: spatial distribution, introduction trends and pathways. Mediterr. Mar. Sci. 20, 616–626. doi: 10.12681/mms.20229
Clarke S. A., Vilizzi L., Lee L., Wood L. E., Cowie W. J., Burt J. A., et al. (2020). Identifying potentially invasive non-native marine and brackish water species for the Arabian Gulf and Sea of Oman. Global Change Biol. 26, 2081–2092. doi: 10.1111/gcb.14964
Cocito S., Ferdeghini F., Morri C., Bianchi C. N. (2000). Patterns of bioconstruction in the cheilostome bryozoan Schizoporella errata: the influence of hydrodynamics and associated biota. Mar. Ecol. Prog. Ser. 192, 153–161. doi: 10.3354/meps192153
Conde-Vela V. M. (2018). New species of pseudonereis kinberg 1865 (Polychaeta: Nereididae) from the Atlantic Ocean, and a review of paragnath morphology and methodology. Zootaxa 4471, 245–278. doi: 10.11646/zootaxa.4471.2.2
Connell S. D. (2000). Floating pontoons create novel habitats for subtidal epibiota. J. Exp. Mar. Biol. Ecol. 247, 183–194. doi: 10.1016/S0022-0981(00)00147-7
Connell S. D. (2001). Urban structures as marine habitats: an experimental comparison of the composition and abundance of subtidal epibiota among pilings, pontoons and rocky reefs. Mar. Environ. Res. 52, 115–125. doi: 10.1016/S0141-1136(00)00266-X
Couton M. (2020). High-throughput sequencing techniques for the detection and survey of marine non-indigenous species: a valuable addition to traditional methods? Paris, France: Ecosystems, Sorbonne Université, France.
Couton M., Lévêque L., Daguin-Thiébaut C., Comtet T., Viard F. (2022). Water eDNA metabarcoding is effective in detecting non-native species in marinas, but detection errors still hinder its use for passive monitoring. Biofouling 38, 367–383. doi: 10.1080/08927014.2022.2075739
Dafforn K. A., Johnston E. L., Glasby T. M. (2009). Shallow moving structures promote marine invader dominance. Biofouling 25 3), 277–287. doi: 10.1080/08927010802710618
Darling J. A., Mahon A. R. (2011). From molecules to management: adopting DNA-based methods for monitoring biological invasions in aquatic environments. Environ. Res. 111, 978–988. doi: 10.1016/j.envres.2011.02.001
DiBattista J. D., Howard C. J., Gaither M. R., Hobbs J.-P. A., Lozano-Cortés D. F., Myers R. F., et al. (2016). On the origin of endemic species in the Red Sea. J. Biogeogr. 43, 13–30. doi: 10.1111/jbi.12631
Duarte S., Leite B. R., Feio M. J., Costa F. O., Filipe A. F. (2021a). Integration of DNA-based approaches in aquatic ecological assessment using benthic macroinvertebrates. Water 13, 331. doi: 10.3390/w13030331
Duarte S., Vieira P. E., Lavrador A. S., Costa F. O. (2021b). Status and prospects of marine NIS detection and monitoring through (e)DNA metabarcoding. Sci. Total Environ. 751, 141729. doi: 10.1016/j.scitotenv.2020.141729
El-Wahab A. M., Dar M. A., Mohammad T. A. (2005). Sediments, coral reefs and seawater interactions in some coastal lagoons, Red Sea, Egypt. Egyptian J. Aquat. Res. 31, 69–85.
Espinosa F. (Ed.) (2023). Coastal Habitat Conservation. New Perspectives and Sustainable Development of Biodiversity in the Anthropocene (London, United Kingdom: Elsevier Academic Press). doi: 10.1016/C2020-0-01178-3
Farias J., Vieira L. M., Almeida A. C. (2024). Revealing the diversity of parasmittina osburn 1952 (Bryozoa, Cheilostomatida) from the Southwest Atlantic: Species complexes, non-native and new species. PloS One 19, e0304347. doi: 10.1371/journal.pone.0304347
Fernandez S., Ardura A., Georges O., Martinez J. L., Suarez-Menendez M., Planes S., et al. (2022). Non-native species in the north Gulf of Aqaba (Red Sea) revealed from environmental DNA. Front. Mar. Sci. 9. doi: 10.3389/fmars.2022.940889
Ferrario J., Caronni S., Occhipinti-Ambrogi A., Marchini A. (2017). Role of commercial harbours and recreational marinas in the spread of non-indigenous fouling species. Biofouling 33, 651–660. doi: 10.1080/08927014.2017.1351958
Ficetola G. F., Pansu J., Bonin A., Coissac E., Giguet-Covex C., De Barba M., et al. (2015). Replication levels, false presences and the estimation of the presence/absence from eDNA metabarcoding data. Mol. Ecol. Resour. 15, 543–556. doi: 10.1111/1755-0998.12338
Firth L. B., Duff L., Gribben P. E., Knights A. M. (2021). Do positive interactions between marine invaders increase likelihood of invasion into natural and artificial habitats? Oikos 130, 453–463. doi: 10.1111/oik.07862
Firth L. B., Knights A. M., Bridger D., Evans A. J., Mieszkowska N., Moore P. J., et al. (2016). Ocean sprawl: challenges and opportunities for biodiversity management in a changing world. Oceanogr. Mar. Biol.: an Annu. Rev. 54, 189–262. doi: 10.1201/9781315368597
Fofonoff P. W., Ruiz G. M., Steves B., Simkanin C., Carlton J. T. (2018). National exotic marine and estuarine species information system. Available online at: https://invasions.si.edu/nemesis (Accessed October 06, 2024).
Fonseca V. G., Davison P. I., Creach V., Stone D., Bass D., Tidbury H. J. (2023). The application of eDNA for monitoring aquatic non-indigenous species: practical and policy considerations. Diversity 15, 631. doi: 10.3390/d15050631
Frederich M., Lancaster E. R. (2024). “The European green crab, Carcinus maenas: Where did they come from and why are they here?” in Ecophysiology of the European Green Crab (Carcinus Maenas) and Related Species. Eds. Weihrauch D., McGaw I. J. (London, UK: Elsevier Academic Press), 1–20. doi: 10.1016/B978-0-323-99694-5.00002-7
Gauff R. P. M., Bouchoucha M., Curd A., Droual G., Evrard J., Gayet N., et al. (2023). First joint morphological and molecular detection of Watersipora subatra in the Mediterranean Sea presented in an updated genus phylogeny to resolve taxonomic confusion. Aquat. Invasions 18, 295–312. doi: 10.3391/ai.2023.18.3.108128
GBIF Secretariat (2023). Dicyathifer mannii (E.P.Wright 1866) (GBIF Backbone Taxonomy) (Accessed October 06, 2024).
Ghandourah M. A., Orif M. I., Al-Farawati R. K., El-Shahawi M. S., Abu-Zeid R. H. (2023). Illegal pollution loading accelerate the oxygen deficiency along the coastal lagoons of eastern Red Sea. Regional Stud. Mar. Sci. 63, 102982. doi: 10.1016/j.rsma.2023.102982
Glasby T. M. (2001). Development of sessile marine assemblages on fixed versus movingsubstrata. Mar. Ecol. Prog. Ser. 215, 37–47. doi: 10.3354/meps215037
Gómez A. G., Ondiviela B., Fernández M., Juanes J. A. (2017). Atlas of susceptibility to pollution in marinas. Application to the Spanish coast. Mar. pollut. Bull. 114, 239–246. doi: 10.1016/j.marpolbul.2016.09.009
Gómez A. G., Valdor P. F., Ondiviela B., Díaz J. L., Juanes J. A. (2019). Mapping the environmental risk assessment of marinas on water quality: the Atlas of the Spanish coast. Mar. pollut. Bull. 139, 355–365. doi: 10.1016/j.marpolbul.2019.01.008
Goren M., Klausewitz W. (1978). Two Mediterranean gobiid fishes new in the Red Sea (pisces: Gobiidae). Senckenbergiana Biologica 59, 19–24.
Graells G., Nakamura N., Celis-Diez J. L., Lagos N. A., Marquet P. A., Pliscoff P., et al. (2021). A review on coastal urban ecology: research gaps, challenges, and needs. Front. Mar. Sci. 26. doi: 10.3389/fmars.2021.617897
Greene J. K., Grizzle R. E. (2007). Successional development of fouling communities on open ocean aquaculture fish cages in the western Gulf of Maine, USA. Aquaculture 262, 289–301. doi: 10.1016/j.aquaculture.2006.11.003
Guerra-García J. M., García-Gómez J. C. (2005). Assessing pollution levels in sediments of a harbour with two opposing entrances. Environmental implications. J. Environ. Manage. 77, 1–11. doi: 10.1016/j.jenvman.2005.01.023
Guerra-García J. M., Revanales T., Saenz-Arias P., Navarro-Barranco C., Ruiz-Velasco S., Pastor-Montero M., et al. (2023). Quick spreading of the exotic amphipod Laticorophium baconi (Shoemaker 1934): another small stowaway overlooked? Mediterr. Mar. Sci. 24, 644–665. doi: 10.12681/mms.35817
Holland B. S. (2000). Genetics of marine bioinvasions. Hydrobiologia 420, 63–71. doi: 10.1023/A:1003929519809
Holloway P., Connell S. D. (2002). Why do floating structures create novel habitats for subtidalepibiota? Mar. Ecol. Prog. Ser. 235, 43–52. doi: 10.3354/meps235043
Iannotta M. A., Patti F. P., Ambrosino M., Procaccini G., Gambi M. C. (2007). Phylogeography of two species of Lysidice (Polychaeta, Eunicidae) associated to the seagrass Posidonia oceanica in the Mediterranean Sea. Mar. Biol. 150, 1115–1126. doi: 10.1007/s00227-006-0405-2
Janiak D., Tennenbaum Marine Observatories Network, MarineGEO (2021). MarineGEO Fouling Community Monitoring Protocol (Edgewater, Maryland, USA: Smithsonian Environmental Research Center). doi: 10.25573/serc.14510649.v1
Katoh K., Standley D. M. (2013). MAFFT multiple sequence alignment software version 7: improvements in performance and usability. Mol. Biol. Evol. 30, 772–780. doi: 10.1093/molbev/mst010
Khosravi M., Nasrolahi A., Shokri M. R., Dobretsov S., Pansch C. (2019). Impact of warming on biofouling communities in the northern Persian Gulf. J. Thermal Biol. 85, 102403. doi: 10.1016/j.jtherbio.2019.102403
Kinberg J. G. H. (1865). Annulata nova. [Continuatio. Öfversigt af Königlich Vetenskapsakademiens förhandlingar Stockholm 22, 167–179. Available at: https://biodiversitylibrary.org/page/32339443. (Accessed October 20, 2024).
Klunzinger C. B. (1913). Die Rundkrabben (Cyclometopa) des Roten Meeres. Abhandlungen der Kaiserlichen Leopoldisch-Carolinischen Deutschen Akademie der Naturforscher. Available online at: https://archive.org/details/dierundkrabbency00klun.
Komyakova V., Jaffrés J. B. D., Strain E. M. A., Cullen-Knox C., Fudge M., Langhamer O., et al. (2022). Conceptualisation of multiple impacts interacting in the marine environment using marine infrastructure as an example. Sci. Total Environ. 830, 154748. doi: 10.1016/j.scitotenv.2022.154748
Korpinen S., Andersen J. H. (2016). A global review of cumulative pressure and impact assessments in marine environments. Front. Mar. Sci. 30. doi: 10.3389/fmars.2016.00153
Kumar S., Stecher G., Tamura K. (2016). MEGA7: molecular evolutionary genetics analysis version 7.0 for bigger datasets. Mol. Biol. Evol. 33, 1870–1874. doi: 10.1093/molbev/msw054
Lee J., Kwon S., Ubagan M. D., Lee T., Shin S. (2023). Genetic Diversity and Population Dynamics of Invasive Ascidiella aspersa: Insights from Cytochrome Oxidase Subunit I and 18S rDNA Analyses in Korean and Global Populations. Water 15, 3886. doi: 10.3390/w15223886
Leray M., Yang J. Y., Meyer C. P., Mills S. C., Agudelo N., Ranwez V., et al. (2013). A new versatile primer set targeting a short fragment of the mitochondrial COI region for metabarcoding metazoan diversity: Application for characterizing coral reef fish gut contents. Front. Zool. 10, 1–14. doi: 10.1186/1742-9994-10-34
Malaquias M. A. E., Zamora-Silva A., Vitale D., Spinelli A., Matteo S. D., Giacobbe S., et al. (2016). The Mediterranean Sea as a gateway for invasion of the Red Sea: the case of the Indo-West Pacific head-shield slug Chelidonura fulvipunctata Bab. Aquat. Invasions 11, 247–255. doi: 10.3391/ai.2016.11.3.03
Mandrak N. E., Cudmore B. (2015). Risk assessment: Cornerstone of an aquatic invasive species program. Aquat. Ecosystem Health Manage. 18, 312–320. doi: 10.1080/14634988.2015.1046357
Marchini A., Cardeccia A. (2017). Alien amphipods in a sea of troubles: cryptogenic species, unresolved taxonomy and overlooked introductions. Mar. Biol. 164, 69. doi: 10.1007/s00227-017-3093-1
Marraffini M. L., Ashton G. V., Brown C. W., Chang A. L., Ruiz G. M. (2017). Settlement plates as monitoring devices for non-indigenous species in marine fouling communities. Manage. Biol. Invasions 8, 559–566. doi: 10.3391/mbi.2017.8.4.11
Micael J., Marina J. G., Costa A. C., Occhipinti-Ambrogi A. (2014). The non-indigenous Schizoporella errata (Bryozoa: Cheilostomatida) introduced into the Azores Archipelago. Mar. Biodiversity Records 7, e133. doi: 10.1017/S1755267214001298
Miglietta M. P., Odegard D., Faure B., Faucci A. (2015). Barcoding techniques help tracking the evolutionary history of the introduced species Pennaria disticha (Hydrozoa, Cnidaria). PloS One 10, e0144762. doi: 10.1371/journal.pone.0144762
Molnar J. L., Gamboa R. L., Revenga C., Spalding M. D. (2008). Assessing the global threat of invasive species to marine biodiversity. Front. Ecol. Environ. 6, 485–492. doi: 10.1890/070064
Morgado E. H., Tanaka M. O. (2001). The macrofauna associated with the bryozoan Schizoporella unicornis in southeastern Brazil. Scientia Marina 65, 173–181. doi: 10.3989/scimar.2001.65n3173
NEOM (2024). © 2024 NEOM website. Available online at: https://www.neom.com/en-us (Accessed October 06, 2024).
Normant-Saremba M., Hegele-Drywa J., Marszewska L. (2020). Sampling native and non-native mobile epifauna with baited traps and habitat collectors–Port of Gdynia case study (southern Baltic Sea, Poland). Oceanological Hydrobiological Stud. 49, 319–327. doi: 10.1515/ohs-2020-0028
Nygren A. (2014). Cryptic polychaete diversity: a review. Zoologica Scripta 43, 172–183. doi: 10.1111/zsc.12044
Ojaveer H., Galil B. S., Carlton J. T., Alleway H., Goulletquer P., Lehtiniemi M., et al. (2018). Historical baselines in marine bioinvasions: Implications for policy and management. PloS One 13, e0202383. doi: 10.1371/journal.pone.0202383
Ojaveer H., Galil B. S., Gollasch S., Marchini A., Minchin D., Occhipinti-Ambrogi A., et al. (2014). Identifying the top issues of marine invasive alien species in Europe. Manage. Biol. Invasions 5, 81–84. doi: 10.3391/mbi.2014.5.2.01
Pérez-Ruzafa A., Concepción M., Pérez-Ruzafa I. M., Pérez-Marcos M. (2011a). Coastal lagoons: “transitional ecosystems” between transitional and coastal waters. J. Coast. Conserv. 15, 369–392. doi: 10.1007/s11852-010-0095-2
Pérez-Ruzafa A., Marcos C., Pérez-Ruzafa I. M. (2011b). Recent advances in coastal lagoons ecology: evolving old ideas and assumptions. Trans. Waters Bull. 5, 50–74. doi: 10.1285/i1825229Xv5n1p50
Poloczanska E. S., Butler A. J. (2009) “Biofouling and Climate Change” in Biofouling. Eds. Dürr S., Thomason J. C.. (Hoboken, New Jersey, US: Blackwell Publishing Ltd). doi: 10.1002/9781444315462.ch23
Puillandre N., Bouchet P., Boisselier-Dubayle M.-C., Buge J. B. B., Castelin M., Chagnoux S., et al. (2012). New taxonomy and old collections: integrating DNA barcoding into the collection curation process. Mol. Ecol. Res. 12, 396–402. doi: 10.1111/j.1755-0998.2011.03105.x
Puillandre N., Brouillet S., Achaz G. (2021). ASAP: assemble species by automatic partitioning. Mol. Ecol. Resour. 21, 609–620. doi: 10.1111/1755-0998.13281
Rao T. S. (2010). Comparative effect of temperature on biofilm formation in natural and modified marine environment. Aquat. Ecol. 44, 463–478. doi: 10.1007/s10452-009-9304-1
Read G., Fauchald K. (Eds.) (2024). World Polychaeta Database. Pseudonereis gallapagensis Kinberg 1865 (Oostende, Belgium: World Register of Marine Species).
Rey A., Basurko O. C., Rodriguez-Ezpeleta N. (2020). Considerations for metabarcoding-based port biological baseline surveys aimed at marine nonindigenous species monitoring and risk assessments. Ecol. Evol. 10, 2452–2465. doi: 10.1002/ece3.6071
Robitzch V., Kattan A., Dunne A., Coker D. J. (2023). “Saudi Arabia Case Study,” in Challenges in Tropical Coastal Zone Management. Eds. Wolff M., Ferse S. C., Govan H. (Springer, Cham). doi: 10.1007/978-3-031-17879-5_6
Rodríguez-Gallego L., Achkar M., Defeo O., Vidal L., Meerhoff E., Conde D. (2017). Effects of land use changes on eutrophication indicators in five coastal lagoons of the Southwestern Atlantic Ocean. Estuarine Coast. Shelf Sci. 188, 116–126. doi: 10.1016/j.ecss.2017.02.010
Ros M., Ashton G. V., Cabezas M. P., Canning-Clode J., Carlton J. T., Ferrario J., et al. (2023). “Marine bioinvasions in the Anthropocene: Challenges and opportunities,” in Coastal Habitat Conservation. New Perspectives and Sustainable Development of Biodiversity in the Anthropocene. Ed. Espinosa F. (London, United Kingdom: Elsevier Academic Press), 81–110. doi: 10.1016/B978-0-323-85613-3.00006-2
Ros M., Navarro-Barranco C., González-Sánchez M., Ostalé-Valriberas E., Cervera-Currado L., Guerra-García J. M. (2020). Starting the stowaway pathway: the role of dispersal behavior in the invasion success of low-mobile marine species. Biol. Invasions 22, 2797–2812. doi: 10.1007/s10530-020-02285-7
Ruiz G. M., Hewitt C. L. (2002). “Toward Understanding Patterns of Coastal Marine Invasions: A Prospectus,” in Invasive Aquatic Species of Europe. Distribution, Impacts and Management. Eds. Leppäkoski E., Gollasch S., Olenin S. (Springer, Dordrecht). doi: 10.1007/978-94-015-9956-6_53
Savigny J.-C. (1817). Description de l’Egypte, ou recueil des observations et des recherches qui ont été faites en Egypte pendant l’expédition de l’Armée française, publié par les ordres de sa Majesté´ l’Empereur Napoléon le Grand (Paris, France: Histoire Naturelle, Crustacés. Paris, Imprimerie Impériale).
Sellheim K., Stachowicz J. J., Coates R. C. (2010). Effects of a nonnative habitat-forming species on mobile and sessile epifaunal communities. Mar. Ecol. Prog. Ser. 398, 69–80. doi: 10.3354/meps08341
Sempere-Valverde J., Castro-Cadenas M. D., Guerra-García J. M., Espinosa F., García-Gómez J. C., Ros M. (2024). Buoys are non-indigenous fouling hotspots in marinas regardless of their environmental status and pressure. Sci. Total Environ. 909, 168301. doi: 10.1016/j.scitotenv.2023.168301
Sempere-Valverde J., Guerra-García J. M., García-Gómez J. C., Espinosa F. (2023). “Coastal urbanization, an issue for coastal conservation,” in Coastal Habitat Conservation. New Perspectives and Sustainable Development of Biodiversity in the Anthropocene. Ed. Espinosa F. (London, United Kingdom: Elsevier Academic Press), 81–110. doi: 10.1016/B978-0-323-85613-3.00007-4
Sokołowski A., Ziółkowska M., Balazy P., Kukliński P., Plichta I. (2017). Seasonal and multi-annual patterns of colonisation and growth of sessile benthic fauna on artificial substrates in the brackish low-diversity system of the Baltic Sea. Hydrobiologia 790, 183–200. doi: 10.1007/s10750-016-3043-9
Sternhell G., Taylor P. D., Itzhak D. (2002). Bryozoans recruited onto aluminum-based galvanic couples in the Red Sea off Elat, Israel. Israel J. Zool. 48, 221–233. doi: 10.1560/VGG9-MB8Q-ET84-EJ2H
Sun Y. (2017). Taxonomy, barcoding and phylogeny of Hydroides (Serpulidae, Annelida), the largest genus of notorious fouling and invading calcareous tubeworms. Sydney, Australia: Macquarie University. doi: 10.25949/19426913.v1
Svensson J. R., Marshall D. J. (2015). Limiting resources in sessile systems: food enhances diversity and growth of suspension feeders despite available space. Ecology 96, 819–827. doi: 10.1890/14-0665.1
Tâmega F. T. D. S., Figueiredo M. A. (2007). Distribuition of crustose coralline algae (Corallinales, Rhodophyta) in the Abrolhos reefs, Bahia, Brazil. Rodriguésia 58, 941–947. doi: 10.1590/2175-7860200758413
Teixeira M. A. L., Langeneck J., Vieira P. E., Hernández J. C., Sampieri B. R., Kasapidis P., et al. (2022). Reappraisal of the hyperdiverse Platynereis dumerilii (Annelida: Nereididae) species complex in the Northern Atlantic, with the description of two new species. Invertebrate Systematics 36, 1017–1061. doi: 10.1071/IS21084
Teixeira M. A. L., Vieira P. E., Fenwick D., Langeneck J., Pleijel F., Sampieri B. R., et al. (2023). Revealing the diversity of the green Eulalia (Annelida, Phyllodocidae) species complex along the European coast, with description of three new species. Organisms Diversity Evol. 23, 477–503. doi: 10.1007/s13127-022-00597-1
Tempesti J., Langeneck J., Lardicci C., Maltagliati F., Castelli A. (2022a). Short-term colonization of fouling communities within the port of Livorno (Northern Tyrrhenian Sea, Western Mediterranean): Influence of substrate three-dimensional complexity on non-indigenous species establishment. Mar. Poll. Bull. 185, 114302. doi: 10.1016/j.marpolbul.2022.114302
Tempesti J., Langeneck J., Romani L., Garrido M., Lardicci C., Maltagliati F., et al. (2022b). Characterization of fouling structure components and their relationships with associated macrofauna in three Northern Tyrrhenian port systems (Mediterranean Sea). Estuarine Coast. Shelf Sci. 279, 108156. doi: 10.1016/j.ecss.2022.108156
Thomsen P. F., Kielgast J., Iversen L. L., Møller P. R., Rasmussen M., Willerslev E. (2012). Detection of a diverse marine fish fauna using environmental DNA from seawater samples. PloS One 7, e41732. doi: 10.1371/journal.pone.0041732
Tilbrook K. J., Hayward P. J., Gordon D. P. (2001). Cheilostomatous bryozoa from Vanuatu. Zoological J. Linn. Soc. 131, 35–109. doi: 10.1111/j.1096-3642.2001.tb01309.x
Todd P. A., Heery E. C., Loke L. H. L., Thurstan R. H., Kotze D. J., Swan C. (2019). Towards an urban marine ecology: characterizing the drivers, patterns and processes of marine ecosystems in coastal cities. Oikos 128, 1215–1242. doi: 10.1111/oik.05946
Trygonis V., Sini M. (2012). photoQuad: a dedicated seabed image processing software, and a comparative error analysis of four photoquadrat methods. J. Exp. Mar. Biol. Ecol. 424, 99–108. doi: 10.1016/j.jembe.2012.04.018
van den Heuvel-Greve M. J., van den Brink A. M., Glorius S. T., de Groot G. A., Laros I., Renaud P. E., et al. (2021). Early detection of marine non-indigenous species on Svalbard by DNA metabarcoding of sediment. Polar Biol. 44, 653–665. doi: 10.1007/s00300-021-02822-7
van der Loos L. M., Nijland R. (2021). Biases in bulk: DNA metabarcoding of marine communities and the methodology involved. Mol. Ecol. 30, 3270–3288. doi: 10.1111/mec.15592
Whalan S., Webster N. (2014). Sponge larval settlement cues: the role of microbial biofilms in a warming ocean. Sci. Rep. 4, 4072. doi: 10.1038/srep04072
Wheeler Q. D., Raven P. H., Wilson E. O. (2004). Taxonomy: impediment or expedient? Science 303, 285. doi: 10.1126/science.303.5656.285
Winston J. E., Jackson J. B. (2021). Coral reef-associated bryozoans of Jamaica. Zootaxa 4988, 1–218. doi: 10.11646/zootaxa.4988.1.1
Xiong W., Li H., Zhan A. (2016). Early detection of invasive species in marine ecosystems using high-throughput sequencing: technical challenges and possible solutions. Mar. Biol. 163, 139. doi: 10.1007/s00227-016-2911-1
Zaiko A., Cardeccia A., Carlton J. T., Clark G. F., Creed J. C., Davidson I., et al. (2024). Structural and functional effects of global invasion pressure on benthic marine communities—patterns, challenges and priorities. Diversity Distributions 30, e13838. doi: 10.1111/ddi.13838
Zaiko A., Pochon X., Garcia-Vazquez E., Olenin S., Wood S. A. (2018). Advantages and limitations of environmental DNA/RNA tools for marine biosecurity: management and surveillance of non-indigenous species. Front. Mar. Sci. 5, 322. doi: 10.3389/fmars.2018.00322
Zhan A., Hulák M., Sylvester F., Huang X., Adebayo A. A., Abbott C. L., et al. (2013). High sensitivity of 454 pyrosequencing for detection of rare species in aquatic communities. Methods Ecol. Evol. 4, 558–565. doi: 10.1111/2041-210X.12037
Keywords: marine bioinvasions, coastal sprawl, biofouling, settlement panels, barcoding, metabarcoding, eDNA, biodiversity management
Citation: Sempere-Valverde J, Aylagas E, Syomin V, Teixeira MAL, Kolbasova GD, Ruiz-Velasco S, Chebaane S, Anker A, Curdia J, Cadiz R, Cottrell DM, Desiderato A, Andrade LF, Antony CP, Bocanegra-Castano C, Marzucchi M, Poliseno A, Baker D, Alabdulaziz B, Torres F, Eweida AA and Carvalho S (2025) First assessment of biofouling assemblages in the northern Red Sea, an important region for marine non-indigenous species transfer. Front. Mar. Sci. 12:1522723. doi: 10.3389/fmars.2025.1522723
Received: 04 November 2024; Accepted: 03 January 2025;
Published: 03 February 2025.
Edited by:
Clara Belen Giachetti, CONICET Instituto de Biología de Organismos Marinos (IBIOMAR), ArgentinaReviewed by:
Mariana Bonfim, Temple University, United StatesCopyright © 2025 Sempere-Valverde, Aylagas, Syomin, Teixeira, Kolbasova, Ruiz-Velasco, Chebaane, Anker, Curdia, Cadiz, Cottrell, Desiderato, Andrade, Antony, Bocanegra-Castano, Marzucchi, Poliseno, Baker, Alabdulaziz, Torres, Eweida and Carvalho. This is an open-access article distributed under the terms of the Creative Commons Attribution License (CC BY). The use, distribution or reproduction in other forums is permitted, provided the original author(s) and the copyright owner(s) are credited and that the original publication in this journal is cited, in accordance with accepted academic practice. No use, distribution or reproduction is permitted which does not comply with these terms.
*Correspondence: Juan Sempere-Valverde, anVhbi5zZW1wZXJldmFsdmVyZGVAa2F1c3QuZWR1LnNh; Susana Carvalho, c3VzYW5hLmNhcnZhbGhvQGthdXN0LmVkdS5zYQ==
Disclaimer: All claims expressed in this article are solely those of the authors and do not necessarily represent those of their affiliated organizations, or those of the publisher, the editors and the reviewers. Any product that may be evaluated in this article or claim that may be made by its manufacturer is not guaranteed or endorsed by the publisher.
Research integrity at Frontiers
Learn more about the work of our research integrity team to safeguard the quality of each article we publish.