
94% of researchers rate our articles as excellent or good
Learn more about the work of our research integrity team to safeguard the quality of each article we publish.
Find out more
ORIGINAL RESEARCH article
Front. Mar. Sci., 24 February 2025
Sec. Coral Reef Research
Volume 12 - 2025 | https://doi.org/10.3389/fmars.2025.1513498
 Meng-Hsin Morris Wu1†
 Lauriane Ribas-Deulofeu1,2†
 Chia-Hung Eric Liu1†
 Yoko Nozawa3,4†
 Vianney Denis1,2*†
This study examines changes in structural complexity of coral reefs in a tropical-subtropical transition zone and identifies the benthic factors influencing their patterns. Structure-from-motion photogrammetry was used to create digital elevation models (DEMs) and generate orthomosaic images for 25 study sites distributed across five coral reef regions along the east coast of Taiwan. A selection of 11 complexity metrics was used to capture the overall variations while benthic composition was described. It was found that fine-scale complexity decreases with increasing latitude as the dominance of intricate coral morphologies is replaced by plain zoanthids and crustose coralline algae. Coarse-scale complexity, on the other hand, increases in subtropical reefs with large boulders and unstable substrates, reflecting unique topographic features in regions of lower coral cover and accretion. Latitudinal variation in complexity is mostly driven by the turnover in benthic composition. These changes alter the available habitats and could ultimately affect the overall biodiversity and functionality of reef systems. Understanding transitional patterns is particularly important as ocean warming may lead to a reorganization of existing benthic communities in tropical-subtropical transition zones.
Coral reefs are biogenic three-dimensional structures that provide habitats for many species to thrive and evolve (Graham, 2014; Graham and Nash, 2012; Sanna et al., 2023). The structural complexity (hereafter complexity) of these habitats mediates important ecological functions and services through its influence on ecological processes such as herbivory, predation, and nutrient cycling (Helder et al., 2022; Shantz et al., 2015; Syms and Jones, 2000; Verges et al., 2011). Furthermore, through its impact on diversity, complexity is increasingly seen as a key indicator of reef resilience (Dang et al., 2020), with application to reef restoration efforts (Yanovski and Abelson, 2019).
As the primary architects of reefs, stony corals play an important role in the variation of complexity. Thus, coral richness, cover, and morphology have been found to be significantly related to the complexity and extent of biotic interactions within a reef. For instance, marine protected areas that promote coral cover and richness have more complex reefs compared to non-protected areas (Montero-Serra et al., 2019). In contrast, global and local disturbances are responsible for reef flattening through impact on corals, which can be observed at all spatial scales from local to regional (Alvarez-Filip et al., 2009; Bauman et al., 2022). Chronic stressors such as marine activities (swimming, snorkeling, and scuba diving) have been shown to have negative effects on reef complexity (Chen and Dai, 2021). Similarly, coral bleaching can have pervasive effects on complexity due to gradual erosion of calcium carbonate skeletons after coral death (Roff et al., 2020). On the opposite end, other catastrophic events such as typhoons often result in sudden and dramatic loss of complexity after corals have been extirpated from benthic communities (Pascoe et al., 2021; Yuval et al., 2023). Because of their disproportionally high contribution to the complexity and vulnerability to climate-related stressors in tropical areas, stony corals have eclipsed the numerous abiotic and biotic drivers responsible for the spatiotemporal variations in reef complexity.
Environmental factors play pivotal roles in shaping benthic composition and contributing to observed benthic heterogeneity along both disturbance and natural gradients (Lin et al., 2024; Reverter et al., 2022; Roberts et al., 2015). In turn, communities can vary in complexity depending on the organisms that compose them (Richardson et al., 2017; Rovellini et al., 2024; Tebbett et al., 2020). For example, in tropical areas regularly exposed to typhoons, resilient reefs may exhibit low complexity characterized by a dominance of coral with flattened morphologies (Ribas-Deulofeu et al., 2021). Similarly, in habitats considered marginal to shallow tropical reefs, such as mesophotic coral ecosystems, it is common to observe taxa other than scleractinians that contribute heavily to the overall complexity (Kahng et al., 2017). The same is true for non-reef environments such as coralligenous habitats where octocorals can be at the origin of a complex vertical stratification (Palma et al., 2018). Other canopy-forming organisms of Marine Animal Forests are further well-known as structurally analogous to scleractinian corals but thrive in other environmental conditions (Rossi et al., 2017).
Quantifying the overall complexity of a habitat is elusive due to the multifaceted nature of complexity, which manifests at different spatial scales (Yanovski et al., 2017) and spans a gradient from micro- to macro- scale complexities (Ribas-Deulofeu et al., 2021). Similarly, complexity is scale-dependent, making it challenging to summarize with a single metric (Ribas-Deulofeu et al., 2021). In benthic habitats, biotic and abiotic features all contribute to the different facets of complexity that distinctively influence biodiversity and ecosystem productivity interactions (González-Rivero et al., 2017). Typically, sessile benthos tend to increase the availability of microhabitats (Sarà, 1986), and associate with an abundance of some small and specialized fish species (e.g. Munday et al., 1997). Geologic features primarily shape large-scale topographic features (Helder et al., 2022; McCarthy et al., 2022), which can lead to higher biomass in large, high-trophic level fish species (Aburto-Oropeza et al., 2015). High complexity can capture both aspects and enhance fish biomass and abundance while structuring food webs and boosting productivity (Rogers et al., 2014). On coral reefs, the chain method has been traditionally used to measure ‘linear rugosity’ (Risk, 1972), typically capturing complexity at small to medium scales according to the size of the link. Additionally, the scale of complexity determined from depth gauge profiles (Dustan et al., 2013) can be adjusted using polynomial functions on rugosity indices (Ribas-Deulofeu et al., 2021). On the other end, visually scoring complexity of the seascape remains common (Graham et al., 2015; Polunin and Roberts, 1993; Wilson et al., 2007), while relying on suggestive perceptions of micro- and macro-rugosity in the observer (Ribas-Deulofeu et al., 2021). Besides linear rugosity, numerous metrics can be applied to estimate the complexity of larger reef areas (Fukunaga and Burns, 2020; Mills et al., 2023). Digital elevation models (DEMs) generated from three-dimensional (3D) benthic reconstructions using Structure-from-Motion (SfM; Westoby et al., 2012) now allow the simultaneous extraction of multiple metrics over large reef areas. This ensures that complexity assessment does not rely solely on single and small-scale indices. This approach has now imposed itself upon the characterization of the multiple facets (Urbina-Barreto et al., 2022) and benthic drivers (McCarthy et al., 2022) of complexity. Most studies in coral reefs have focused on changes in complexity metrics after catastrophic events such as coral bleaching and other disturbances (Burns et al., 2016; Ferrari et al., 2016), or along gradients of disturbances (Abdurrachman et al., 2024; Chen and Dai, 2021; Lyons et al., 2015) negatively affecting overall coral cover (Alvarez-Filip et al., 2009; Graham, 2014) or particular coral morphologies (Magel et al., 2019). Less well known, however, is the natural variation in complexity and its relationship with benthic composition along environmental gradients, as observed in the transition zones between tropical and temperate latitudes. Indeed, many physical and biological factors such as temperature, light, aragonite saturation, nutrient availability, larval dispersal, and competition, can affect the composition of the benthic assemblages across latitudes (Abrego et al., 2021; Lin and Denis, 2019; Smale et al., 2010) which could ultimately affect reef complexity.
To address these knowledge gaps, we investigated the interaction between benthic composition and complexity along a latitudinal gradient where benthic communities shift from a dominance of scleractinian corals (tropical) to a dominance of crustose coralline algae (subtropical). Here, we first identified key metrics to capture changes in complexity along latitudes and between study regions. We then typified the differences in complexity between tropical and subtropical zones, emphasizing the contribution of taxa other than scleractinians to the complexity in transition and non-coral reef areas. The results have improved the understanding of the interplay between benthic composition and complexity. Furthermore, the knowledge gained from this study will be fundamental to better predict the ecological consequences of reef habitat decline in tropical areas and their expansion in subtropical areas.
The main island of Taiwan (21.9°N – 25.3°N) straddles the biogeographical transition between tropical and subtropical latitudes. While the general environmental context around Taiwan is characterized by a decrease in mean sea surface temperature and photosynthetically active radiation with increasing latitude (Denis et al., 2019), the regional oceanography is complex. This complexity arises in part from the interplay of seasonal currents, monsoons, frequent summer typhoons, and anthropogenic factors that significantly influence benthic communities and their associated fish assemblages (Jan, 2018; Lin et al., 2022, 2024). From south to north, tropical reefs characterized by high richness in scleractinians and octocorals transition to non-reefal assemblages with fleshy and coralline algae being more abundant. Contrasting benthic compositions make Taiwan’s regions visually distinctive in terms of structural complexity (Figure 1). A total of 25 sites (between 21.9 and 25.1°N) were selected in five coral regions along the east coast of Taiwan (from south to north): Kenting (KT), Lanyu (LY), Ludao (LD), East Coast (EC), and North Coast (NC) (Figure 2). KT is the southernmost part of the main island of Taiwan. This region is characterized by a relatively narrow and exposed tropical reef that lines the coast. LD and LY are two oceanic and volcanic islands with high coral cover and well-developed reef structures. EC, on the other hand, covers the largest latitudinal extent and includes a mix of tropical and subtropical coral communities as typifying the transition zone. The northernmost region, NC, hosts subtropical communities with monthly average seawater temperatures dropping as low as 18.7°C and frequent cold waves in winter (Ribas-Deulofeu et al., 2016). KT, LY, and LD are accretive whereas it is locally the case along EC. NC is characterized by non-reefal coral assemblages. The sites were selected based on previously published information on their benthic composition (Lin and Denis, 2019; Hsiao et al., 2021; Lin et al., 2022; 2024; Ribas-Deulofeu et al., 2016) and to ensure that the regional heterogeneity was captured.
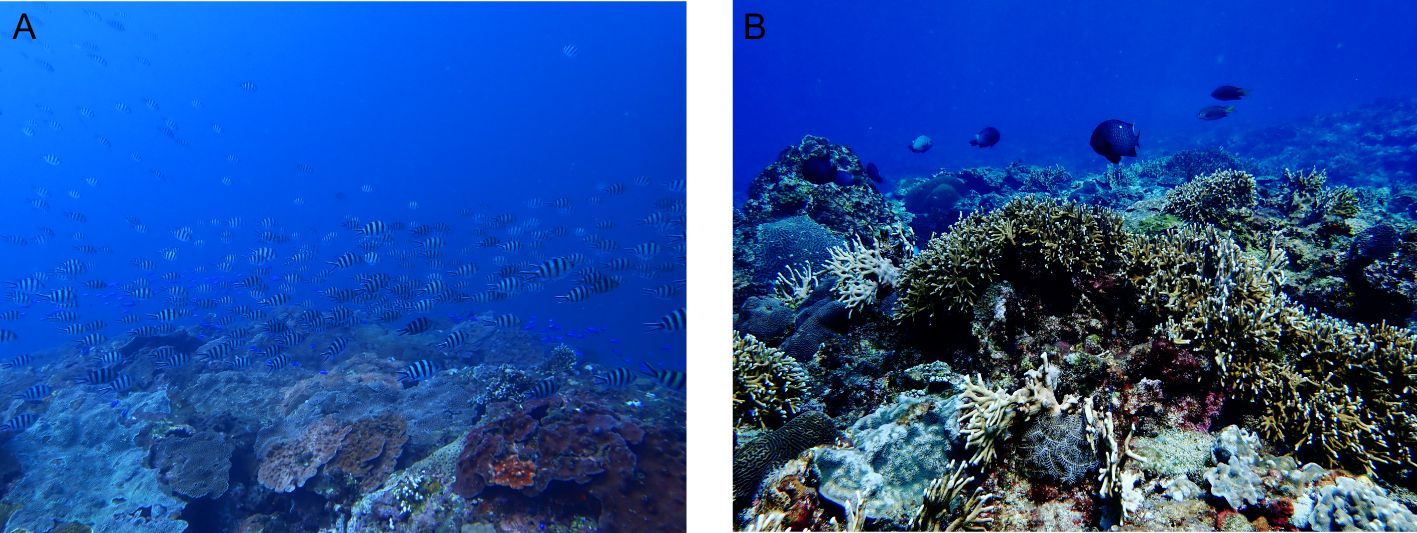
Figure 1. Seascapes illustrating differences in benthic composition and complexity in Taiwan. (A) Northern areas are characterized by subtropical communities scoring low in visual complexity. (B) Southern areas are characterized by tropical communities scoring high in visual complexity. Photo credits: Yuting V. Lin.
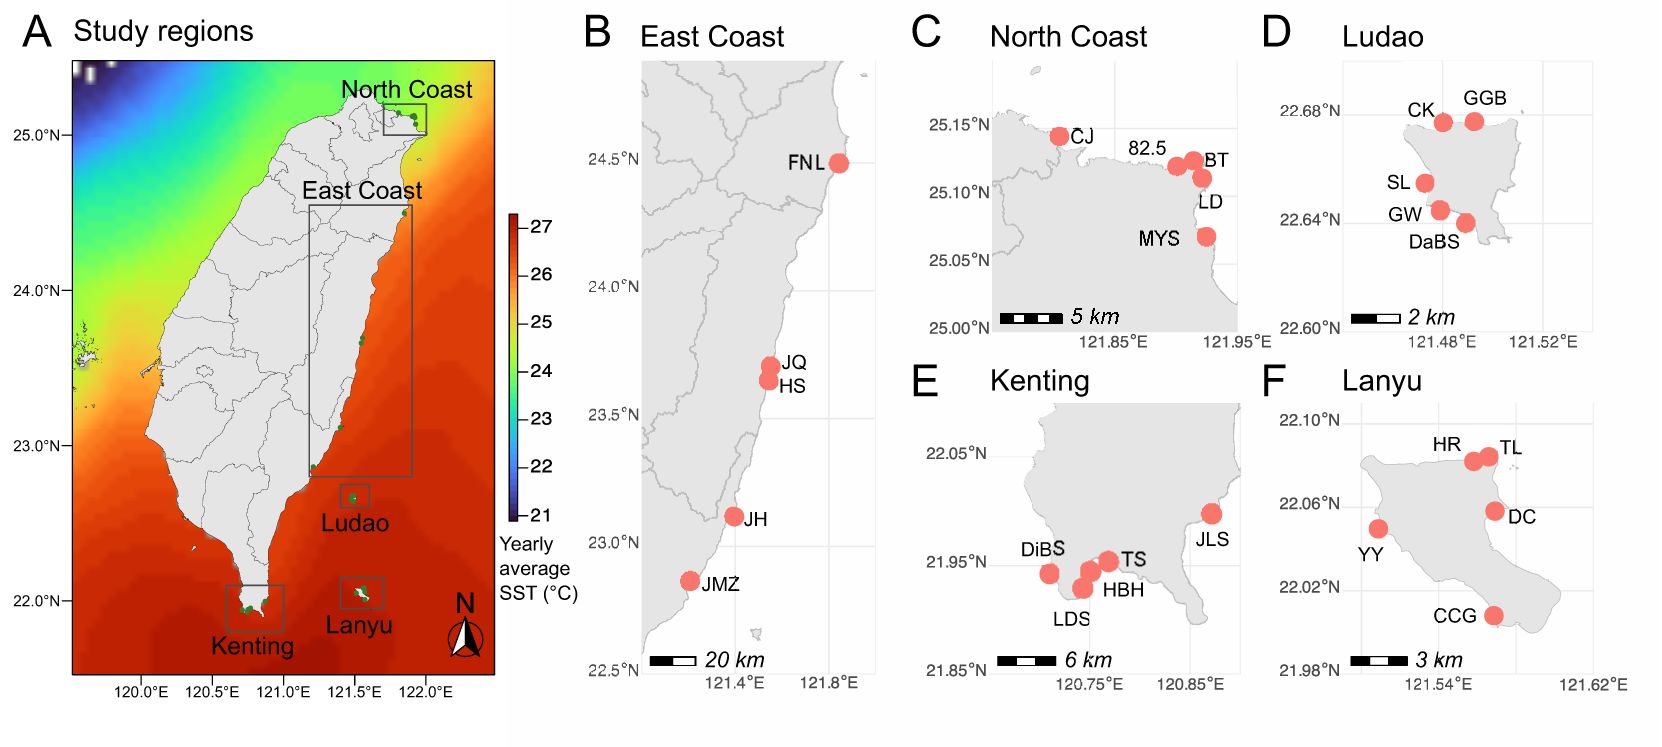
Figure 2. Study regions and sites. (A) Locations of the five regions selected along the east coast of Taiwan and sampling sites for (B) East Coast, (C) North Coast, (D) Ludao, (E) Lanyu, and (F) Kenting. Background sea surface temperatures in (A) are yearly average for the 1985 to 2019 period, derived from NOAA Global Coral Bleaching Monitoring (monthly composite, 5 km resolution), and obtained from NOAA ERDDAP (https://coastwatch.pfeg.noaa.gov/erddap/index.html).
At each site, we surveyed a 5 × 5 m quadrat randomly positioned on low gradient slopes (< 30°) at a depth of 5 to 7 m. The quadrat was delineated using ropes and PVC connectors to ensure rapid deployment and uniform shape during dive. The quadrat was georeferenced. A 3D object of known size (3D scale) and RGB colored tiles were positioned in the quadrat to serve as ground control points (GCP) for later 3D reconstructions. Following Young et al. (2017), an action camera (GoPro Hero9) was used to capture quadrat video using recommended settings, but increasing the capture rate to 60 frames per second to maximize image overlap. Video was captured by a diver progressing at a constant speed following a double lawnmower’s path approximately 1 m above substrate. The path was extended ~1 m beyond the boundaries of the quadrat to ensure sufficient coverage at quadrat edges.
All surveys were conducted between April and September 2022. During this period and within the depths surveyed, no signs of coral bleaching or recent typhoon damage were observed.
Video image extraction and 3D reconstruction were processed in Metashape v. 1.7.4 (Agisoft LLC, Russia). Two frames per second were extracted from the videos and aligned to generate a high-accuracy sparse point cloud. The resulting model was scaled and a Euclidean coordinate system was established using the GCPs. The sparse point cloud was then improved by optimizing camera alignment. Finally, a dense cloud and a 3D mesh were created to produce a digital elevation model (DEM) and an orthomosaic image. The 3D models used 1394.5 ± 440.5 images in their reconstruction. The reprojection error was low (0.58 ± 0.26 mm) and GCP displayed an error of < 1 mm. Both DEMs and orthomosaic images had resolutions of 0.88 ± 0.28 mm, indicating good quality. After cropping, the delineated planar area of quadrats measured was 23.79 ± 2.32 m2. Both DEMs and orthomosaics were analyzed in QGIS 3.22.3 (QGIS Association, https://www.qgis.org) to assess structural complexity and benthic cover, respectively.
Eight metrics were used to represent the change in complexity of DEM at fine (< 4 cm), medium (4 - 16 cm), and coarse (> 16 cm) scales. The 16 cm resolution was used as a threshold for distinguishing biotic and abiotic processes (Magel et al., 2019; McCarthy et al., 2022). Information on terrain ruggedness index (TRI), slope (S), vector ruggedness measure (VRM), profile (PROC), and planform (PLC) curvatures were extracted at 4, 16, and 32 cm and presented as mean values (TRI, S, and VRM) or absolute mean values (PROC and PLC). Fractal dimension (D) was measured in a series of intervals: 1 - 2 cm, 2 - 4 cm, 4 - 8 cm, 8 - 16 cm, 16 - 32 cm, and 32 - 64 cm (Fukunaga and Burns, 2020; McCarthy et al., 2022). D [1 - 64 cm] was further used as an overall indicator of DEM complexity. Similarly, surface complexity (SC) and root-mean-square height (Sq) were used as general estimators. They represent the surface-area to planar-area ratio at 1 cm resolution and the standard deviation of heights estimated at 4 cm, respectively. The extraction of these metrics from the DEM was performed using the QGIS-plugins GRASS (Lacaze et al., 2018), GDAL (Ose, 2018) and SAGA (Conrad et al., 2015) for terrain features. The resulting complexity matrix described 25 quadrats with 24 different combinations of metrics and scales (simply referred to as ‘metrics’ and given as ‘metric name [scale]’ in later text). Further information on the meaning of these metrics and their measurement can be found in the Supplementary Table S1.
Benthic composition was determined by visually identifying and delineating the types of substrates (abiotic) or organisms (biotic) from the orthomosaic images. Identifications were first made at the most precise taxonomic level possible, and subsequently conservatively summarized into 29 benthic groups representing ten major categories (Supplementary Table S2). Our benthic groups distinguish algae into fleshy macroalgae (MA), crustose coralline algae (CCA), and turf algae (TU). Seven hard coral (HC), seven octocoral (OC), four sponge (SP), and one zoanthid (ZO) categories were considered according to the morphology of the colonies observed on the orthomosaics. Note that Heliopora spp. (Order Scleralcyonacea), Millepora spp. (Order Anthoathecata), and Tubipora spp. (Order Malacalcyonacea) are considered here as HC in addition to all Scleractinia. Other biotic categories include ascidian (AS), corallimorpharian (CO), sea anemone (AN), and motile life (OL). No morphology was assigned to AS, CO, and AN due to their small size on orthomosaics and tendency to all be encrusting. The abiotic category includes two substrate groups: stable (as bare stable substrate, BSS) and unstable (US). Finally, marine debris (MD) includes all natural and artificial debris observed on the orthomosaics. The cover of each benthic group was calculated as the total area occupied by this group divided by the delineated total planar area of each plot minus the minor contributions of OL and MD. The resulting benthic matrix resulted in 25 quadrats described by percent cover in 27 benthic groups.
For the complexity matrix, Pearson correlations were computed among metrics. A stepwise selection was conducted using the variance inflation factor (VIF) to remove variables with severe collinearity (VIF > 10; Forthofer et al., 2007) and retain only the most relevant set of metrics to describe changes in complexity. This resulted in a reduced-complexity matrix that was used to test for regional differences using a permutational multivariate analysis of variance (PERMANOVA; 9,999 permutations) applied to Euclidean distances among sites. Pairwise PERMANOVA comparisons were used to interpret significant differences after adjusting p-values using the Benjamini-Hochberg method. Finally, each metric was tested for latitudinal variation (Pearson correlation) and regional differences (Kruskal-Wallis test followed by Dunn’s pairwise post-hoc tests). The latter tests were also used to compare regional differences within benthic categories and groups. The benthic matrix was Hellinger-transformed and multivariate regional differences in quadrat composition tested using a PERMANOVA (999 permutations) followed by a pairwise comparison test as previously described.
To identify the benthic drivers of complexity and prevent overfitting, we select benthic variables to be included in the final model through a three-step process. First, a benthic variable was only considered if it occurred in more than half of the quadrats (e.g., sparsity < 0.5, 14 out of the 27 benthic groups). Each complexity metric was then modelled individually with the retained variables using a leave-one-out cross-validation (LOOCV) approach (Friedman et al., 2010) to confirm their importance in explaining different facets of complexity. Finally, a redundancy analysis (RDA) was employed to explain complexity in the light of the selected benthic variables (Hellinger-transformed). Benthic variables with the highest VIF were removed sequentially until none of the benthic variables displayed severe collinearity. A permutation test with 5,000 iterations was then conducted to assess the explanatory power of the final model, the contribution of axes in explaining variation of complexity among quadrats.
All data analyses were performed in R.4.3.0 (R Core Team, 2023) using the packages corrplot (Wei et al., 2021), glmnet (Tay et al., 2023), pairwiseAdonis (Martinez, 2023), PMCMRplus (Pohlert, 2022), Rcompanion (Mangiafico, 2023), usdm (Naimi et al., 2014), and vegan (Oksanen et al., 2022).
Some of the 24 complexity metrics show high correlations (Supplementary Figure S1), and the reduced-complexity matrix (VIF selected) retains only 11 metrics. Within the selected metrics, four: VRM [4 cm], PLC [4 cm], D [1 – 2 cm], and D [2 – 4 cm]) capture complexity at fine-scale; three capture complexity at medium-scale: PLC [16 cm], D [8 -16 cm], and D [16 – 32 cm]; and three PROC [32 cm], PLC [32 cm], and D [32 – 64 cm] capture complexity at coarse-scale. Sq describes the overall complexity. Complexity differs among regions (PERMANOVA: F = 2.15, p < 0.01; Supplementary Table S3). Pairwise comparisons (Supplementary Table S3) reveal overall complexity at EC to be significantly different compared with both NC (PERMANOVA: F = 3.90, p < 0.05) and LY (PERMANOVA: F = 4.84, p < 0.05). D [1 – 2 cm], and D [2 – 4 cm] decline with increasing latitude (Pearson correlations: r = -0.54, p < 0.01 and r = -0.52, p < 0.01, respectively; Figures 3A, B). D [1 - 2 cm], PROC [32 cm], and D [32 - 64 cm] further show regional differences (Kruskall-Wallis tests: χ2 = 12.13, p < 0.05; χ2 = 11.75, p < 0.05; χ2 = 6.42, p < 0.05; Figures 3C–E), with D [1 – 2 cm] lower in NC than in LY (Dunn’s test: p < 0.05), and PROC [32 cm] higher in EC than in LY and NC (Dunn’s tests: p < 0.05). Despite the main test being significant, no significant differences are detected for D [32 – 64 cm] in the following multiple comparisons.

Figure 3. Latitudinal and regional variations in complexity metrics. (A, B) Changes in D [1-2 cm] and D [2-4 cm] along latitudes. (C–E) Regional differences in D [1-2 cm], PROC [32 cm], and D [32-64 cm]. Significant pairwise comparisons (Dunn’s test) are indicated using asterisks: p < 0.05 (*), p < 0.01 (**). Colors correspond to different regions.
Regional composition in benthic categories is presented in Figure 4, with details on benthic groups available in Supplementary Table S4. The abiotic category dominates all regions (49 ± 22 to 58 ± 19%) but LD (33 ± 17%). Among the biotic categories, hard coral shows the highest cover in all regions, ranging between 25 ± 19% at EC and 55 ± 12% at LD. As for regional distinctions, only algae (Kruskall-Wallis test: χ2 = 9.95, p < 0.05) and zoanthid (Kruskall-Wallis test: χ2 = 12.17, p < 0.05) categories show regional differences. Yet only the latter presents significant differences in the following pairwise comparisons, which distinguishes NC (7 ± 13%) from KT (0 ± 0%; Dunn’s test: p < 0.05). Despite large intraregional variability, benthic composition significantly varies among regions (PERMANOVA: F = 1.80, p < 0.001; Supplementary Table S3), and subsequent pairwise comparisons show significant differences, with the exception of LY-KT, LY-EC, and KT-EC (Supplementary Table S3).
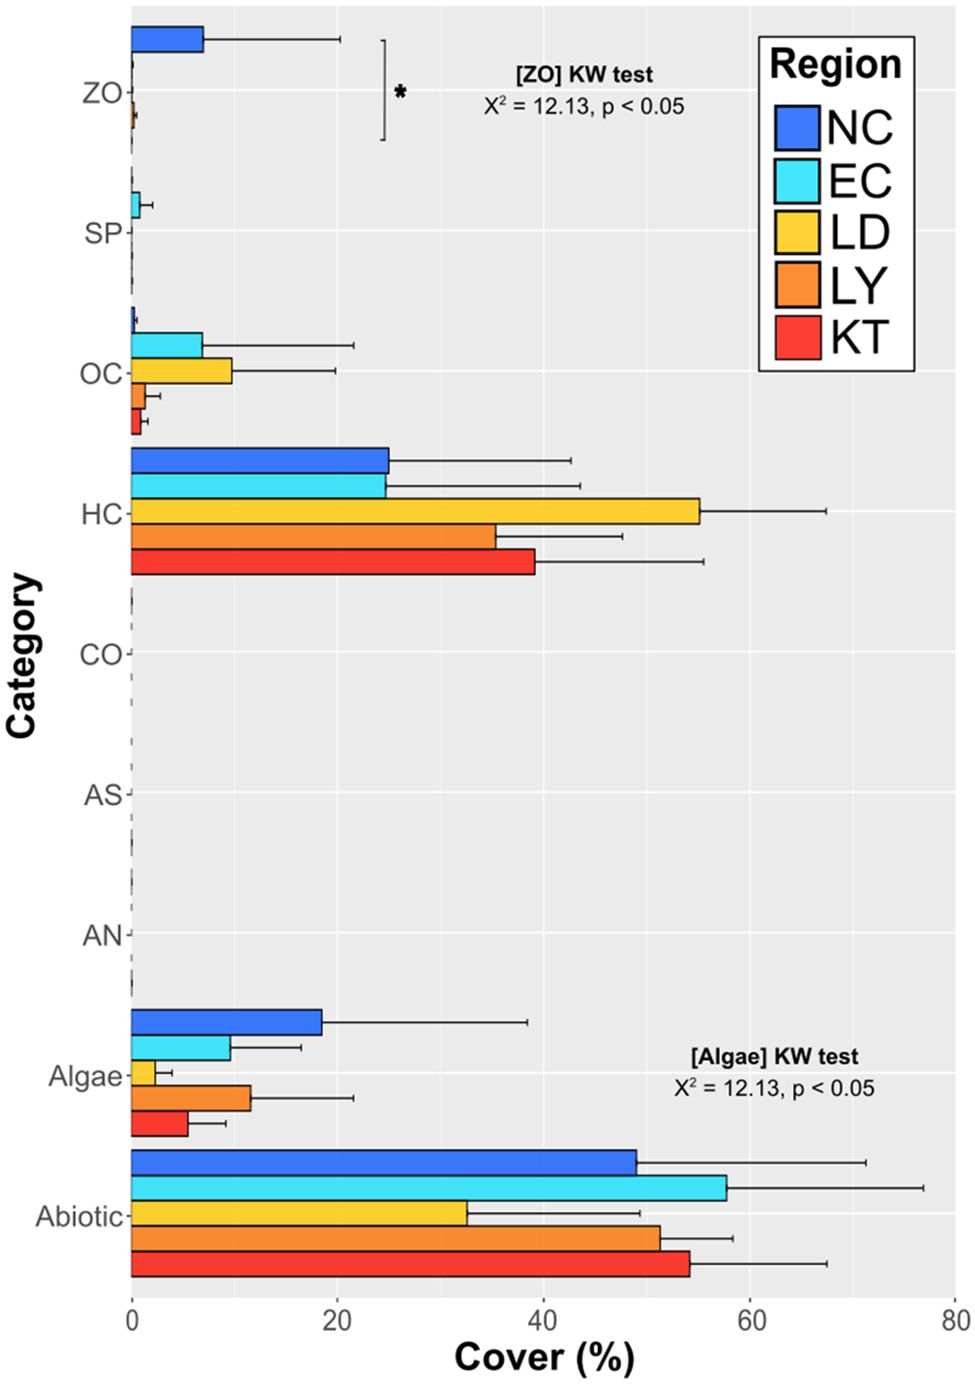
Figure 4. Regional comparison of benthic category covers. Horizontal bars represent the mean percentages of benthic covers with standard deviations. Significant differences between regions are indicated with the results of Kruskal-Wallis tests. Significant differences detected from following pairwise comparisons are displayed with vertical line and asterisk indicating significance level (p < 0.05 being represented by *). For algae, no significant differences are detected in subsequent multiple pairwise comparisons despite the main test being significant.
The LOOCV approach confirms that all pre-selected benthic groups (14 variables with sparsity < 0.5) are important in explaining at least one of the 11 retained complexity metrics (Supplementary Table S5). It varies between two extreme cases, with none of the benthic variables retained in explaining the metric (PLC [4 cm], D [8 – 16 cm], and PLC [32 cm]), and eight of the 14 benthic variables retained for D [2 - 4 cm].
BSS was removed following stepwise VIF selection in the RDA model. The final RDA (Figure 5) is significant (p < 0.01) and captures up to 34% of the total variance (adjusted-R2). With the exception of encrusting HC, most of the explanatory variables appear to contribute to RDA1 (28.8%; p < 0.05). In particular, bushy HC, arborescent HC, and diverse morphologies in OC appear to typify tropical regions, together with an increase in fine-scale complexity metrics. In contrast, NC is characterized by CCA and to a lesser extend by TU and encrusting ZO. Along RDA2 (16.4%), the contribution of US distinguishes EC, which is accompanied by an increase in coarse-scale metrics. Massive HC, encrusting HC, arborescent HC, bushy HC, bushy OC, CCA, TU, and fleshy MA also make a substantial contribution to RDA2; yet this axis is not significant. Arborescent HC (p < 0.01), massive HC (p < 0.05), and MA (p < 0.01) are significant in interpreting the variation of complexity between sites.
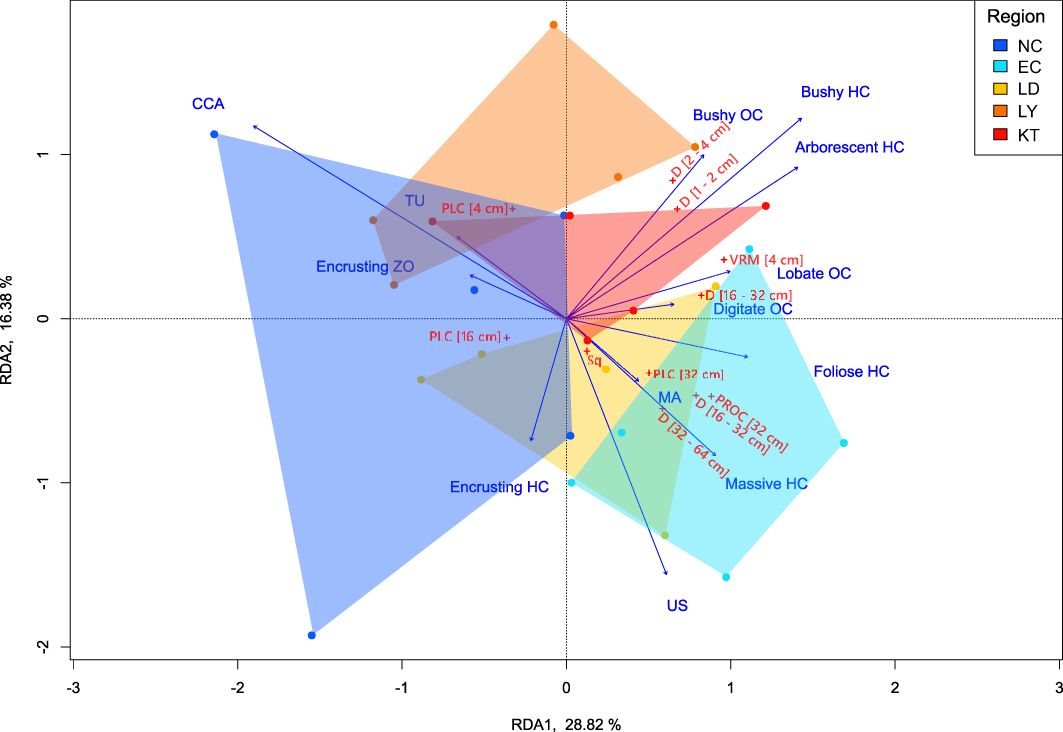
Figure 5. Redundancy analysis (RDA) showing the relationships among structural complexity metrics (11 metrics) and benthic groups (13 variables). Biplot is displayed at type 2 scaling. Details on the abbreviations of complexity metric and benthic groups are provided in the text as well as in Supplementary Tables S1, S2.
This study investigates the biotic drivers of benthic complexity in a transition area spanning tropical and subtropical assemblages. A set of structural metrics is selected to capture variations in benthic complexity across latitude. A decrease in fine-scale complexity with increasing latitude is associated with an increased benthic contribution of zoanthids and CCA, along with a loss of corals characterized by intricate —mainly branching— morphologies. The presence of unstable substrate negatively influences fine-scale complexity, but was positively related to coarse-scale complexity, which is linked to regional specificities in topographic features and the presence of large boulders at some sites. Overall, this study sheds light on the variations in complexity along latitudinal gradients and highlights the benthic organisms that play central roles in driving these changes. Importantly, these shifts in complexity may be partly related to the distinct environmental conditions in tropical and subtropical regions, making it crucial to differentiate them from changes in complexity observed along disturbance gradients.
Many metrics are relevant for measuring reef complexity (Fukunaga and Burns, 2020; Remmers et al., 2024). The choice of metrics is often subjective, with studies typically focusing on a limited number of metrics and scales (e.g. Asner et al., 2021; Chen and Dai, 2021). These metrics can describe changes in complexity along spatial gradients of disturbance (Chen and Dai, 2021; Magel et al., 2019) or along temporal shifts from coral to turf algae dominance, as observed following coral bleaching and subsequent mortality (Graham et al., 2006; Roth et al., 2018). Selecting appropriate metrics is particularly relevant when anticipating the loss of specific taxa (e.g., stony corals or corals of particular morphologies) that contribute to certain facets of complexity. However, when capturing the multiple aspects of reef complexity arising from various taxa (e.g., Rovellini et al., 2024; this study), careful consideration of the appropriate metrics is key to describing turnover in organisms potentially associated with changes in reef structure. Here, 11 metrics are identified as relevant for describing changes in complexity from tropical coral reefs to subtropical coral communities. Our approach removes redundant information present in certain metrics, and the selected set acknowledges structural complexity at different spatial scales. Thus, fine, medium, and coarse scale metrics are represented, capturing seascape variations affected by changes in benthic taxa abundance and environmental setting.
The variation in structural complexity across latitudes is influenced by both biotic and abiotic factors. On one hand, fine-scale complexity decreases with the decline of intricate coral morphologies and emergence of other sessile taxa at higher latitudes. This pattern, driven by natural shifts in community composition along the latitudinal gradient (Lin et al., 2022), appears to be independent of any loss of coral cover due to disturbances. In our case, this is best captured by the variations in metrics D [1-2 cm] and D [2-4 cm], which indicate a loss of microhabitats along the tropical-subtropical transition. On the other hand, regional topographic features become more pronounced in areas of lower coral cover and accretion, where boulder fields are interspersed with sand. PROC [32 cm] is the metric of choice here to capture this feature, which reveals regional differences but does follow a clear trend in latitudes. This pattern aligns with previous studies identifying biotic components as the main source of fine-scale rugosity, while coarse-scale rugosity is predominantly shaped by geological settings (McCarthy et al., 2022; Ribas-Deulofeu et al., 2021).
Healthy tropical reefs typically host a rich diversity of coral species with various morphologies, among which branching forms often dominate shallow waters (Tamir et al., 2019) and contribute to high fine-scale complexity (Rovellini et al., 2024). The decline of these branching forms, which are particularly sensitive to heat stress and bleaching, is associated with structural flattening and the global degradation of coral reefs. However, in tropical systems exposed or regularly impacted by typhoons, reefs may naturally appear ‘flat’ due to the dominance of corals with flattened morphologies (Ribas-Deulofeu et al., 2021). Similarly, at mesophotic depths where light attenuation is significant, encrusting to foliose morphologies tend to dominate (Pérez-Castro et al., 2023). In ‘marginal’ reefs at high latitudes (Schoepf et al., 2023), where environmental conditions depart from tropical ones, massive, foliose, and/or encrusting corals often dominate while species possessing intricate morphologies are largely absent (Sommer et al., 2014). Besides the intrinsic limitations of these species in withstanding subtropical environments, other factors such as competition for space with other sessile organisms (Abrego et al., 2021; Reimer et al., 2021) likely play a key role in the shift in structural complexity observed at higher latitudes.
Also influenced by reef exposure (Rabelo et al., 2015; Steneck, 1986), zoanthids and CCA are commonly distributed in subtropical coral assemblages (Lin and Denis, 2019; Lin et al., 2024; Reimer et al., 2021). While CCA can locally contribute to reef accretion and form large algal reefs (e.g., Taoyuan algae reef in Northwest Taiwan; Dai et al., 2009), CCA and other turf algae typically overgrow rocky surfaces, forming thin sheets that follow substrate contours. They contribute little to fine-scale complexity but their presence is associated with an increase in coarse-scale complexity when boulders are present. This feature is also associated with an increase in unstable substrate on the East Coast because sand tends to accumulate around large boulder rocks. Thus, from the perspective of fine-scale complexity, a reef ‘flattening’ is observed with increasing latitude. However, this pattern substantially differs from complexity changes observed along sequences of degradation, as it is driven by a turnover between tropical and subtropical species, with topographical features becoming more prominent as coral accretion diminishes. Although the changes in complexity appear to align with known environmental and natural gradients, we cannot completely disregard the potential influence of land-use drivers, which are known to contribute to widespread coastal degradation in Taiwan (Lin et al., 2024) and as observed in other reefs with human footprint (e.g. Lybolt et al., 2011). For some taxa, their response to stress may be confounded with their biogeography (e.g. branching corals). This emphasizes the importance of disentangling the effects of temperature, light and other environmental factors that are often confounded with latitudinal changes in complexity. To address this, examining changes in complexity across depth gradients can provide valuable insights, as light becomes the primary driver of variation at both the individual (morphology; López-Londoño et al., 2024) and community (composition; López-Londoño et al., 2022) levels.
Understanding the drivers of structural complexity across latitudes is crucial for effective reef management and conservation, especially in the face of climate change. The observed shift in benthic complexity, driven by changes in species composition and regional topography, suggests that reefs in biogeographic transition zones may respond differently to environmental stressors compared to tropical reefs in terms of structural complexity. These findings highlight the importance of tailoring conservation strategies to specific latitudinal contexts (Lin et al., 2024). For instance, the dominance of zoanthids and CCA in subtropical reefs may indicate a natural shift towards more resilient, yet less complex reef structures. However, this ‘flattening’ could reduce the habitat complexity that many tropical species depend on, potentially leading to declines in biodiversity across latitudes as well as different functions and services associated with these marginal systems. Therefore, conservation efforts should consider the unique biotic and abiotic factors shaping reef complexity in these regions, and prioritize actions that maintain or enhance structural complexity, which is vital for supporting local diversity and ecosystem functions. A key question in restoration is whether transplanting species that contribute little to structural complexity is ecologically relevant, especially if core reef functions like growth and habitat creation are not directly influenced by the corals being targeted (Bellwood et al., 2024). Although branching species are often selected for restoration projects for reasons of practicality (Boström-Einarsson et al., 2020), they would be far from ideal for use in subtropical regions as characterized here. Interestingly, branching corals, once transplanted in these conditions appeared to be more sensitive to predation and far less successful than encrusting (Carballo-Bolaños et al., 2024). Additionally, monitoring the transition from tropical to subtropical assemblages will be key to predicting and mitigating the impacts of climate change on reef ecosystems, ensuring the long-term resilience of these critical habitats.
In linking the complexity matrix to reef composition, several non-reef building taxa or categories are associated with specific facets of the structural complexity. Unfortunately, as in many other studies, actual contributions to complexity and indirect associations cannot be distinguished, such as the presence of unstable substrate, which is associated with an increase in coarse-scale complexity. Regional estimates of calcification rates in various reef-building taxa could improve future modeling of reef habitat expansion. Increasing the number of sampling sites and long-term monitoring at some sentinel stations would be a major improvement (Denis et al., 2020), but the manual and detailed annotation of the orthomosaics is a significant limitation. AI-assisted annotation tools, such as TagLab (Pavoni et al., 2022), offer promising prospects for fast and accurate automated semantic segmentation over larger photogrammetric plot extent. This could partially help uncover the drivers behind the portion of unexplained variance that remains to be addressed.
All methods employed were non-invasive. Sites were surveyed with the following permits: No. 1110109623, issued by Taitung County Government (www.taitung.gov.tw) ; No. 1110002597, issued by Kenting National Park Headquarters (https://www.ktnp.gov.tw/en/); No. 1113606425, issued by Fisheries and Fishing Port Affairs Management Office – New Taipei City Government (https://fishery.ntpc.gov.tw); and No. 1110300347, issued by Northeast and Yilan Coast National Scenic Area (www.necoast-nsa.gov.tw).
All data are publicly available from the Dryad Digital Repository https://doi.org/10.5061/dryad.931zcrjw2 (Wu et al., 2025). They are also made available together with the R script through the GitHub repository https://github.com/NTU-FRELab/complexity-drivers.git.
The manuscript presents research on animals that do not require ethical approval for their study.
M-HW: Methodology, Visualization, Writing – review & editing, Formal analysis, Investigation, Writing – original draft. LR-D: Investigation, Methodology, Visualization, Writing – review & editing, Supervision. C-HL: Investigation, Writing – review & editing. YN: Writing – review & editing, Methodology. VD: Methodology, Writing – review & editing, Conceptualization, Data curation, Funding acquisition, Project administration, Resources, Supervision, Validation, Visualization.
The author(s) declare financial support was received for the research, authorship, and/or publication of this article. This work was supported in part by grants from the National Science and Technology Council (project no. 111-2628-M-002-007-MY3), the Ocean Conservation Administration (project nos. 110-P-38, 111-P-40 and 112-P-40) and the National Taiwan University (project no. CDP-114L7722).
Authors would like to thank all the members of the Functional Ecology Laboratory for their assistance during field work. We also acknowledge the Academia Sinica Green Island Marine Station for the logistic support during fieldwork. Thanks to Yuting V. Lin for the photographs used in Figure 1.
The authors declare that the research was conducted in the absence of any commercial or financial relationships that could be construed as a potential conflict of interest.
The author(s) declare that no Generative AI was used in the creation of this manuscript.
All claims expressed in this article are solely those of the authors and do not necessarily represent those of their affiliated organizations, or those of the publisher, the editors and the reviewers. Any product that may be evaluated in this article, or claim that may be made by its manufacturer, is not guaranteed or endorsed by the publisher.
The Supplementary Material for this article can be found online at: https://www.frontiersin.org/articles/10.3389/fmars.2025.1513498/full#supplementary-material
Abdurrachman A. M. A. P., Estradivari Syafruddin G., Jompa J., Ferse S. C. A., Ambo-Rappe R. (2024). Patterns of rugosity on coral reefs around Lae-Lae, Samalona, Barrang Lompo and Kapoposang Islands. J. Sustain. Sci. Manag. 19, 127–137. doi: 10.46754/jssm.2024.01.011
Abrego D., Howells E. J., Smith S. D., Madin J. S., Sommer B., Schmidt-Roach S., et al. (2021). Factors limiting the range extension of corals into high-latitude reef regions. Diversity 13, 632. doi: 10.3390/d13120632
Aburto-Oropeza O., Ezcurra E., Moxley J., Sánchez-Rodríguez A., Mascarenas-Osorio I., Sánchez-Ortiz C., et al. (2015). A framework to assess the health of rocky reefs linking geomorphology, community assemblage, and fish biomass. Ecol. Indic. 52, 353–361. doi: 10.1016/j.ecolind.2014.12.006
Alvarez-Filip L., Dulvy N. K., Gill J. A., Côté I. M., Watkinson A. R. (2009). Flattening of Caribbean coral reefs: region-wide declines in architectural complexity. Proc. R. Soc. B: Biol. Sci. 276, 3019–3025. doi: 10.1098/rspb.2009.0339
Asner G. P., Vaughn N. R., Foo S. A., Shafron E., Heckler J., Martin R. E. (2021). Abiotic and human drivers of reef habitat complexity throughout the Main Hawaiian Islands. Front. Mar. Sci. 8, 631842. doi: 10.3389/fmars.2021.631842
Bauman A. G., Januchowski–Hartley F. A., Teo A., Todd P. A. (2022). Further flattening of a degraded, turbid reef system following a severe coral bleaching event. Front. Mar. Sci. 9. doi: 10.3389/fmars.2022.910085
Bellwood D. R., Brandl S. J., McWilliam M., Streit R. P., Yan H. F., Tebbett S. B. (2024). Studying functions on coral reefs: past perspectives, current conundrums, and future potential. Coral Reefs 43, 281–297. doi: 10.1007/s00338-024-02474-z
Boström-Einarsson L., Babcock R. C., Bayraktarov E., Ceccarelli D., Cook N., Ferse S. C., et al. (2020). Coral restoration–A systematic review of current methods, successes, failures and future directions. PloS One 15, e0226631. doi: 10.1371/journal.pone.0226631
Burns J. H. R., Delparte D., Kapono L., Belt M., Gates R. D., Takabayashi M. (2016). Assessing the impact of acute disturbances on the structure and composition of a coral community using innovative 3D reconstruction techniques. Meth. Oceanogr. 15-16, 49–59. doi: 10.1016/j.mio.2016.04.001
Carballo-Bolaños R., Wei Y., Denis V. (2024). Coral transplantation in urban environments: Insights from colony survival and growth on artificial frames versus the seabed. Mar. Environ. Res. 194, 106319. doi: 10.1016/j.marenvres.2023.106319
Chen G. K., Dai C. F. (2021). Using 3D photogrammetry to quantify the subtle differences of coral reefs under the impacts of marine activities. Mar. Pollut. Bull. 173, 113032. doi: 10.1016/j.marpolbul.2021.113032
Conrad O., Bechtel B., Bock M., Dietrich H., Fischer E., Gerlitz L., et al. (2015). System for automated geoscientific analyses (SAGA) v. 2.1. 4. Geosci. Model. Dev. 8, 1991–2007. doi: 10.5194/gmd-8-1991-2015
Dai C. F., Wang S. W., Chang J. S., Jeng A. I. (2009). Handbook for ecological tours of Guanyin algae reef (Taiwan: CPC Corporation).
Dang V. D. H., Cheung P.-Y., Fong C.-L., Mulla A. J., Shiu J.-H., Lin C.-H., et al. (2020). Sea urchins play an increasingly important role for coral resilience across reefs in Taiwan. Front. Mar. Sci. 7. doi: 10.3389/fmars.2020.581945
Denis V., Fan T. Y., Hsiao W. V., Hwang S. J., Lin Y. V., Nozawa Y. (2020). Idea Paper: Tracking the distribution of accretive reef communities across the Kuroshio region. Ecol. Res. 35, 595–598. doi: 10.1111/1440-1703.12128
Denis V., Soto D., De Palmas S., Lin Y. T. V., Benayahu Y., Huang Y. M., et al. (2019). “Taiwan” in Mesophotic Coral Ecosystems. Eds. Loya Y., Puglise K., Bridge T. (Springer, Cham), 249–264. doi: 10.1007/978-3-319-92735-0_14
Dustan P., Doherty O., Pardede S. (2013). Digital reef rugosity estimates coral reef habitat complexity. PloS One 8, e57386. doi: 10.1371/journal.pone.0057386
Ferrari R., Bryson M., Bridge T., Hustache J., Williams S. B., Byrne M., et al. (2016). Quantifying the response of structural complexity and community composition to environmental change in marine communities. Glob. Chang. Biol. 22, 1965–1975. doi: 10.1111/gcb.13197
Forthofer R. N., Lee E. S., Hernandez M. (2007). Biostatistics: A Guide to Design, Analysis, and Discovery. 2nd ed (San Diego, USA: Academic Press).
Friedman J. H., Hastie T., Tibshirani R. (2010). Regularization paths for generalized linear models via coordinate descent. J. Stat. Software 33, 1–22. doi: 10.18637/jss.v033.i01
Fukunaga A., Burns J. H. R. (2020). Metrics of coral reef structural complexity extracted from 3D mesh models and digital elevation models. Remote Sens. 12, 2676. doi: 10.3390/rs12172676
González-Rivero M., Harborne A. R., Herrera-Reveles A., Bozec Y. M., Rogers A., Friedman A., et al. (2017). Linking fishes to multiple metrics of coral reef structural complexity using three-dimensional technology. Sci. Rep. 7, 13965. doi: 10.1038/s41598-017-14272-5
Graham N. A. (2014). Habitat complexity: coral structural loss leads to fisheries declines. Curr. Biol. 24, R359–R361. doi: 10.1016/j.cub.2014.03.069
Graham N. A., Jennings S., MacNeil M. A., Mouillot D., Wilson S. K. (2015). Predicting climate-driven regime shifts versus rebound potential in coral reefs. Nature 518, 94–97. doi: 10.1038/nature14140
Graham N. A. J., Nash K. L. (2012). The importance of structural complexity in coral reef ecosystems. Coral Reefs 32, 315–326. doi: 10.1007/s00338-012-0984-y
Graham N. A., Wilson S. K., Jennings S., Polunin N. V., Bijoux J. P., Robinson J. (2006). Dynamic fragility of oceanic coral reef ecosystems. Proc. Natl. Acad. Sci. U. S. A. 103, 8425–8429. doi: 10.1073/pnas.0600693103
Helder N., Burns J. H. R., Green S. J. (2022). Intra-habitat structural complexity drives the distribution of fish trait groups on coral reefs. Ecol. Indic. 142, 109266. doi: 10.1016/j.ecolind.2022.109266
Hsiao W. V., Lin Y. V., Lin H. T., Denis V. (2021). Learning from differences: Abiotic determinism of benthic communities in Northern Taiwan. Mar. Environ. Res. 170, 105361. doi: 10.1016/j.marenvres.2021.105361
Kahng S., Copus J. M., Wagner D. (2017). “Mesophotic coral ecosystems” in Marine Animal Forests. Ed. Rossi S. (Springer, Cham), 185–206. doi: 10.1007/978-3-319-21012-4
Lacaze B., Dudek J., Picard J. (2018). “GRASS GIS software with QGIS” in QGIS and generic tools, vol. 1 . Eds. Baghdadi N., Mallet C., Picard J. (ISTE Ltd, London, UK and John Wiley & Sons, Inc, Hoboken), 67–106. doi: 10.1002/9781119457091.ch3
Lin Y. V., Château P. A., Nozawa Y., Wei C. L., Wunderlich R. F., Denis V. (2024). Drivers of coastal benthic communities in a complex environmental setting. Mar. Pollut. Bull. 203, 116462. doi: 10.1016/j.marpolbul.2024.116462
Lin Y. V., Denis V. (2019). Acknowledging differences: number, characteristics, and distribution of marine benthic communities along Taiwan coast. Ecosphere 10, e02903. doi: 10.1002/ecs2.2803
Lin Y. V., Hsiao W. V., Chen W. J., Denis V. (2022). Habitat change and its consequences on reef fish specialization in biogeographic transition zones. J. Biogeogr. 49, 1549–1561. doi: 10.1111/jbi.14450
López-Londoño T., Enríquez S., Iglesias-Prieto R. (2024). Effects of surface geometry on light exposure, photoacclimation and photosynthetic energy acquisition in zooxanthellate corals. PloS One 19, e0295283. doi: 10.1371/journal.pone.0295283
López-Londoño T., Gómez-Campo K., Hernández-Pech X., Enríquez S., Iglesias-Prieto R. (2022). Photosynthetic usable energy explains vertical patterns of biodiversity in zooxanthellate corals. Sci. Rep. 12, 20821. doi: 10.1038/s41598-022-25094-5
Lybolt M., Neil D., Zhao J., Feng Y., Yu K. F., Pandolfi J. (2011). Instability in a marginal coral reef: the shift from natural variability to a human-dominated seascape. Front. Ecol. Environ. 9, 154–160. doi: 10.1890/090176
Lyons P. J., Arboleda E., Benkwitt C. E., Davis B., Gleason M., Howe C., et al. (2015). The effect of recreational SCUBA divers on the structural complexity and benthic assemblage of a Caribbean coral reef. Biodivers. Conserv. 24, 3491–3504. doi: 10.1007/s10531-015-1009-2
Magel J. M. T., Burns J. H. R., Gates R. D., Baum J. K. (2019). Effects of bleaching-associated mass coral mortality on reef structural complexity across a gradient of local disturbance. Sci. Rep. 9, 2512. doi: 10.1038/s41598-018-37713-1
Mangiafico S. (2023). Rcompanion: Functions to support extension education program evaluation. R package version 2.4. 30 (New Brunswick, New Jersey: Rutgers Cooperative Extension). Available at: https://CRAN.R-project.org/package=rcompanion.
Martinez A. P. (2017) pairwiseAdonis: Pairwise multilevel comparison using adonis. R package version 0.4.1. Available at: https://github.com/pmartinezarbizu/pairwiseAdonis.
McCarthy O. S., Smith J. E., Petrovic V., Sandin S. A. (2022). Identifying the drivers of structural complexity on Hawaiian coral reefs. Mar. Ecol. Prog. Ser. 702, 71–86. doi: 10.3354/meps14205
Mills M. S., Schils T., Olds A. D., Leon J. X. (2023). Structural complexity of coral reefs in Guam, Mariana Islands. Remote Sens. 15, 5558. doi: 10.3390/rs15235558
Montero-Serra I., Garrabou J., Doak D. F., Ledoux J. B., Linares C. (2019). Marine protected areas enhance structural complexity but do not buffer the consequences of ocean warming for an overexploited precious coral. J. Appl. Ecol. 56, 1063–1074. doi: 10.1111/1365-2664.13321
Munday P. L., Jones G. P., Caley M. J. (1997). Habitat specialisation and the distribution and abundance of coral-dwelling gobies. Mar. Ecol. Prog. Ser. 152, 227–239. doi: 10.3354/meps152227
Naimi B., Hamm N. A. S., Groen T. A., Skidmore A. K., Toxopeus A. G. (2014). Where is positional uncertainty a problem for species distribution modelling? Ecography 37, 191–203. doi: 10.1111/j.1600-0587.2013.00205.x
Oksanen J., Simpson G., Blanchet F. G., Kindt R., Legendre P., Minchin P., et al. (2022) Vegan: Community ecology package. R package version 2.6-2. Available at: https://CRAN.R-project.org/package=vegan.
Ose K. (2018). “Introduction to GDAL Tools in QGIS” in QGIS and generic tools, vol. 1 . Eds. Baghdadi N., Mallet C., Picard J. (ISTE Ltd, London, UK and John Wiley & Sons, Inc, Hoboken), 19–66. doi: 10.1002/9781119457091.ch2
Palma M., Rivas Casado M., Pantaleo U., Pavoni G., Pica D., Cerrano C. (2018). SfM-based method to assess gorgonian forests (Paramuricea clavata (Cnidaria, Octocorallia)). Remote Sens. 10, 1154. doi: 10.3390/rs10071154
Pascoe K. H., Fukunaga A., Kosaki R. K., Burns J. H. R. (2021). 3D assessment of a coral reef at Lalo Atoll reveals varying responses of habitat metrics following a catastrophic hurricane. Sci. Rep. 11, 12050. doi: 10.1038/s41598-021-91509-4
Pavoni G., Corsini M., Ponchio F., Muntoni A., Edwards C., Pedersen N., et al. (2022). TagLab: AI-assisted annotation for the fast and accurate semantic segmentation of coral reef orthoimages. J. Field Robot. 39, 246–262. doi: 10.1002/rob.22049
Pérez-Castro M.Á., Eyal G., Leyte-Morales G. E., Hinojosa-Arango G., Enríquez S. (2023). Benthic characterization of mesophotic communities based on optical depths in the southern Mexican Pacific Coast (Oaxaca). Diversity 15, 531. doi: 10.3390/d15040531
Pohlert T. (2022) PMCMRplus: Calculate pairwise multiple comparisons of mean rank sums extended. R package version 1.9.6. Available at: https://CRAN.R-project.org/package=PMCMRplus.
Polunin N. V. C., Roberts C. M. (1993). Greater biomass and value of target coral-reef fishes in two small Caribbean marine reserves. Mar. Ecol. Prog. Ser. 100, 167–176. doi: 10.3354/meps100167
R Core Team. (2023). R: A language and environment for statistical computing (Vienna: R Foundation for Statistical Computing). Available at: https://www.R-project.org/.
Rabelo E. F., Soares M. D. O., Bezerra L. E. A., Matthews-Cascon H. (2015). Distribution pattern of zoanthids (Cnidaria: Zoantharia) on a tropical reef. Mar. Biol. Res. 11, 584–592. doi: 10.1080/17451000.2014.962542
Reimer J. D., Wee H. B., López C., Beger M., Cruz I. C. S. (2021). Widespread Zoanthus and Palythoa dominance, barrens, and phase shifts in shallow water subtropical and tropical marine ecosystems. Oceanogr. Mar. Biol. 59, 533–557. doi: 10.1201/9781003138846-7
Remmers T., Grech A., Roelfsema C., Gordon S., Lechene M., Ferrari R. (2024). Close-range underwater photogrammetry for coral reef ecology: A systematic literature review. Coral Reefs 43, 35–52. doi: 10.1007/s00338-023-02445-w
Reverter M., Helber S. B., Rohde S., de Goeij J. M., Schupp P. J. (2022). Coral reef benthic community changes in the Anthropocene: Biogeographic heterogeneity, overlooked configurations, and methodology. Glob. Chang. Biol. 28, 1956–1971. doi: 10.1111/gcb.16034
Ribas-Deulofeu L., Château P.-A., Denis V., Chen C. A. (2021). Portraying gradients of structural complexity in coral reefs using fine-scale depth profiles. Front. Mar. Sci. 8, 675853. doi: 10.3389/fmars.2021.675853
Ribas-Deulofeu L., Denis V., De Palmas S., Kuo C. Y., Hsieh H. J., Chen C. A. (2016). Structure of benthic communities along the Taiwan latitudinal gradient. PloS One 11, e0160601. doi: 10.1371/journal.pone.0160601
Richardson L. E., Graham N. A., Hoey A. S. (2017). Cross-scale habitat structure driven by coral species composition on tropical reefs. Sci. Rep. 7, 7557. doi: 10.1038/s41598-017-08109-4
Risk M. J. (1972). Fish diversity on a coral reef in the Virgin Islands. Atoll Res. Bull. 153, 1–4. doi: 10.5479/si.00775630.153.1
Roberts T., Moloney J., Sweatman H., Bridge T. (2015). Benthic community composition on submerged reefs in the central Great Barrier Reef. Coral Reefs 34, 569–580. doi: 10.1007/s00338-015-1261-7
Roff G., Joseph J., Mumby P. J. (2020). Multi-decadal changes in structural complexity following mass coral mortality on a Caribbean reef. Biogeosciences 17, 5909–5918. doi: 10.5194/bg-17-5909-2020
Rogers A., Blanchard J. L., Mumby P. J. (2014). Vulnerability of coral reef fisheries to a loss of structural complexity. Curr. Biol. 24, 1000–1005. doi: 10.1016/j.cub.2014.03.026
Rossi S., Bramanti L., Gori A., Orejas C. (2017). “Animal forests of the World” in Marine Animal Forests. Ed. Rossi S. (Springer International Publishing, New York), 1–28. doi: 10.1007/978-3-319-21012-4_1
Roth F., Saalmann F., Thomson T., Coker D. J., Villalobos R., Jones B. H., et al. (2018). Coral reef degradation affects the potential for reef recovery after disturbance. Mar. Environ. Res. 142, 48–58. doi: 10.1016/j.marenvres.2018.09.022
Rovellini A., Mortimer C. L., Dunn M. R., Fulton E. A., Jompa J., Haris A., et al. (2024). Reduced small-scale structural complexity on sponge-dominated areas of Indo-Pacific coral reefs. Mar. Environ. Res. 193, 106254. doi: 10.1016/j.marenvres.2023.106254
Sanna G., Büscher J. V., Freiwald A. (2023). Cold-water coral framework architecture is selectively shaped by bottom current flow. Coral Reefs 42, 483–495. doi: 10.1007/s00338-023-02361-z
Sarà M. (1986). Sessile macrofauna and marine ecosystem. Ital. J. Zool. 53, 329–337. doi: 10.1080/11250008609355518
Schoepf V., Baumann J. H., Barshis D. J., Browne N. K., Camp E. F., Comeau S., et al. (2023). Corals at the edge of environmental limits: A new conceptual framework to re-define marginal and extreme coral communities. Sci. Total Environ. 884, 163688. doi: 10.1016/j.scitotenv.2023.163688
Shantz A. A., Ladd M. C., Schrack E., Burkepile D. E. (2015). Fish-derived nutrient hotspots shape coral reef benthic communities. Ecol. Appl. 25, 2142–2152. doi: 10.1890/14-2209.1
Smale D. A., Kendrick G. A., Waddington K. I., Van Niel K. P., Meeuwig J. J., Harvey E. S. (2010). Benthic assemblage composition on subtidal reefs along a latitudinal gradient in Western Australia. Estua. Coast. Shelf Sci. 86, 83–92. doi: 10.1016/j.ecss.2009.10.016
Sommer B., Harrison P. L., Beger M., Pandolfi J. M. (2014). Trait-mediated environmental filtering drives assembly at biogeographic transition zones. Ecology 95, 1000–1009. doi: 10.1890/13-1445.1
Steneck R. S. (1986). The ecology of coralline algal crusts: convergent patterns and adaptative strategies. Annu. Rev. Ecol. Syst. 17, 273–303. doi: 10.1146/annurev.es.17.110186.001421
Syms C., Jones G. P. (2000). Disturbance, habitat structure, and the dynamics of a coral-reef fish community. Ecology 81, 2714–2729. doi: 10.1890/0012-9658(2000)081[2714:DHSATD]2.0.CO;2
Tamir R., Eyal G., Kramer N., Laverick J. H., Loya Y. (2019). Light environment drives the shallow-to-mesophotic coral community transition. Ecosphere 10, e02839. doi: 10.1002/ecs2.2839
Tay J. K., Narasimhan B., Hastie T. (2023). Elastic net regularization paths for all generalized linear models. J. Stat. Software 106, 1–31. doi: 10.18637/jss.v106.i01
Tebbett S. B., Streit R. P., Bellwood D. R. (2020). A 3D perspective on sediment accumulation in algal turfs: Implications of coral reef flattening. J. Ecol. 108, 70–80. doi: 10.1111/1365-2745.13235
Urbina-Barreto I., Elise S., Guilhaumon F., Bruggemann J. H., Pinel R., Kulbicki M., et al. (2022). Underwater photogrammetry reveals new links between coral reefscape traits and fishes that ensure key functions. Ecosphere 13, e3934. doi: 10.1002/ecs2.3934
Verges A., Vanderklift M. A., Doropoulos C., Hyndes G. A. (2011). Spatial patterns in herbivory on a coral reef are influenced by structural complexity but not by algal traits. PloS One 6, e17115. doi: 10.1371/journal.pone.0017115
Wei T., Simko V. R., Levy M., Xie Y., Jin Y., Zemla J. (2021) R package “corrplot”: Visualization of a correlation matrix. R package version 0.92. Available at: https://github.com/taiyun/corrplot.
Westoby M. J., Brasington J., Glasser N. F., Hambrey M. J., Reynolds J. M. (2012). ‘Structure-from-Motion’ photogrammetry: A low-cost, effective tool for geoscience applications. Geomorphology 179, 300–314. doi: 10.1016/j.geomorph.2012.08.021
Wilson S., Graham N., Polunin N. V. (2007). Appraisal of visual assessments of habitat complexity and benthic composition on coral reefs. Mar. Biol. 151, 1069–1076. doi: 10.1007/s00227-006-0538-3
Wu M.-H. M., Ribas-Deulofeu L., Liu C.-H. E., Nozawa Y., Denis V. (2025). Data from: Benthic drivers of structural complexity in coral reefs across a tropical-subtropical transition zone [Dataset]. Dryad. doi: 10.5061/dryad.931zcrjw2
Yanovski R., Abelson A. (2019). Structural complexity enhancement as a potential coral-reef restoration tool. Ecol. Eng. 132, 87–93. doi: 10.1016/j.ecoleng.2019.04.007
Yanovski R., Nelson P. A., Abelson A. (2017). Structural complexity in coral reefs: examination of a novel evaluation tool on different spatial scales. Front. Ecol. Evol. 5. doi: 10.3389/fevo.2017.00027
Young G. C., Dey S., Rogers A. D., Exton D. (2017). Cost and time-effective method for multi-scale measures of rugosity, fractal dimension, and vector dispersion from coral reef 3D models. PloS One 12, e0175341. doi: 10.1371/journal.pone.0175341
Keywords: scleractinian, crustose coralline algae, morphology, habitat, rugosity, photogrammetry, high-latitude, coastal ecosystems
Citation: Wu M-HM, Ribas-Deulofeu L, Liu C-HE, Nozawa Y and Denis V (2025) Benthic drivers of structural complexity in coral reefs across a tropical-subtropical transition zone. Front. Mar. Sci. 12:1513498. doi: 10.3389/fmars.2025.1513498
Received: 18 October 2024; Accepted: 27 January 2025;
Published: 24 February 2025.
Edited by:
Hajime Kayanne, The University of Tokyo, JapanReviewed by:
Susana Enríquez, National Autonomous University of Mexico, MexicoCopyright © 2025 Wu, Ribas-Deulofeu, Liu, Nozawa and Denis. This is an open-access article distributed under the terms of the Creative Commons Attribution License (CC BY). The use, distribution or reproduction in other forums is permitted, provided the original author(s) and the copyright owner(s) are credited and that the original publication in this journal is cited, in accordance with accepted academic practice. No use, distribution or reproduction is permitted which does not comply with these terms.
*Correspondence: Vianney Denis, dmlhbm5leWRlbmlzQG50dS5lZHUudHc=
†ORCID: Meng-Hsin Morris Wu, orcid.org/0009-0006-6805-1084
Lauriane Ribas-Deulofeu, orcid.org/0000-0001-9005-5547
Chia-Hung Eric Liu, orcid.org/0009-0001-6680-3637
Yoko Nozawa, orcid.org/0000-0001-6124-6045
Vianney Denis, orcid.org/0000-0002-0914-5586
Disclaimer: All claims expressed in this article are solely those of the authors and do not necessarily represent those of their affiliated organizations, or those of the publisher, the editors and the reviewers. Any product that may be evaluated in this article or claim that may be made by its manufacturer is not guaranteed or endorsed by the publisher.
Research integrity at Frontiers
Learn more about the work of our research integrity team to safeguard the quality of each article we publish.