
94% of researchers rate our articles as excellent or good
Learn more about the work of our research integrity team to safeguard the quality of each article we publish.
Find out more
ORIGINAL RESEARCH article
Front. Mar. Sci. , 27 January 2025
Sec. Marine Molecular Biology and Ecology
Volume 12 - 2025 | https://doi.org/10.3389/fmars.2025.1509743
 Lei Hao1,2
 Xinting Xu1,2Yan Zhou1,2Dan Liu1,2Jianqiang Shao3Jiayong Pan3Guangxi He3Zhongjun Hu1,2*
 Qigen Liu1,2*
Monitoring zooplankton diversity and community dynamics is essential for understanding ecological processes within freshwater ecosystems. Environmental DNA (eDNA) has been increasingly employed in this field due to its efficiency and accuracy. However, its potential applications in freshwater ecosystems require further validation. In this study, we evaluated the performance of 18S rRNA and COI primers for freshwater zooplankton diversity monitoring and systematically compared the selected primers with the microscopy method in Qiandao Lake, China. Our results indicated that the COI primer marker (mlCOIintF/jgHCO2198) was more suitable for freshwater zooplankton diversity monitoring than 18S rRNA. The eDNA method identified a total of 102 species, whereas the microscopy method detected 111 species. Non-metric multidimensional scaling (NMDS) analysis and nonparametric multivariate statistical tests revealed that both abundance and biomass species compositions determined by microscopy differed significantly from those based on eDNA reads. Both methods detected significant seasonal changes in zooplankton community species composition, while eDNA provided a comprehensive view of the complex interactions within the community. Both methods indicate that rotifers are the primary group driving seasonal changes in the zooplankton community. The eDNA identified more environmental factors associated with seasonal changes in zooplankton communities than microscopy, including dissolved oxygen (DO), nephelometric turbidity unit (NTU), ammonia nitrogen (NH3-N), and total phosphorus (TP). The eDNA reads of rotifer and crustacean plankton increased linearly with their morphological abundance but not with biomass. Furthermore, combining morphological abundance and biomass as predictor variables for eDNA reads moderately enhanced the explanatory power compared to using them individually. Although eDNA cannot yet replace morphological methods, its efficiency and sensitivity make it a valuable complementary tool for zooplankton monitoring, with considerable potential for future applications.
In recent years, global biodiversity has faced threats from multiple stressors (Vörösmarty et al., 2010), such as environmental pollution (Xiong et al., 2019), habitat degradation (van der Heyde et al., 2022), and human activities (Häder et al., 2020; Tateda et al., 2024). As a key component of lake ecosystems, zooplankton not only regulate the abundance of organisms at higher trophic levels (Bunnell et al., 2013; Landry and Hassett, 1982; Yoshida et al., 2003), but also act as a critical link between primary producers and higher trophic organisms (Giering et al., 2019). As a result, they are often used as key indicators of lake ecological quality (Jeppesen et al., 2011). Due to their small size and short life spans, zooplankton are highly sensitive to environmental stressors and are prone to significant community changes (Attayde and Bozelli, 1998; Hays et al., 2005). Therefore, monitoring the diversity and dynamics of zooplankton communities is essential for understanding ecological processes in lakes and forms the basis for biodiversity assessments (Chiba et al., 2018).
According to the European Union (EU) Water Framework Directive (WFD, 2000/60/EC), biodiversity monitoring should be cost-effective, efficient, and accurate (Li et al., 2019a; Voulvoulis et al., 2017). Zooplankton consist of a wide range of invertebrate taxa, including rotifers, cladocerans, and copepods (Gavrilko et al., 2024). The complexity and extensive diversity of these taxa pose significant technical and operational challenges for monitoring (Tittensor et al., 2010). Traditional microscopy methods identify zooplankton based on their morphological characteristics (e.g., body size, color, antennae, and mouthparts). This process is often time-consuming and labor-intensive, requiring extensive taxonomic expertise (Lindeque et al., 2006). In recent years, advances in molecular biology have established eDNA as a cost-effective tool for biodiversity monitoring (Taberlet et al., 2012). While eDNA has been widely applied in biodiversity monitoring of marine ecosystems (Leray et al., 2013; O’Rorke et al., 2022), its application in freshwater zooplankton studies remains comparatively limited. Recent studies have begun to explore its potential in this area, demonstrating its capability to detect a broader range of taxa compared to traditional microscopy methods (Du et al., 2024; Song and Liang, 2023).
The selection of genetic marker primers is a critical factor affecting the accuracy and sensitivity of eDNA analysis and plays a key role in biodiversity research (Alberdi et al., 2018). Currently, four gene regions commonly used for zooplankton biodiversity monitoring include 16S rRNA (Lindeque et al., 2006), 28S rRNA (Hirai et al., 2013), 18S rRNA (Chain et al., 2016), and mitochondrial COI (Zaiko et al., 2015), with 18S rRNA and COI being the most widely employed. The V9 region of 18S rRNA is often used for eukaryotic identification due to its high genetic variability (Amaral-Zettler et al., 2009). In contrast, COI has been proven to be highly suitable for accurate identification of marine plankton (Hebert et al., 2003; Zaiko et al., 2015). However, the specific suitability of 18S rRNA and COI primers for monitoring freshwater zooplankton remains unclear. Furthermore, amplification efficiency may vary for specific primers when applied to different taxa, potentially influencing the assessment outcomes (Clarke et al., 2014; Drummond et al., 2015). Nevertheless, eDNA provides an efficient solution for zooplankton monitoring and has demonstrated promise as a valuable complementary tool to microscopy (Duarte et al., 2021; Schroeder et al., 2020). However, most existing studies have primarily focused on species identification, resulting in the differences in zooplankton community composition between the two methods, including dominant and divergent species, remaining underexplored and warranting further investigation (Ji et al., 2022). The reliability of eDNA sequencing data for quantitative analyses of zooplankton has been questioned due to technical issues, including universal primer bias and PCR amplification errors (Clarke et al., 2017; Piñol et al., 2015; Sun et al., 2015). Nonetheless, several studies have demonstrated significant correlations between eDNA reads and abundance estimates obtained from microscopy (Feng et al., 2023; Matthews et al., 2021). In lake ecosystems, seasonal changes in zooplankton communities are influenced by both abiotic factors (e.g., temperature, nutrients) and biotic factors (e.g., predation, competition, symbiosis) (Jiang et al., 2023; Yang and Zhang, 2020). Interactions among zooplankton are crucial for species evolution and the maintenance of ecosystem functions (Bjorbækmo et al., 2019). Compared to microscopy, high-throughput sequencing of eDNA provides extensive data for studying inter-organism interactions (Zhang et al., 2022). Meanwhile, advancements in primer design have further enhanced taxonomic resolution, enabling researchers to capture seasonal and spatial dynamics in zooplankton communities (Hu et al., 2024; Schroeder et al., 2020; Zhang et al., 2023). Studies have indicated that eDNA significantly expands the range of biological indicators associated with environmental factors by capturing more comprehensive information about potential species than traditional microscopic methods (Pawlowski et al., 2018; Yang and Zhang, 2020). However, further investigation is necessary to ascertain whether the two methods are consistent in their responses to environmental variables.
Qiandao Lake (E 118°36′09″–119°13′53″, N 29°24′10″–29°48′04″) (Figure 1), located in Hangzhou City, Zhejiang Province, China, is a large, deep freshwater lake created through artificial water storage (Gu et al., 2016). Qiandao Lake serves as a nationally protected drinking water source and plays an essential role in fishery production, tourism development, and ecological conservation (Li et al., 2017; Zhang et al., 2023). However, increased human activities have led to a significant rise in exogenous pollutant inputs, posing a serious threat to the ecological environment of Qiandao Lake (Wang et al., 2022; Zhao et al., 2024). This has placed considerable pressure and challenges on the diversity and stability of zooplankton communities.
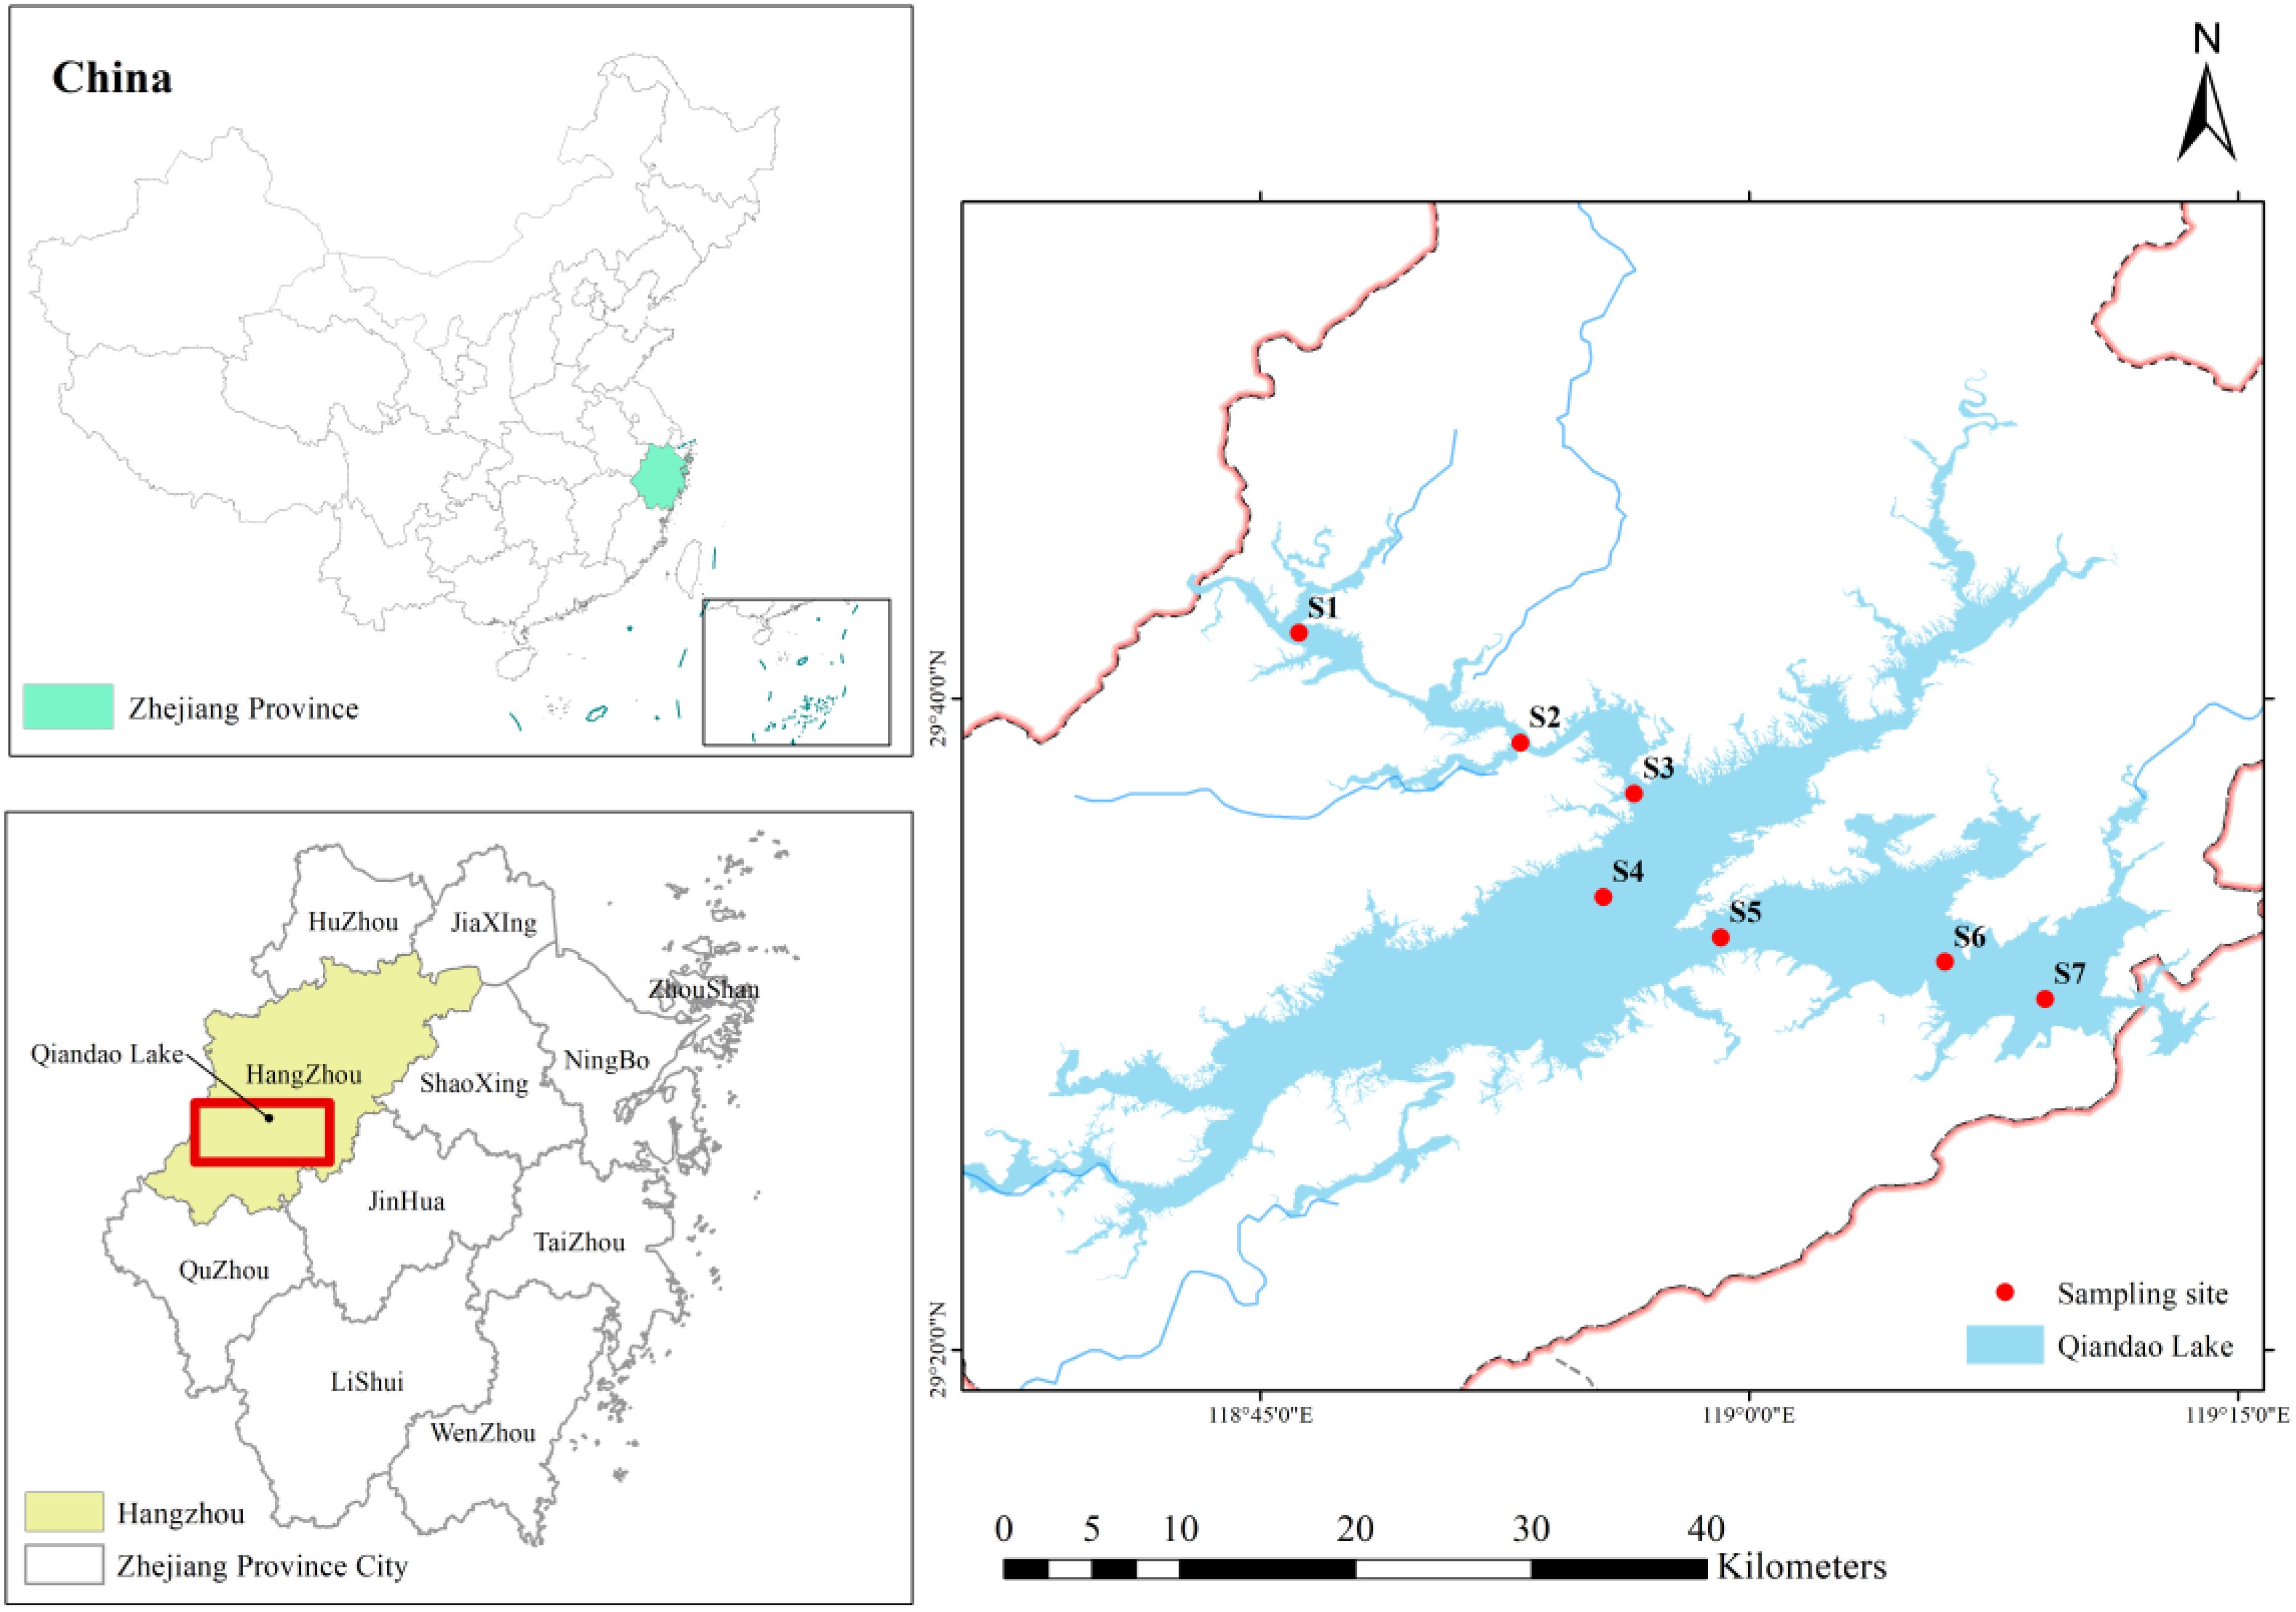
Figure 1. Geographical location of Qiandao Lake and distribution of sampling stations.
In this study, we compared the monitoring efficacy of the 18S rRNA V9 region and COI primers to identify the most suitable one for monitoring freshwater zooplankton in Qiandao Lake. Using the selected primers, we conducted a systematic comparison with the microscopy method. The main objectives of this study were: (i) to evaluate the applicability of the 18S rRNA and COI primers in monitoring freshwater zooplankton diversity; (ii) to compare the similarities and differences between eDNA and microscopy methods in zooplankton community composition and seasonal dynamics; and (iii) to investigate the differences in zooplankton responses to environmental variables between these two methods.
Qiandao Lake encompasses a basin area of 10,442 km2, with an average water depth of 30.44 m. The area features a typical subtropical monsoon climate, marked by hot and humid summers and cold and dry winters, exhibiting distinct seasonal variations (Li et al., 2021). The mean annual temperature is approximately 17°C, and the average annual precipitation is 1430 mm. The favorable hydrological and climatic conditions of Qiandao Lake foster a stable and diverse ecological environment, making it an ideal site for studying zooplankton diversity and its environmentally driven dynamics (Liu et al., 2023; Wang et al., 2023). Research indicates that over one hundred species of zooplankton inhabit Qiandao Lake (Lv et al., 2024). In this study, seven sampling stations, designated S1 to S7, were established from upstream to downstream along the flow path of Qiandao Lake.
The study was conducted in winter (December 2021), spring (March 2022), summer (June 2022), and autumn (September 2022). eDNA samples were collected from 2 L of water at depths of 0.5 m and 20 m, respectively. Morphological samples were collected concurrently with eDNA samples.
Before sampling, water harvesters, sterile plastic bottles, and filtration equipment were thoroughly disinfected with a 10% sodium hypochlorite solution. This was followed by multiple rinses with sterile water to remove any residual disinfectant. Two liters of water were collected from a depth of 0.5 m at sampling sites. After transporting the water samples to the onshore laboratory, they were filtered using a vacuum pump and a glass microfiber filtration device with a 0.45 µm mixed cellulose ester filter membrane. The water samples were filtered within 24 hours to collect eDNA samples. The same filtration procedure was applied to two liters of sterile water as a negative control in the field. All filtered eDNA membrane samples were stored in a -80°C freezer.
DNA extraction from filter membrane samples was conducted following the manufacturer’s instructions, utilizing the Fast DNA Spin Kit for Soil (MP Bio, USA). The concentration and quality of the extracted DNA were measured with a NanoDrop™ spectrophotometer (Thermo Fisher Scientific, USA) and further evaluated using 1.5% agarose gel electrophoresis. The extracted DNA was washed with TE buffer (10 mM Tris-HCl, 1.0 mM EDTA, pH 8.0) (Ghosal et al., 2018) and stored in a -80°C freezer for subsequent analysis.
For each DNA sample, PCR amplification was conducted using primers that target the 18S rRNA V9 region and COI, respectively. Primers 1380F (5′- CCCTGCCHTTTGTACACAC -3′) and 1510R (5′- CCTTCYGCAGGTTTCACCTAC -3′) were utilized to amplify a 130-bp region of the 18S rRNA V9 region (Amaral-Zettler et al., 2009). For COI, primers mlCOIintF (5′- GGWACWGGWTGAACWGTWTAYCCYCC -3′) and jgHCO2198 (5′- TAIACYTCIGGRTGICCRAARAAYCA -3′) were utilized to amplify a 313-bp region of the COI gene (Geller et al., 2013; Leray et al., 2013). Three PCR replicates were conducted for each sample to minimize PCR bias and enhance the reliability of the results. In laboratory, sterile water was used as a negative control. If the negative control exhibited an amplification band, the PCR products from that sample were excluded from further analysis. The PCR reaction mixture had a total volume of 20 μL, comprising 1 μL of template DNA, 0.8 μL of each forward and reverse primer (5 μM), 10 μL of Ultra HiFidelity PCR Kit II (Tiangen Bio), and ddH2O to achieve a final volume of 20 μL. The PCR protocol comprised an initial denaturation step at 95°C for 5 minutes, followed by 35 cycles consisting of denaturation at 95°C for 10 seconds, annealing at 60°C for 30 seconds, and extension at 72°C for 60 seconds. A final extension was performed at 72°C for 10 minutes.
PCR products were analyzed using 1% agarose gel electrophoresis to confirm the presence of distinct and well-defined bands. The PCR products were purified using the SanPrep Column DNA Gel Recovery Kit (Bioengineering Co., Ltd.). The purified products were quantified using the QuantiFluor™ -ST Blue Fluorescence Quantification System (Promega (Beijing) Biotech Co., Ltd.). Illumina libraries were subsequently constructed using the TruSeq™ DNA Sample Prep Kit and sequenced on an Illumina MiSeq PE300 platform with paired-end sequencing.
Raw sequence quality control was conducted using FASTP (Chen et al., 2018), which filters out bases with tail quality values below 20 and removes low-quality regions within a 10-bp window, while retaining high-quality data. After quality control, reads shorter than 50 bp and those containing N bases were eliminated. Paired-end sequences were then merged using the FLASH program, which assembled contiguous sequences by overlapping, with a minimum overlap length of 10 bp and a maximum mismatch rate of 0.2. Samples were differentiated according to the barcodes and primers at the ends of the sequences, with the orientation of the sequences adjusted accordingly.
Sequences were grouped into Operational Taxonomic Units (OTUs) exhibiting ≥99% similarity using USEARCH v7.1 software, applying an E-value threshold of 10-5. For species classification of OTU representative sequences, the RDP classifier Bayesian algorithm (Bokulich et al., 2018) was employed, with the NCBI nucleotide sequence (NT) database serving as the reference.
Based on the primer comparison results (Results 3.1), the appropriate primer sets were selected. DNA extraction, PCR amplification, high-throughput sequencing, and bioinformatics analysis were performed in accordance with the protocols described above.
A plankton net with mesh sizes of 0.112 mm and 0.064 mm was utilized to qualitatively sample Crustaceans (Cladocera and Copepoda) and Rotifers, respectively. The nets were towed in an ‘∞’ shape with the opening facing upwards for 3 to 5 minutes to collect a 50 mL water sample from the surface of the water body. The samples were subsequently fixed in a 4% formaldehyde solution and allowed to stand for 24 hours for qualitative analysis (Chiang and Du, 1979).
For the quantitative analysis of crustaceans, 10 L water samples were collected from depths of 0.5 m and 20 m. The samples were filtered through a 0.112 mm mesh net and then transferred into 50 mL volumetric flasks with the addition of a 4% formaldehyde solution. Crustacean zooplankton were completely enumerated under a light microscope at 100× magnification, and their biomass was estimated using a regression equation (Wang et al., 2024; Zhang and Huang, 1991). For the quantitative analysis of rotifers, 1 L of water was directly collected from the same depth, and 15 mL of a 1% Lugol solution was added to fix the sample. The samples were allowed to stand in a separating funnel for 48 hours before being concentrated to 30 mL via siphoning. Subsequently, 1 mL of the concentrated solution was transferred to a counting chamber and analyzed in complete slices under a light microscope at 200× magnification. Three replicates were performed, and the mean value was calculated. Rotifer biomass was estimated via the volumetric method (Zhang and Huang, 1991). Detailed taxonomic identification of each specimen was performed utilizing relevant specialized literature to achieve species-level identification (Jiang and Du, 1979; Wang, 1978; Zhang and Huang, 1991).
Water temperature (WT, °C), pH, dissolved oxygen (DO, mg/L), oxidation-reduction potential (ORP, mV), nephelometric turbidity unit (NTU), and total dissolved solids (TDS, mg/L) were measured in situ utilizing a YSI ProDSS multiparameter water quality analyzer (USA). Water clarity (SD, m) was assessed utilizing a black and white Secchi disk, while water depth (WD, m) was determined using a sonar bathymeter (SM-5A, USA). The water quality parameters assessed included total nitrogen (TN, mg/L), total phosphorus (TP, mg/L), ammonia nitrogen (NH3-N, mg/L), nitrate (NO3−, mg/L), nitrite (NO2−, mg/L), phosphate (PO43−, mg/L), and the potassium permanganate index (CODMn, mg/L), all of which were measured using spectrophotometry and completed within 24 hours (EPA, 2002).
OTU sparsity curves (R package: ‘vegan’) and Venn diagrams (R package: ‘Venn Diagram’) were generated to compare the performance of the 18S and COI primers in monitoring zooplankton diversity. Welch’s t-tests were conducted using STAMP v2.1.3 to identify genera with significant differences between the results obtained from both primers. Data from the different primers were analyzed using Principal Component Analysis (PCA) to explore their variances and relationships, with significance assessed through Permutational Multivariate Analysis of Variance (PERMANOVA). Paired t-tests were conducted on diversity indices, including Sobs, Shannon (Shannon, 1948), and Pielou (Pielou, 1966) indices, to assess the monitoring capacity of both primers.
Both eDNA and microscopy methods were employed to identify the dominant species through the calculation of species dominance. The species dominance (Y) was calculated using the following formula:
In the formula, represents the number of reads or individuals of a given species in the sample, denotes the total number of reads or individuals of all species present in the sample, and indicates the frequency of occurrence of that species.
The zooplankton data obtained from both eDNA and microscopy methods were initially transformed using Log(x+1) to mitigate bias arising from skewed distributions, followed by Hellinger normalization to scale and enhance the comparability of the data. The beta diversity distance matrix was calculated using QIIME (Dixon, 2003), and the differences in zooplankton community composition detected by eDNA and microscopy methods were compared through Non-Metric Multidimensional Scaling (NMDS). The significance of community differences between the two methods was assessed using PERMANOVA (Anderson, 2017). Further significance assessments were conducted through Analysis of Similarities (ANOSIM) and Multi-Response Permutation Procedures (MRPP). Divergent genera contributing to community differences between eDNA and microscopy methods were identified using Similarity Percentage Analysis (SIMPER) (Clarke and Warwick, 1994).
The Random Forest model was employed to identify genera that significantly contributed to seasonal variation, and their abundances was subsequently calculated. To reflect the interactions among zooplankton communities, Spearman rank correlation coefficients between nodes were calculated, and correlation network diagrams were constructed to illustrate the relationships among various genera. Taxa with correlation coefficients |ρ| > 0.5 and significant (p< 0.05) interspecific correlations were screened and visualized using Cytoscape software (Shannon et al., 2003). A collinearity analysis of environmental factors was conducted, excluding variables with a Variance Inflation Factor (VIF) exceeding 10 (Neter et al., 1996). The relationships between zooplankton communities and environmental factors across seasons were investigated using redundancy analysis (RDA) (R package: ′vegan′) (Oksanen et al., 2013), and the environmental factors significantly affecting zooplankton community composition were identified through a permutation test with 999 permutations.
To compare eDNA reads with zooplankton abundance and biomass as measured by microscopy, linear regression analyses were performed on the genera common to both methods.
Through bioinformatic filtering and quality control, a total of 456,356 sequence reads were obtained using the 18S primer, and 345,956 sequence reads were obtained using the COI primer. After filtering and annotating with database matches, the average number of sequence reads per sample was 15,831 for the 18S primer and 20,860 for the COI primer. Dilution curves demonstrated that the number of zooplankton OTUs based on the 18S primer was lower than that of the COI primer (Supplementary Figure S1). The COI primer identified more taxa at each taxonomic level than the 18S primer (Figure 2A; Supplementary Table S1). Rotifers were identified as the most species-rich zooplankton group by both primer markers (Figure 2B). The dominant taxa identified by both primers included Pseudodiaptomidae at the family level and Pseudodiaptomus at the genus level. However, the dominant species identified by the two primers differed, with Pseudodiaptomus inopinus identified by the 18S primer and Pseudodiaptomus forbesi identified by the COI primer (Figure 2C).
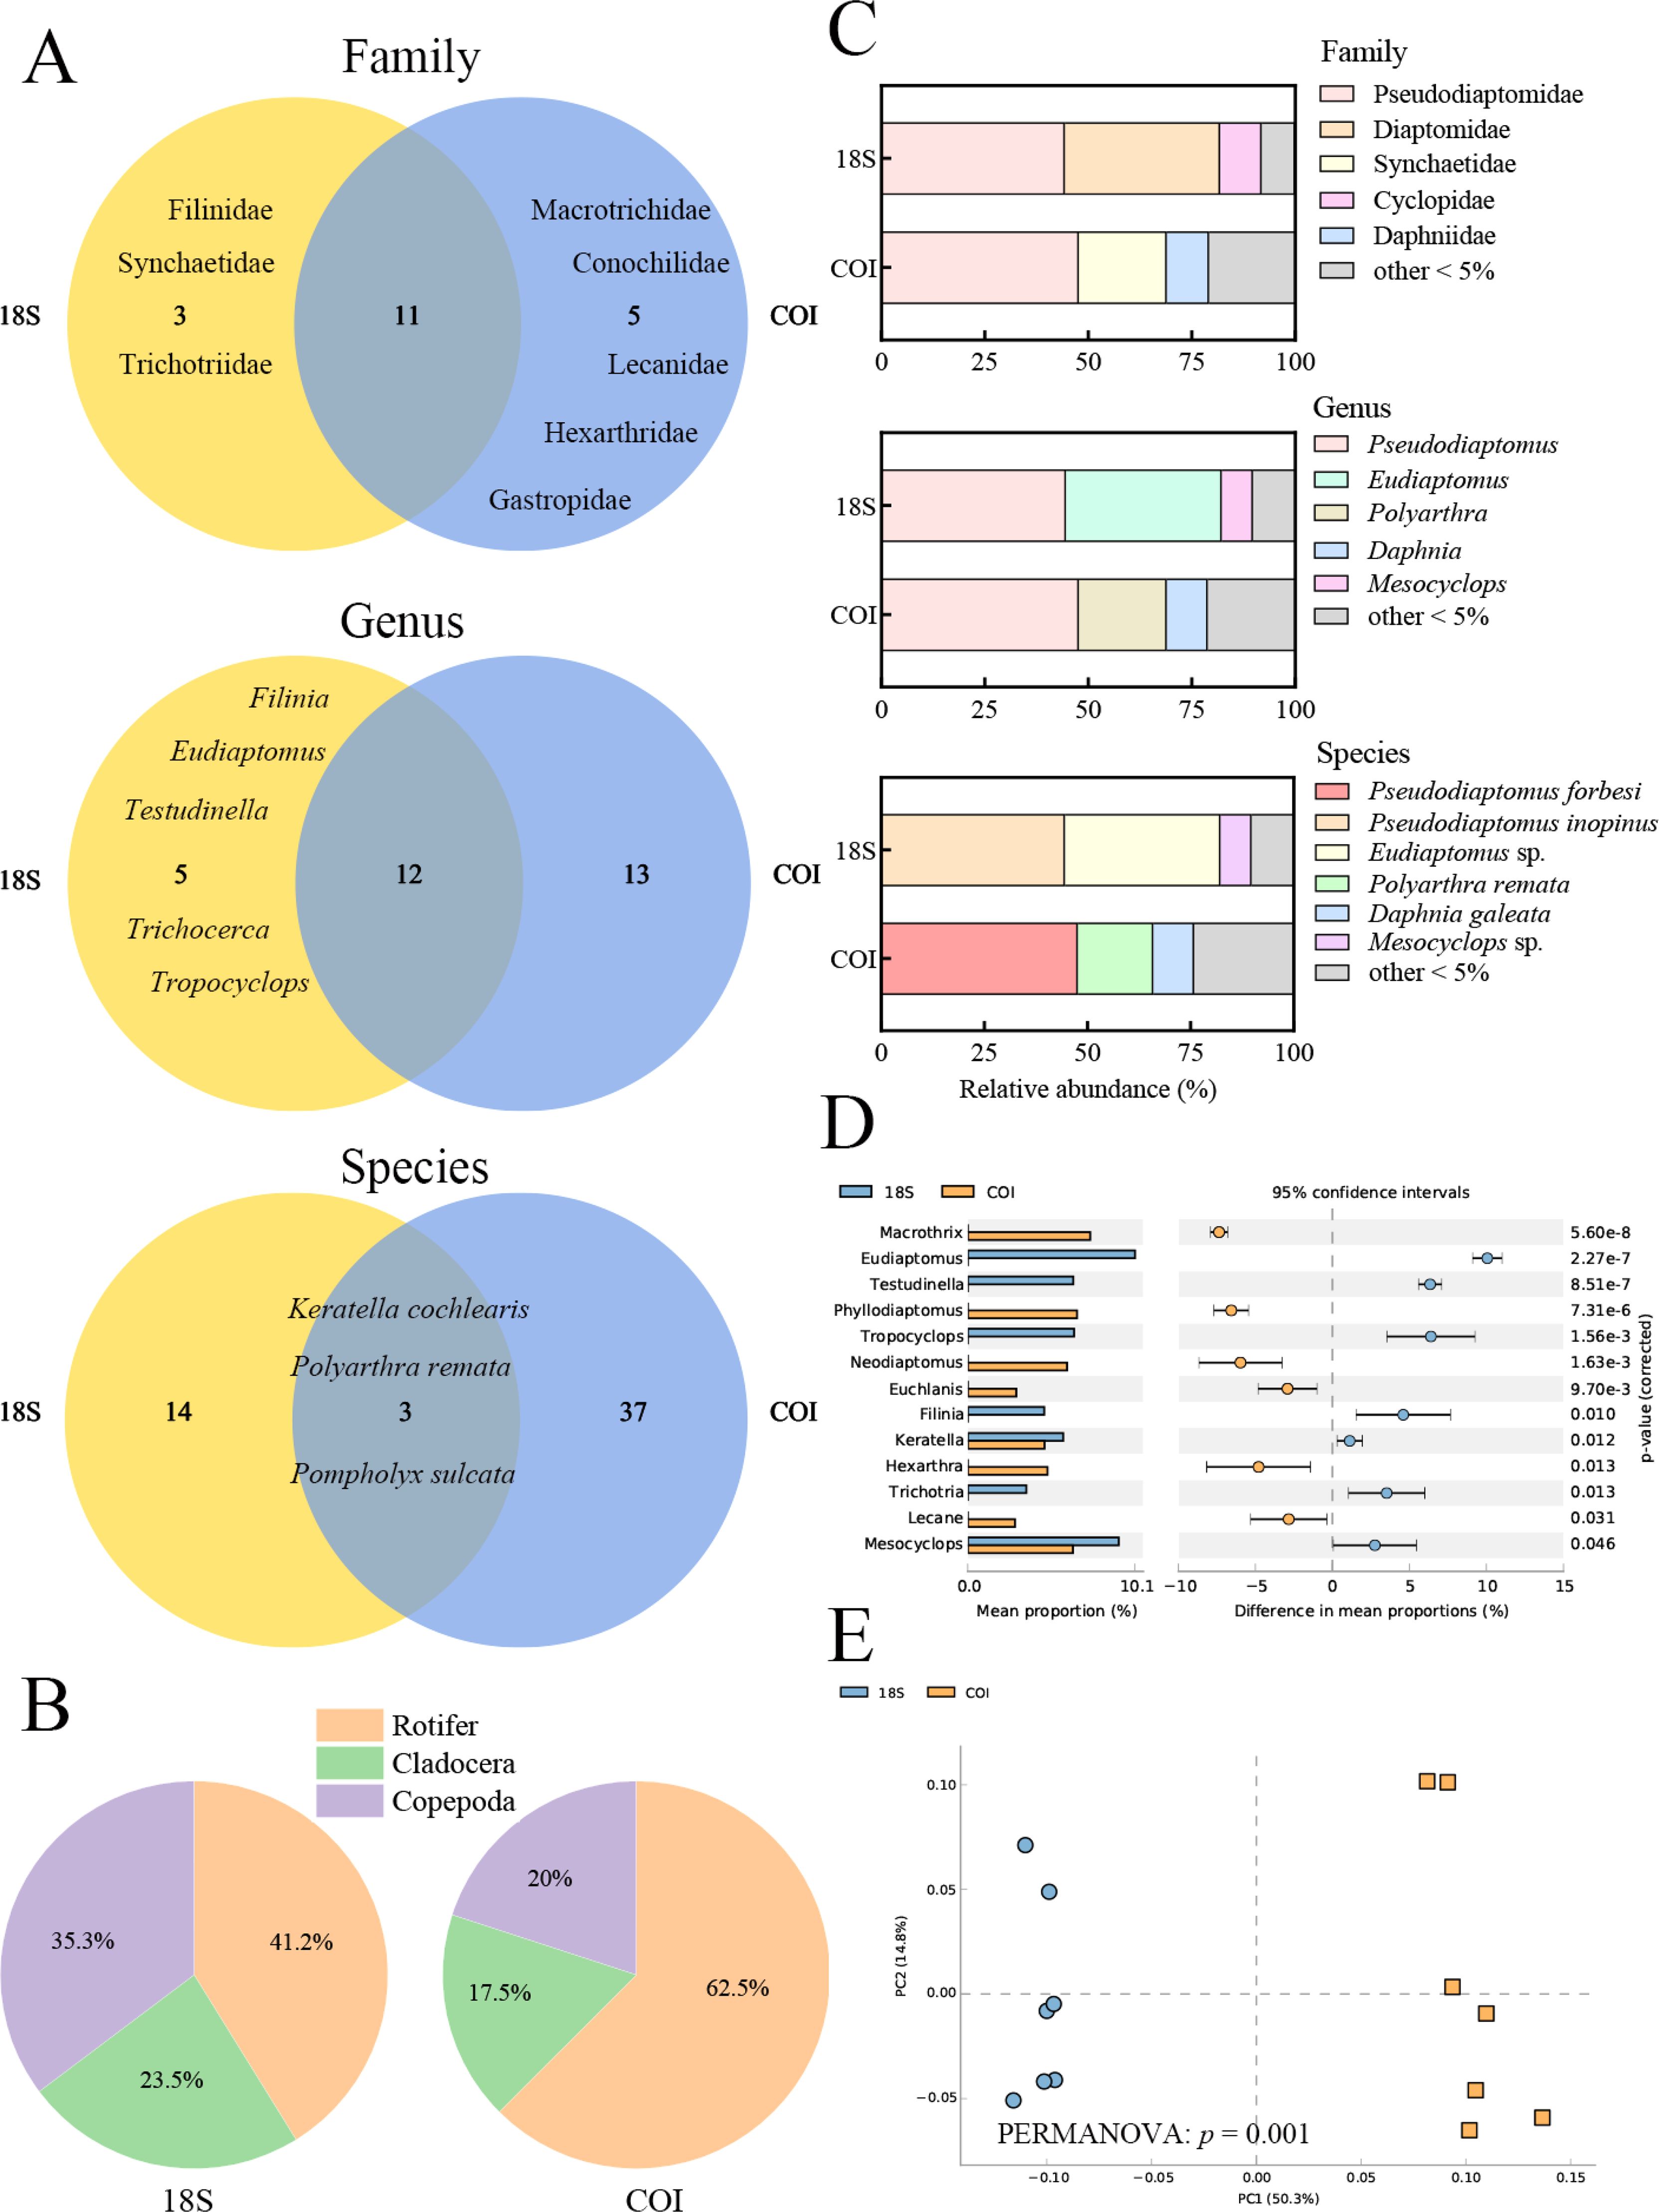
Figure 2. Zooplankton community composition identified using 18S and COI Primers. (A) Venn diagram illustrating the number of families, genera, and species at different taxonomic levels. (B) Pie chart depicting species composition, categorized into Rotifer, Cladocera, and Copepoda. (C) The relative composition of the two primer sets at the family, genus, and species levels. (D) STAMP analysis comparing the mean proportions of genera between the two primers. P-values on the right y-axis were derived from Welch’s t-test to assess statistical significance. (E) PCA analysis reveals the community distribution of the two primer sets. Circles represent 18S-primed samples, and squares represent COI-primed samples.
Significant differences in abundance were detected among 13 genera when comparing the two primers. PCA and PERMANOVA analyses revealed significant differences in the zooplankton communities identified by the two primers (p< 0.05) (Figures 2D, E). Additionally, the results of paired t-tests indicated that the Sobs, Shannon diversity index, and Pielou evenness index of the COI primer dataset were significantly higher than those of the 18S primer dataset (Supplementary Figure S2). In summary, the COI primer (mlCOIintF/jgHCO2198) was more suitable for assessing freshwater zooplankton diversity in Qiandao Lake.
A total of 3,163,031 validly spliced sequence reads were obtained from eDNA through high-throughput sequencing. Following taxonomic refinement, 267 distinct OTUs were identified. These OTUs were classified into 26 families, 41 genera, and 102 species. The microscopy method identified 21 families, 56 genera, and 111 species (Supplementary Table S1). The species accumulation curves indicated that the number of species detectable by both methods approached saturation (Supplementary Figure S3). The eDNA and microscopy methods together identified 20 shared families, 29 shared genera, and 19 shared species (Figure 3A). Among these, 6 families (e.g., Adinetidae, Filinidae) and 12 genera (e.g., Pseudodiaptomus, Macrothrix) were identified exclusively by the eDNA method. One family (Notommatidae) and 27 genera (e.g., Schmackeria, Mesocyclops) were identified exclusively by the microscopy method.
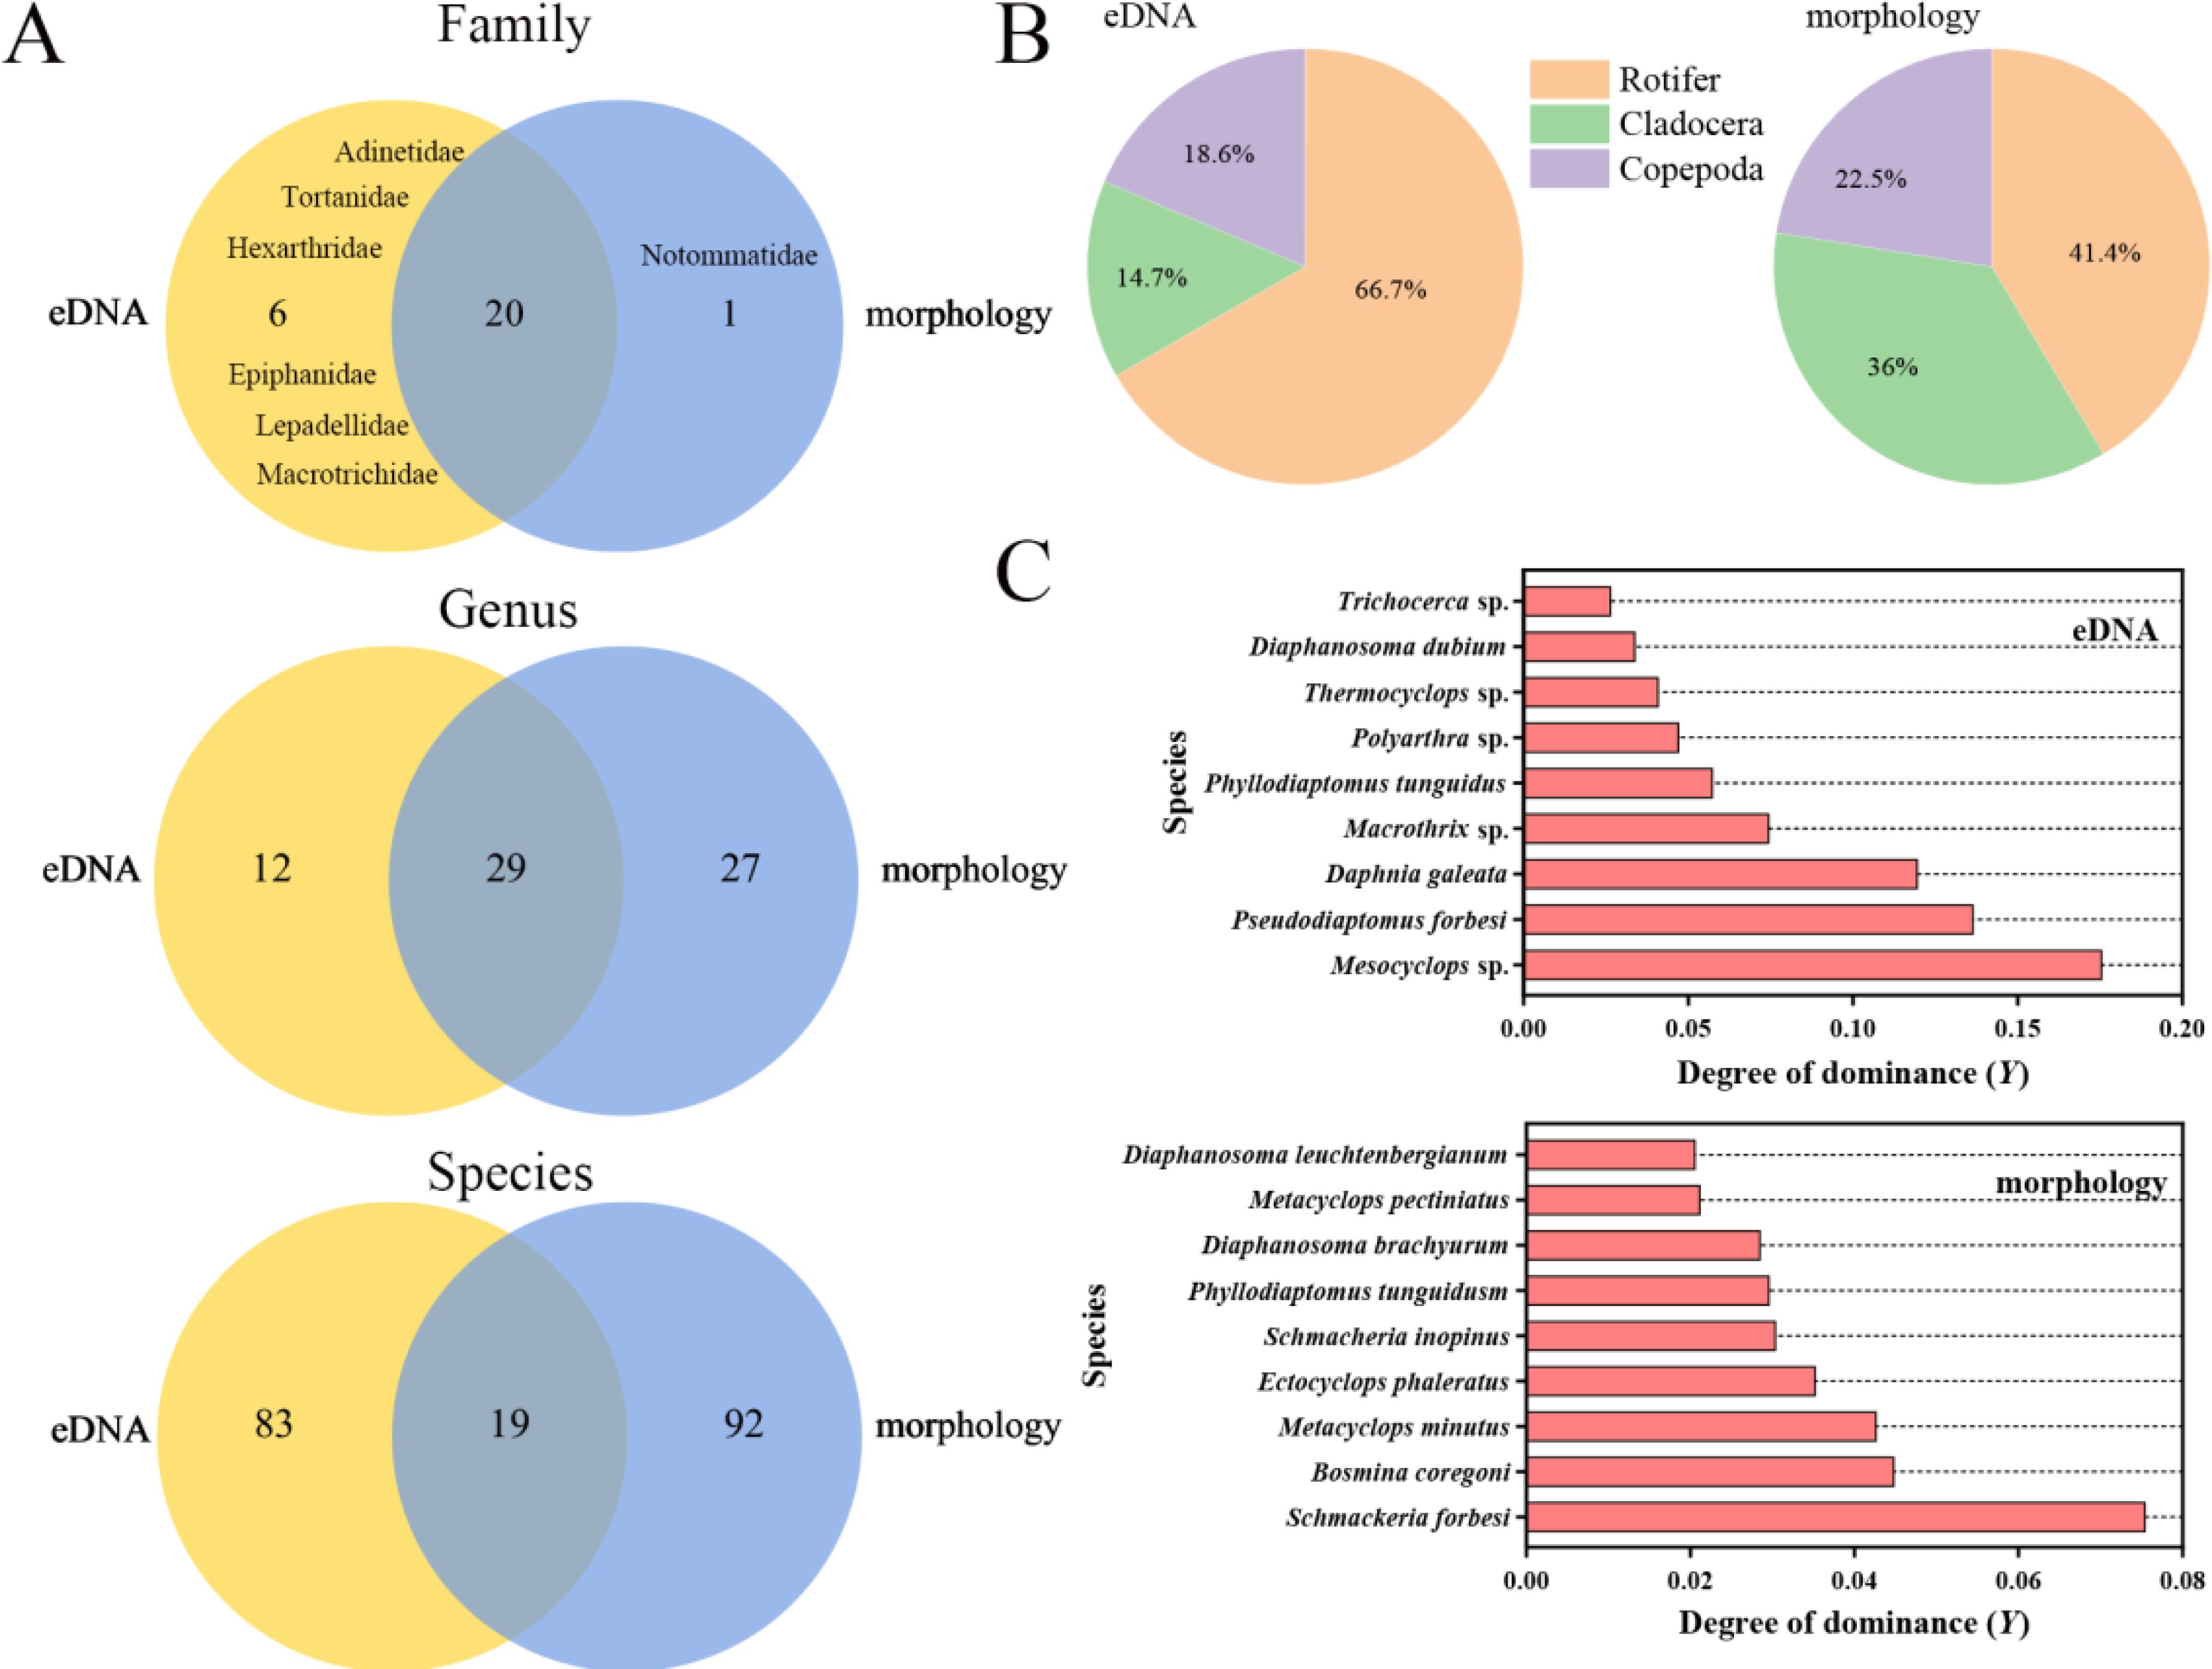
Figure 3. Zooplankton composition identified by eDNA and microscopy methods. (A) The Venn diagram illustrates the differences in the number of taxonomic ranks detected by the two methods, including family, genus, and species. The overlapping area represents the number of shared species identified by both methods, while the numbers on either side indicate the unique species detected by each method. (B) The percentage of species detected in the three taxonomic groups (Rotifer, Cladocera, and Copepoda) by the two methods. (C) Major dominant zooplankton species (Y > 0.02) detected by the two methods.
Both the eDNA and microscopy methods indicated that rotifers were the most species-rich taxon among zooplankton in Qiandao Lake (Figure 3B). Based on the degree of dominance (Y > 0.02), the dominant taxa were primarily crustaceans, though the specific dominant species varied (Figure 3C). The eDNA method identified the three major dominant species as Mesocyclops sp. (Y = 0.176), Pseudodiaptomus forbesi (Y = 0.137), and Daphnia galeata (Y = 0.120). In contrast, the three major dominant species identified by the microscopy method included Schmackeria forbesi (Y = 0.076), Bosmina coregoni (Y = 0.045), and Metacyclops minutus (Y = 0.043). Additionally, Phyllodiaptomus tunguidus was the only dominant species shared by eDNA and microscopy methods.
STAMP analysis of eDNA reads and microscopy-based abundance revealed significant differences among 31 zooplankton genera (p< 0.05). Among these, the genus Thermocyclops exhibited a higher mean proportion in both methods (Figure 4). NMDS analysis and nonparametric multivariate statistical tests indicated clear separation and significant differences between the communities from both methods (p< 0.05) (Figure 5). The primary divergent genera responsible for community differences were Keratella, Trichocerca, and Polyarthra, contributing 7.61%, 7.22%, and 7.11%, respectively (Table 1). Similarly, STAMP analysis of eDNA reads and microscopy-derived biomass revealed 36 genera with significant differences (p< 0.05), with the genus Sinodiaptomus exhibiting the highest proportion among those identified by the microscopy method (Figure 4). NMDS analysis and nonparametric multivariate statistical tests also indicated significant community differences between the two methods (p< 0.05) (Figure 5). The primary divergent genera responsible for community differences were similar to those identified through microscopy-based abundance (Table 1).
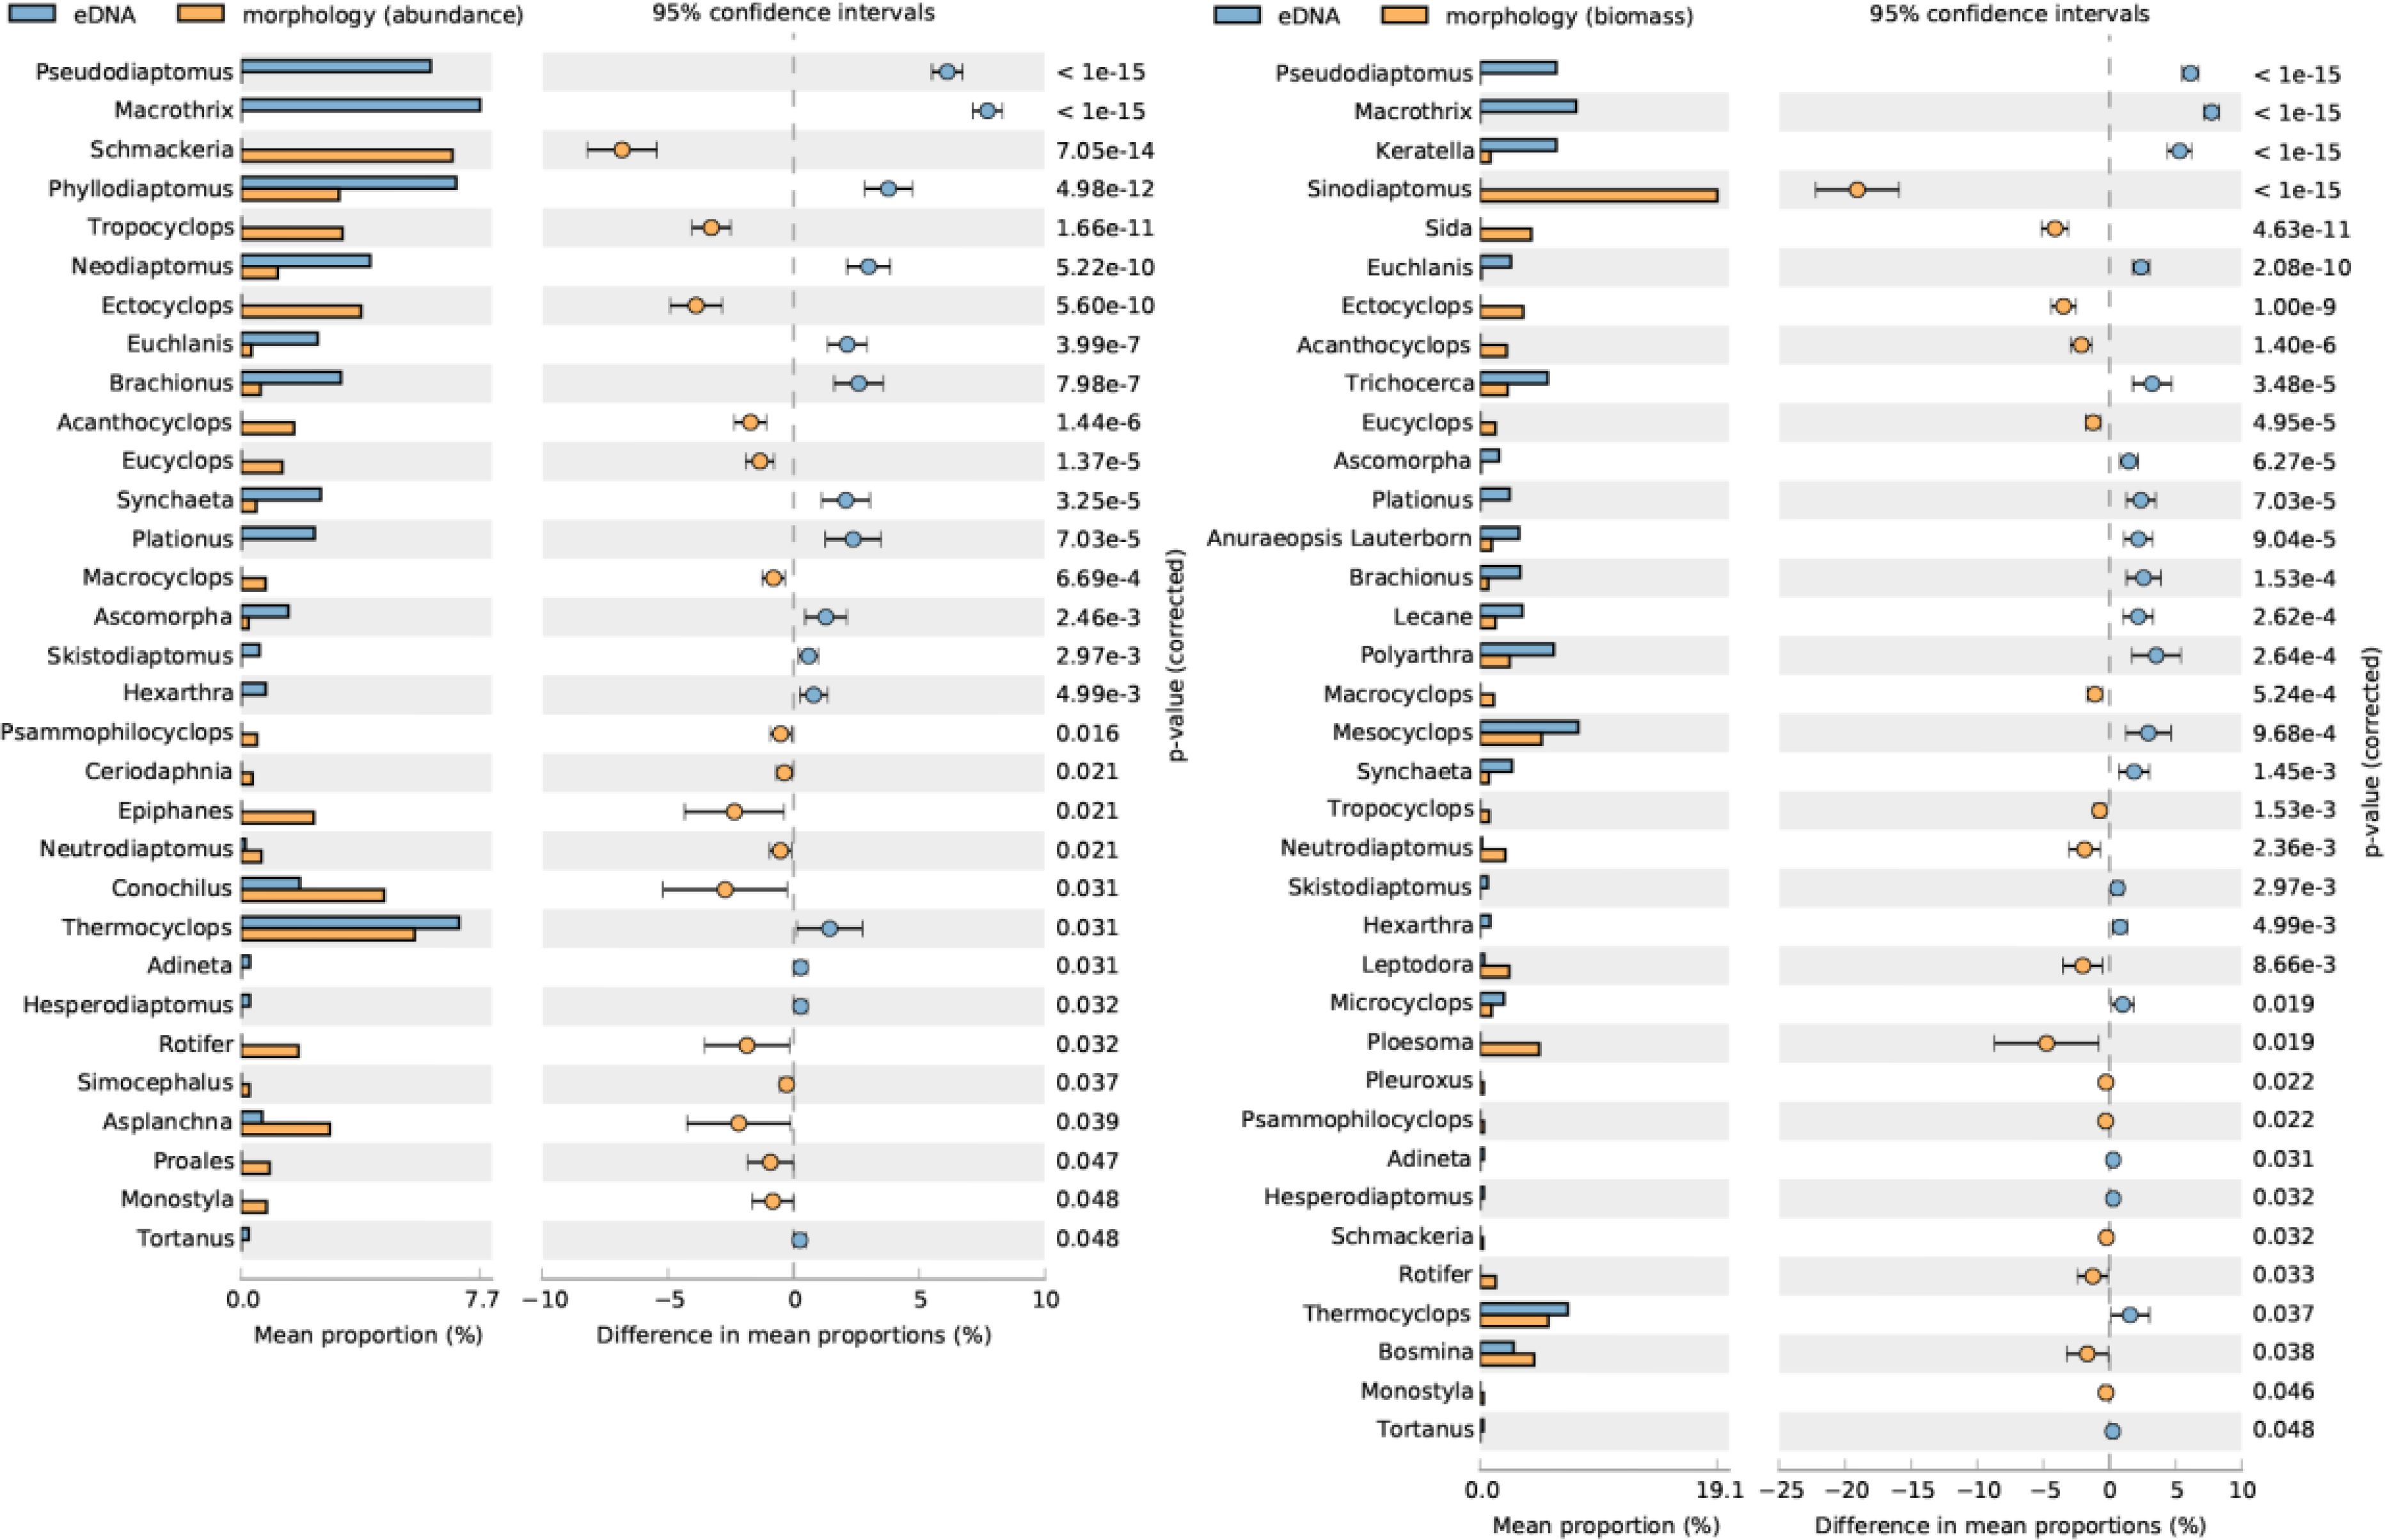
Figure 4. STAMP analysis comparing the mean proportions of genera between eDNA and microscopy abundance and biomass. P-values on the right y-axis were derived from Welch’s t-test to assess statistical significance.
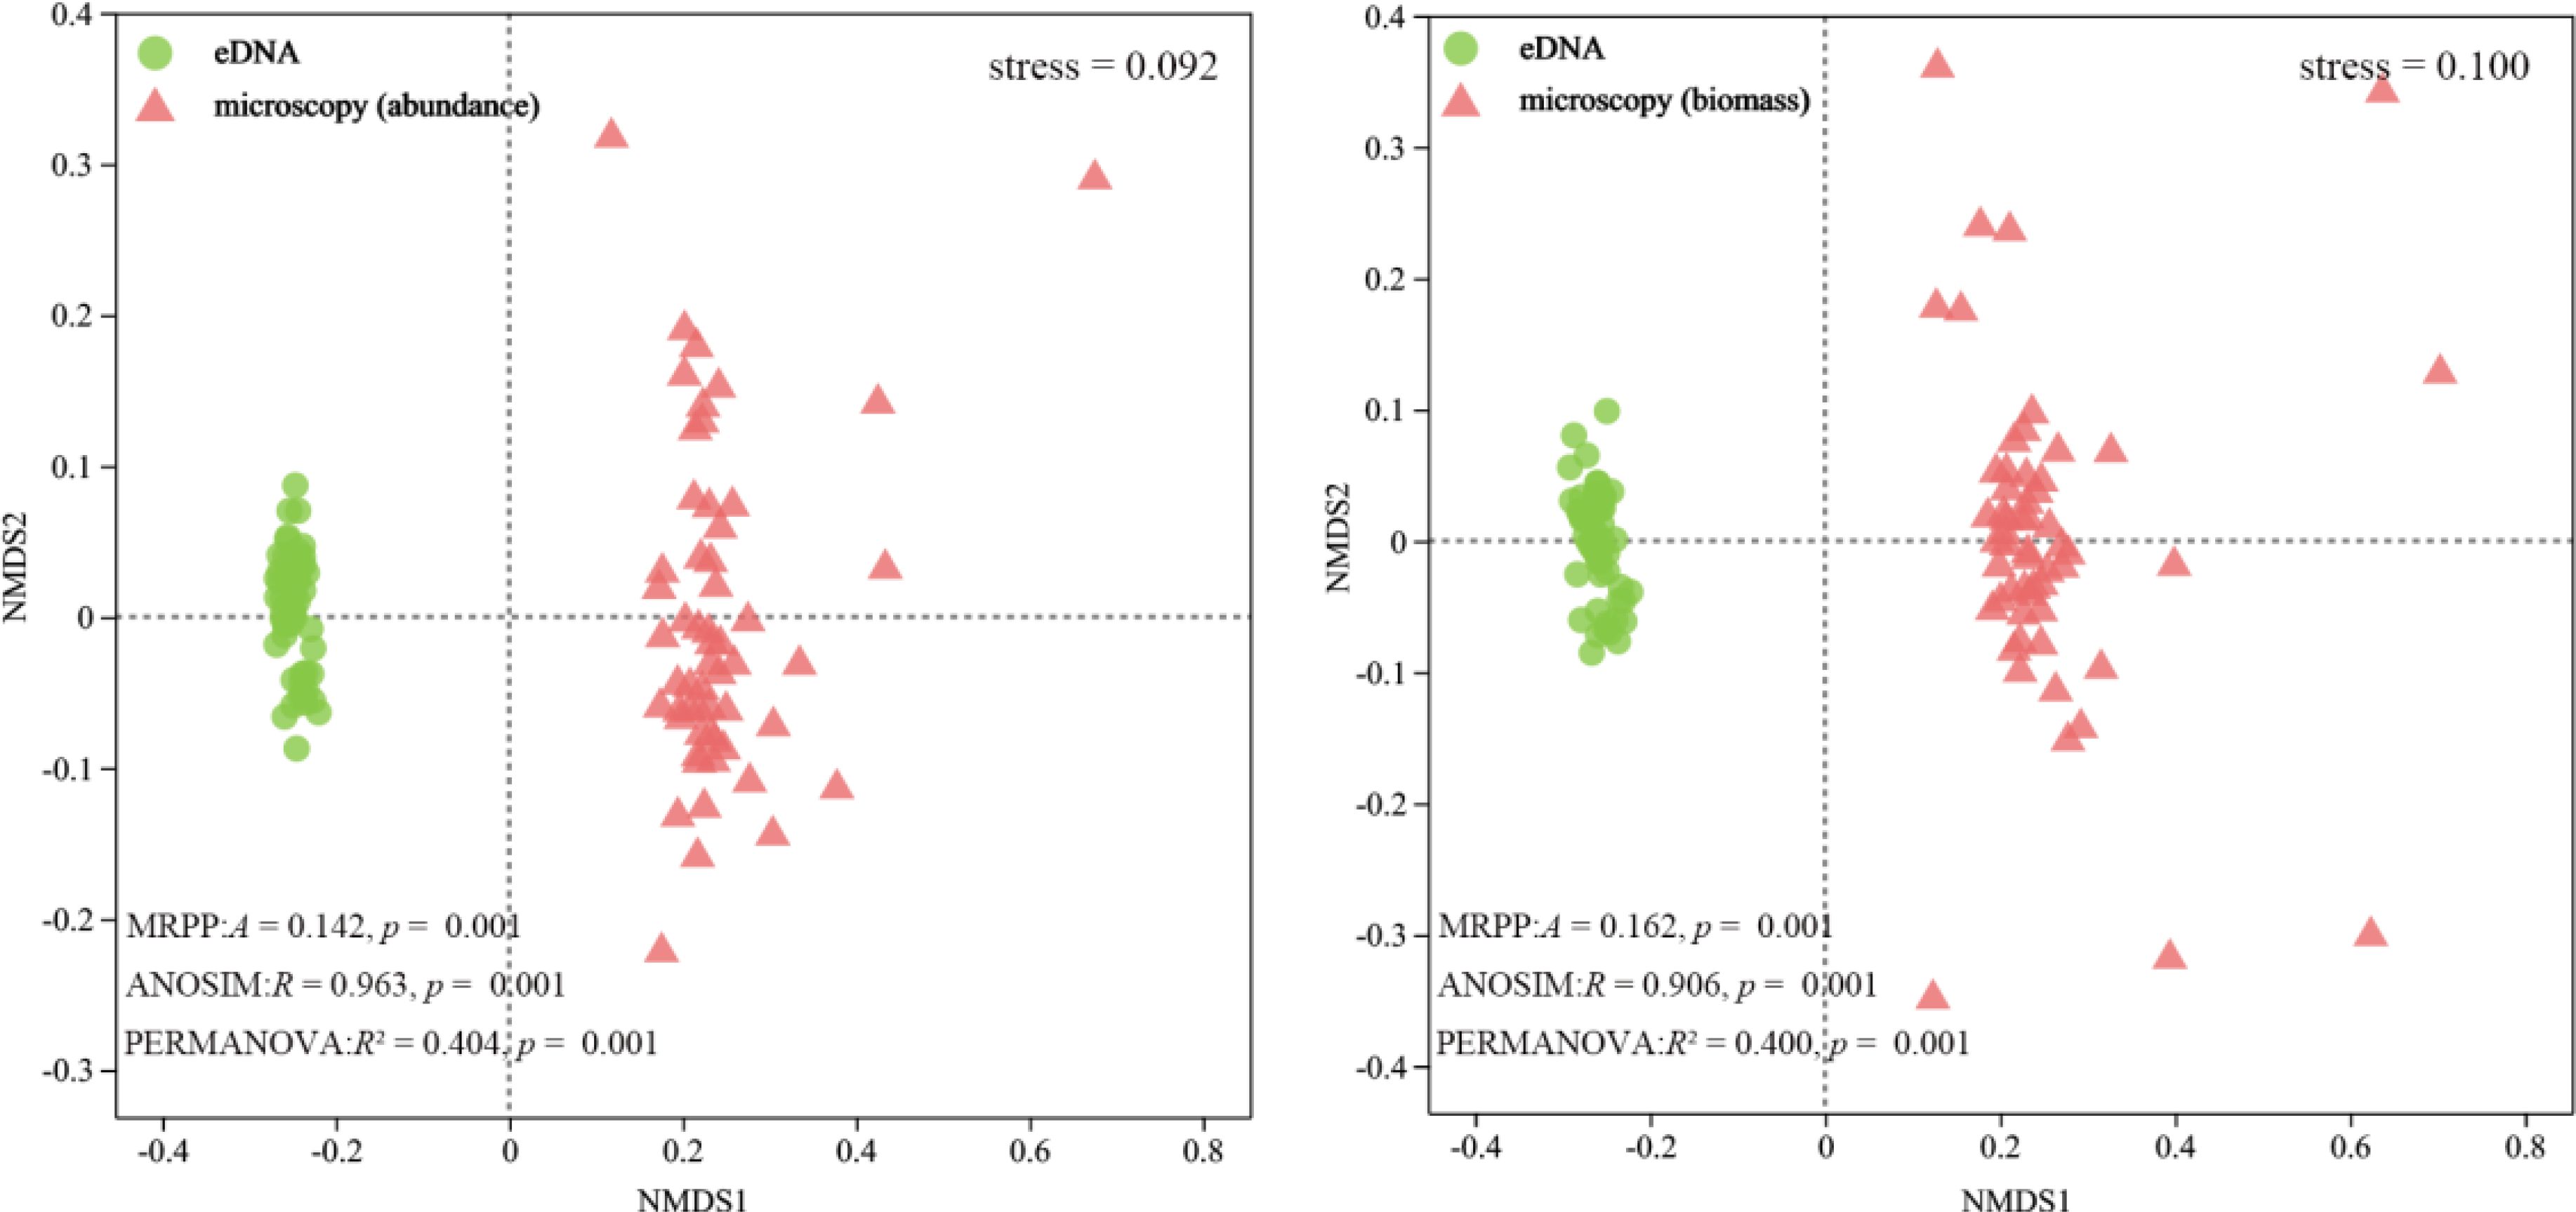
Figure 5. NMDS analysis based on the Bray-Curtis distance index revealed the community patterns of zooplankton species abundance and biomass under both eDNA and microscopy methods, with circles representing eDNA samples and triangles representing microscopy samples.
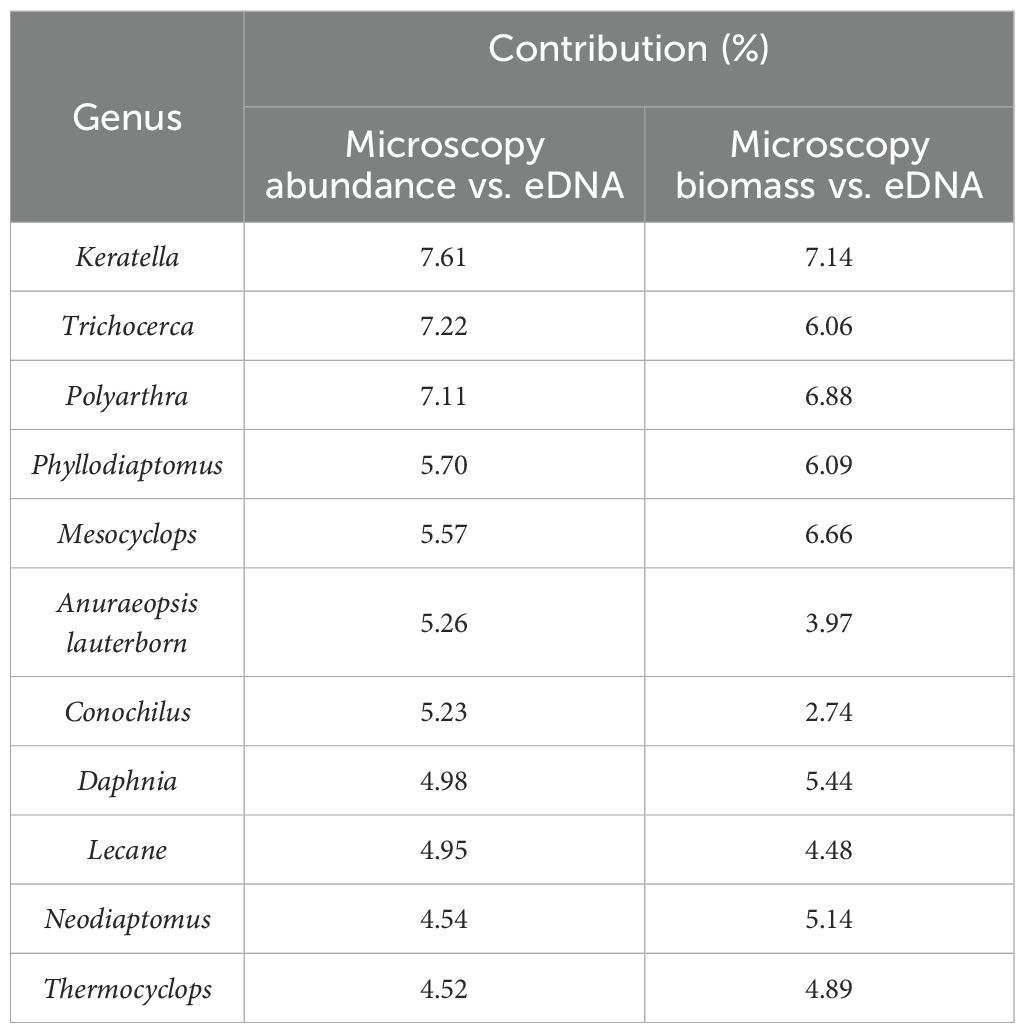
Table 1. The major divergent taxa contributing to intergroup differences were identified using both eDNA and microscopy methods, with their contributions being quantified accordingly.
NMDS analysis and nonparametric multivariate statistical tests revealed significant seasonal differences in zooplankton communities detected using eDNA and microscopy methods (Figure 6A). PERMANOVA tests revealed lower community differences in summer and autumn when compared with other seasons (Figure 6B). Using the random forest model, 30 genera were identified as significantly influencing the seasonal variation of zooplankton communities in both eDNA and microscopy methods. Among them, 13 genera were shared by the two methods. In the eDNA method, rotifers were the primary taxa driving seasonal variations, followed by copepods (Figure 7A). Daphnia exhibited higher abundance across all seasons, while Polyarthra (17.10%) and Trichocerca (15.85%) demonstrated the highest relative abundance in summer. Mesocyclops accounted for 24.57% in spring and 26.35% in autumn, whereas Pseudodiaptomus (32.59%) was dominant in winter. In the microscopy method, copepods and rotifers were the primary taxa influencing seasonal variation. Trichocerca exhibited the highest abundance in summer (50.46%) and autumn (26.96%), whereas Polyarthra dominated in spring (10.40%), and Keratella was most abundant in winter (20.85%) (Figure 7B).
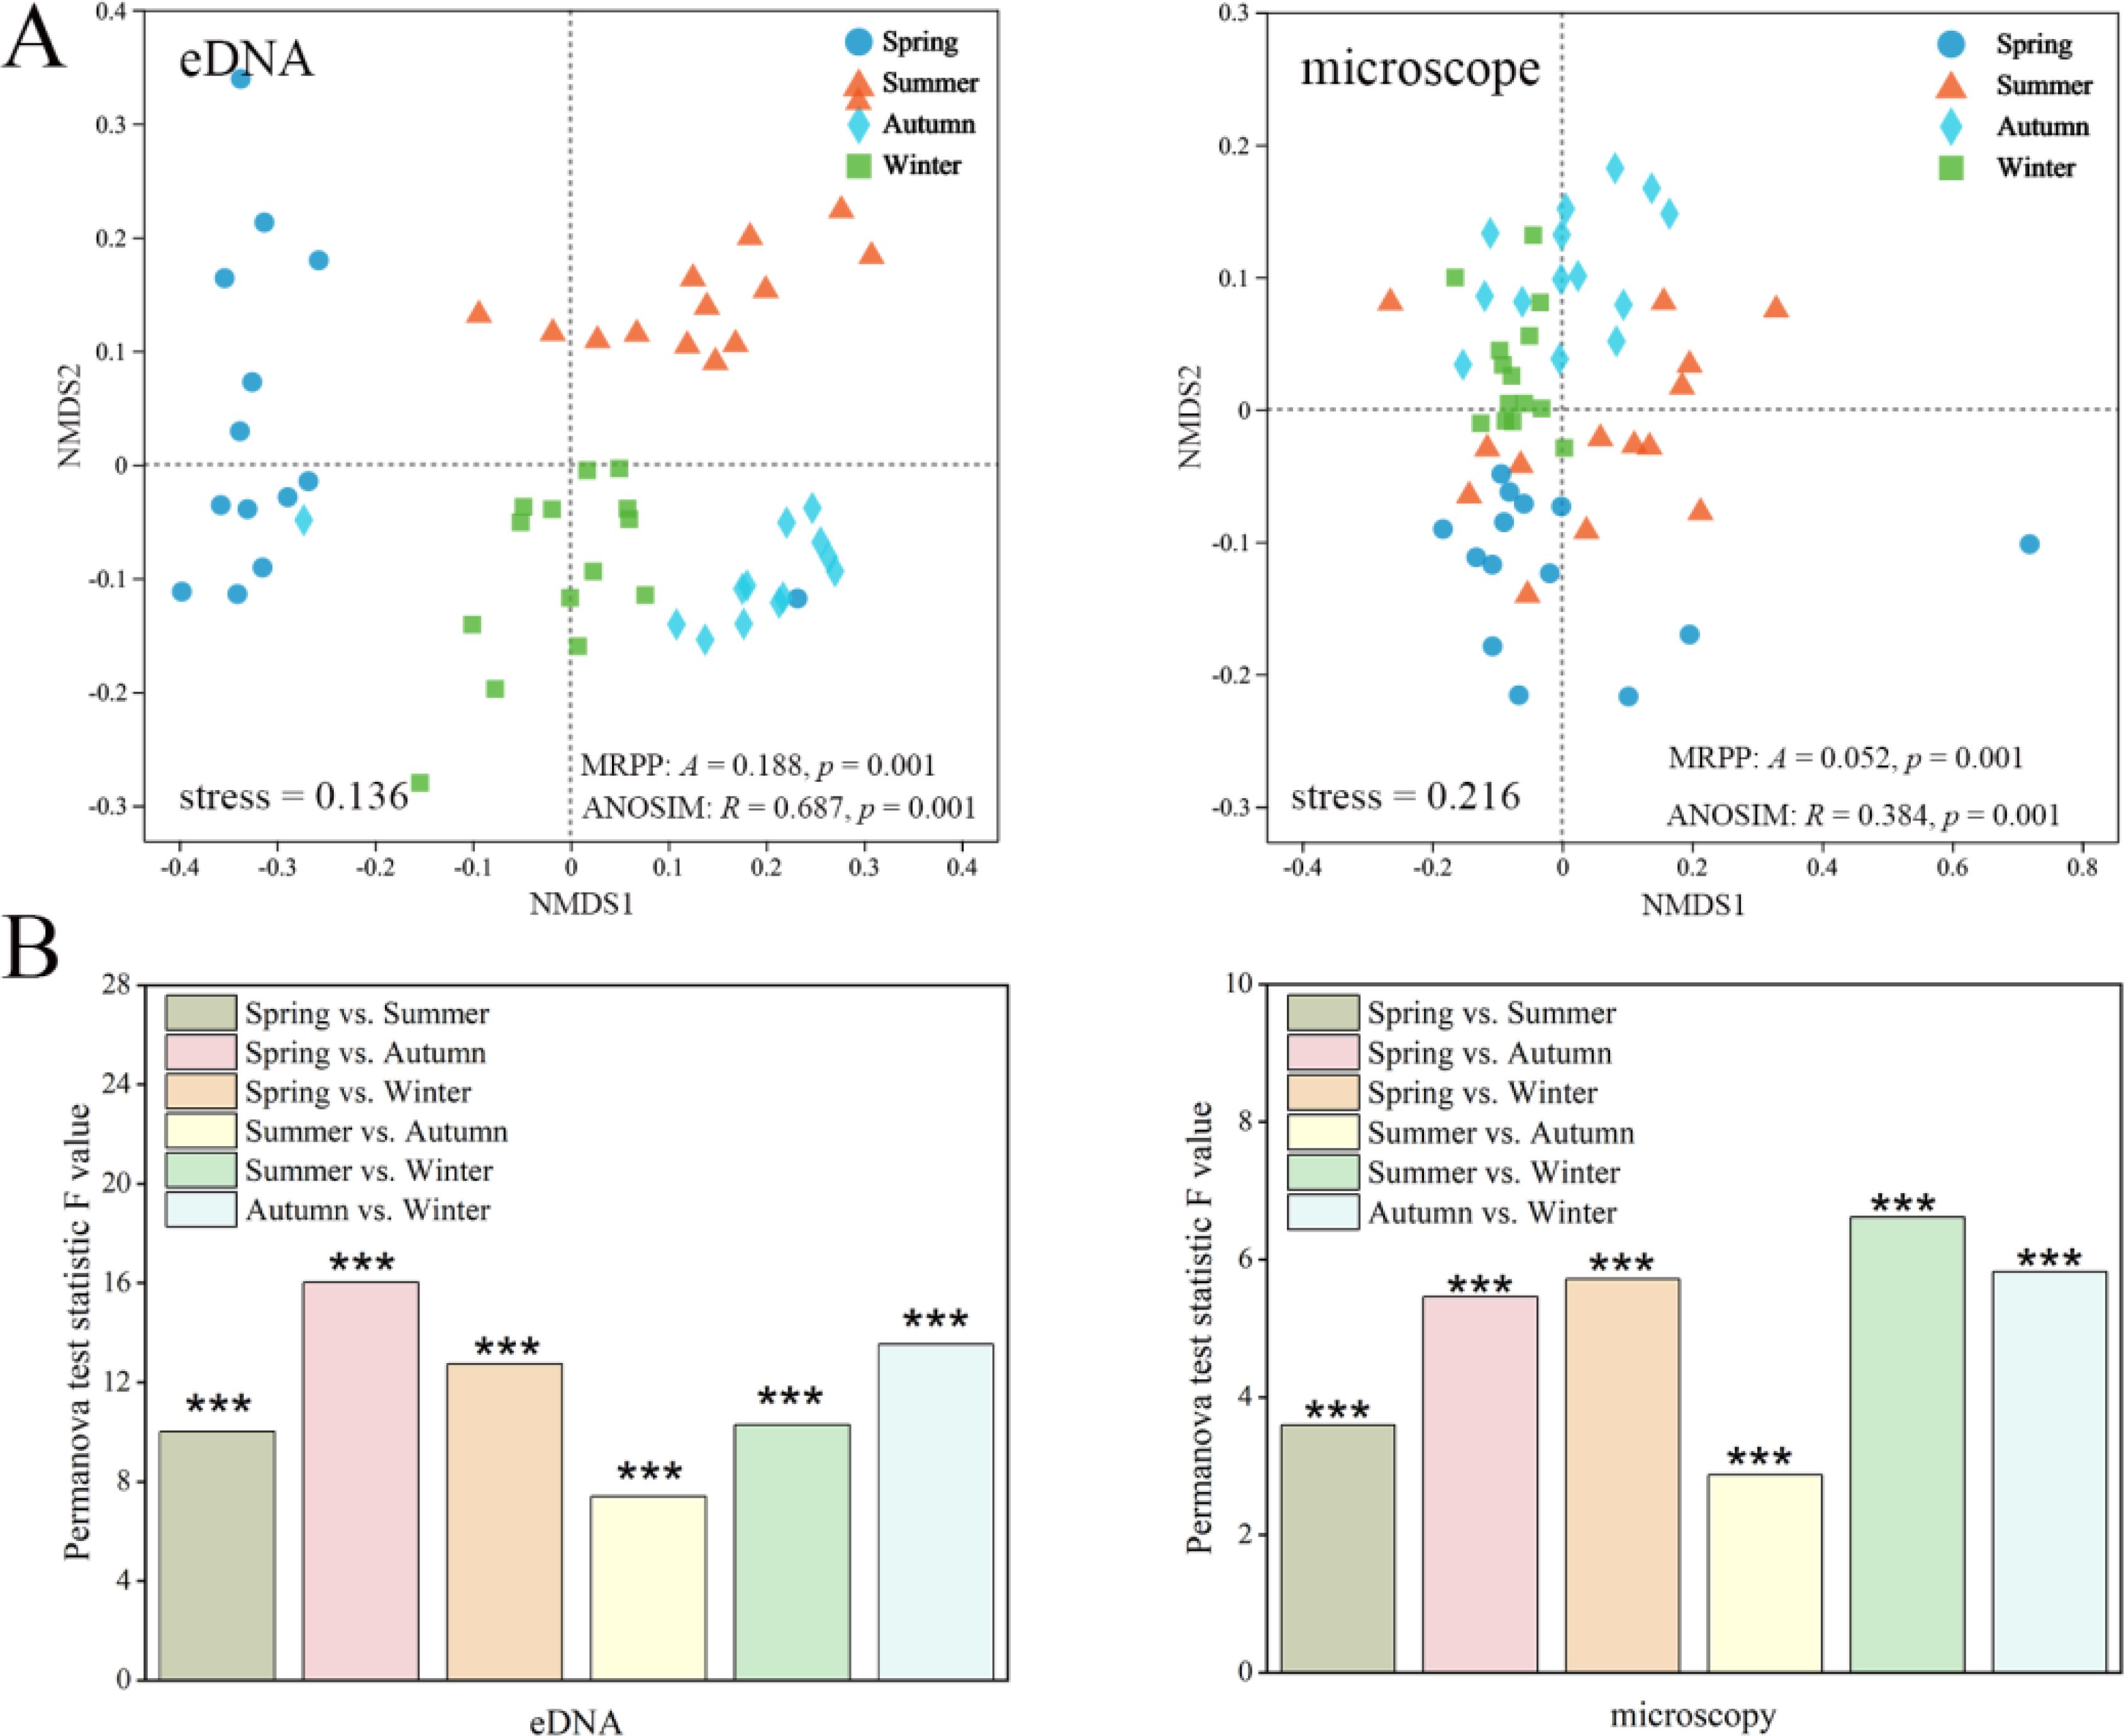
Figure 6. (A) NMDS analysis based on the Bray-Curtis distance index revealed distinct seasonal patterns in zooplankton communities derived from eDNA and microscopy abundance data, with different shapes representing samples from various seasons. (B) The results of the PERMANOVA test assessing zooplankton community differences across seasons are reported, with F-values indicating the extent of variation among groups. '***' denotes a highly significant difference between groups.
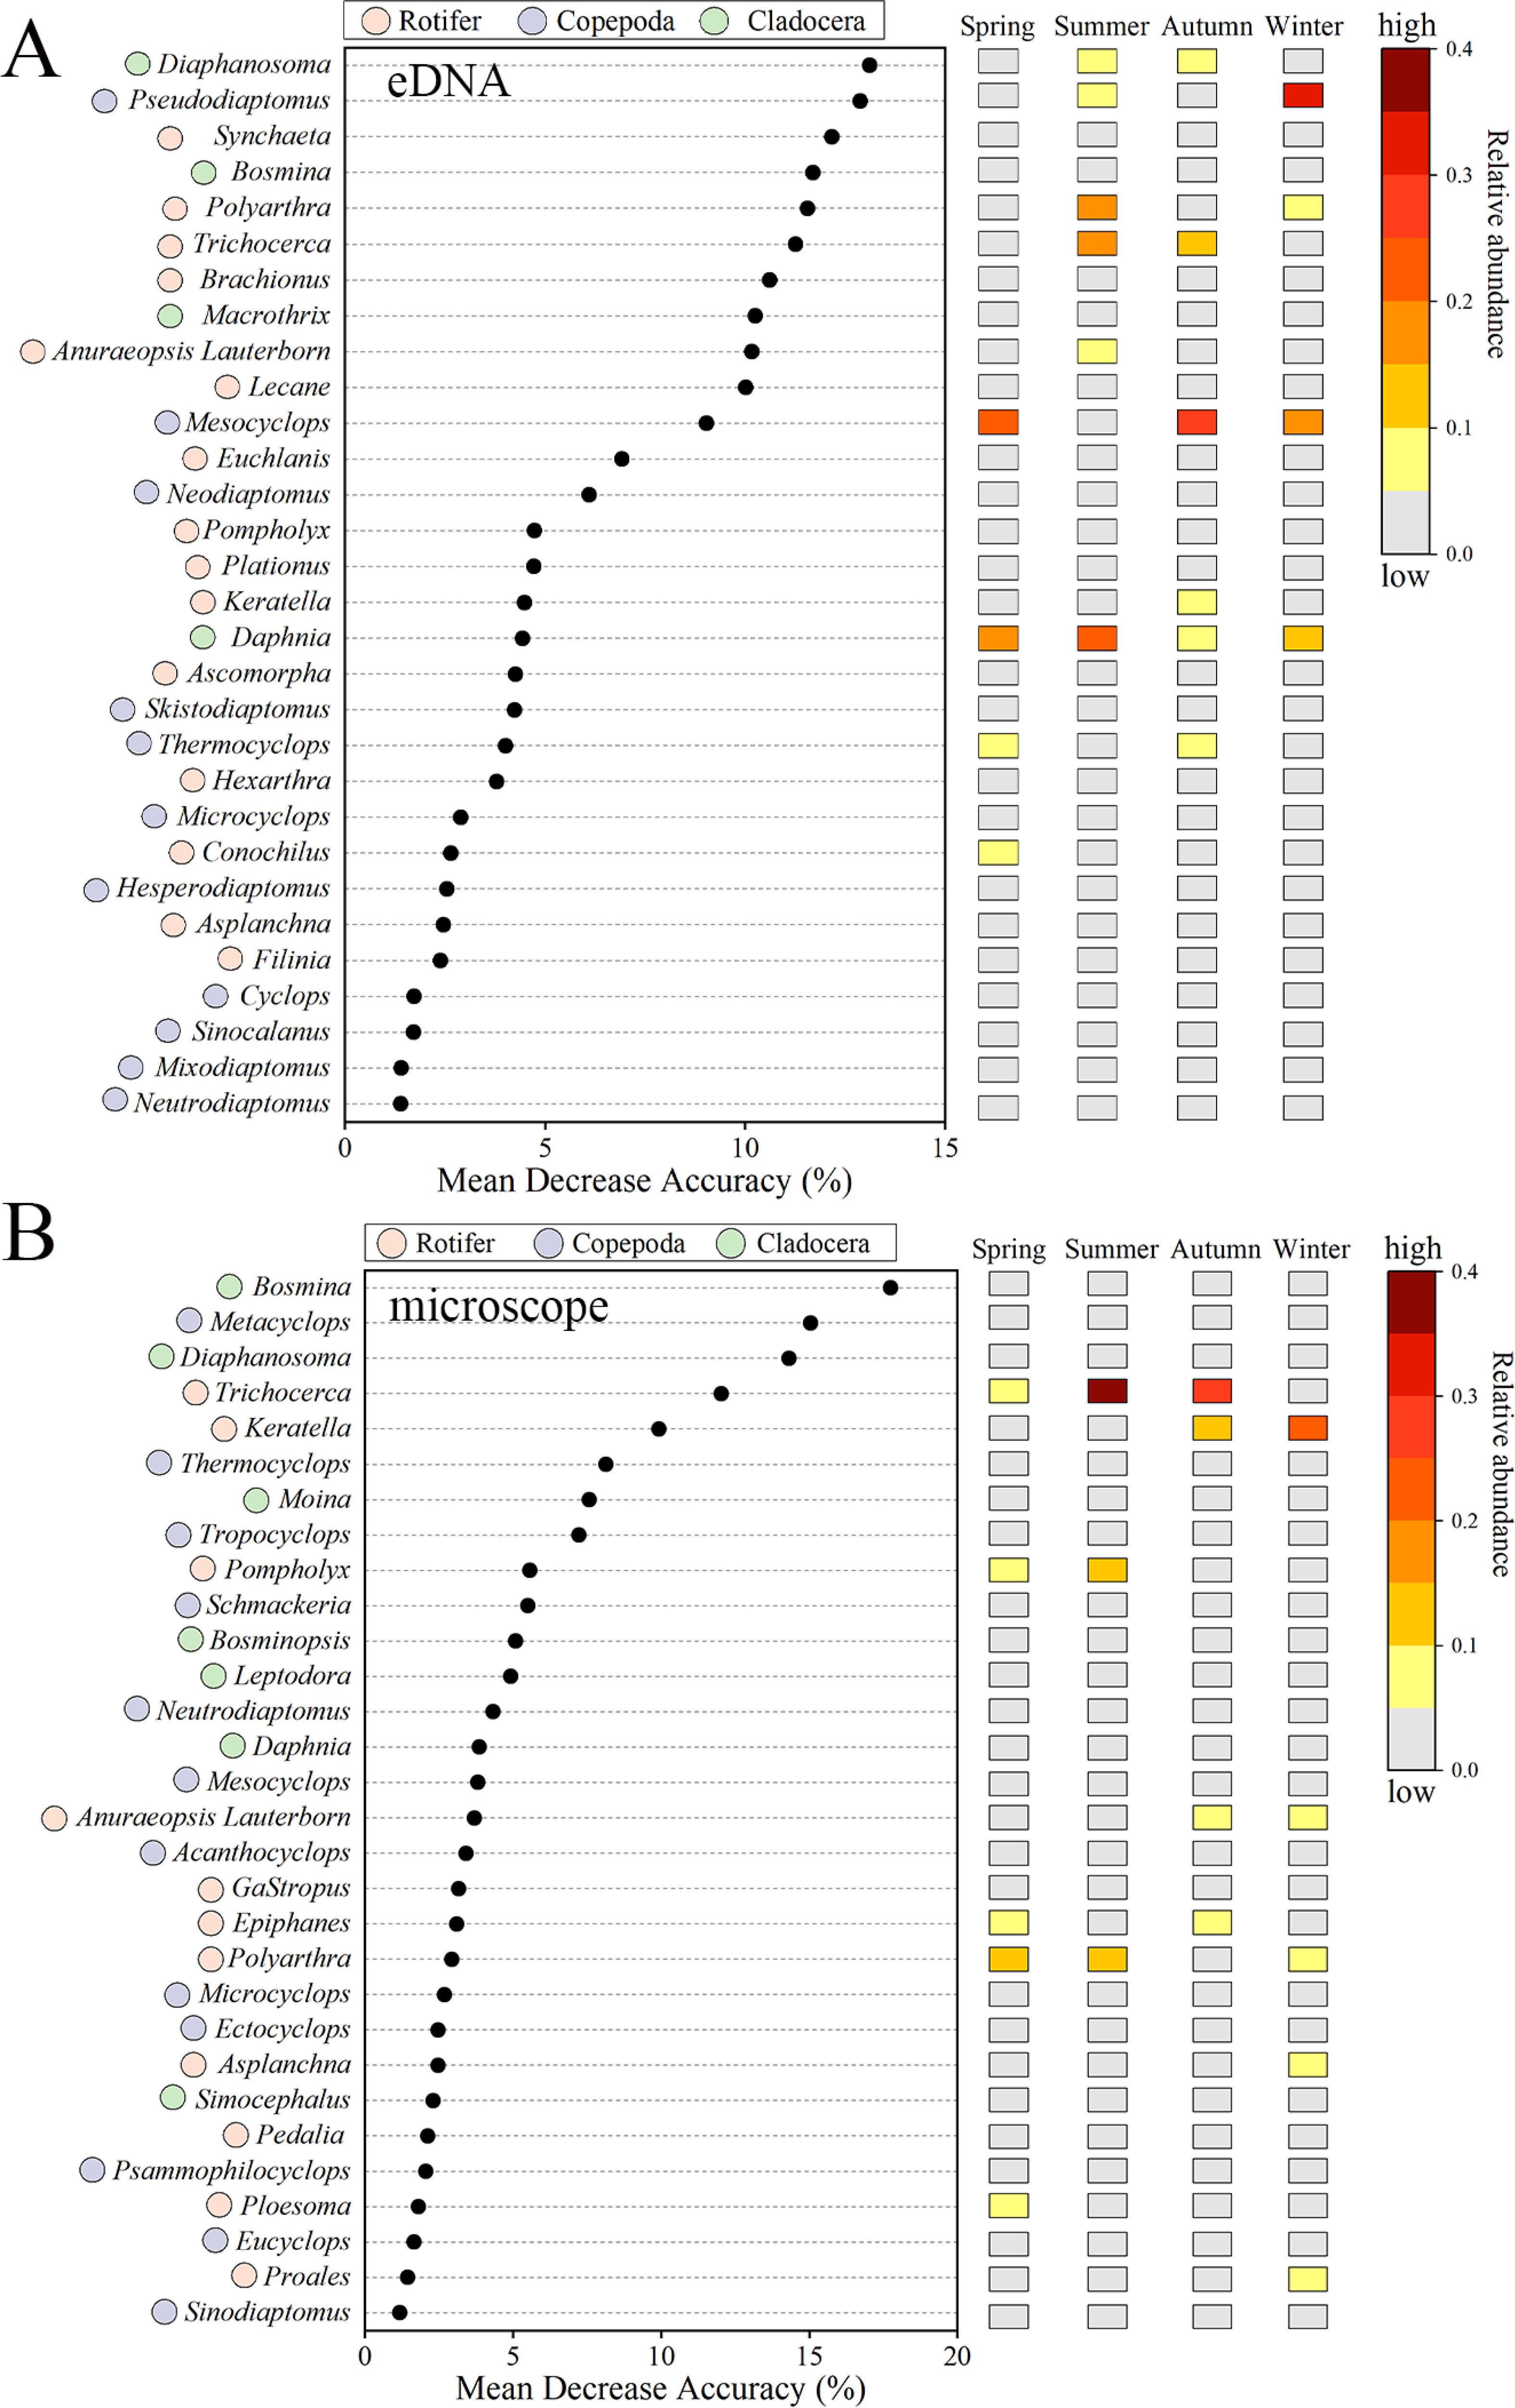
Figure 7. Important abundant taxa (at the genus level) across different seasons were identified using eDNA (A) and microscopy (B) through the Random Forest model and were ranked by their contribution to taxonomic accuracy (mean decrease accuracy). The left circular plot shows colors representing Rotifer (pink), Copepoda (purple), and Cladocera (green), while the right rectangular plot displays the relative abundance of these taxa throughout the seasons.
The eDNA method revealed the interactions (i.e., ‘cooperation’ or ‘competition’) among zooplankton groups across different seasons. In spring, positive correlations among zooplankton were more prevalent than negative ones (Figure 8; Table 2). Positive correlations were mainly observed between Leydigia (Cladocera) and Anuraeopsis lauterbornia (Rotifer), whereas negative correlations were predominantly noted between Thermocyclops (Copepoda) and Macrothrix (Cladocera). During summer, both positive and negative correlations among zooplankton taxa reached their peak, with the network exhibiting a greater number of interconnected nodes. Negative correlations were predominantly observed between copepods (e.g., Neodiaptomus, Skistodiaptomus, Mesocyclops) and rotifers. Correlation levels gradually decreased during autumn and winter. In autumn, negative correlations among various taxa outnumbered positive correlations, with increased connectivity between Euchlanis (Rotifer) and Diaphanosoma (Cladocera). In winter, network density, connectivity, and complexity reached their lowest levels of the year (Table 2).
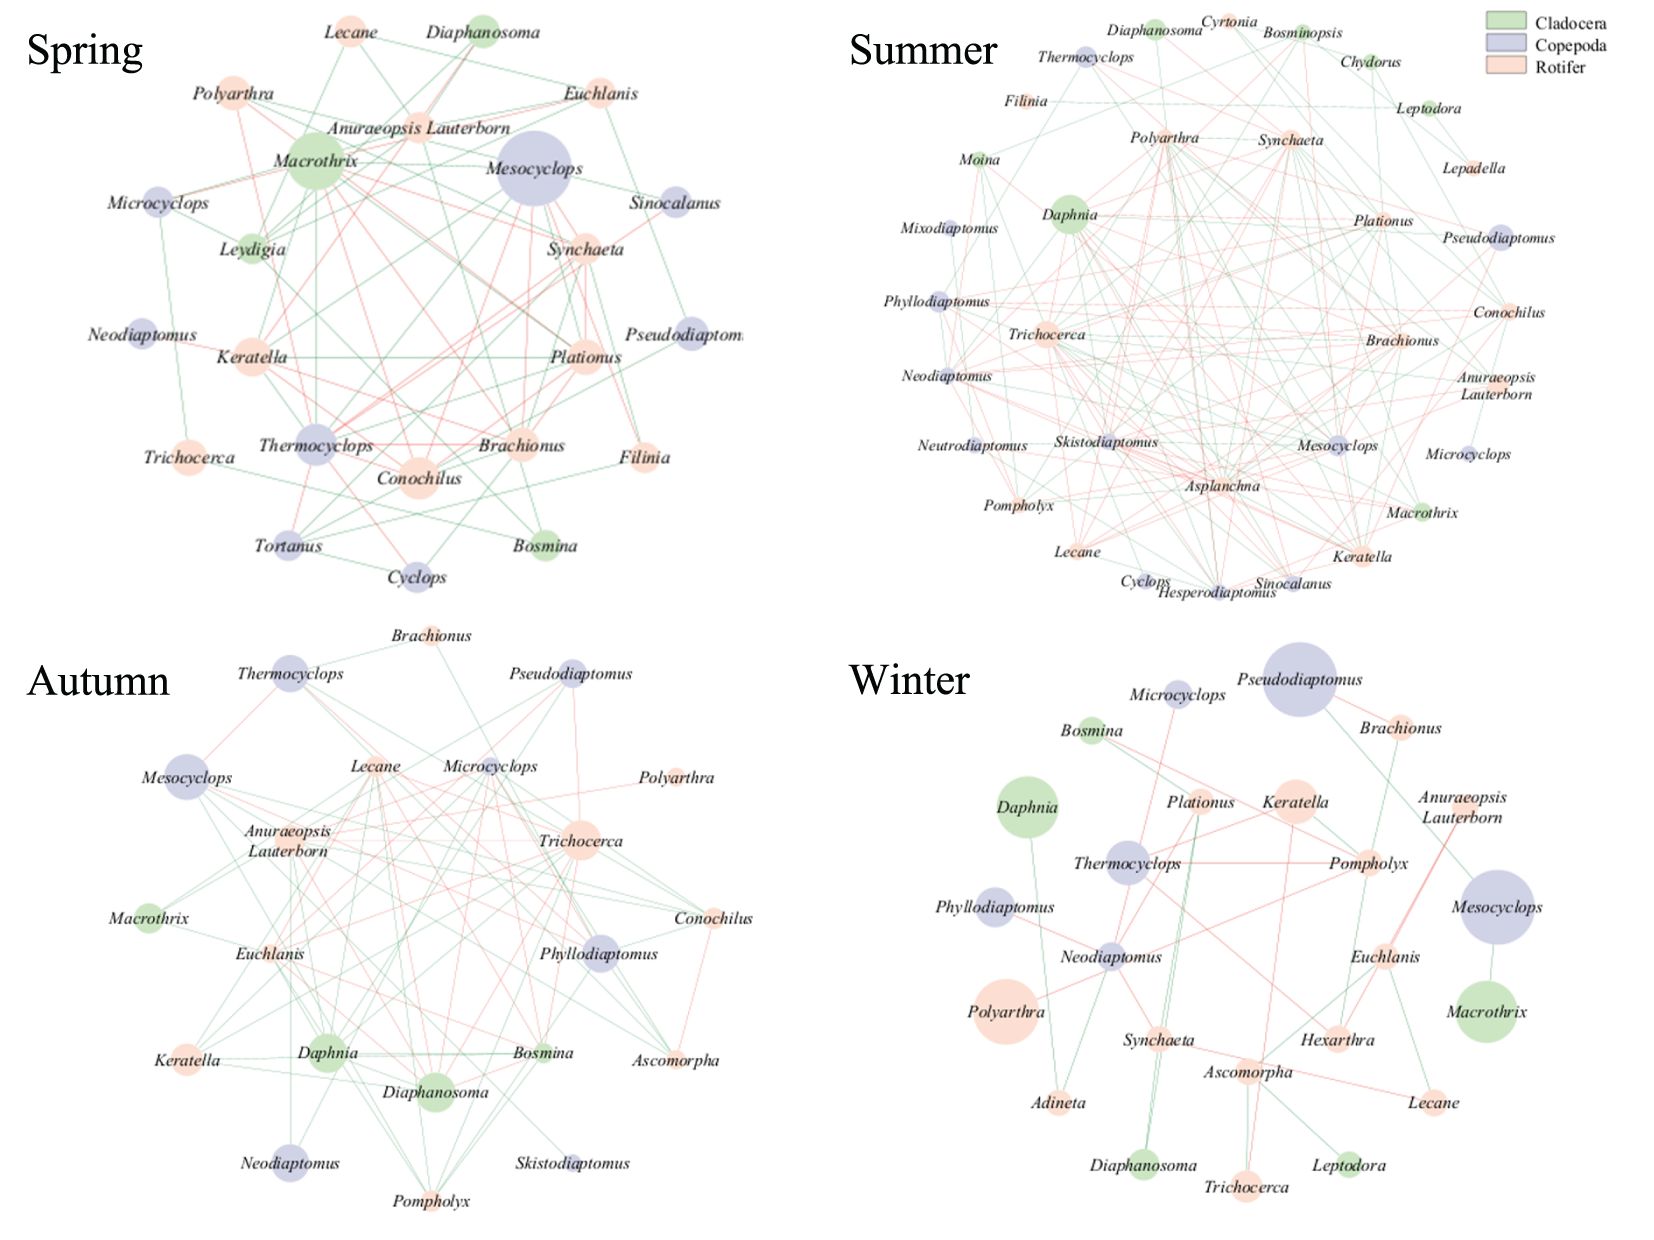
Figure 8. The network structure of zooplankton interactions across different seasons as assessed by the eDNA method. Node colors represent different taxa, with nodes corresponding to zooplankton genera. The size of each node indicates the abundance of the genus during the season. Links between nodes denote significant correlations: positive correlations are represented by green solid lines, and negative correlations by red solid lines.
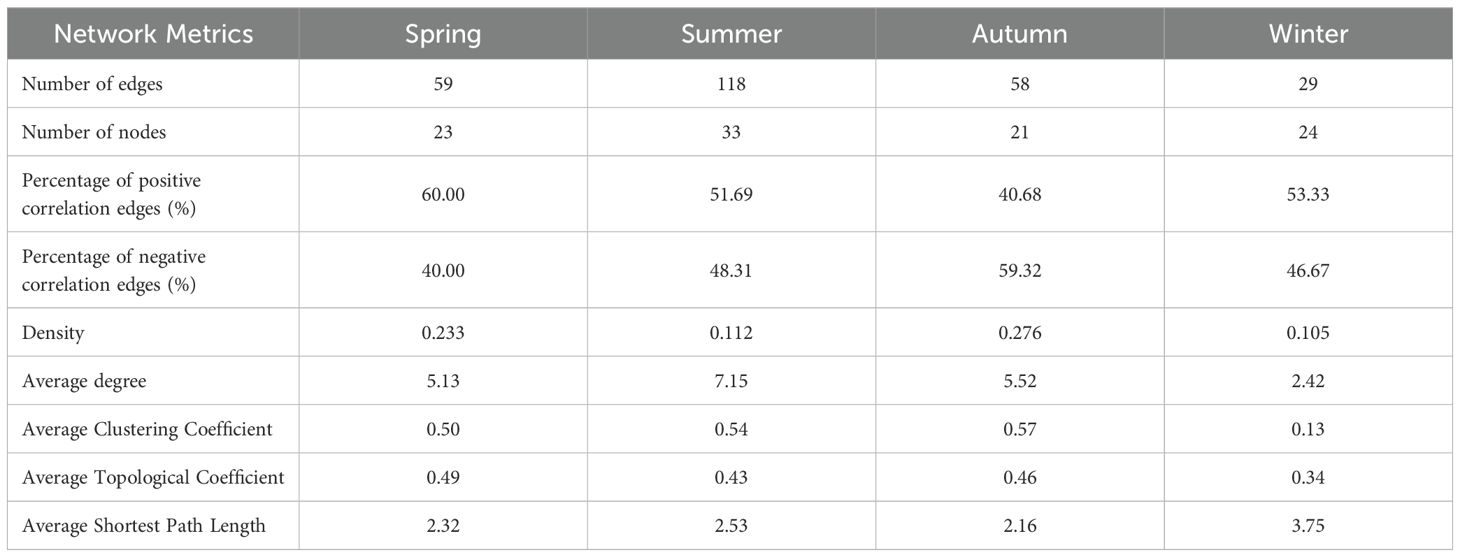
Table 2. Fundamental characteristics of seasonal zooplankton networks identified through the eDNA method.
The results of the RDA analysis, based on both eDNA and microscopy abundance, revealed that the first two redundant axes (RDA1 and RDA2) accounted for 21.56% and 17.51% of the variance in zooplankton community composition, respectively (Figure 9). Four environmental variables, including WT, NO3-, NO2-, and ORP significantly influenced the zooplankton community in both methods (p< 0.05). Additionally, DO, NTU, NH3-N, and TP were the significant environmental factors influencing the seasonal variation of zooplankton in the eDNA method. In contrast, CODMn significantly influenced seasonal variation in the microscopy method.
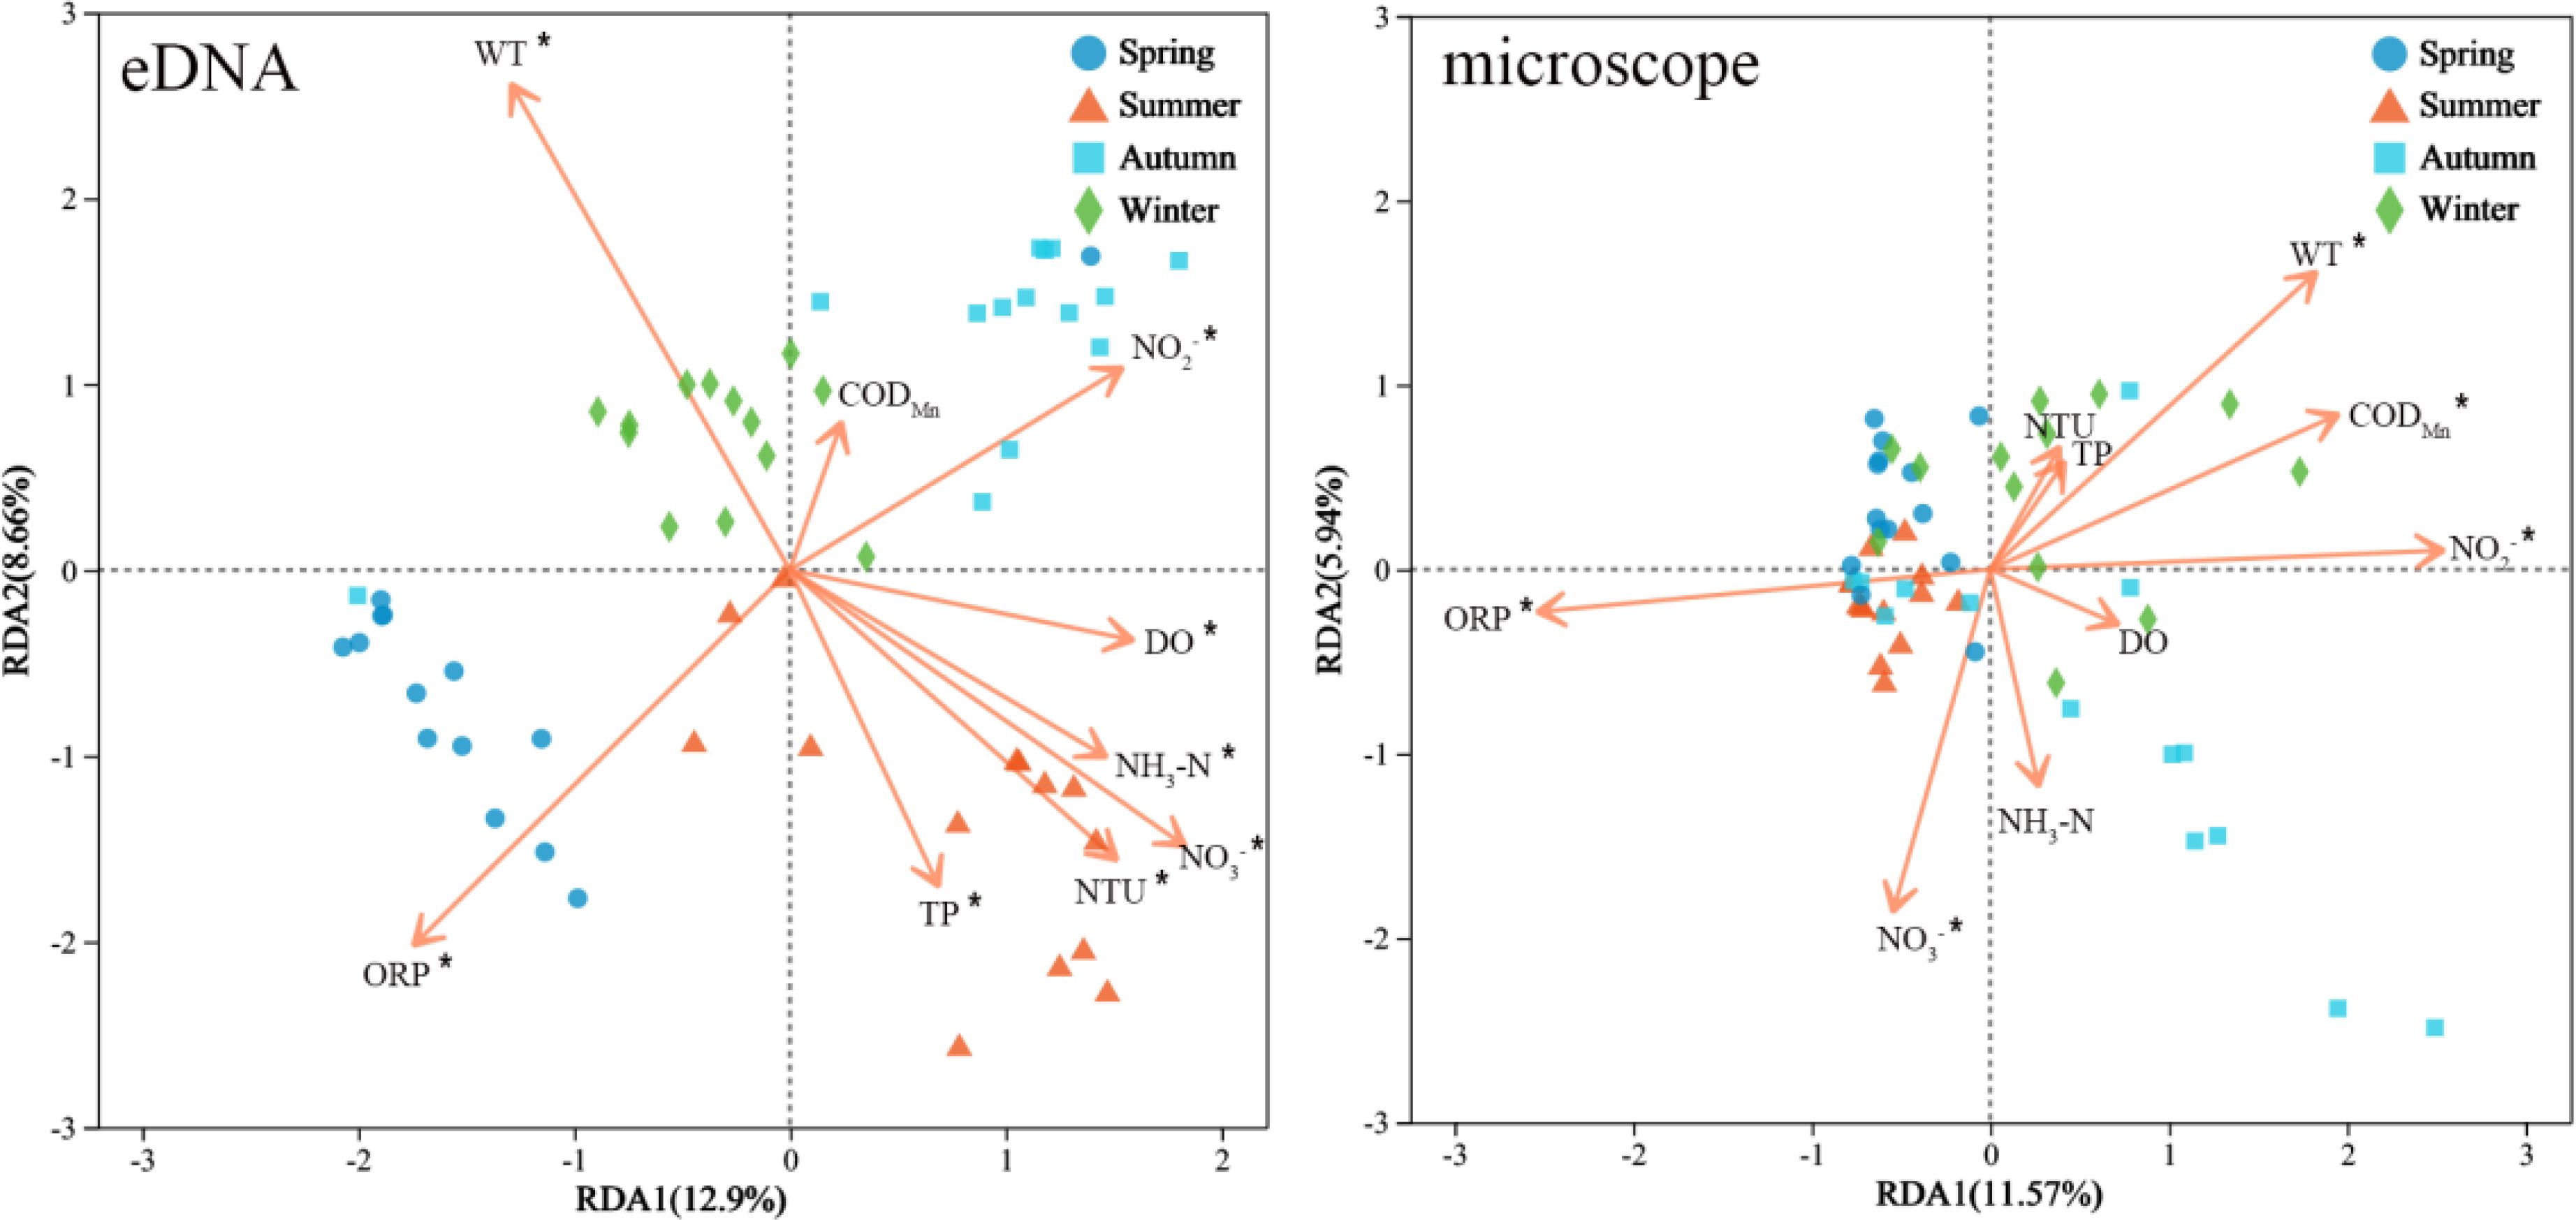
Figure 9. RDA analysis of zooplankton communities and environmental factors across different seasons was conducted using both eDNA and microscopy methods. An asterisk (′*′) indicates that an environmental factor has a significant impact.
For two zooplankton taxa, significant positive correlations (p< 0.05) between eDNA reads and morphological abundance were identified through linear regression analysis (Figure 10). No significant correlations were observed between eDNA reads and morphological biomass (p > 0.05). However, eDNA reads (Y) can be explained by a binary linear model incorporating morphological abundance (X1) and biomass (X2), demonstrating significantly higher correlations than those observed with either abundance or biomass alone (Rotifer: , R2 = 0.449, F = 4.481, p = 0.038; Crustacean: , R2 = 0.707, F = 14.476, p< 0.001).
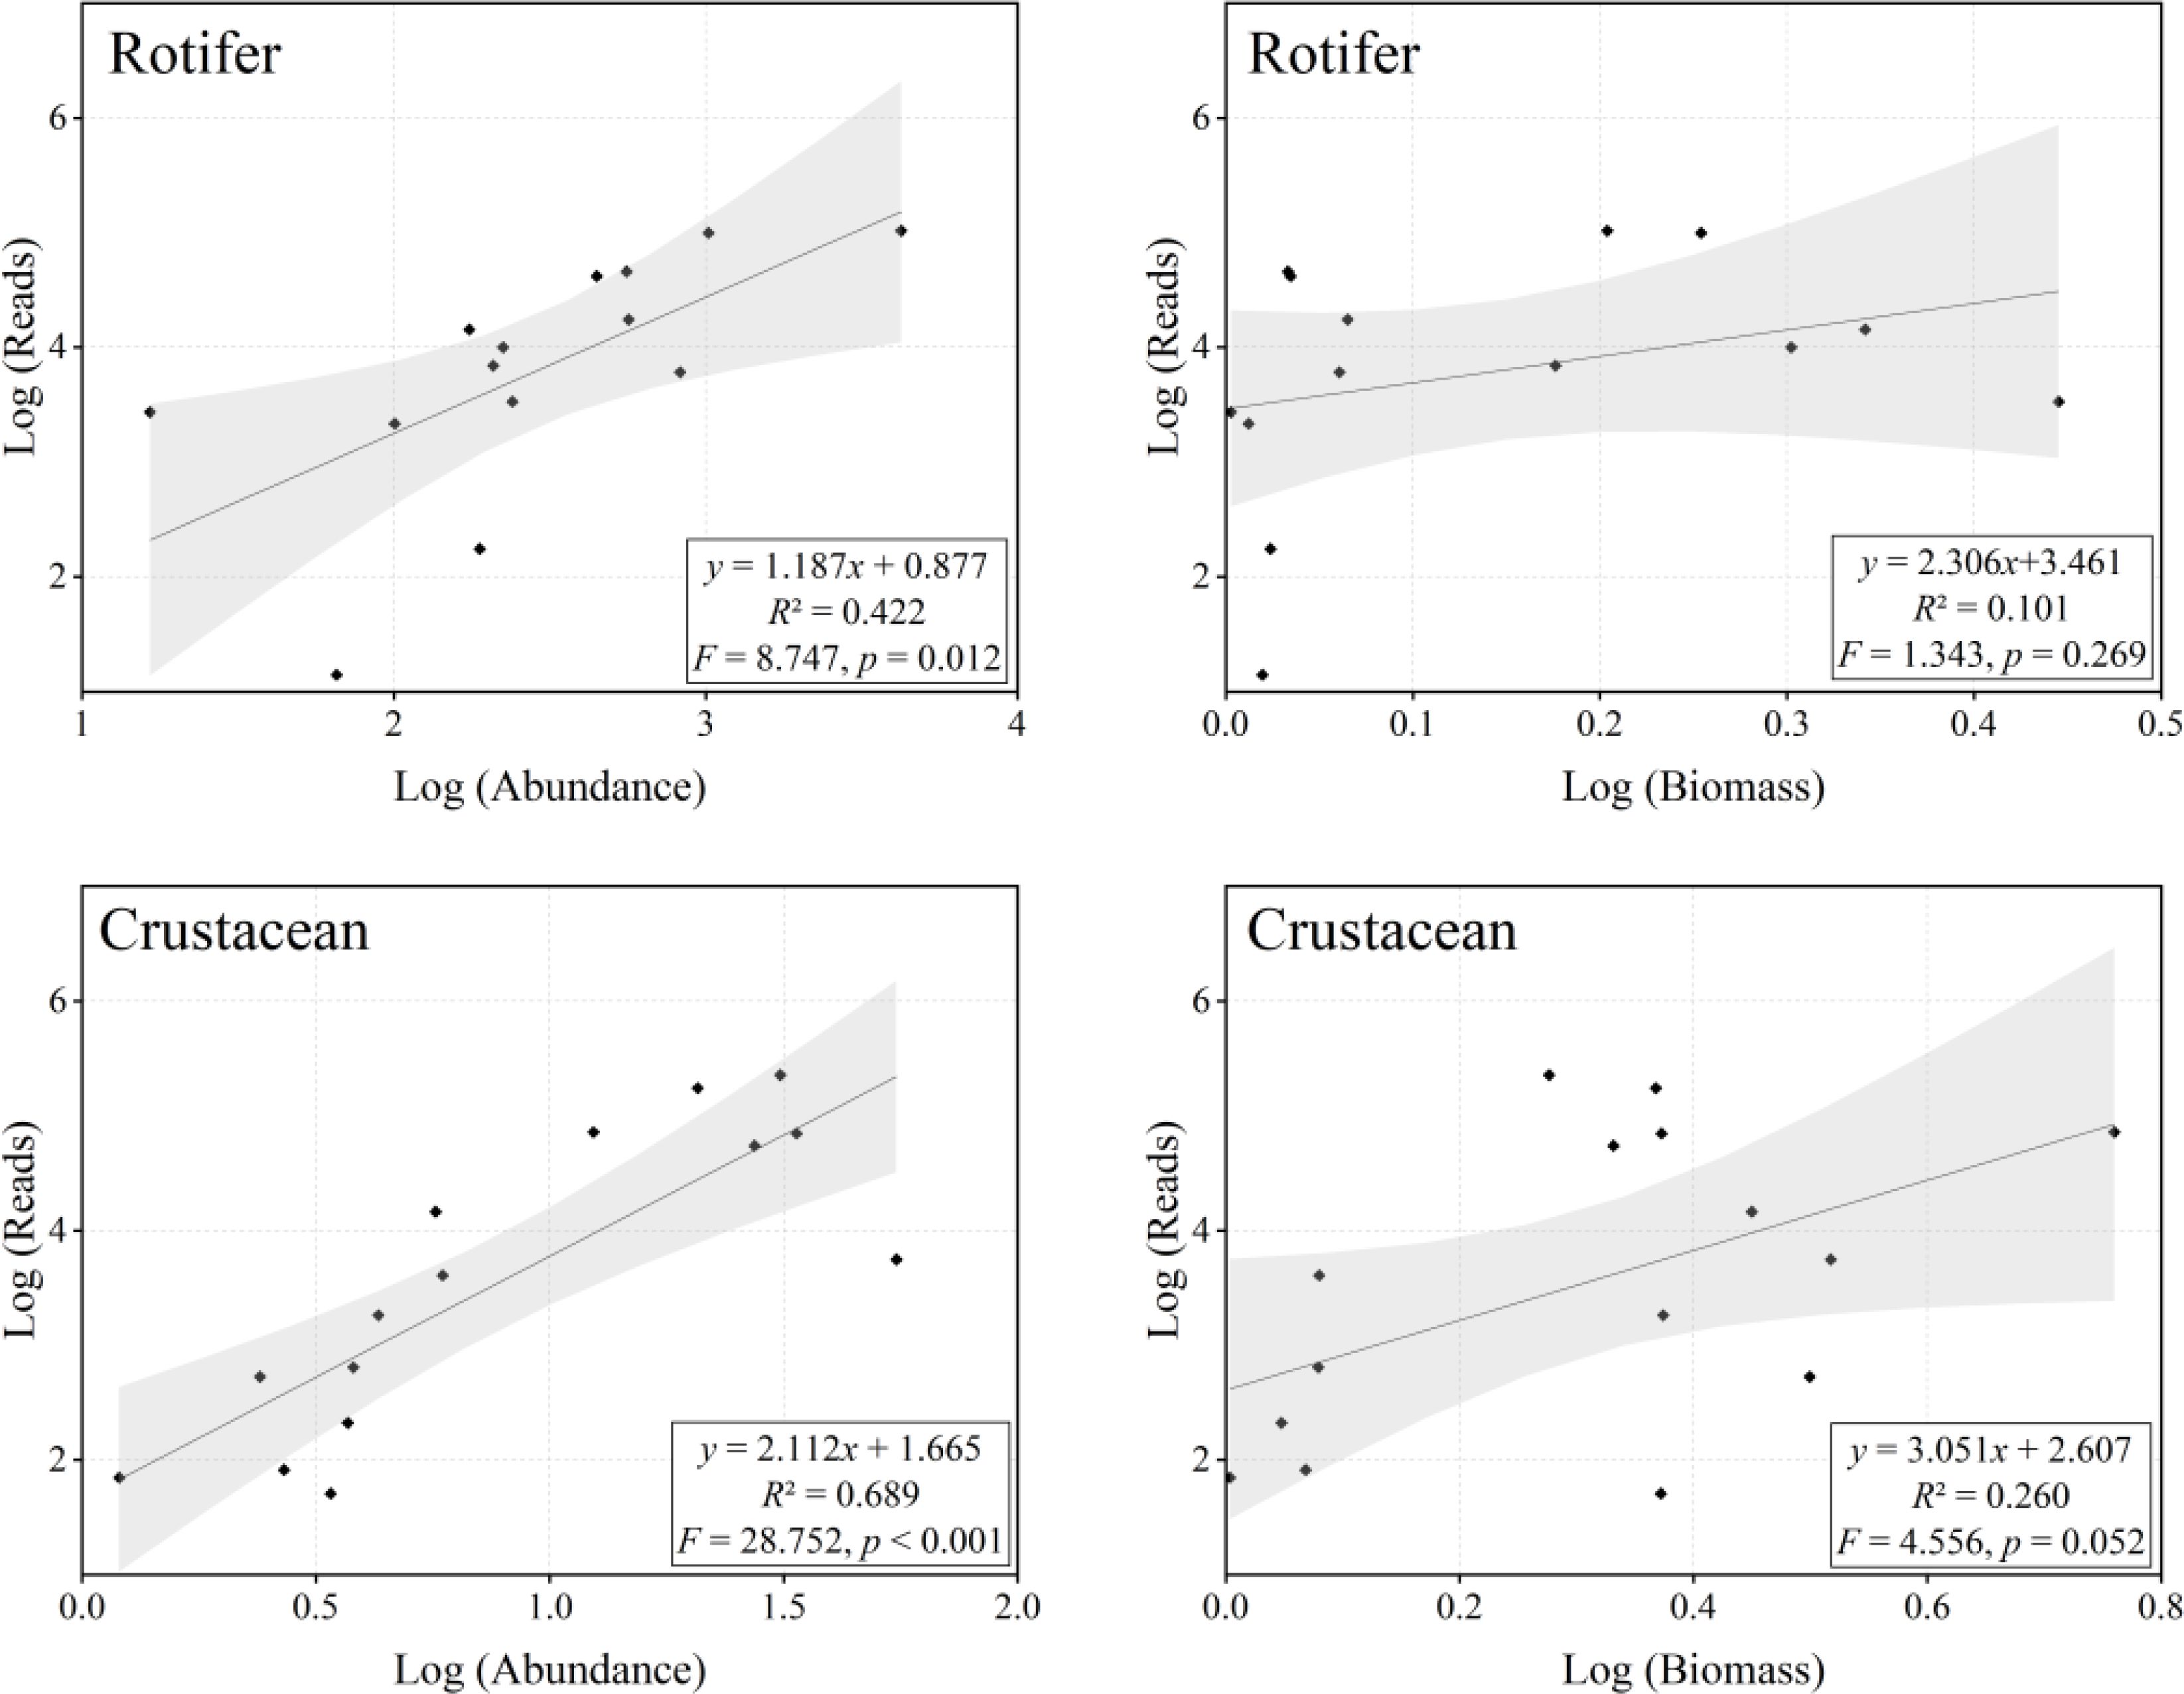
Figure 10. Correlations between eDNA (read abundance) and microscopy (abundance and biomass) for shared genera are shown with log-transformed data. Solid lines represent relationships fitted by linear regression models, while shading denotes 95% confidence intervals. Diamonds indicate different genera, R² values represent correlation coefficients, and p-values denote the significance of correlations.
Accurate monitoring of zooplankton is essential for elucidating their ecological roles within aquatic ecosystems (Tittensor et al., 2010). In this study, both eDNA and microscopy methods effectively demonstrated detection capabilities (Supplementary Figure S3). However, significant differences in zooplankton composition were observed between the two methods (Figure 4, 5). The eDNA detection at both genus and species levels exhibited lower taxonomic resolution than microscopy, indicating limitations in identifying specific zooplankton species (Figure 3A). This is partly due to the COI primers used in this study targeting multiple zooplankton phyla (Leray et al., 2013), which is advantageous for detecting a broad range of zooplankton taxa in marine ecosystems (Duarte et al., 2021; Hirai et al., 2015). However, in freshwater ecosystems, zooplankton monitoring has primarily focused on crustaceans and rotifers. The taxonomic atlas for inland freshwater zooplankton is relatively well-established, enabling researchers to conduct more thorough and precise morphological monitoring. In contrast, eDNA detection effectiveness and accuracy heavily depend on the quality and completeness of reference databases (Bucklin et al., 2021), which are critical for the broader application of eDNA technology (Cristescu, 2014). The NCBI NT database utilized in this study includes DNA sequence data for numerous freshwater zooplankton species worldwide. However, due to the extensive diversity of zooplankton species, their complex taxonomic classifications, and the lack of reference sequences for certain taxa, achieving comprehensive coverage of all species remains challenging. Similar issues have been noted in riverine ecosystems, where eDNA detected comparatively fewer species than traditional microscopy (Poyntz-Wright et al., 2024). Thus, improving the resolution of eDNA detection for species identification largely depends on the continuous refinement of eDNA reference databases (Atienza et al., 2020). Secondly, primer selection is crucial for determining the diversity of zooplankton detected via eDNA monitoring (Song and Liang, 2023). COI primers generally offer superior resolution for species classification compared to other primers (Carroll et al., 2019; Djurhuus et al., 2018). This phenomenon has been corroborated in both marine (Clarke et al., 2017; Feng et al., 2023) and riverine (Song and Liang, 2023) ecosystems. In this study, COI primers were found to outperform 18S primers in lake ecosystems (Figure 2A; Supplementary Figures S1, S2). Although the 18S V9 region exhibits considerable variability, its high conservation across certain taxa limits taxonomic resolution (Tang et al., 2012; Wu et al., 2015). Additionally, primer bias may arise from variations in primer affinity across different taxonomic groups, resulting in differential amplification efficiencies (Deagle et al., 2014; Meusnier et al., 2008). Factors such as primer-template mismatches, primer length, and sequence variability within target species all contribute to this variability (Flynn et al., 2015; Piñol et al., 2015). Future research should focus on optimizing primer selection and minimizing these biases to enhance the reliability of eDNA-based monitoring (Bucklin et al., 2016). Additionally, the sensitivity of eDNA to detect species can vary depending on factors such as DNA concentration, the quality of the sample, and DNA degradation, which may lead to underrepresentation of certain taxa or misidentification (McCartin et al., 2022). In summary, the existing limitations of the eDNA approach may hinder its broader application in zooplankton monitoring. To improve the effectiveness of eDNA in freshwater zooplankton monitoring, we recommend: (i) designing primers specifically targeting freshwater zooplankton to enhance detection accuracy; (ii) establishing a comprehensive taxonomic reference sequence database for freshwater zooplankton with global or regional coverage; and (iii) utilizing multiple primer tags or primer pairs for more comprehensive biological monitoring.
Traditional microscopy methods have several limitations. Many zooplankton groups exhibit considerable intraspecific and interspecific variation in morphology, size, behavior, and ecological habits, which complicates the accurate differentiation of morphologically similar species, such as Brachionus and Keratella. The eDNA method effectively addresses these limitations, particularly in identifying morphologically similar or small-sized species. The COI primers utilized in this study are widely recognized for species identification, offering accurate and broad species resolution in zooplankton diversity analyses and effectively distinguishing closely related species (Hebert et al., 2003). Microscopy typically necessitates a large number of samples and involves time-consuming processing and identification, which can reduce the detection efficiency of rare species. The eDNA method increases the likelihood of detecting low-abundance taxa by homogenizing the sample (Campbell et al., 2019). For instance, six rare families, including Hexarthridae and Adinetidae, and twelve rare genera, such as Adineta and Hexarthra, were detected exclusively through eDNA assays. Notably, Macrotrichidae was identified in previous microscopy-based zooplankton surveys conducted in Qiandao Lake. The detection of these rare taxa underscores the considerable potential of the eDNA approach for identifying rare zooplankton taxa. Furthermore, morphological surveys are considerably constrained by mesh size, as different mesh sizes influence the collection efficiency of zooplankton taxa with varying body sizes (Pansera et al., 2014). Rodríguez et al. (2013) demonstrated that a 55-μm mesh net was more efficient for collecting rotifers in freshwater rivers compared to a 100-μm mesh net. Although nets with various mesh sizes were used for different zooplankton groups, some organisms may escape through the mesh during sampling, potentially impacting classification and enumeration via microscopy (Shao et al., 2020; Skjoldal et al., 2013). Future sampling efforts should prioritize optimizing mesh sizes and employing finer meshes to enhance capture rates of microzooplankton taxa, along with establishing standardized sampling and processing procedures (Zagami and Brugnano, 2013).
According to the identification results from both eDNA and microscopy methods, rotifers were identified as the most abundant zooplankton group in terms of species richness in Qiandao Lake (Figures 3B, C). This finding is consistent with previous studies conducted in Qiandao Lake (Wang et al., 2024). Differences in mechanisms and sensitivities between the two detection methods may lead to the identification of different dominant species by eDNA and microscopy. Daphnia galeata and Pseudodiaptomus forbesi were identified as the major dominant species according to the eDNA method, which is consistent with results from zooplankton surveys in lakes of the Yangtze River Basin utilizing the same COI primers (Xie et al., 2021). Daphnia galeata, an algal-feeding zooplankton, typically dominates in algal-rich lakes and plays a crucial role in regulating the structure and dynamics of phytoplankton communities (Borcherding et al., 2017; Tokishita et al., 2017). In contrast, the microscopy method identified Bosmina coregoni and Schmackeria forbesi as the dominant species, consistent with findings from long-term morphological surveys in Taihu Lake, China (Zhou et al., 2020). Long-term morphological surveys conducted in Qiandao Lake have also identified Schmackeria forbesi as the primary dominant species. Consequently, the results from both eDNA and microscopy methods indicate that the two approaches are highly complementary in providing insights into zooplankton species. We recommend the integration of results from both methods in zooplankton surveys to address the limitations of individual methods and achieve a more accurate and comprehensive assessment of ecosystem health (Harvey et al., 2017).
This study demonstrates that both eDNA and microscopy methods are effective approaches for studying seasonal changes in zooplankton communities (Figure 6). These seasonal variations may have resulted in significant differences in species composition observed between the two methods (Table 1). Both eDNA and microscopy methods confirmed that rotifers were the primary taxa driving seasonal variations in the zooplankton community (Figure 7). Rotifers primarily reproduce via parthenogenesis and are particularly responsive to environmental changes associated with seasonal turnover. They can complete their life cycle in a relatively short period, quickly achieving high abundance levels (Jiang et al., 2023), and they play a crucial role in maintaining the stability of the zooplankton community and the functionality of the ecosystem (Duggan et al., 2002). For instance, this study found that Polyarthra and Trichocerca exhibited high abundances in both eDNA and microscopy methods, indicating that the significance of these genera within the community was consistently corroborated by both methods.
Molecular ecological network analysis has proven highly effective in revealing species interactions within complex ecosystems, particularly in investigating seasonal interactions among microbial communities (Du et al., 2024; Xu et al., 2020). In this study, eDNA-based analyses revealed significant seasonal variations in the interactions among zooplankton communities in Qiandao Lake (Figure 8; Table 2). The increase in phytoplankton primary productivity from spring to summer promoted the rapid growth of zooplankton populations, resulting in increased complexity and diversity of interspecific interactions. Rotifers and crustacean zooplankton exhibit complex interactions, including both symbiotic relationships (e.g., shared resources) and potentially negative correlations arising from competition for resources and predation (Moody and Wilkinson, 2019; Song and Liang, 2023). In autumn, as phytoplankton biomass declines, competition for resources among various zooplankton taxa intensifies, leading to an increase in negative correlations in interspecific interactions, particularly among taxa that rely on phytoplankton as their primary food sources (e.g., Cladocera, rotifers) (Yang and Zhang, 2020). Cladocerans (e.g., Daphnia, Diaphanosoma) and rotifers primarily consume phytoplankton (e.g., green algae and diatoms), as well as bacteria, protozoa, and organic detritus (Zhang and Huang, 1991). In contrast, copepods primarily feed on flagellates and small zooplankton (Jens et al., 2001). In winter, the increase in positive correlations between species may reflect a co-evolutionary mechanism between zooplankton and phytoplankton, whereby the seasonal dormancy of some zooplankton species mitigates the overharvesting of phytoplankton (Ge et al., 2024). The reduction in negative interspecific interactions, particularly among phytoplankton-dependent taxa, suggests that the dormancy of major species such as Daphnia and Cyclops helps alleviate competitive pressure on phytoplankton, thereby maintaining the balance of the ecosystem. This strategy not only reduces pressure on phytoplankton resources but also prevents drastic declines in their populations due to overexploitation (Kenitz et al., 2017). Furthermore, certain rare species not observed under the microscope, such as Plateus and Skistodiaptomus, demonstrated high connectivity within the network in spring and mid-winter, while Macrothrix exhibited high abundance in spring. This finding suggests that rare species may play a vital role in maintaining the structure and stability of the zooplankton community (Djurhuus et al., 2020; Xue et al., 2018).
It should be noted that the influence of sampling seasonality on the results should also be considered when interpreting the findings (Feng et al., 2023). Seasonal fluctuations in environmental conditions (Kitamura et al., 2016), such as temperature, nutrient availability, and water quality, can significantly affect zooplankton distribution and abundance. These factors may lead to variations in species detection between different seasons. Furthermore, the timing of sampling can influence the detection of certain life stages, such as the presence of resting eggs or juvenile forms, which may not be consistently captured across seasons. Thus, while both eDNA and microscopy methods provide valuable insights into zooplankton community composition, it is essential to recognize the potential biases introduced by seasonal changes in environmental conditions and zooplankton life cycle dynamics (Farjalla et al., 2012).
Zooplankton exhibit highly sensitive to environmental changes and external disturbances, as demonstrated by their rapid responses to fluctuations in environmental parameters (Li et al., 2019b). Studies have shown that environmental factors directly or indirectly influence biological communities within aquatic ecosystems (Zou et al., 2021). Results from the RDA in this study indicated that both eDNA and microscopy methods effectively captured the significant impact of environmental variables on the structure of zooplankton communities (Figure 9). Both methods indicate that winter water temperature significantly affects zooplankton communities, as well as that NO3-, NO2-, and ORP significantly influence zooplankton communities. Seasonal variations in water temperature significantly affect the physiological traits of zooplankton (Gillooly, 2000; Zou et al., 2021). Lower temperatures in winter may decrease metabolism and reproductive rates, potentially leading to population declines by exceeding species-specific tolerance thresholds, thereby inhibiting growth and reproduction (Ibarbalz et al., 2019). Nitrogen is essential for autotrophs, as it promotes phytoplankton growth, thereby indirectly affecting zooplankton food resources and community structure (Han et al., 2024). Redox potential influences zooplankton by regulating dissolved oxygen, thereby affecting nutrient dynamics and microbial activity (Qin et al., 2023). In this study, eDNA identified more environmental factors associated with seasonal changes in zooplankton communities compared to microscopic analysis. Due to its high sensitivity and broad detection range, eDNA facilitates a more comprehensive assessment of the effects of environmental factors on zooplankton communities (Du et al., 2024). Qiandao Lake is situated in a mountainous and hilly region, encircled by urban areas and agricultural lands. Consequently, the inflow of agricultural waste has elevated the nitrogen and phosphorus levels in the water to a certain degree (Zhai et al., 2014). During the summer, variations in wind speed and water flow may result in the mixing of water. Favorable environmental conditions (such as dissolved oxygen, nitrate, and phosphate) facilitate the growth of phytoplankton, thereby promoting the reproduction of zooplankton (Glibert et al., 2016; Zhang et al., 2018). Additionally, the magnitude and direction of the influence of environmental factors vary between the two methodologies. Therefore, the accuracy of environmental factor assessments using different methods requires additional scientific inquiry.
Although this study employed two methods to analyze the effects of environmental factors on zooplankton communities, the proportion of variance explained was relatively low, potentially due to the limited range of environmental variables considered. Future research should incorporate a broader spectrum of environmental variables (e.g., land use and agricultural cover) and spatial factors (e.g., hydrological gradients and dam construction) to comprehensively elucidate the factors driving changes in zooplankton communities and to improve ecological understanding (Hu et al., 2024; Shen et al., 2024; Zhao et al., 2017).
Accurate quantification of species abundance remains a significant challenge in eDNA studies due to methodological complexities and numerous variables involved. This study revealed a significant positive correlation between eDNA reads and the morphological abundance of major freshwater zooplankton taxa (Figure 10), thereby supporting the reliability of eDNA in assessing species abundance (Bucklin et al., 2019; Feng et al., 2023; Song and Liang, 2023). However, the observed weak correlation between eDNA reads and zooplankton biomass may stem from differences in species body size, measurement errors, and uncertainties in sample processing methods. For instance, microscopic examination yields limited estimates of body length, and conversion formulas between body length and weight for different species may introduce errors (Gorsky et al., 2010). Meanwhile, taxonomists may overlook morphologically similar species in the identification process. Additionally, eDNA studies face uncertainties such as eDNA degradation due to ultraviolet radiation and high temperatures (Rees et al., 2014), variations in the affinity of universal primers for different species leading to amplification bias (Bylemans et al., 2018), as well as variability in copy numbers among different zooplankton taxa (Piñol et al., 2019). Despite these limitations, advances in quantitative PCR technology, sequencing techniques, and bioinformatics are gradually standardizing methods for eDNA quantification. For example, researchers have employed PCR-free shotgun sequencing for genome skimming to reduce or eliminate PCR amplification bias (Coissac et al., 2016; Papadopoulou et al., 2015) and to achieve a more accurate characterization of ecological community composition and diversity. Due to size and physiological differences among individual zooplankton (Chambert et al., 2018; Takahara et al., 2012), eDNA is still regarded as a semi-quantitative approach. Nonetheless, eDNA remains effective in revealing quantitative patterns of zooplankton across different sites or large scales, rendering it a valuable tool for ecological monitoring and biodiversity assessment (Lamb et al., 2019).
A thorough understanding of diversity, community structure, and seasonal variations in zooplankton is essential for elucidating the ecological processes occurring in lake ecosystems. This study demonstrated that both eDNA and microscopy methods constitute effective methodologies for monitoring zooplankton. The two methods complement each other, providing a more comprehensive and scientifically rigorous evaluation of zooplankton diversity and community structure. While eDNA cannot fully replace traditional morphological methods, it provides extensive data that elucidate the structure and interactions of zooplankton communities with high efficiency and detail. Consequently, eDNA emerges as a promising methodology. However, further optimization of its application and analysis methods is essential to enhance the accuracy and efficacy of assessments of zooplankton diversity.
The datasets presented in this study can be found in online repositories. The names of the repository/repositories and accession number(s) can be found below: https://www.ncbi.nlm.nih.gov/, PRJNA1171195.
Ethical approval was not required for the study involving zooplankton, as it complied with local legislation and institutional requirements.
LH: Data curation, Formal analysis, Investigation, Validation, Writing – original draft. XX: Data curation, Formal analysis, Investigation, Validation, Writing – original draft. YZ: Formal analysis, Investigation, Writing – original draft. DL: Formal analysis, Investigation, Writing – original draft. JS: Supervision, Writing – review & editing. JP: Supervision, Writing – review & editing. GH: Supervision, Writing – review & editing. ZH: Conceptualization, Methodology, Supervision, Writing – review & editing. QL: Conceptualization, Methodology, Supervision, Writing – review & editing.
The author(s) declare financial support was received for the research, authorship, and/or publication of this article. This work was financially supported by the National Key Research and Development Program of China (No. 2023YFD2400900).
JS, JP and GH were employed by Hangzhou Qiandao Lake Development Group Co., Ltd.
The remaining authors declare that the research was conducted in the absence of any commercial or financial relationships that could be construed as a potential conflict of interest.
The author(s) declare that no Generative AI was used in the creation of this manuscript.
All claims expressed in this article are solely those of the authors and do not necessarily represent those of their affiliated organizations, or those of the publisher, the editors and the reviewers. Any product that may be evaluated in this article, or claim that may be made by its manufacturer, is not guaranteed or endorsed by the publisher.
The Supplementary Material for this article can be found online at: https://www.frontiersin.org/articles/10.3389/fmars.2025.1509743/full#supplementary-material
Alberdi A., Aizpurua O., Gilbert M., Bohmann K. (2018). Scrutinizing key steps for reliable metabarcoding of environmental samples. Methods Ecol. Evol. 9, 134–147. doi: 10.1111/2041-210X.12849
Amaral-Zettler L. A., McCliment E. A., Ducklow H. W., Huse S. M. (2009). A method for studying protistan diversity using massively parallel sequencing of V9 hypervariable regions of small-subunit ribosomal RNA genes. PloS One 4, e6372. doi: 10.1371/journal.pone.0006372
Anderson M. J. (2017). Permutational Multivariate Analysis of Variance (PERMANOVA) (Wiley StatsRef: Statistics Reference Online, John Wiley & Sons, Ltd). doi: 10.1002/9781118445112.stat07841
Atienza S., Guardiola M., Præbel K., Antich A., Turon X., Wangensteen O. S. (2020). DNA metabarcoding of deep-sea sediment communities using COI: community assessment, spatio-temporal patterns and comparison with 18S rDNA. Diversity 12, 123. doi: 10.3390/d12040123
Attayde J. L., Bozelli R. L. (1998). Assessing the indicator properties of zooplankton assemblages to disturbance gradients by canonical correspondence analysis. Can. J. Fish. Aquat. Sci. 55, 1789–1797. doi: 10.1139/f98-033
Bjorbækmo M. F. M., Evenstad A., Røsæg L. L., Krabberød A. K., Logares R. (2019). The planktonic protist interactome: where do we stand after a century of research? ISME J. 14, 544–559. doi: 10.1038/s41396-019-0542-5
Bokulich N. A., Kaehler B. D., Rideout J. R., Dillon M., Bolyen E., Knight R., et al. (2018). Optimizing taxonomic classification of marker-gene amplicon sequences with QIIME 2’s q2-feature-classifier plugin. Microbiome 6, 90. doi: 10.1186/s40168-018-0470-z
Borcherding J., Kiel S., Struebig A., Arndt H. (2017). Vertical migration of Daphnia galeata – Evidence for the use of an alternative resource from a lethal environment. Limnologica 62, 132–139. doi: 10.1016/j.limno.2016.11.010
Bucklin A., Lindeque P. K., Rodriguez-Ezpeleta N., Albaina A., Lehtiniemi M. (2016). Metabarcoding of marine zooplankton: prospects, progress and pitfalls. J. Plankton Res. 38, 393–400. doi: 10.1093/plankt/fbw023
Bucklin A., Peijnenburg K. T. C. A., Kosobokova K. N., O’Brien T. D., Blanco-Bercial L., Cornils A., et al. (2021). Toward a global reference database of COI barcodes for marine zooplankton. Mar. Biol. 168, 78. doi: 10.1007/s00227-021-03887-y
Bucklin A., Yeh H. D., Questel J. M., Richardson D. E., Reese B., Copley N. J., et al. (2019). Time-series metabarcoding analysis of zooplankton diversity of the NW Atlantic continental shelf. ICES J. Mar. Sci. 76, 1162–1176. doi: 10.1093/icesjms/fsz021
Bunnell D. B., Barbiero R. P., Ludsin S. A., Madenjian C. P., Warren G. J., Dolan D. M., et al. (2013). Changing ecosystem dynamics in the laurentian great lakes: bottom-up and top-down regulation. BioScience 64, 26–39. doi: 10.1093/biosci/bit001
Bylemans J., Gleeson D. M., Hardy C. M., Furlan E. (2018). Toward an ecoregion scale evaluation of eDNA metabarcoding primers: A case study for the freshwater fish biodiversity of the Murray–Darling Basin (Australia). Ecol. Evol. 8, 8697–8712. doi: 10.1002/ece3.4387
Campbell T., Guo J., Wheelock M., Geller J., DiMaria R., Pagenkopp Lohan K. (2019). Intact vs. homogenized subsampling: testing impacts of pre-extraction processing of multi-species samples on invasive species detection. Manage. Biol. Invas. 10, 324–341. doi: 10.3391/mbi.2019.10.2.08
Carroll E. L., Gallego R., Sewell M. A., Zeldis J., Ranjard L., Ross H. A., et al. (2019). Multi-locus DNA metabarcoding of zooplankton communities and scat reveal trophic interactions of a generalist predator. Sci. Rep. 9, 281. doi: 10.1038/s41598-018-36478-x
Chain F. J. J., Brown E. A., MacIsaac H. J., Cristescu M. E. (2016). Metabarcoding reveals strong spatial structure and temporal turnover of zooplankton communities among marine and freshwater ports. Divers. Distrib. 22, 493–504. doi: 10.1111/ddi.12427
Chambert T., Pilliod D. S., Goldberg C. S., Doi H., Takahara T. (2018). An analytical framework for estimating aquatic species density from environmental DNA. Ecol. Evol. 8, 3468–3477. doi: 10.1002/ece3.3764
Chen S., Zhou Y., Chen Y., Gu J. (2018). fastp: an ultra-fast all-in-one FASTQ preprocessor. Bioinformatics 34, i884–i890. doi: 10.1093/bioinformatics/bty560
Chiang S. C., Du N. (1979). Fauna sinica; Crustacea: freshwater Cladocera (Beijing: Science Press Academia Sinica).
Chiba S., Batten S., Martin C. S., Ivory S., Miloslavich P., Weatherdon L. V. (2018). Zooplankton monitoring to contribute towards addressing global biodiversity conservation challenges. J. Plankton Res. 40, 509–518. doi: 10.1093/plankt/fby030
Clarke K. R., Warwick R. M. (1994). Similarity-based testing for community pattern: the two-way layout with no replication. Mar. Biol. 118, 167–176. doi: 10.1007/BF00699231
Clarke L. J., Beard J. M., Swadling K. M., Deagle B. E. (2017). Effect of marker choice and thermal cycling protocol on zooplankton DNA metabarcoding studies. Ecol. Evol. 7, 873–883. doi: 10.1002/ece3.2667
Clarke L. J., Soubrier J., Weyrich L. S., Cooper A. (2014). Environmental metabarcodes for insects: in silico PCR reveals potential for taxonomic bias. Mol. Ecol. Resour. 14, 1160–1170. doi: 10.1111/1755-0998.12265
Coissac E., Hollingsworth P. M., Lavergne S., Taberlet P. (2016). From barcodes to genomes: extending the concept of DNA barcoding. Mol. Ecol 25 (7), 1423–1428. doi: 10.1111/mec.13549
Cristescu M. E. (2014). From barcoding single individuals to metabarcoding biological communities: towards an integrative approach to the study of global biodiversity. Trends Ecol. Evol. 29, 566–571. doi: 10.1016/j.tree.2014.08.001
Deagle B. E., Jarman S. N., Coissac E., Pompanon F., Taberlet P. (2014). DNA metabarcoding and the cytochrome c oxidase subunit I marker: not a perfect match. Biol. Lett. 10, 20140562. doi: 10.1098/rsbl.2014.0562
Dixon P. (2003). VEGAN, a package of R functions for community ecology. J. Veg. Sci. 14, 927–930. doi: 10.1111/j.1654-1103.2003.tb02228.x
Djurhuus A., Closek C. J., Kelly R. P., Pitz K. J., Michisaki R. P., Starks H. A., et al. (2020). Environmental DNA reveals seasonal shifts and potential interactions in a marine community. Nat. Commun. 11, 254. doi: 10.1038/s41467-019-14105-1
Djurhuus A., Pitz K., Sawaya N. A., Rojas-Márquez J., Michaud B., Montes E., et al. (2018). Evaluation of marine zooplankton community structure through environmental DNA metabarcoding. Limnol. Oceanogr. Methods 16, 209–221. doi: 10.1002/lom3.10237
Drummond A. J., Newcomb R. D., Buckley T. R., Xie D., Dopheide A., Potter B. C., et al. (2015). Evaluating a multigene environmental DNA approach for biodiversity assessment. GigaScience 4, s13742–015-0086-1. doi: 10.1186/s13742-015-0086-1
Du X., Xiong W., Li S., Zhan A. (2024). Conventional net tow versus environmental DNA for metabarcoding-based analysis of plankton-environment interactions in polluted aquatic ecosystems. Ecol. Indic. 158, 111356. doi: 10.1016/j.ecolind.2023.111356
Duarte S., Vieira P. E., Lavrador A. S., Costa F. O. (2021). Status and prospects of marine NIS detection and monitoring through (e)DNA metabarcoding. Sci. Total Environ. 751, 141729. doi: 10.1016/j.scitotenv.2020.141729
Duggan I. C., Green J. D., Shiel R. J. (2002). Distribution of rotifer assemblages in North Island, New Zealand, lakes: relationships to environmental and historical factors. Freshw. Biol. 47, 195–206. doi: 10.1046/j.1365-2427.2002.00742.x
EPA (2002). Water and Wastewater Monitoring and Analysis Method. 4th ed. (China: Environmental Science Press, Beijing).
Farjalla V. F., Srivastava D. S., Marino N. A., Azevedo F. D., Dib V., Lopes P. M., et al. (2012). Ecological determinism increases with organism size. Ecology 93, 1752–1759. doi: 10.1890/11-1144.1
Feng Y., Sun D., Shao Q., Fang C., Wang C. (2023). COI metabarcoding better reveals the seasonal variations in the zooplankton community in the western Pacific Warm Pool. Ecol. Indic. 156, 111183. doi: 10.1016/j.ecolind.2023.111183
Flynn J. M., Brown E. A., Chain F. J., MacIsaac H. J., Cristescu M. E. (2015). Toward accurate molecular identification of species in complex environmental samples: testing the performance of sequence filtering and clustering methods. Ecol. Evol. 5, 2252–2266. doi: 10.1002/ece3.1497
Gavrilko D., Zhikharev V., Zolotareva T., Kudrin I., Yakimov B., Erlashova A. (2024). Biodiversity of zooplankton (Rotifera, Cladocera and Copepoda) in the tributaries of Cheboksary Reservoir (Middle Volga, Russia). Biodivers. Data J. 12, e116330. doi: 10.3897/BDJ.12.e116330
Ge R., Chen Y., Chen H., Zhang X., Shi J., Li H., et al. (2024). Effects of Yellow Sea Warm Current on zooplankton community composition and functional groups in winter. Mar. Environ. Res. 202, 106715. doi: 10.1016/j.marenvres.2024.106715
Geller J., Meyer C., Parker M., Hawk H. (2013). Redesign of PCR primers for mitochondrial cytochrome c oxidase subunit I for marine invertebrates and application in all-taxa biotic surveys. Mol. Ecol. resources 13, 851–861. doi: 10.1111/1755-0998.12138
Ghosal R., Eichmiller J. J., Witthuhn B. A., Sorensen P. W. (2018). Attracting Common Carp to a bait site with food reveals strong positive relationships between fish density, feeding activity, environmental DNA, and sex pheromone release that could be used in invasive fish management. Ecol. Evol. 8, 6714–6727. doi: 10.1002/ece3.4169
Giering S. L. C., Wells S. R., Mayers K. M. J., Schuster H., Cornwell L., Fileman E. S., et al. (2019). Seasonal variation of zooplankton community structure and trophic position in the Celtic Sea: A stable isotope and biovolume spectrum approach. Prog. Oceanogr. 177, 101943. doi: 10.1016/j.pocean.2018.03.012
Gillooly J. F. (2000). Effect of body size and temperature on generation time in zooplankton. J. Plankton Res. 22, 241–251. doi: 10.1093/plankt/22.2.241
Glibert P. M., Wilkerson F. P., Dugdale R. C., Raven J. A., Dupont C. L., Leavitt P. R., et al. (2016). Pluses and minuses of ammonium and nitrate uptake and assimilation by phytoplankton and implications for productivity and community composition, with emphasis on nitrogen-enriched conditions. Limnol. Oceanogr. 61, 165–197. doi: 10.1002/lno.10203
Gorsky G., Ohman M. D., Picheral M., Gasparini S., Stemmann L., Romagnan J.-B., et al. (2010). Digital zooplankton image analysis using the ZooScan integrated system. J. Plankton Res. 32, 285–303. doi: 10.1093/plankt/fbp124
Gu Q., Zhang Y., Ma L., Li J., Wang K., Zheng K., et al. (2016). Assessment of reservoir water quality using multivariate statistical techniques: A case study of Qiandao Lake, China. Sustainability 8, 243. doi: 10.3390/su8030243
Häder D.-P., Banaszak A. T., Villafañe V. E., Narvarte M. A., González R. A., Helbling E. W. (2020). Anthropogenic pollution of aquatic ecosystems: Emerging problems with global implications. Sci. Total Environ. 713, 136586. doi: 10.1016/j.scitotenv.2020.136586
Han Q., Wang X., Peng S. (2024). Distribution pattern of zooplankton assemblages in the eutrophic Hangzhou Bay, China. Reg. Stud. Mar. Sci. 70, 103368. doi: 10.1016/j.rsma.2024.103368
Harvey J. B. J., Johnson S. B., Fisher J. L., Peterson W. T., Vrijenhoek R. C. (2017). Comparison of morphological and next generation DNA sequencing methods for assessing zooplankton assemblages. J. Exp. Mar. Biol. Ecol. 487, 113–126. doi: 10.1016/j.jembe.2016.12.002
Hays G. C., Richardson A. J., Robinson C. (2005). Climate change and marine plankton. Trends Ecol. Evol. 20, 337–344. doi: 10.1016/j.tree.2005.03.004
Hebert P. D. N., Cywinska A., Ball S. L., deWaard J. R. (2003). Biological identifications through DNA barcodes. Proc. R. Soc. B-biological Sci. 270, 313–321. doi: 10.1098/rspb.2002.2218
Hirai J., Shimode S., Tsuda A. (2013). Evaluation of ITS2-28S as a molecular marker for identification of calanoid copepods in the subtropical western North Pacific. J. Plankton Res. 35, 644–656. doi: 10.1093/plankt/fbt016
Hirai J., Yasuike M., Fujiwara A., Nakamura Y., Hamaoka S., Katakura S., et al. (2015). Effects of plankton net characteristics on metagenetic community analysis of metazoan zooplankton in a coastal marine ecosystem. J. Exp. Mar. Biol. Ecol. 469, 36–43. doi: 10.1016/j.jembe.2015.04.011
Hu M., Zhu Y., Hu X., Zhu B., Lyu S., Yinglan A., et al. (2024). Assembly mechanism and stability of zooplankton communities affected by China’s south-to-north water diversion project. J. Environ. Manage. 365, 121497. doi: 10.1016/j.jenvman.2024.121497
Ibarbalz F. M., Henry N., Brandão M. C., Martini S., Busseni G., Byrne H., et al. (2019). Global trends in marine plankton diversity across kingdoms of life. Cell 179, 1084–1097.e21. doi: 10.1016/j.cell.2019.10.008
Jens C. N., Bent Hansen H., Lars-Johan N., Ulf B.Â.m. (2001). Zooplankton growth, diet and reproductive success compared in simultaneous diatom- and flagellate-microzooplankton-dominated plankton blooms. Mar. Ecol. Prog. Ser. 221, 77–91. doi: 10.3354/meps221077
Jeppesen E., Nõges P., Davidson T. A., Haberman J., Nõges T., Blank K., et al. (2011). Zooplankton as indicators in lakes: a scientific-based plea for including zooplankton in the ecological quality assessment of lakes according to the European Water Framework Directive (WFD). Hydrobiologia 676, 279–297. doi: 10.1007/s10750-011-0831-0
Ji F., Han D., Yan L., Yan S., Zha J., Shen J. (2022). Assessment of benthic invertebrate diversity and river ecological status along an urbanized gradient using environmental DNA metabarcoding and a traditional survey method. Sci. Total Environ. 806, 150587. doi: 10.1016/j.scitotenv.2021.150587
Jiang X., Liu Y., Su W., Shen J., An S., Qin G., et al. (2023). Seasonal and flow regime differences should be considered in explaining zooplankton metacommunity assembly. Glob. Ecol. Conserv. 47, e02653. doi: 10.1016/j.gecco.2023.e02653
Kenitz K. M., Visser A. W., Mariani P., Andersen K. H. (2017). Seasonal succession in zooplankton feeding traits reveals trophic trait coupling. Limnol. Oceanogr. 62, 1184–1197. doi: 10.1002/lno.10494
Kitamura M., Kobari T., Honda M. C., Matsumoto K., Sasaoka K., Nakamura R., et al. (2016). Seasonal changes in the mesozooplankton biomass and community structure in subarctic and subtropical time-series stations in the western North Pacific. J. Oceanogr. 72, 387–402. doi: 10.1007/s10872-015-0347-8
Lamb P. D., Hunter E., Pinnegar J. K., Creer S., Davies R. G., Taylor M. I. (2019). How quantitative is metabarcoding: A meta-analytical approach. Mol. Ecol. 28, 420–430. doi: 10.1111/mec.14920
Landry M. R., Hassett R. P. (1982). Estimating the grazing impact of marine micro-zooplankton. Mar. Biol. 67, 283–288. doi: 10.1007/BF00397668
Leray M., Yang J. Y., Meyer C. P., Mills S. C., Agudelo N., Ranwez V., et al. (2013). A new versatile primer set targeting a short fragment of the mitochondrial COI region for metabarcoding metazoan diversity: application for characterizing coral reef fish gut contents. Front. Zool. 10, 34. doi: 10.1186/1742-9994-10-34
Li X., Feng J., Wellen C., Wang Y. (2017). A Bayesian approach of high impaired river reaches identification and total nitrogen load estimation in a sparsely monitored basin. Environ. Sci. pollut. Res. 24, 987–996. doi: 10.1007/s11356-016-7890-8
Li J., Hatton-Ellis T. W., Lawson Handley L.-J., Kimbell H. S., Benucci M., Peirson G., et al. (2019a). Ground-truthing of a fish-based environmental DNA metabarcoding method for assessing the quality of lakes. J. Appl. Ecol. 56, 1232–1244. doi: 10.1111/1365-2664.13352
Li W., Xu X., Yao J., Tanaka N., Nishimura O., Ma H. (2019b). Combined effects of elevated carbon dioxide and temperature on phytoplankton-zooplankton link: A multi-influence of climate change on freshwater planktonic communities. Sci. Total Environ. 658, 1175–1185. doi: 10.1016/j.scitotenv.2018.12.180
Li T., Zhu B., Cao F., Sun H., He X., Liu M., et al. (2021). Monitoring changes in the transparency of the largest reservoir in eastern China in the past decade 2013–2020. Remote Sens. 13, 2570. doi: 10.3390/rs13132570
Lindeque P. K., Hay S. J., Heath M. R., Ingvarsdottir A., Rasmussen J., Smerdon G. R., et al. (2006). Integrating conventional microscopy and molecular analysis to analyse the abundance and distribution of four Calanus congeners in the North Atlantic. J. Plankton Res. 28, 221–238. doi: 10.1093/plankt/fbi115
Liu G., Lin Z., Qi X., Wang Y., Wang Y., Jiang W., et al. (2023). Environmental filtering, spatial processes and biotic interactions jointly shape different traits communities of stream macroinvertebrates. Front. Ecol. Evol. 11. doi: 10.3389/fevo.2023.1196296
Lv Y., Liu G., Wang Y., Wang Y., Jin X., Chen H., et al. (2024). Near-natural streams: Spatial factors are key in shaping multiple facets of zooplankton α and β diversity. Environ. pollut. 255, 119174. doi: 10.1016/j.envres.2024.119174
Matthews S. A., Goetze E., Ohman M. D. (2021). Recommendations for interpreting zooplankton metabarcoding and integrating molecular methods with morphological analyses. ICES J. Mar. Sci. 78, 3387–3396. doi: 10.1093/icesjms/fsab107
McCartin L. J., Vohsen S. A., Ambrose S. W., Layden M., McFadden C. S., Cordes E. E., et al. (2022). Temperature controls eDNA persistence across physicochemical conditions in seawater. Environ. Sci. Technol. 56, 8629–8639. doi: 10.1021/acs.est.2c01672
Meusnier I., Singer G. A., Landry J.-F., Hickey D. A., Hebert P. D., Hajibabaei M. (2008). A universal DNA mini-barcode for biodiversity analysis. BMC Genomics 9, 1–4. doi: 10.1186/1471-2164-9-214
Moody E. K., Wilkinson G. M. (2019). Functional shifts in Lake Zooplankton communities with hypereutrophication. Freshw. Biol. 64, 608–616. doi: 10.1111/fwb.13246
Neter J., Kutner M. H., Nachtsheim C. J., Wasserman W. (1996). Applied linear statistical models. Second Edi, Irwin, Homewood, Ill, ISBN: 0256070687
O’Rorke R., van der Reis A., von Ammon U., Beckley L. E., Pochon X., Zaiko A., et al. (2022). eDNA metabarcoding shows latitudinal eukaryote micro- and mesoplankton diversity stabilizes across oligotrophic region of a >3000 km longitudinal transect in the Indian Ocean. Deep Sea Res. Part II. 205, 105178. doi: 10.1016/j.dsr2.2022.105178
Oksanen J., Simpson G. L., Blanche F. G., Kindt R., Legendre P., Minchin P. R., et al. (2013). Community ecology package. R package version. 2, 321–326.
Pansera M., Granata A., Guglielmo L., Minutoli R., Zagami G., Brugnano C. (2014). How does mesh-size selection reshape the description of zooplankton community structure in coastal lakes? Estuar. Coast. Shelf Sci. 151, 221–235. doi: 10.1016/j.ecss.2014.10.015
Papadopoulou A., Taberlet P., Zinger L. (2015). Metagenome skimming for phylogenetic community ecology: a new era in biodiversity research. Mol. Ecol. 24, 3515–3517. doi: 10.1111/mec.13263
Pawlowski J., Kelly-Quinn M., Altermatt F., Apothéloz-Perret-Gentil L., Beja P., Boggero A., et al. (2018). The future of biotic indices in the ecogenomic era: Integrating (e)DNA metabarcoding in biological assessment of aquatic ecosystems. Sci. Total Environ. 637-638, 1295–1310. doi: 10.1016/j.scitotenv.2018.05.002
Pielou E. C. (1966). The measurement of diversity in different types of biological collections. J. Theor. Biol. 13, 131–144. doi: 10.1016/0022-5193(66)90013-0
Piñol J., Mir G., Gomez-Polo P., Agustí N. (2015). Universal and blocking primer mismatches limit the use of high-throughput DNA sequencing for the quantitative metabarcoding of arthropods. Mol. Ecol. resources 15, 819–830. doi: 10.1111/1755-0998.12355
Piñol J., Senar M. A., Symondson W. O. C. (2019). The choice of universal primers and the characteristics of the species mixture determine when DNA metabarcoding can be quantitative. Mol. Ecol. 28, 407–419. doi: 10.1111/mec.14776
Poyntz-Wright I. P., Harrison X. A., Pedersen S., Tyler C. R. (2024). Effectiveness of eDNA for monitoring riverine macroinvertebrates. Sci. Total Environ. 941, 173621. doi: 10.1016/j.scitotenv.2024.173621
Qin F., Amyot M., Bertolo A. (2023). The relationship between zooplankton vertical distribution and the concentration of aqueous Hg in boreal lakes: A comparative field study. Sci. Total Environ. 858, 159793. doi: 10.1016/j.scitotenv.2022.159793
Rees H. C., Maddison B. C., Middleditch D. J., Patmore J. R. M., Gough K. C. (2014). REVIEW: The detection of aquatic animal species using environmental DNA – a review of eDNA as a survey tool in ecology. J. Appl. Ecol. 51, 1450–1459. doi: 10.1111/1365-2664.12306
Rodríguez L. P., Granata A., Guglielmo L., Minutoli R., Zagami G., Brugnano C. (2013). Spring rotifer community structure in the Alcantara River (Sicily, Italy), using different mesh size nets: relation to environmental factors. Ann. Limnol. - Int. J. Lim. 49, 287–300. doi: 10.1051/limn/2013061
Schroeder A., Stanković D., Pallavicini A., Gionechetti F., Pansera M., Camatti E. (2020). DNA metabarcoding and morphological analysis - Assessment of zooplankton biodiversity in transitional waters. Mar. Environ. Res. 160, 104946. doi: 10.1016/j.marenvres.2020.104946
Shannon C. E. (1948). A mathematical theory of communication. Bell Syst. Tech. J. 27, 3–55. doi: 10.1002/j.1538-7305.1948.tb01338.x
Shannon P., Markiel A., Ozier O., Baliga N. S., Wang J. T., Ramage D., et al. (2003). Cytoscape: a software environment for integrated models of biomolecular interaction networks. Genome Res. 13, 2498–2504. doi: 10.1101/gr.1239303
Shao Q., Zhu Y., Dai M., Lin X., Zhou C., Yan X. (2020). Zooplankton community size-structure change and mesh size selection under the thermal stress caused by a power plant in a semi-enclosed bay. Bell Syst. Tech. J. 39, 62–70. doi: 10.1007/s13131-020-1634-9
Shen Y., Zhang Y., Zhou X., Li Q., Zhang J., Cheng R., et al. (2024). Environmental DNA metabarcoding revealing the distinct responses of phytoplankton and zooplankton to cascade dams along a river-way. Ecol. Indic. 166, 112545. doi: 10.1016/j.ecolind.2024.112545
Skjoldal H. R., Wiebe P. H., Postel L., Knutsen T., Kaartvedt S., Sameoto D. D. (2013). Intercomparison of zooplankton (net) sampling systems: Results from the ICES/GLOBEC sea-going workshop. Prog. Oceanogr. 108, 1–42. doi: 10.1016/j.pocean.2012.10.006
Song J., Liang D. (2023). Community structure of zooplankton and its response to aquatic environmental changes based on eDNA metabarcoding. J. Hydrol. 622, 129692. doi: 10.1016/j.jhydrol.2023.129692
Sun C., Zhao Y., Li H., Dong Y., MacIsaac H. J., Zhan A. (2015). Unreliable quantitation of species abundance based on high-throughput sequencing data of zooplankton communities. Aquat. Biol. 24, 9–15. doi: 10.3354/ab00629
Taberlet P., Coissac E., Pompanon F., Brochmann C., Willerslev E. (2012). Towards next-generation biodiversity assessment using DNA metabarcoding. Mol. Ecol. 21, 2045–2050. doi: 10.1111/j.1365-294X.2012.05470.x
Takahara T., Minamoto T., Yamanaka H., Doi H., Kawabata Z. i. (2012). Estimation of fish biomass using environmental DNA. PloS One 7, e35868. doi: 10.1371/journal.pone.0035868
Tang C. Q., Leasi F., Obertegger U., Kieneke A., Barraclough T. G., Fontaneto D. (2012). The widely used small subunit 18S rDNA molecule greatly underestimates true diversity in biodiversity surveys of the meiofauna. PNAS 109, 16208–16212. doi: 10.1073/pnas.1209160109
Tateda Y., Nishikawa J., Aoyama M., Takata H., Hamajima Y., Aono T. (2024). Status of the transfer state of 137Cs in zooplankton and surface water fish off Fukushima during 2018–2021. J. Environ. Radioact. 278, 107496. doi: 10.1016/j.jenvrad.2024.107496
Tittensor D. P., Mora C., Jetz W., Lotze H. K., Ricard D., Berghe E. V., et al. (2010). Global patterns and predictors of marine biodiversity across taxa. Nature 466, 1098–1101. doi: 10.1038/nature09329
Tokishita S.-i., Shibuya H., Kobayashi T., Sakamoto M., Ha J.-Y., Yokobori S.-i., et al. (2017). Diversification of mitochondrial genome of Daphnia galeata (Cladocera, Crustacea): Comparison with phylogenetic consideration of the complete sequences of clones isolated from five lakes in Japan. Gene 611, 38–46. doi: 10.1016/j.gene.2017.02.019
van der Heyde M., Bunce M., Nevill P. (2022). Key factors to consider in the use of environmental DNA metabarcoding to monitor terrestrial ecological restoration. Sci. Total Environ. 848, 157617. doi: 10.1016/j.scitotenv.2022.157617
Vörösmarty C. J., McIntyre P. B., Gessner M. O., Dudgeon D., Prusevich A., Green P., et al. (2010). Global threats to human water security and river biodiversity. Nature 467, 555–561. doi: 10.1038/nature09440
Voulvoulis N., Arpon K. D., Giakoumis T. (2017). The EU Water Framework Directive: From great expectations to problems with implementation. Sci. Total Environ. 575, 358–366. doi: 10.1016/j.scitotenv.2016.09.228
Wang L., Liu J., Bao Z., Ma X., Shen H., Chen J., et al. (2024). Predictable shifts in diversity and ecosystem function in phytoplankton and zooplankton communities along thermocline stratification intensity continua. Sci. Total Environ. 912, 168981. doi: 10.1016/j.scitotenv.2023.168981
Wang Z., Wang Q., Wang J., Wei H., Qian J., Zhang Y., et al. (2022). Evaluation of the control effect of bighead carp and silver carp on cyanobacterial blooms based on the analysis of differences in algal digestion processes. J. Clean Prod. 375, 134106. doi: 10.1016/j.jclepro.2022.134106
Wang Y., Wu N., Liu G., Mu H., Gao C., Wang Y., et al. (2023). Incorporating functional metrics into the development of a diatom-based index of biotic integrity (D-IBI) in Thousand Islands Lake (TIL) catchment, China. Ecol. Indic. 153, 110405. doi: 10.1016/j.ecolind.2023.110405
Wu S., Xiong J., Yu Y. (2015). Taxonomic resolutions based on 18S rRNA genes: A case study of subclass copepoda. PloS One 10, e0131498. doi: 10.1371/journal.pone.0131498
Xie R., Zhao G., Yang J., Wang Z., Xu Y., Zhang X., et al. (2021). eDNA metabarcoding revealed differential structures of aquatic communities in a dynamic freshwater ecosystem shaped by habitat heterogeneity. Environ. pollut. 201, 111602. doi: 10.1016/j.envres.2021.111602
Xiong W., Ni P., Chen Y., Gao Y., Li S., Zhan A. (2019). Biological consequences of environmental pollution in running water ecosystems: A case study in zooplankton. Environ. pollut. 252, 1483–1490. doi: 10.1016/j.envpol.2019.06.055
Xu H., Zhang S., Ma G., Zhang Y., Li Y., Pei H. (2020). 18S rRNA gene sequencing reveals significant influence of anthropogenic effects on microeukaryote diversity and composition along a river-to-estuary gradient ecosystem. Sci. Total Environ. 705, 135910. doi: 10.1016/j.scitotenv.2019.135910
Xue Y., Chen H., Yang J. R., Liu M., Huang B., Yang J. (2018). Distinct patterns and processes of abundant and rare eukaryotic plankton communities following a reservoir cyanobacterial bloom. ISME J. 12, 2263–2277. doi: 10.1038/s41396-018-0159-0
Yang J., Zhang X. (2020). eDNA metabarcoding in zooplankton improves the ecological status assessment of aquatic ecosystems. Environ. Int. 134, 105230. doi: 10.1016/j.envint.2019.105230
Yoshida T., Urabe J., Elser J. J. (2003). Assessment of ‘top-down’ and ‘bottom-up’ forces as determinants of rotifer distribution among lakes in Ontario, Canada. Ecol. Res. 18, 639–650. doi: 10.1111/j.1440-1703.2003.00596.x
Zagami G., Brugnano C. (2013). Diel, seasonal and man-induced changes in copepod assemblages and diversity, with special emphasis on hyperbenthic calanoid species, in a Mediterranean meromictic system (Lake Faro). Mar. Freshw. Res. 64, 951–964. doi: 10.1071/MF12344
Zaiko A., Samuiloviene A., Ardura A., Garcia-Vazquez E. (2015). Metabarcoding approach for nonindigenous species surveillance in marine coastal waters. Mar. pollut. Bull. 100, 53–59. doi: 10.1016/j.marpolbul.2015.09.030
Zhai X., Zhang Y., Wang X., Xia J., Liang T. (2014). Non-point source pollution modelling using Soil and Water Assessment Tool and its parameter sensitivity analysis in Xin’anjiang catchment, China. Hydrol. Process. 28, 1627–1640. doi: 10.1002/hyp.9688
Zhang H., Huang X., Huang L., Bao F., Xiong S., Wang K., et al. (2018). Microeukaryotic biogeography in the typical subtropical coastal waters with multiple environmental gradients. Sci. Total Environ. 635, 618–628. doi: 10.1016/j.scitotenv.2018.04.142
Zhang Z., Li H., Shen W., Du X., Li S., Wei Z., et al. (2022). The large-scale spatial patterns of ecological networks between phytoplankton and zooplankton in coastal marine ecosystems. Sci. Total Environ. 827, 154285. doi: 10.1016/j.scitotenv.2022.154285
Zhang Z., Liu Q., Gao G., Shao J., Pan J., He G., et al. (2023). Integrating ecosystem services closely related to human well-being into the restoration and management of deep lakes facing multiple stressors: Lessons from long-term practice in Qiandao Lake, China. Sci. Total Environ. 902, 166457. doi: 10.1016/j.scitotenv.2023.166457
Zhao K., Song K., Pan Y., Wang L., Da L., Wang Q. (2017). Metacommunity structure of zooplankton in river networks: Roles of environmental and spatial factors. Ecol. Indic. 73, 96–104. doi: 10.1016/j.ecolind.2016.07.026
Zhao X., Xu H., Kang L., Zhu G., Paerl H. W., Li H., et al. (2024). Nitrate sources and transformations in a river-reservoir system: Response to extreme flooding and various land use. J. Hydrol. 638, 131491. doi: 10.1016/j.jhydrol.2024.131491
Zhou J., Qin B., Zhu G., Zhang Y., Gao G. (2020). Long-term variation of zooplankton communities in a large, heterogenous lake: Implications for future environmental change scenarios. Environ. Res. 187, 109704. doi: 10.1016/j.envres.2020.109704
Keywords: freshwater zooplankton diversity, community structure, seasonal dynamics, eDNA, microscopy, Qiandao Lake
Citation: Hao L, Xu X, Zhou Y, Liu D, Shao J, Pan J, He G, Hu Z and Liu Q (2025) Diversity and seasonal variation of zooplankton community in a large deep-water reservoir of Eastern China using eDNA and morphological methods. Front. Mar. Sci. 12:1509743. doi: 10.3389/fmars.2025.1509743
Received: 25 October 2024; Accepted: 09 January 2025;
Published: 27 January 2025.
Edited by:
Ylenia Carotenuto, Stazione Zoologica Anton Dohrns, ItalyCopyright © 2025 Hao, Xu, Zhou, Liu, Shao, Pan, He, Hu and Liu. This is an open-access article distributed under the terms of the Creative Commons Attribution License (CC BY). The use, distribution or reproduction in other forums is permitted, provided the original author(s) and the copyright owner(s) are credited and that the original publication in this journal is cited, in accordance with accepted academic practice. No use, distribution or reproduction is permitted which does not comply with these terms.
*Correspondence: Zhongjun Hu, empodUBzaG91LmVkdS5jbg==; Qigen Liu, cWdsaXVAc2hvdS5lZHUuY24=
Disclaimer: All claims expressed in this article are solely those of the authors and do not necessarily represent those of their affiliated organizations, or those of the publisher, the editors and the reviewers. Any product that may be evaluated in this article or claim that may be made by its manufacturer is not guaranteed or endorsed by the publisher.
Research integrity at Frontiers
Learn more about the work of our research integrity team to safeguard the quality of each article we publish.