 Rebekah Shunmugapandi
 Cait L. McCarry
 David McKee
 Catherine Mitchell
94% of researchers rate our articles as excellent or good
Learn more about the work of our research integrity team to safeguard the quality of each article we publish.
Find out more
ORIGINAL RESEARCH article
Front. Mar. Sci. , 05 March 2025
Sec. Ocean Observation
Volume 12 - 2025 | https://doi.org/10.3389/fmars.2025.1507638
This article is part of the Research Topic Advances in Remote Sensing Technologies for Ocean Ecology and Carbon Cycle View all 5 articles
The planktonic copepod, Calanus finmarchicus, plays a pivotal role in the Gulf of Maine (GoM) pelagic food web as a primary food source for many species, including the critically endangered North Atlantic right whale (NARW). Thus, observing C. finmarchicus on a Gulf-wide scale via satellite could be beneficial for understanding changes in the migration patterns of the NARW. This study investigated the application of ocean color remote sensing to detect the surface population levels of C. finmarchicus in the GoM. Using remote sensing reflectance data from the MODIS Aqua sensor, we processed enhanced RGB (eRGB) imagery to detect and quantify the presence of C. finmarchicus, which is identifiable by its red astaxanthin pigment. This study employed a refined approach from the method originally developed off the coast of Norway, which integrates eRGB imagery and radiative transfer modeling to generate optical anomaly maps that are used for quantifying surface C. finmarchicus concentrations in the GoM. We detected surface swarms of C. finmarchicus in the ocean color imagery and estimated their concentrations. However, due to the method’s reliance on astaxanthin/red pigment-based detection, other astaxanthin-rich red/brown plankton were misidentified as C. finmarchicus. While the approach presented is effective for identifying astaxanthin anomalies in ocean color and holds potential for quantifying the surface populations of C. finmarchicus, it requires local knowledge to accurately quantify the C. finmarchicus abundances.
Ocean color remote sensing has significantly advanced the monitoring of optically significant constituents (OSCs) in marine ecosystems, allowing for consistent, wide-scale observation of marine ecosystems, which has enhanced our understanding of the ocean environment over time and space (Groom et al., 2019). The core of ocean color remote sensing relies on understanding the interactions between light and OSCs in the water. These OSCs have distinct properties for absorbing and scattering light, which influences how light behaves in the marine environment (Dierssen and Randolph, 2013; Mascarenhas and Keck, 2018). Traditionally, OSCs are classified into three main groups: phytoplankton, colored dissolved organic matter (CDOM), and non-algal/inorganic particles (NAPs) (Dierssen and Randolph, 2013; Werdell et al., 2018). However, recent work has shown that the presence of pigments in organisms other than phytoplankton can also alter the optical characteristics of water, specifically the zooplankton Calanus finmarchicus (Basedow et al., 2019; McCarry et al., 2023).
C. finmarchicus is a lipid-rich calanoid copepod that is dominant in the Gulf of Maine (GoM) (Bigelow, 1926; Johnson et al., 2011; Ji et al., 2022). It is recognized as a foundation of the GoM pelagic food web by transferring primary production to higher-level consumers (Grieve et al., 2017; Renaud et al., 2018; Melle et al., 2014). C. finmarchicus is particularly important, as it forms the primary food source for the critically endangered planktivorous North Atlantic right whale (NARW) (Ross et al., 2023; Swaim et al., 2009; Michaud and Taggart, 2007). The NARW population is experiencing an increased mortality rate, with population numbers decreasing to less than 360 individuals in the last decade (Meyer-Gutbrod et al., 2021; Moore et al., 2021). The migration and calving rate of the NARW in the GoM are influenced by the availability of C. finmarchicus (Sorochan et al., 2021). Changes in the distribution of C. finmarchicus affect the migratory and distribution patterns of NARW (Record et al., 2019; Meyer-Gutbrod et al., 2021). Therefore, monitoring of C. finmarchicus is important for tracking and predicting the movement of NARW. Traditional shipboard and buoy methods of assessing C. finmarchicus abundance cannot provide continuous regional monitoring and are limited in scope for mapping spatial distribution; therefore, satellite observations could fill a gap in current observation strategies.
C. finmarchicus is often referred to as “red feed”; it synthesizes a red carotenoid, astaxanthin, from precursor pigments through its algal diet (Byron, 1982; Matsuno, 2001; Vilgrain et al., 2023). Due to this pigmentation, surface waters can appear red when C. finmarchicus is swarming (Basedow et al., 2019). These red surface swarms significantly influence the optical properties of water and are captured by satellite (Basedow et al., 2019; McCarry et al., 2023). Furthermore, C. finmarchicus concentrations have been estimated from satellite ocean color data for a swarm off the coast of Norway (McCarry et al., 2023). Thus, detecting the movement and quantifying the surface abundance of C. finmarchicus in the GoM using ocean color remote sensing could help track C. finmarchicus on a regional scale and aid in monitoring this keystone species.
In this study, we aim to refine the approach originally presented in McCarry et al. (2023) to estimate GoM surface C. finmarchicus concentrations. We examine the applicability of this refined approach and explore factors influencing surface C. finmarchicus concentrations in the GoM as detected by ocean color remote sensing.
In this study, we used satellite data from MODIS Aqua (Moderate Resolution Imaging Spectroradiometer on the Aqua satellite), chosen for its consistent long-term data record. We acquired daily Level 2 MODIS Aqua remote sensing reflectance [Rrs(λ)] data, with the 1-km resolution at nadir, from the National Aeronautics and Space Administration (NASA) Ocean Biology Distributed Active Archive Center (OB.DAAC; https://oceancolor.gsfc.nasa.gov/). We mapped each daily Level 2 scene employing the l2bin and l3mapgen tools available in the SeaDAS-OCSSW software version 8.3 (the NASA Ocean Biology Processing Group Science Software).
The GoM is an optically complex environment, and consequently, the atmospheric correction process can over-correct blue wavelengths, resulting in non-physical negative Rrs(λ) values or unrealistic spectral shapes. Thus, to ensure the quality of the Rrs(λ) dataset, we applied two quality control (QC) approaches. First, we removed all Rrs(λ) spectra that were negative at any wavelength. Second, we applied the Quality Water Index Polynomial (QWIP) method of Dierssen et al. (2022). QWIP is a quantitative metric approach and was developed to assess the quality of Rrs(λ) in the visible wavelength spectral range of 400–700 nm. The QWIP score is used to identify spectra that fall outside the general trends observed in aquatic optics for optically deep waters. For this study, Rrs(λ) spectra that fall outside the QWIP score of |0.2| were flagged to eliminate poorer quality spectra, as suggested by Dierssen et al. (2022).
The quality-controlled satellite Rrs(λ) were converted to enhanced RGB (eRGB) images using a standardized linear contrast image stretching method and gamma correction (McCarry et al., 2023). Briefly, the eRGB image processing procedure standardizes the RGB bands by applying a standardized stretch technique and a gamma correction specifically for the blue band. The standardized stretch range had a minimum of zero and a maximum taken as the 90th percentile of each band in a global in situ dataset of Rrs(λ) (Valente et al., 2022). This approach was implemented to resolve visual inconsistencies between individual satellite images. When creating an RGB image, typically each color band is scaled based on the maximum and minimum values present in the given image, resulting in different scalings being used for each image (McCarry et al., 2023). By standardizing the range over which each band is scaled, different images are directly comparable. This is crucial for accurate analysis and comparison of satellite data, especially when dealing with a large number of satellite images. Following McCarry et al. (2023), we generated eRGB images using three Rrs(λ) wavebands from the quality-controlled satellite Rrs(λ) data: 443 nm for the blue channel, 488 nm for the green channel, and 555 nm for the red channel. This approach provides standardized eRGB data that are consistent across the whole dataset.
To verify the presence of surface patches in eRGB satellite imagery as C. finmarchicus, we utilized in situ abundance data of C. finmarchicus stage V–VI from the Continuous Plankton Recorder (CPR) collected in the GoM, sourced from a CPR database maintained by the National Oceanic and Atmospheric Administration (NOAA). The CPR is towed horizontally behind ships of opportunity, enabling continuous sampling of surface zooplankton (Richardson et al., 2006), making it an ideal dataset to compare with surface satellite observations. The CPR program has generated a long-term (1961–2013) and standardized database of marine zooplankton counts, which includes C. finmarchicus (Parent et al., 2012). The GoM CPR transect spans 450 km across the GoM, extending from Massachusetts to Nova Scotia in a west–east direction.
The initial identification of C. finmarchicus patches in eRGB satellite imagery involved comparing in situ CPR C. finmarchicus stage V–VI and eRGB satellite data from 2003 to 2013. We selected this timeframe due to the overlap of data availability from both CPR and MODIS Aqua satellite data. We focused initially on identifying high-abundance C. finmarchicus patches by selecting the highest 1% of the CPR values. From a dataset of 1,143 values, this resulted in 85 data points above a C. finmarchicus abundance of 10,000 individuals m−3 (ind m−3). We chose this threshold to enhance computational efficiency while ensuring the initial identification of C. finmarchicus presence. Based on the time and location of the top 1% C. finmarchicus abundance observations, we identified potential patches in the satellite eRGB imagery. We checked imagery from the same day of the CPR observation in the region surrounding the location of the observation.
In this study, we aim to refine the method presented by McCarry et al. (2023) to estimate the surface abundance of C. finmarchicus. This approach relies on satellite ocean color observations; thus, due to the diel vertical migration undergone by C. finmarchicus, the method presented provides a snapshot of the surface community in the middle of the day, rather than an estimate of the full community. Here, we give a brief overview of the McCarry et al. (2023) approach (which we denote as MC23 for brevity) and highlight the areas for refinement.
The core of the MC23 remote sensing method is based on two look-up tables (LUTs). These LUTs were created using a Case 2 (Morel and Prieur, 1977) bio-optical model based on Lo Prejato et al. (2020) and using specific inherent optical properties from Bengil et al. (2016) and Basedow et al. (2019). In the first LUT, referred to as the “Case 2” LUT, the bio-optical model contained the OSCs of phytoplankton chlorophyll-a and algal biogenic detritus (denoted as CHL), CDOM, and inorganic mineral suspended solids (MSS). The second LUT is the same as the first, except that it includes C. finmarchicus and is referred to as the “Case 2 + C. finmarchicus” LUT. For each LUT, typical ranges of concentrations for each of the OSCs were used, and Rrs(λ) was calculated using the radiative transfer software EcoLight v5.3 (Mobley and Sundman, 2016). Finally, Rrs(λ) spectra were converted to eRGB values in the same manner as described above for the satellite data. Thus, the final LUTs contained OSC concentrations with corresponding eRGB values.
In MC23, for one eRGB satellite image, every pixel was compared with the eRGB values in the LUTs (Case 2 and Case 2 + C. finmarchicus). The comparison between the satellite and LUTs eRGB was quantified using the Delta E 2000 () algorithm, which is based on the CIE2000 model developed by the International Commission on Illumination (CIE). is a standard way of quantifying the difference between two colors in the L * a * b (where L = lightness, a = red–green axis, and b = yellow–blue axis) color space. values range from 0 to 100, where low value indicates that the two colors are similar, while a higher value indicates a high difference. Therefore, in this study and MC23, a “best match” between a satellite pixel and the LUT was taken as the lowest value (). For a given satellite image, a map of acts as an anomaly map: low values indicate the satellite pixels are well described by the bio-optical model (i.e., there is a low anomaly between the bio-optical model and the satellite observation), and conversely, higher values indicate a less well described (more anomalous) system. MC23 showed that using the Case 2 + C. finmarchicus LUT reduced the anomaly (i.e., the values were lower) compared to the Case 2 LUT in a dense patch of C. finmarchicus. Further, the C. finmarchicus concentration was then estimated from the LUT value that corresponded to the for every pixel.
In this study, we used an updated version of the Case 2 + C. finmarchicus LUT from MC23, in which MSS values are varied, instead of the constant MSS value of 0.03 g m−3. The updated version of the Case 2 + C. finmarchicus LUT has 4,410 entries, an increase from 1,176 entries (in MC23). In this paper, all future mentions of the Case 2 + C. finmarchicus LUT refer to this updated LUT (rather than the original in MC23). With a larger LUT, the process of comparing every pixel with every eRGB value in the LUT becomes computationally more expensive. In addition, there is the potential for even further increases in computational time and resources as we start to explore larger numbers of satellite images or create a finer-resolution LUT (i.e., more concentrations for the OSC). Thus, we explored the effectiveness of using a threshold-based approach. Here, we compared a given satellite image to the Case 2 LUT (which has a total of 1,008 entries, as in MC23). The anomaly map then highlights the regions where the Case 2 model does not sufficiently describe the system. However, where the anomaly is low, the Case 2 model is considered sufficient. Therefore, only pixels with a Case 2 value exceeding the implemented threshold had the updated Case 2 + C. finmarchicus LUT applied. Thus, with this approach, we only applied the Case 2 + C. finmarchicus LUT to a subset of the pixels, not the whole image, and for those pixels, we were able to estimate the C. finmarchicus concentration based on the value from the LUT that corresponds to the , as in MC23.
We detected potential patches of C. finmarchicus in the eRGB imagery based on the highest 1% of the C. finmarchicus abundances in the CPR data. Figure 1 illustrates an example: the detection of a potential C. finmarchicus patch in eRGB imagery taken on June 17, 2009, identified through comparison with in situ CPR C. finmarchicus data. The eRGB image shows a region of red/brown pixels, potentially indicative of a C. finmarchicus patch (McCarry et al., 2023). The recorded CPR C. finmarchicus abundance at 19:33 local time (EST) was 21,402 ind m−3 at the location depicted by a white star in Figure 1. Thus, the high CPR observation coincides with the potential patch of C. finmarchicus visible in the satellite imagery. The match between the eRGB satellite imagery and the CPR C. finmarchicus data provides evidence supporting the results of McCarry et al. (2023): dense patches of C. finmarchicus can be detected in eRGB imagery. Further, this demonstrates the applicability of the MC23 approach in a new region.
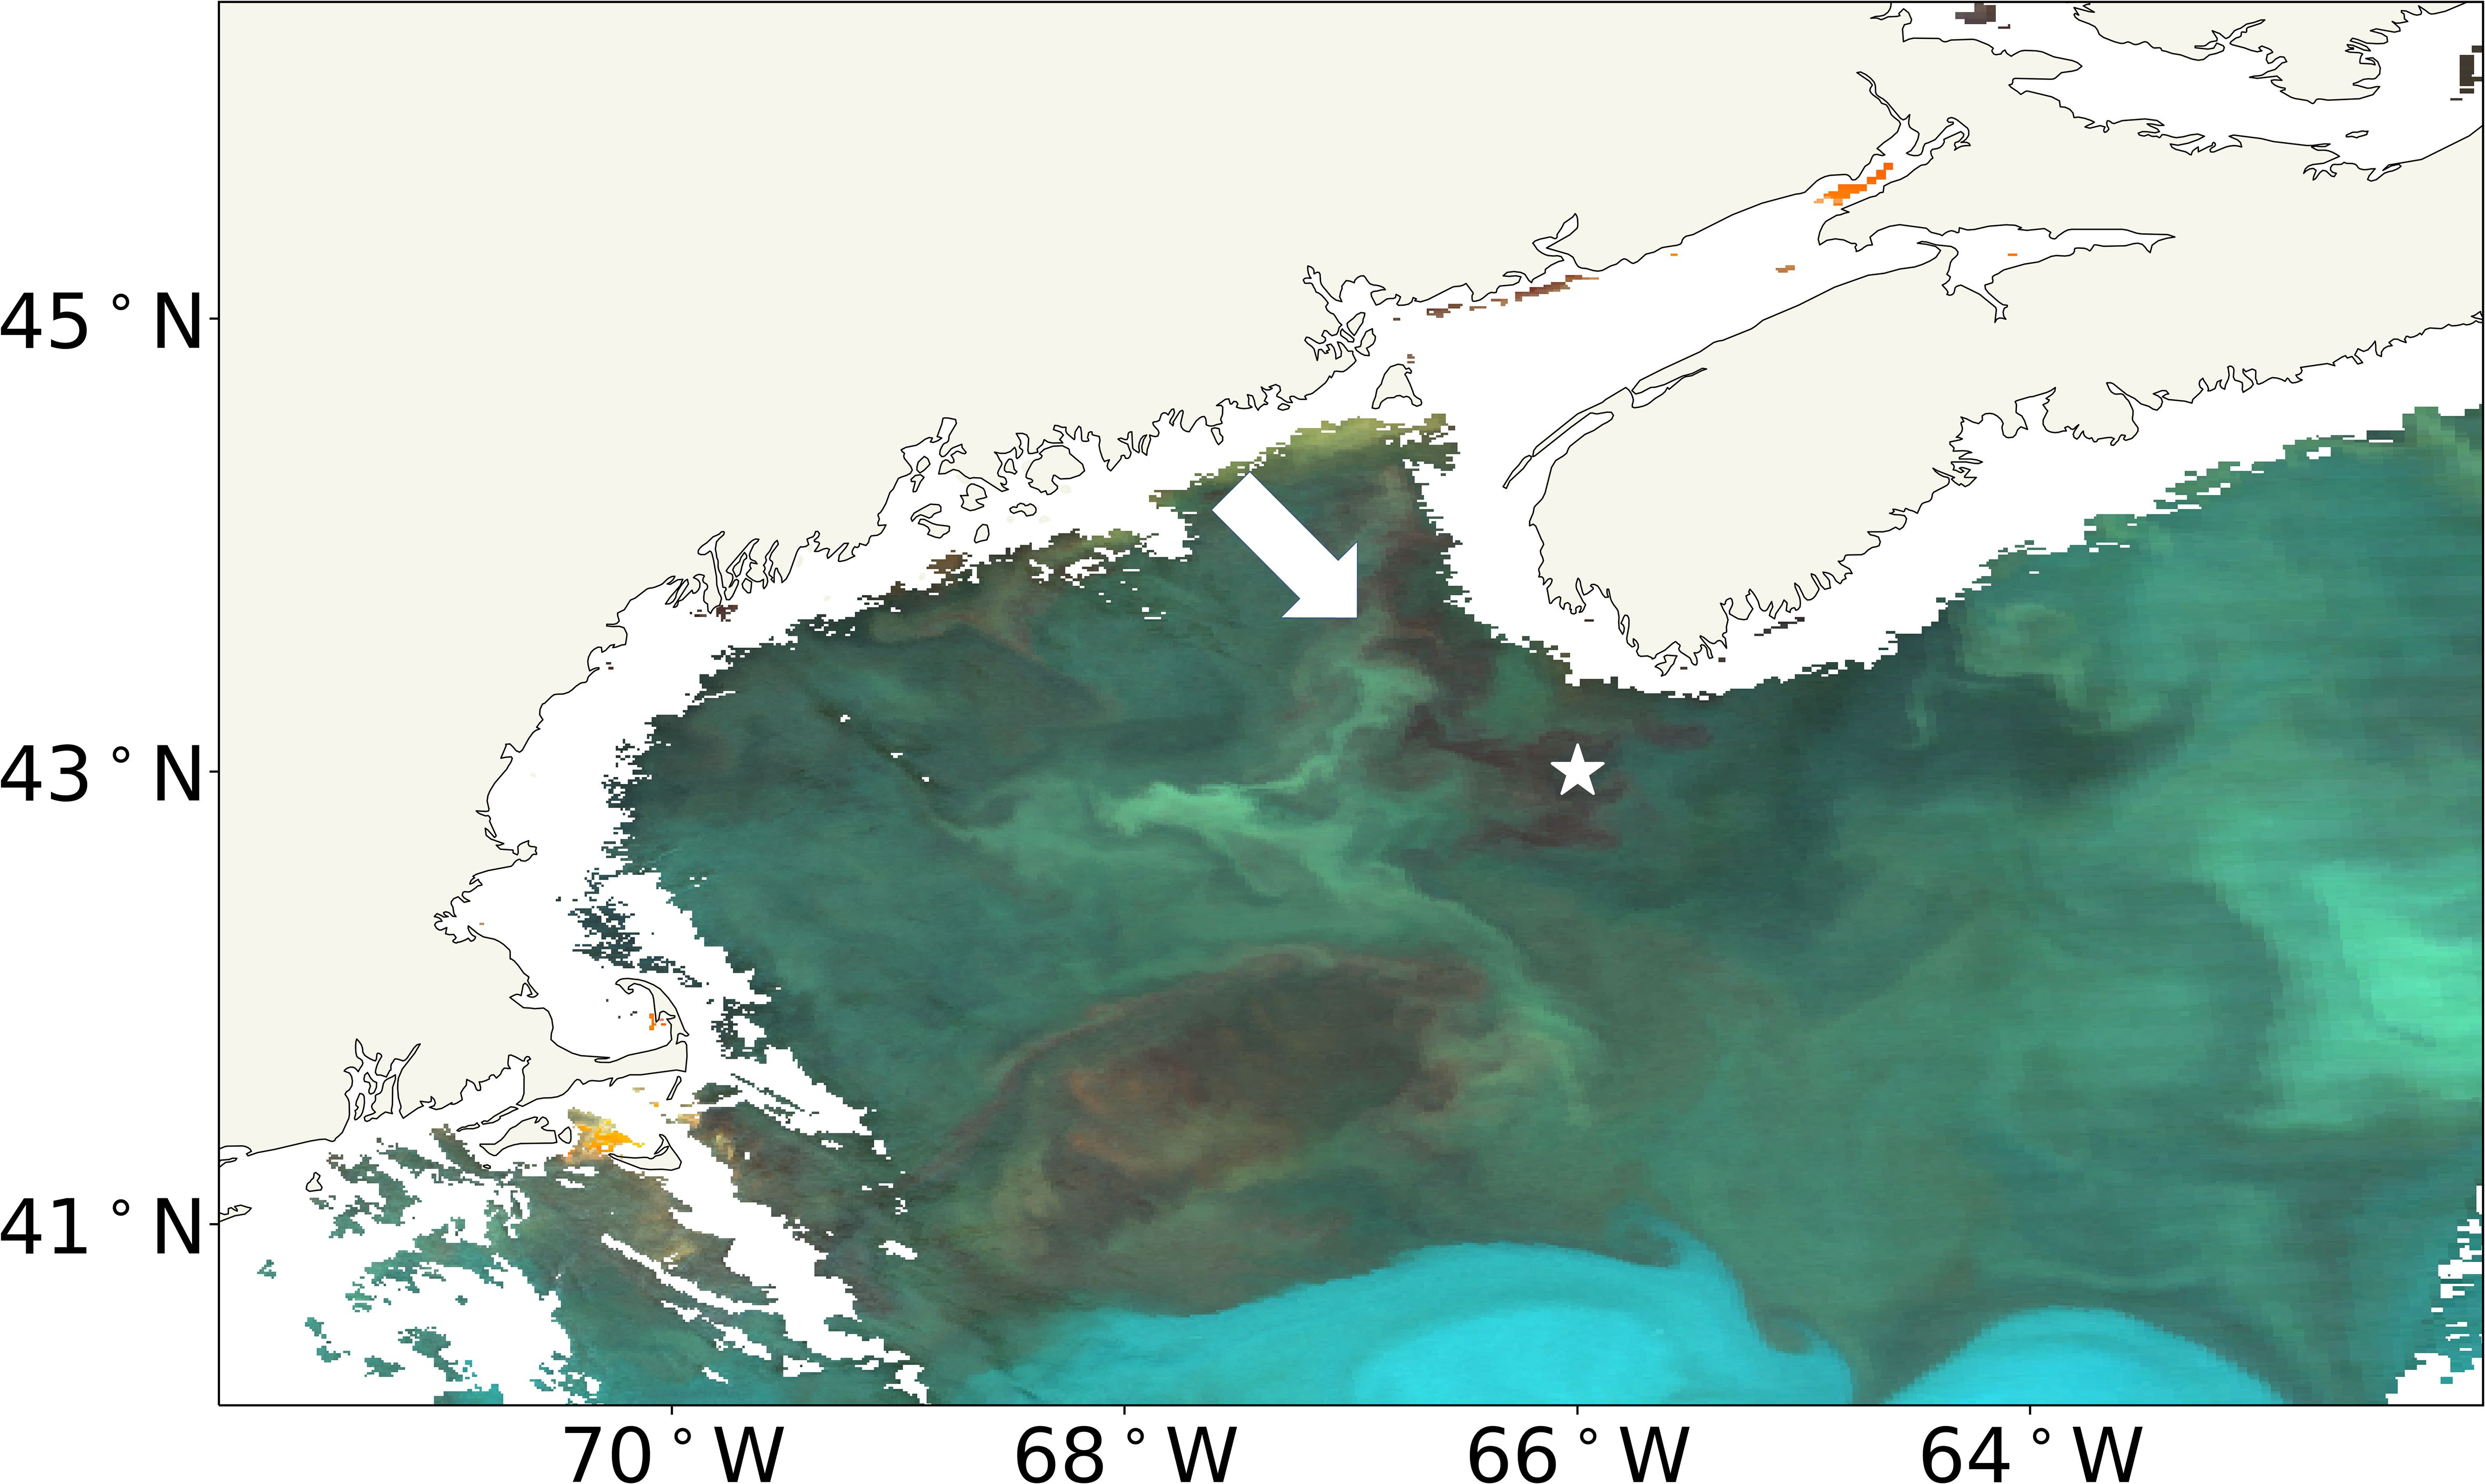
Figure 1. MODIS Aqua eRGB image of the GoM from June 17, 2009. The white star represents the in situ CPR observation with high Calanus finmarchicus abundance on the same day as the satellite image, and the white arrow points to the region of red/brown pixels indicative of a C. finmarchicus patch. eRGB, enhanced RGB; GoM, Gulf of Maine; CPR, Continuous Plankton Recorder.
To investigate the threshold limit to use for the threshold-based approach, we binned the Case 2 values (see Figure 2). Different threshold values are used for defining a color difference (i.e., the ) depending on the application. In the printing industry, colors are considered visually consistent within a threshold of 4 (Liu et al., 2012). Therefore, to test this threshold for this particular application, we binned values of 0–4 within the first bin, and then we binned higher values in steps of 2.
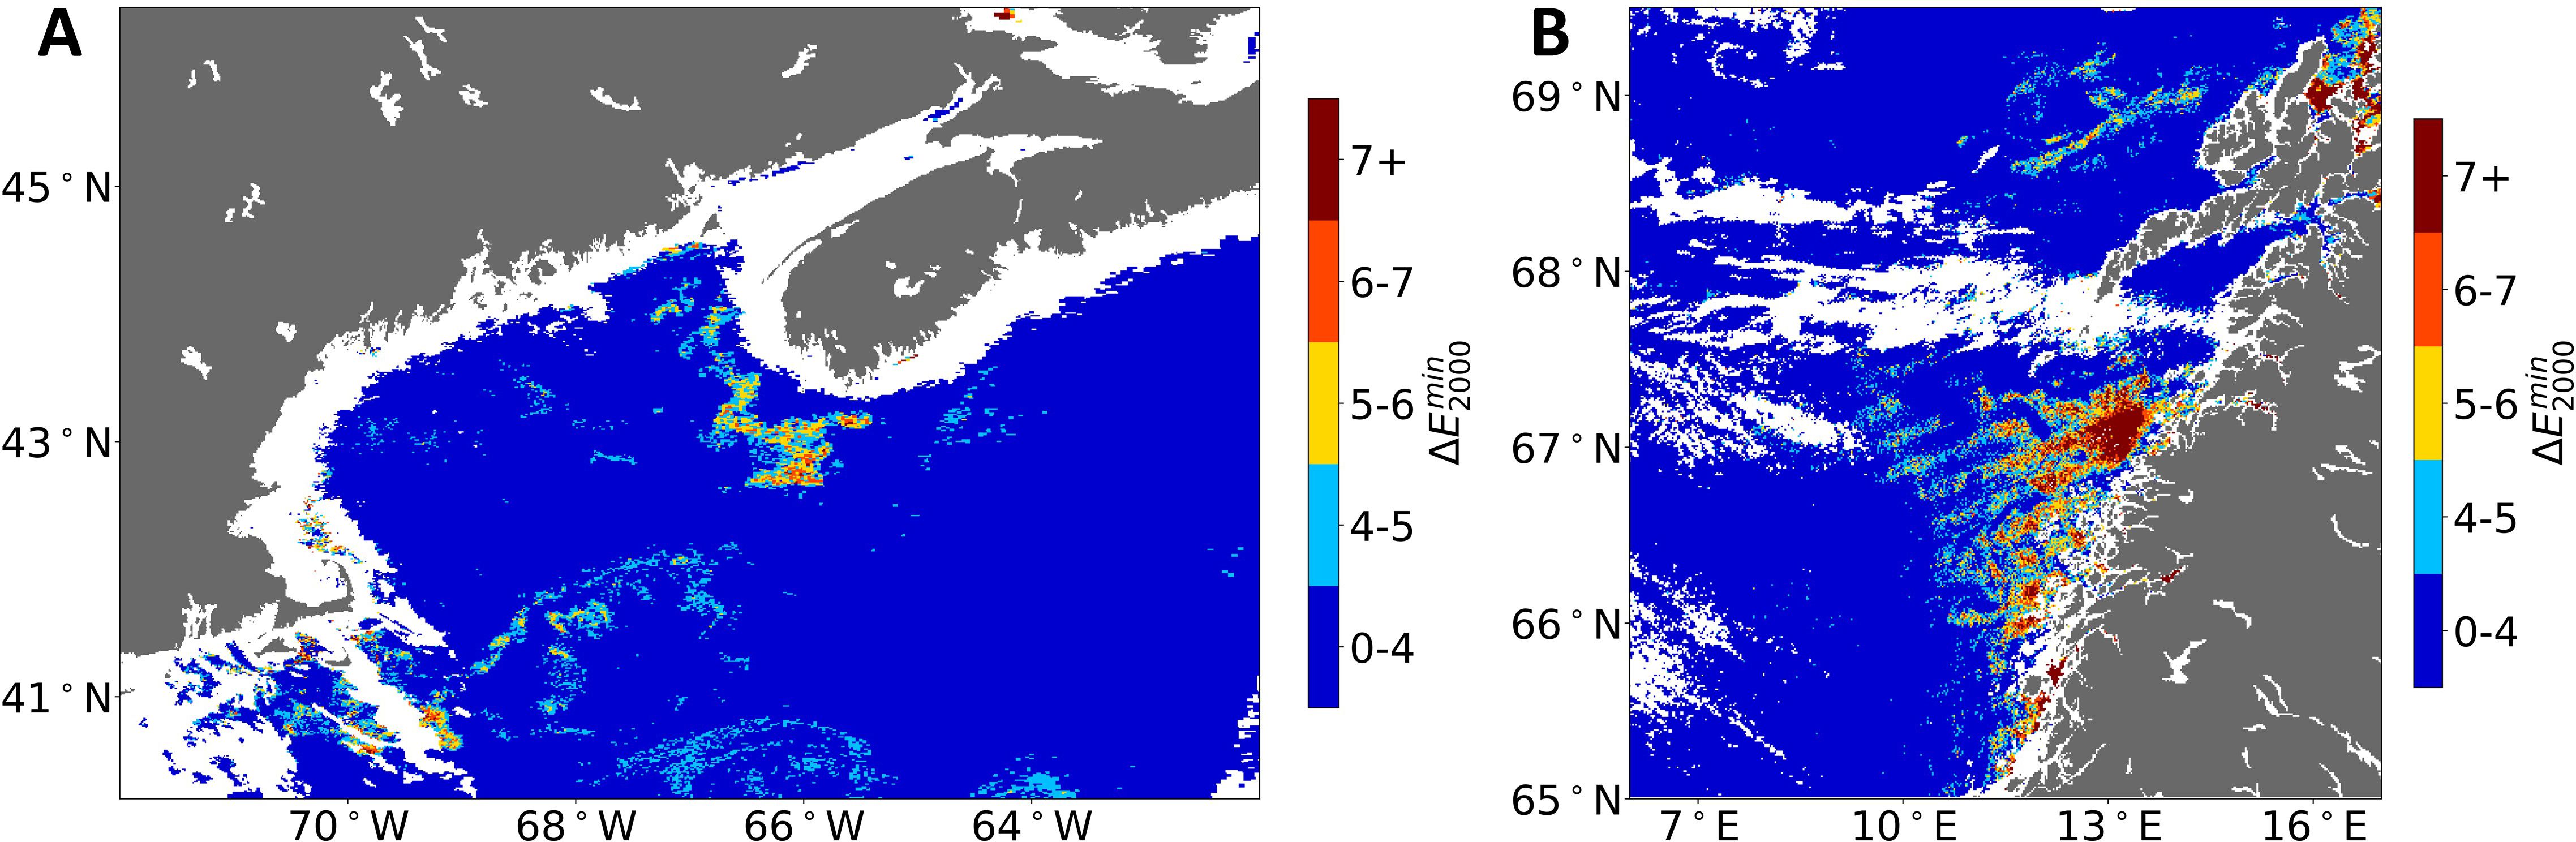
Figure 2. Binned Case 2 anomaly map of (A) GoM (same image as shown in Figure 1); (B) off the coast of Norway (same image used in McCarry et al., 2023). GoM, Gulf of Maine.
In Figure 2, regions in the GoM and off the coast of Norway identified as potential C. finmarchicus patches show values larger than 4 (see Figure 1 and figure 10 of McCarry et al., 2023). These higher values indicate a greater deviation between the “best-matched” satellite and Case 2 LUT eRGB values. This deviation suggests that the pixels remain anomalous and are not optically resolved.
For the GoM image, we applied the Case 2 + C. finmarchicus LUT to the pixels where the Case 2 ≥4.
Figure 3 shows a refined version of the anomaly map, which combines values from the Case 2 LUT and the Case 2 + C. finmarchicus LUT. This refined binned anomaly map shows a lower across the entire image. The reduced values suggest that incorporating the C. finmarchicus component into the LUT resolved the anomalies in the regions where the Case 2 values were ≥4. Thus, the binned anomaly maps indicate that a Case 2 threshold of ≥4 typically identifies pixels that are anomalous due to C. finmarchicus.
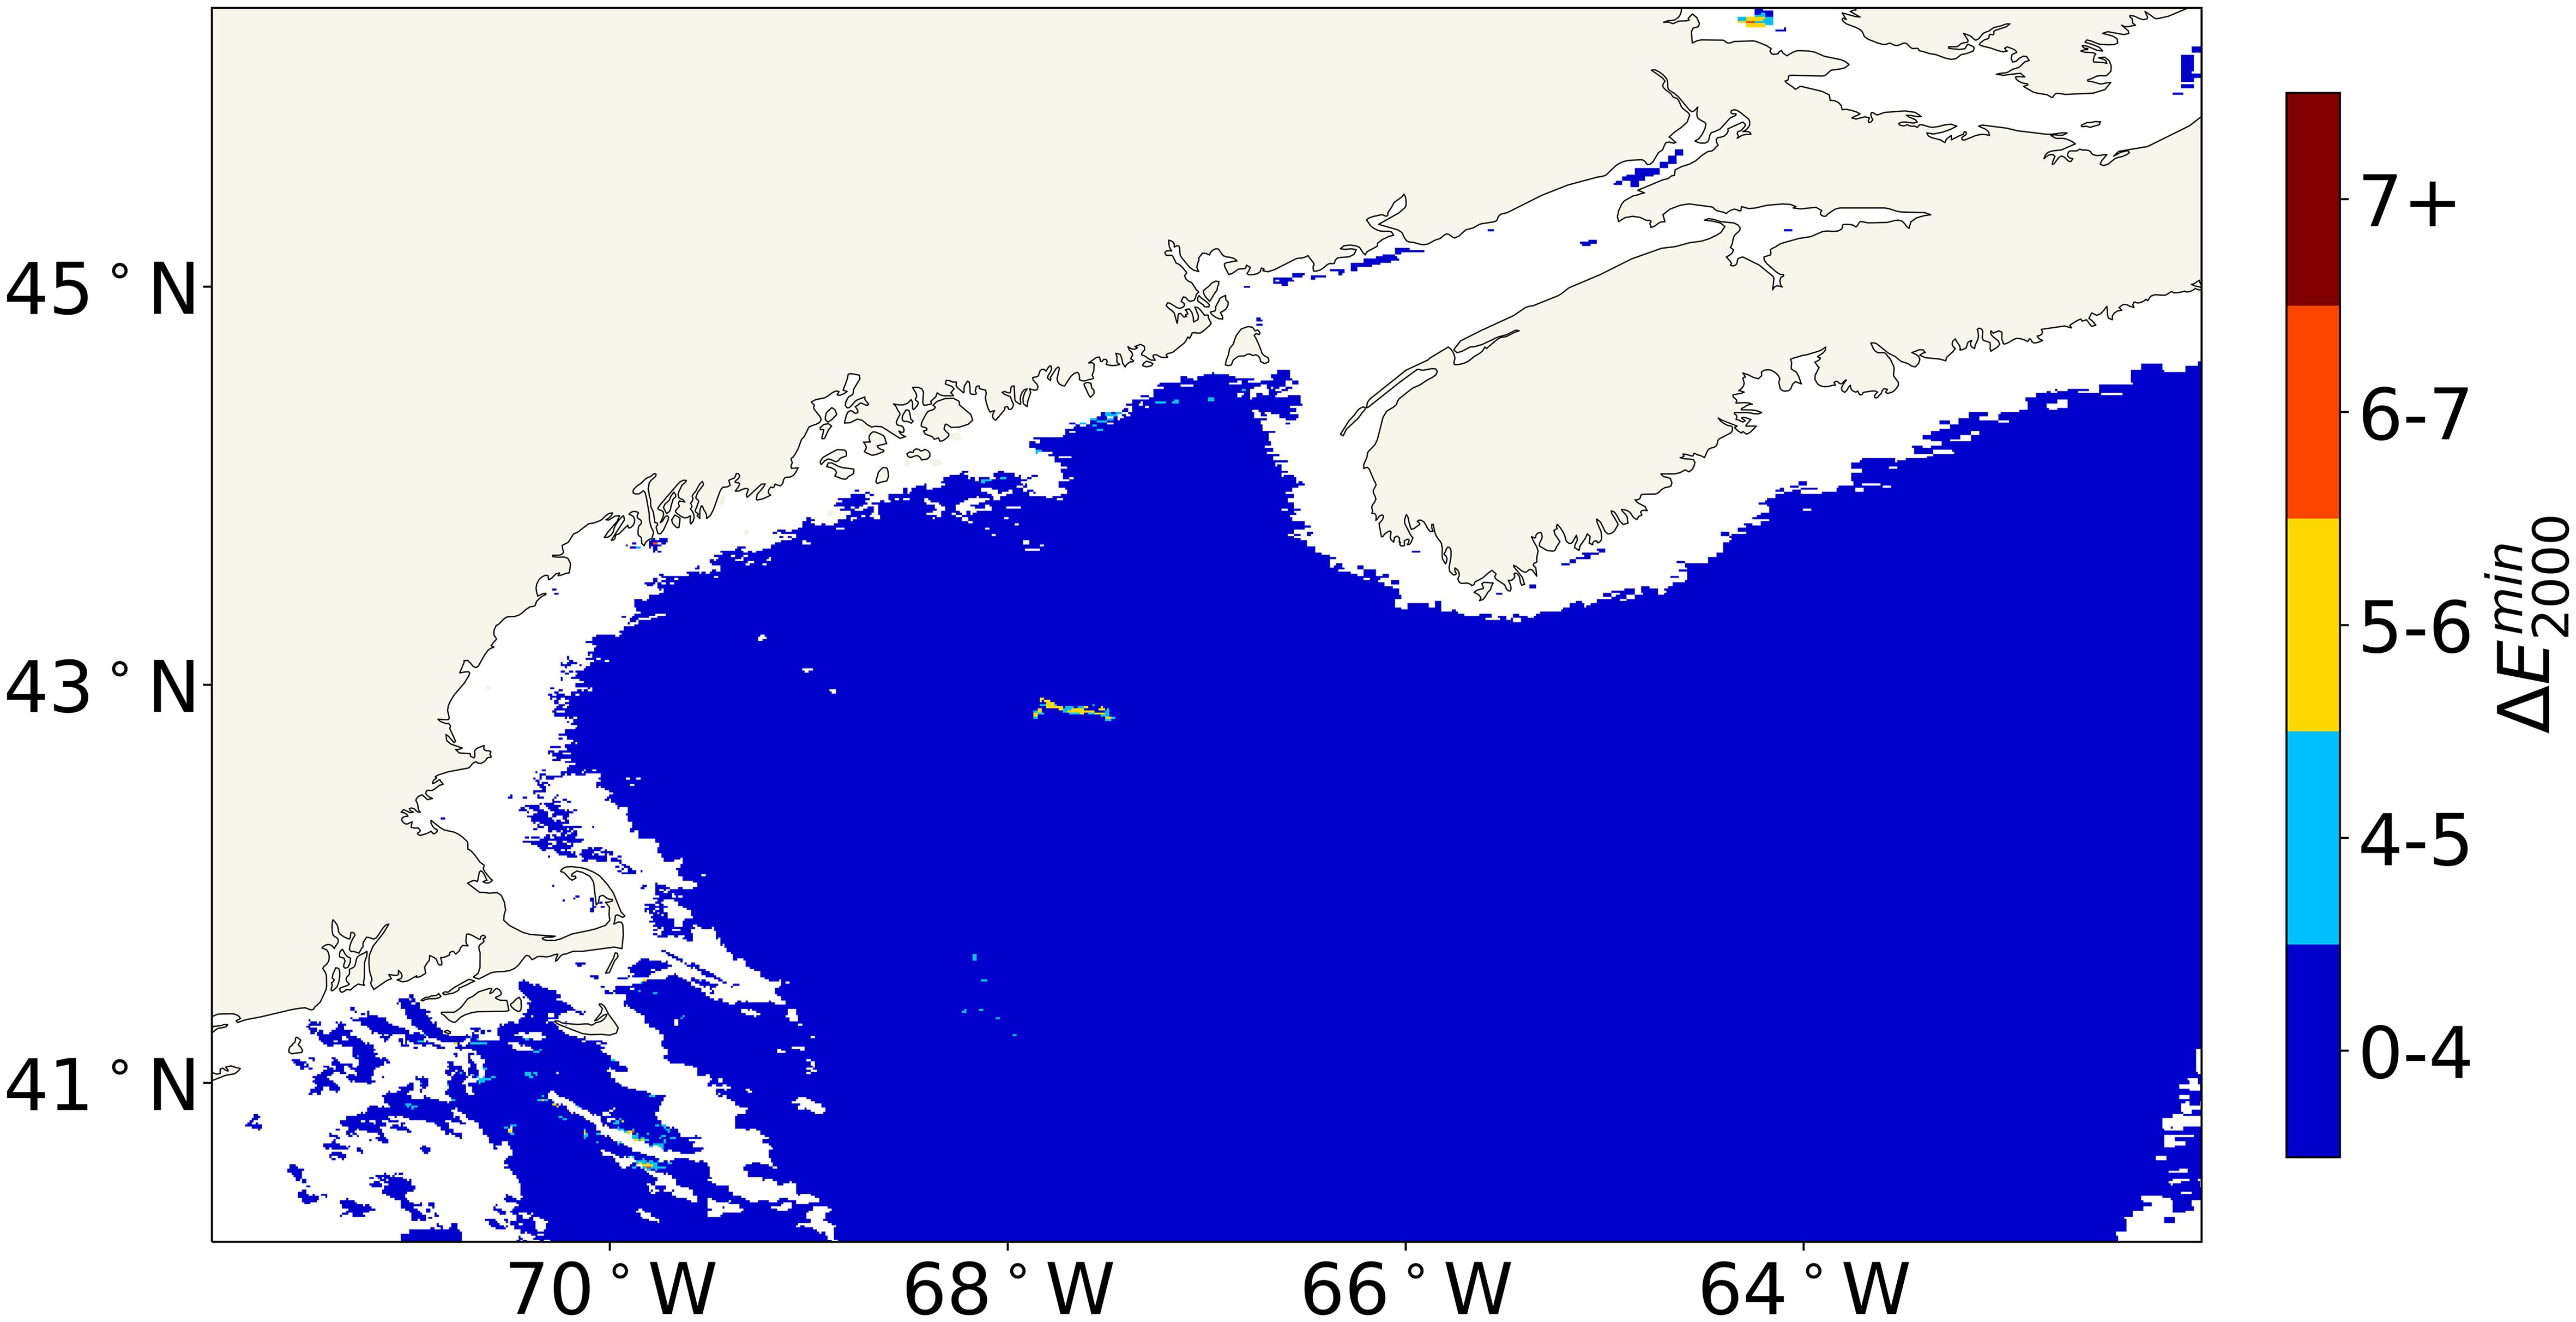
Figure 3. Same as Figure 2A, except that the Case 2 + Calanus finmarchicus LUT was applied to the pixels where the Case 2 ≥ 4. LUT, look-up table.
Surface C. finmarchicus concentrations were quantified using the threshold-based approach, where each satellite pixel was first compared to the Case 2 LUT, and for any pixels where was above the threshold (≥4), the Case 2 + C. finmarchicus LUT was used. The surface concentration of C. finmarchicus was then estimated only for those pixels where the Case 2 + C. finmarchicus LUT was used, and the C. finmarchicus concentration was taken from the combination of OSCs that produced the identified value. Using this approach on the MODIS Aqua eRGB imagery shown in Figure 1, Gulf-wide surface C. finmarchicus concentrations (Figure 4) were estimated, with peak concentrations of 150,000 ind m−3 within the patch.
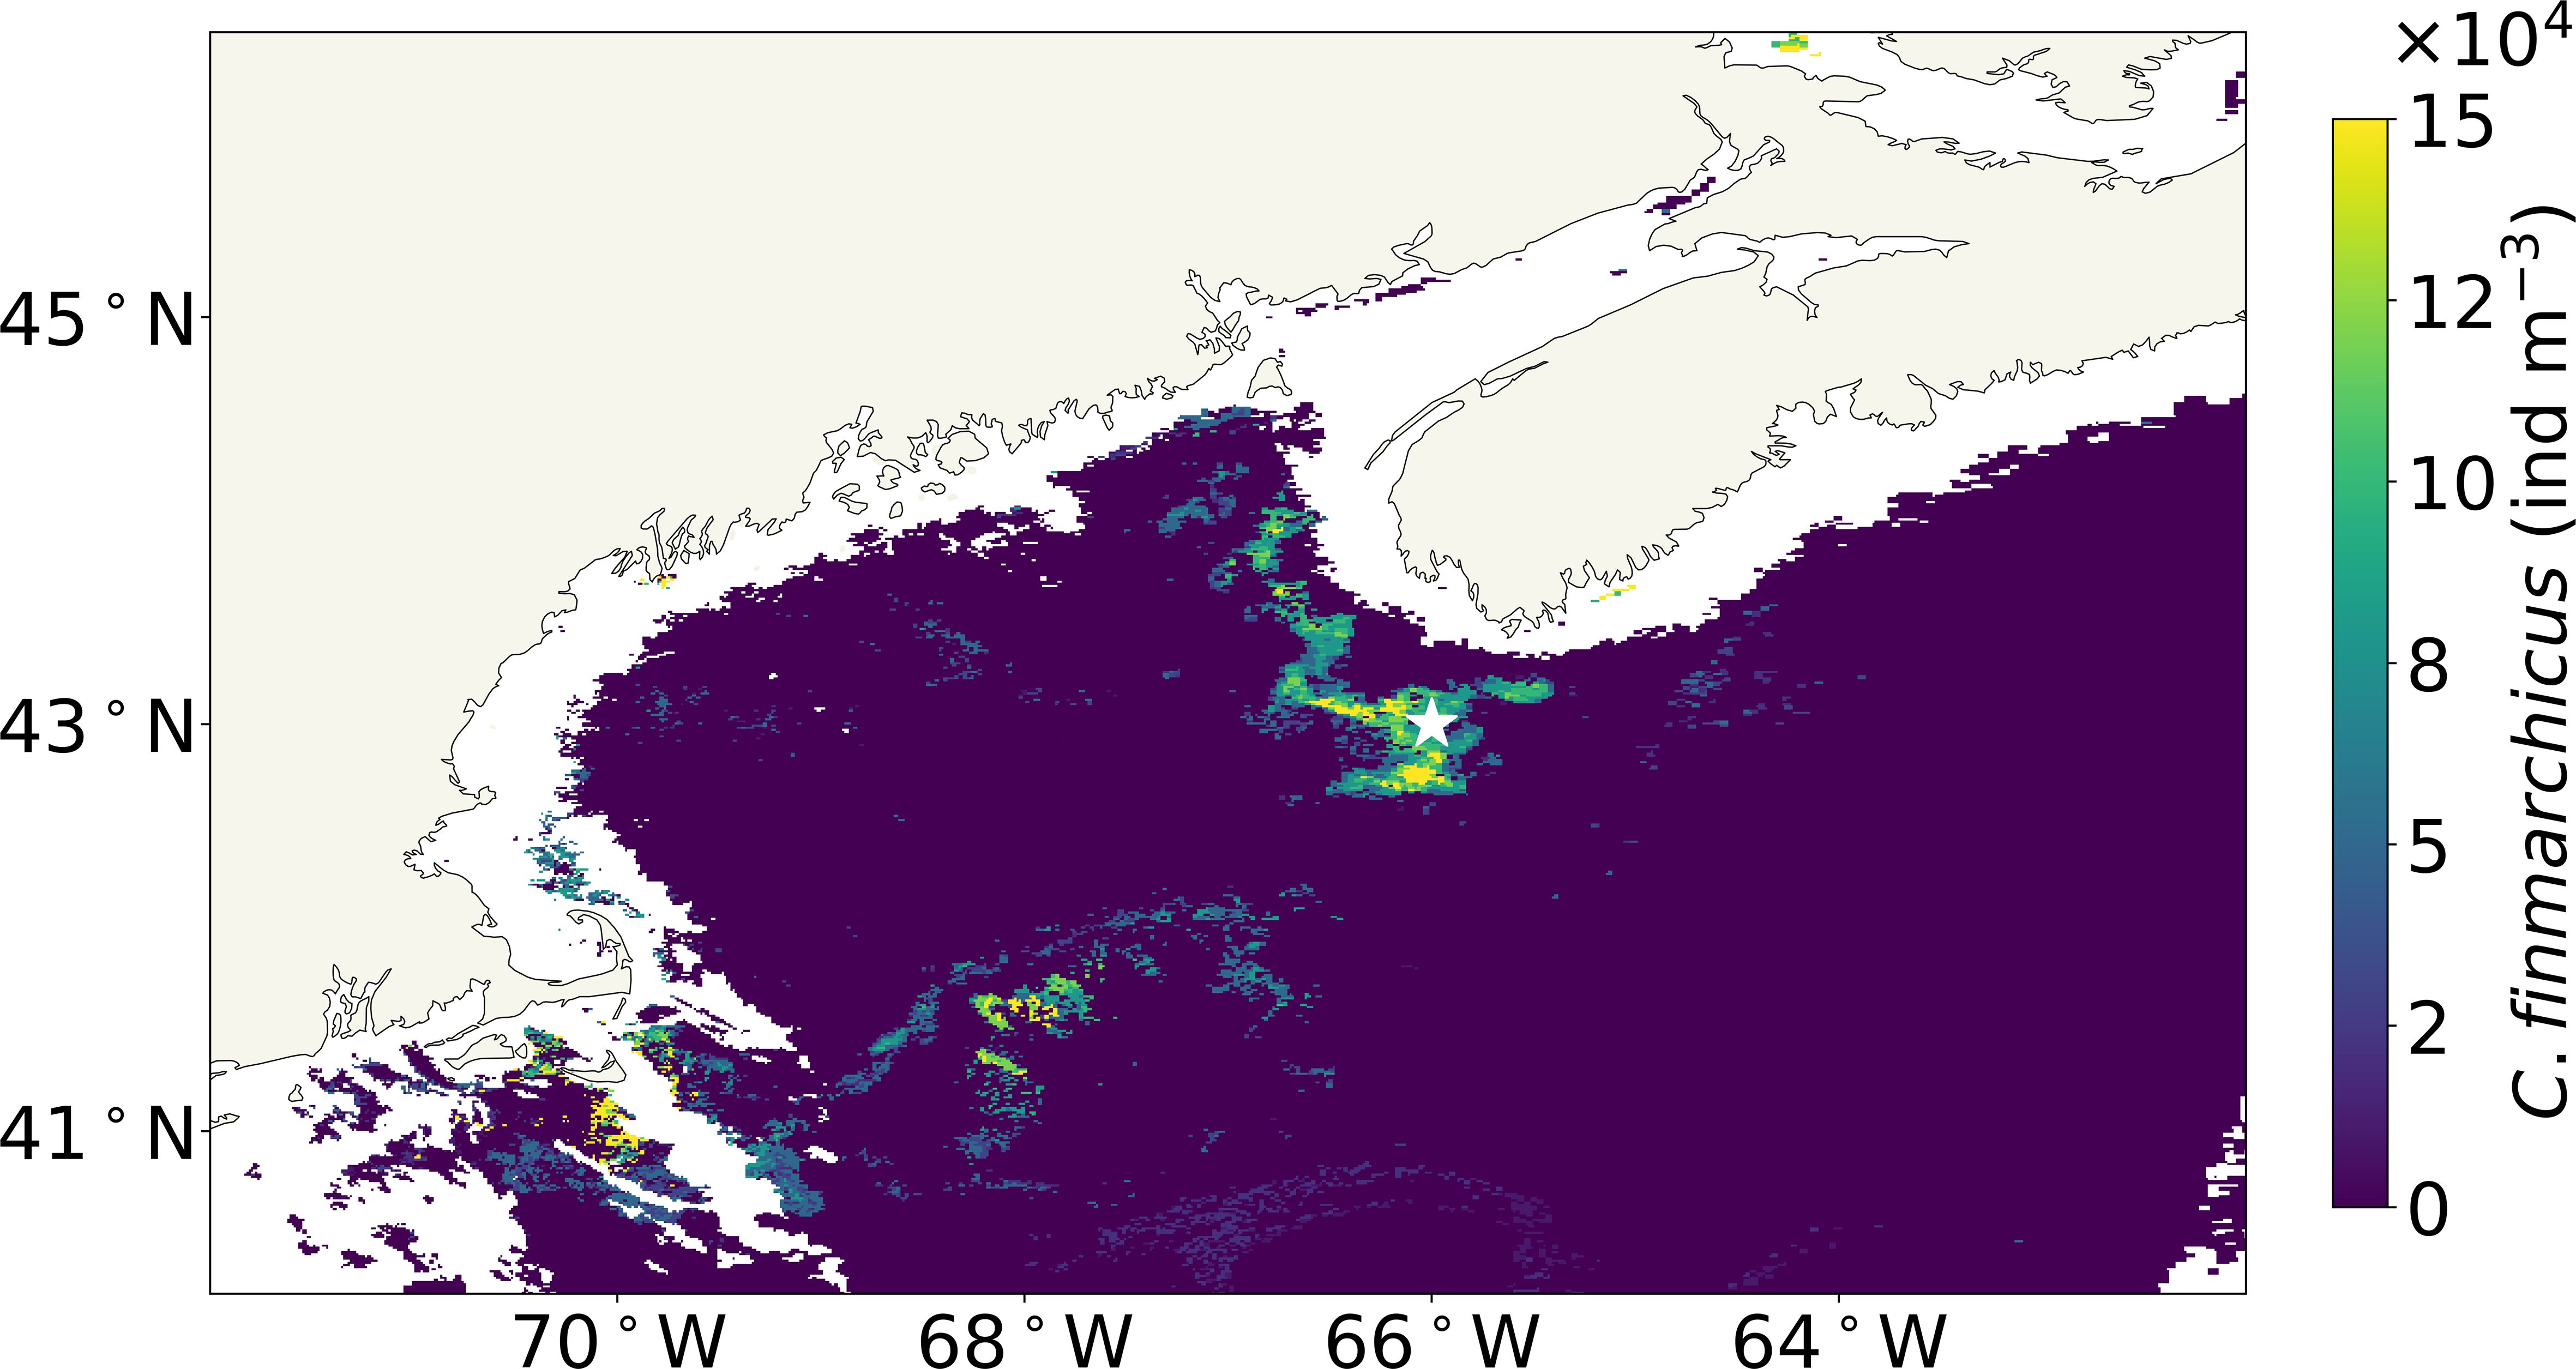
Figure 4. Surface concentrations of Calanus finmarchicus in the GoM estimated using the threshold-based approach on June 17, 2009, with the star indicating the location of the in situ CPR observation. GoM, Gulf of Maine; CPR, Continuous Plankton Recorder.
The GoM is known to have a wide variety of zooplankton species, many of which have the pigment astaxanthin, for example, Centropages and krill (Bandaranayake and Gentien, 1982; Koomyart et al., 2017). As the MC23 method is based on the detection of astaxanthin, other astaxanthin or red-colored species may mistakenly be detected as C. finmarchicus. To explore this potential misidentification, we examined satellite images at times of the year when C. finmarchicus is not typically present in the surface waters of the GoM but other astaxanthin or red-colored species are. Here, we present two case studies, highlighting the effect on C. finmarchicus abundance estimates from other astaxanthin or red-colored species.
In the first case, we observed an apparent high abundance of surface C. finmarchicus in the late fall, as shown in Figure 5. Typically, C. finmarchicus is expected to be in diapause in the late fall; thus, it is less likely they will be present in surface waters (Häfker et al., 2018). In this case, the Case 2 anomaly map (see Figure 5B) shows high values across much of the region. The refined map shows low values in these anomalous regions, indicating that these pixels appear to be well resolved by the Case 2 + C. finmarchicus LUT (Figure 5C). The estimated surface C. finmarchicus concentration (see Figure 5D) corresponding to the refined anomaly map is high in these regions that were anomalous when using the Case 2 LUT only, but not when using the Case 2 + C. finmarchicus LUT. In this case, local knowledge suggests that it is less likely to be C. finmarchicus present at the surface during late fall and more likely to be Centropages, a species known to be in the surface waters of the GoM in November (Stegert et al., 2012). If so, this set of results could indicate that the anomaly method identifies astaxanthin pigment, irrespective of species, and the high surface concentrations of C. finmarchicus estimated during the late fall may actually be attributed to other astaxanthin containing zooplankton species.
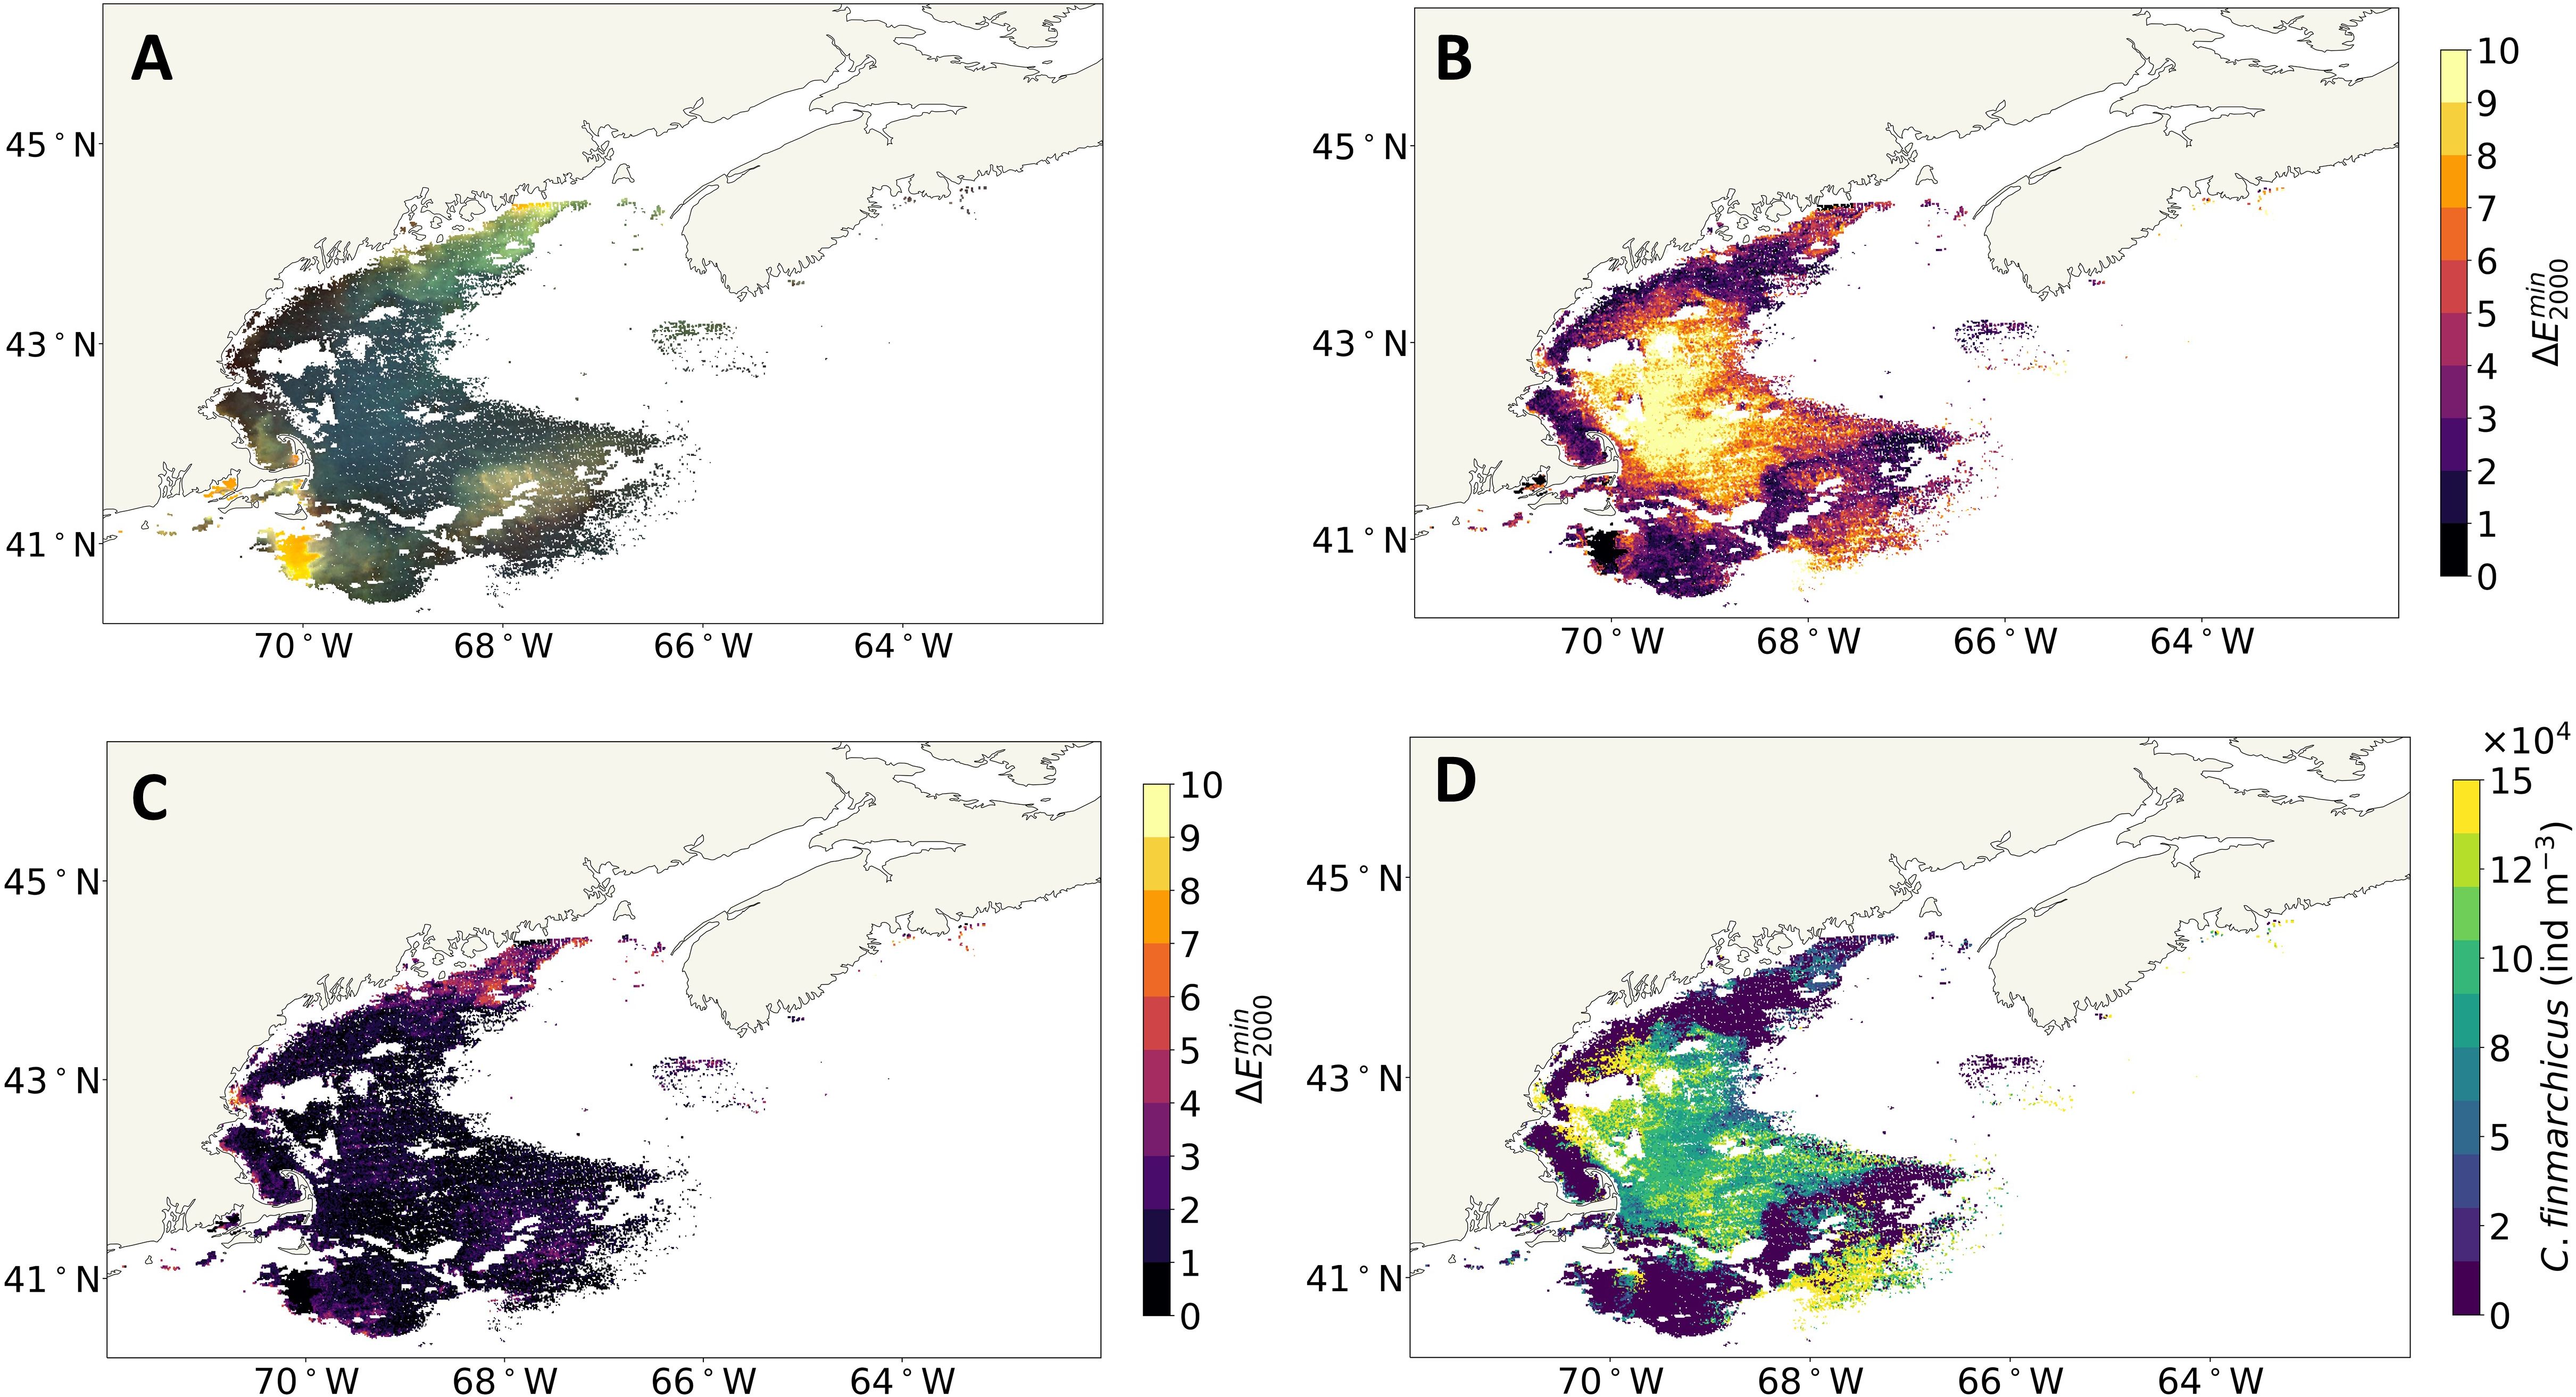
Figure 5. The GoM in the late fall on November 21, 2017. (A) eRGB image. (B) Case 2 map. (C) Refined anomaly map (using the threshold-based approach). (D) Surface Calanus finmarchicus concentration. GoM, Gulf of Maine; eRGB, enhanced RGB.
The second case study illustrates how dark red/brown phytoplankton blooms may be misidentified as C. finmarchicus. There was a large bloom of Tripos muelleri, a brown dinoflagellate, in the GoM in the spring and summer of 2023 (Ray, 2023). Thus, to explore the impact of a different red/brown organism on this ocean color remote sensing approach, a single scene from spring 2023 was acquired and processed in the same way as previously described (Figure 6). In this case, the anomalous pixels in the Case 2 anomaly map are high and extensive across the GoM (Figure 6B). While the anomaly is reduced using the refined, threshold-based approach (see Figure 6C), the anomalies are still high. The presence of anomalous pixels in the refined anomaly map indicates that the pixels are not well resolved by the Case 2 + C. finmarchicus LUT; i.e., the addition of C. finmarchicus did not fully remove the anomaly. The estimated surface C. finmarchicus concentration (see Figure 6D) is high across the GoM. When C. finmarchicus swarm at the surface, they tend to be in small patches, and the Gulf-wide feature in Figure 6D is unusual. Therefore, the unresolved refined anomaly (Figure 6C), the spatial extent of the C. finmarchicus patch, and the known presence of T. muelleri suggest a misidentification C. finmarchicus.
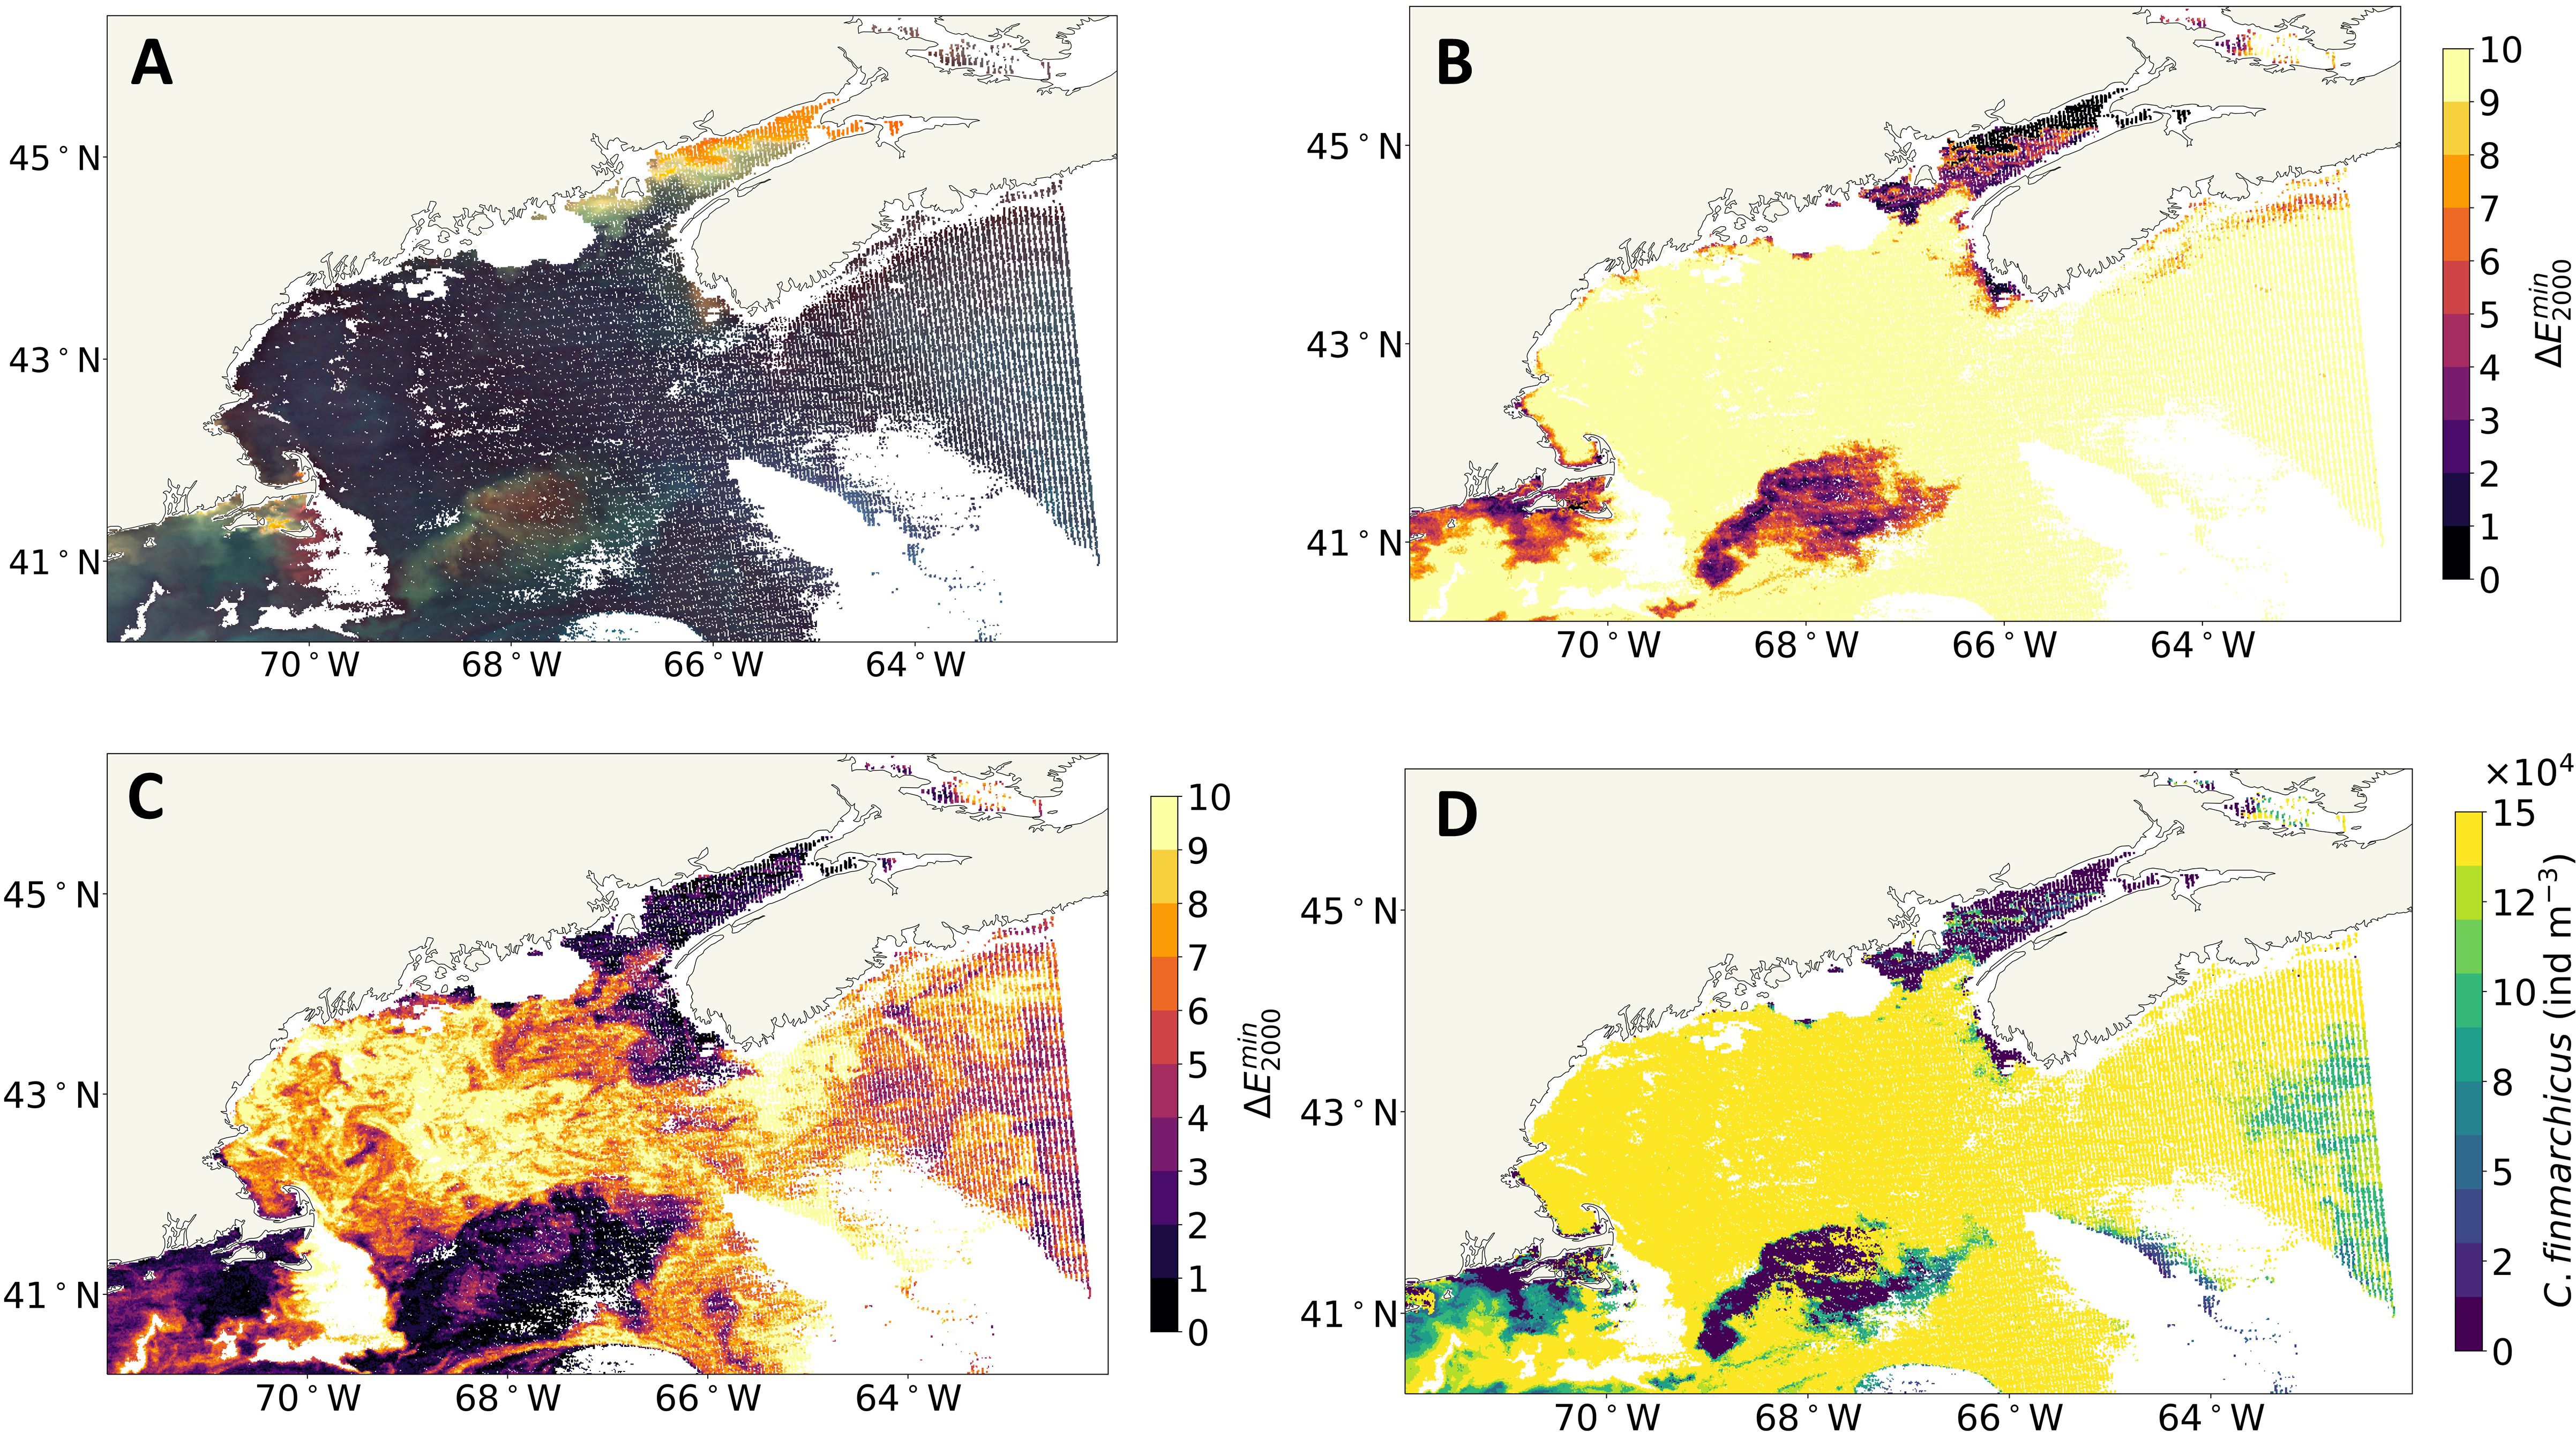
Figure 6. The GoM during a Tripos muelleri bloom event in the spring on April 13, 2023. (A) eRGB image. (B) Case 2 map. (C) Refined anomaly map. (D) Surface Calanus finmarchicus concentration. GoM, Gulf of Maine; eRGB, enhanced RGB.
We applied the eRGB image processing technique from MC23 to identify potential patches of surface C. finmarchicus in the GoM. While the eRGB standardization technique developed by McCarry et al. (2023) was initially intended for the Norwegian Sea, the range was derived from a comprehensive global dataset (Valente et al., 2022). Thus, the direct application of the MC23 eRGB approach is equally effective in standardizing satellite RGBs for the GoM. The implementation of the eRGB image standardizing technique is particularly crucial when working with large time-scale datasets, as it ensures consistency across the eRGB images, thereby allowing direct comparison between them.
The anomaly detection process is a test of optical closure. The refined anomaly detection used a threshold-based approach, where a Case 2 ≥ 4 was identified as anomalous (see Figure 2). In the case of the June 2009 image (Figures 2A, 3), we observed high values (≥4) in the Case 2 anomaly map (Figure 2A), particularly in regions of potential C. finmarchicus. This suggests that the Case 2 bio-optical model in these areas is incomplete, and the potential C. finmarchicus patch is anomalous without the inclusion of the C. finmarchicus constituent. In the refined, threshold-based approach, the Case 2 + C. finmarchicus LUT was applied on the anomalous pixels, resulting in significantly lower values, indicating that the anomaly in the optical model was resolved with the addition of C. finmarchicus (Figure 3). Therefore, in this case, the addition of C. finmarchicus component into the Case 2 standard bio-optical model in the anomalous region resolves the anomalies between the bio-optical model and the satellite imagery, as evidenced by the lower values in the refined anomaly.
Both case studies, illustrated in Figures 5, 6, highlight factors that impact the accuracy of the ocean color anomaly detection method for estimating C. finmarchicus concentrations. The method presented here, and in McCarry et al. (2023), relied on the detection of astaxanthin to quantify C. finmarchicus. Astaxanthin is a pigment common in various zooplankton species, and there are red/brown phytoplankton species, with many of these plankton and phytoplankton species present in the GoM. We found an unusually high C. finmarchicus concentration in late fall, which is likely to be another astaxanthin-rich species such as Centropages. Furthermore, a bloom of T. muelleri was misidentified as a large swarm of C. finmarchicus. These instances suggest that the method can be used to detect the presence of red/brown/astaxanthin-rich species, but without a priori knowledge of the system, a specific species cannot be identified. In the case of the T. muelleri bloom, the anomalous pixels in the refined anomaly map (high values in Figure 6C) indicate that the Case 2 + C. finmarchicus LUT did not fully resolve the anomaly. This, along with the estimation of high C. finmarchicus concentrations (concentrations at the maximum value included in the LUT, see Figure 6D), suggests that even higher concentrations of C. finmarchicus are needed in the LUT to resolve the anomaly. Alternatively, the failure to eliminate the anomaly using the existing C. finmarchicus range in the LUT could be used to identify a further mismatch, and therefore, the resulting C. finmarchicus estimates could be eliminated as being unrealistic. Here, we estimated C. finmarchicus concentrations (in individuals m−3) based on the absorption coefficient for individual C. finmarchicus. However, other red/brown/astaxanthin-rich plankton package their pigments differently, and therefore, each species will absorb different amounts per individual. Thus, the C. finmarchicus concentrations shown in Figures 5D, 6D cannot simply be taken as concentrations of Centropages or T. muelleri, and appropriate species and pigment-specific absorption measurements are required. This package effect is likely to happen within a given species, related to the size of the individuals, stage of life cycle, or physiological effects; thus, the variability in species-specific absorption also needs to be quantified. Consequently, we conclude that the refined, threshold-based anomaly detection method has the potential for detecting surface astaxanthin-rich or red-colored species. These could then be converted to species concentration with local knowledge of the species present and an appropriate, species-specific absorption measurement. To obtain species-specific absorption, it is important to measure the in situ absorption of astaxanthin-rich zooplankton under varying conditions, including different locations, life stages, and concentrations.
Optical closure may fail because either there is a problem in our bio-optical model or because there is an issue with the satellite data. Given the optically complex nature of the GoM, there can be issues with the atmospheric correction, particularly near the coast. While we have implemented a QC approach to remove spectra that have atmospheric correction issues, it is likely this approach is not perfect. The bio-optical model we used was built from Ligurian Sea data, and its application in the GoM may have caused misclassifications, although we are encouraged by the degree of optical closure that has been achieved. Implementing a GoM bio-optical model (including additional OSCs) and improving satellite atmospheric correction may further improve optical closure and the accuracy in identifying and quantifying C. finmarchicus for this region.
The in situ CPR C. finmarchicus population in the GoM recorded at approximately 19:33 local time (EST) on June 17, 2009, was 21,402 ind m−3 at the location depicted by a white star in Figures 1, 4. The refined anomaly detection method estimated the surface concentration of C. finmarchicus at the same location to be 80,000 ind m−3, obtained from satellite imagery captured earlier that day at 13:12 local time (EST). Although these in situ and satellite measurements were taken at different times on the same day, other factors contributing to this discrepancy should also be considered. However, the discrepancy between in situ and satellite measurements is consistent with the findings of McCarry et al. (2023). A potential factor for the discrepancy between satellite and in situ data could be partially attributed to the self-propelling movement of C. finmarchicus. Some studies have shown the ability of C. finmarchicus to avoid capture in net sampling, highlighting factors that contribute to the underestimation of population densities, including copepods’ ability to detect nets in daylight and their tendency to avoid them (Fleminger and Clutter, 1965; Giering et al., 2022). This behavior, often linked to their sensitivity to the noise and disturbances created by ship movements and the CPR sampling process, could lead to a significant underestimation of their true population numbers. Furthermore, a comparative study by Baumgartner (2003) on C. finmarchicus abundance estimates, utilizing net samples and optical plankton counters in the GoM, revealed that in patchy distribution environments, substantial concentrations of C. finmarchicus may not be adequately captured by nets, CPR, or instruments. It has also been shown that the CPR in particular tends to underestimate zooplankton populations due to its small aperture, which makes evasion relatively easy (Dippner and Krause, 2013). Further, the in situ CPR data only include stages V and VI C. finmarchicus, whereas the satellite measurements will include all life stages that contain astaxanthin. Consequently, the in situ values would be lower than the satellite estimates, as seen in our results. Collectively, these insights underline the complexities in accurately gauging the population densities of such copepods. The limitations inherent in both traditional zooplankton nets and optical plankton counters pose challenges for ecological modeling like NARW modeling, which depends on these data sources. However, for modeling NARW populations, thresholds of C. finmarchicus concentration become important. Ross et al. (2023) found that C. finmarchicus concentrations exceeding 10,000 ind m−3 are indicative of NARW presence. Further, McCarry et al. (2024) found that the minimum detectable level of C. finmarchicus via the MC23 approach was 1,300 ind m−3 in Case 1 waters and 8,700 ind m−3 in Case 2 waters. Given the potential for underestimation by in situ sampling techniques, it is likely that the Ross et al. threshold would translate into an even larger number for remote sensing observation. Thus, in the optically complex, Case 2 waters of the GoM, the minimum detectable C. finmarchicus concentration from the satellite is worse than the concentration indicative of NARW presence and may in fact be significantly lower.
One potential way to improve the C. finmarchicus quantification would be adopting a spectral matching approach that utilizes the full spectral signatures, moving beyond the three RGB bands used here. This solution, however, has challenges set by the limited availability of spectral bands on heritage ocean color satellites (SeaWiFS, MODIS, and VIIRS) that are capable of effectively differentiating spectral signatures between these species. The new NASA PACE mission will provide global-scale hyperspectral data and could consequently enhance methods for quantifying C. finmarchicus and other optically significant zooplankton. The spectral differences in zooplankton due to different pigments could be detectable via PACE due to its higher spectral resolution; however, McCarry et al. (2024) found that reflectance spectra from astaxanthin-rich and non-astaxanthin-rich zooplankton were similar. Nevertheless, there only exist a limited number of measurements of zooplankton optical properties. Thus, more in situ measurements of zooplankton optical properties, coupled with in situ measurements of zooplankton concentrations (ideally from multiple sampling approaches, e.g., nets, optical plankton counters, and acoustics), are important for developing and refining approaches for ocean color-based zooplankton detection.
The bio-optical model used in this study did not include a component for the backscattering coefficient of C. finmarchicus. Although the backscattering signal of C. finmarchicus is likely minimal and deemed negligible due to their larger particle size (Davies et al., 2021), the development of an instrument to measure large particle backscattering would help to measure the backscattering component, thus potentially enhancing the accuracy of the C. finmarchicus bio-optical model. Additionally, considering the varying concentrations of astaxanthin pigment in different astaxanthin-rich species, which affect their absorption and backscattering properties, and understanding the species-specific astaxanthin pigment concentration could help to differentiate these species and improve the accuracy of species concentration estimates. Thus, it is important to build up a database of in situ zooplankton absorption measurements and quantify the variability in these observations.
This study highlights the potential of ocean color remote sensing and bio-optical modeling in detecting surface concentrations of C. finmarchicus in the GoM and underscores the importance of considering zooplankton when evaluating the optical properties of ocean waters. However, the approach presented here also detects other astaxanthin/red-colored species and misidentifies them as C. finmarchicus because they are optically indistinguishable from each other. Thus, this approach is effectively an astaxanthin/red detection method, and rather than estimating concentrations of a given species, producing an estimate of astaxanthin concentration that could subsequently be converted into an equivalent species abundance would provide a more universally applicable output. That being said, with local knowledge and species-specific absorption coefficients, surface concentrations of a given species can be estimated (as was shown here). Consequently, surface detection of astaxanthin-rich plankton using ocean color remote sensing holds promise for many applications, including tracking changes in NARW migration by leveraging satellite-based estimates of surface C. finmarchicus concentration patterns.
The original contributions presented in the study are included in the article/supplementary material. Further inquiries can be directed to the corresponding author.
RS: Data curation, Formal Analysis, Investigation, Visualization, Writing – original draft, Writing – review & editing. CLM: Methodology, Writing – review & editing, Resources. DM: Conceptualization, Methodology, Writing – review & editing. CM: Conceptualization, Funding acquisition, Supervision, Writing – review & editing.
The author(s) declare that financial support was received for the research, authorship, and/or publication of this article. This research was funded by the NASA (National Aeronautics and Space Administration) grant number 80NSSC21K1733, Norges Forskningsråd (287043 STRESSOR project), and Natural Environment Research Council (NE/Y004426/1).
The authors would like to thank the NASA OBPG/OB.DAAC for the open-source satellite data and the National Oceanic and Atmospheric Administration (NOAA) for the CPR data source.
The authors declare that the research was conducted in the absence of any commercial or financial relationships that could be construed as a potential conflict of interest.
The author(s) declare that no Generative AI was used in the creation of this manuscript.
All claims expressed in this article are solely those of the authors and do not necessarily represent those of their affiliated organizations, or those of the publisher, the editors and the reviewers. Any product that may be evaluated in this article, or claim that may be made by its manufacturer, is not guaranteed or endorsed by the publisher.
Bandaranayake W. M., Gentien P. (1982). Carotenoids of temora turbinata, centropages furcatus, undinula vulgaris and euchaeta russelli. Comp. Biochem. Physiol. Part B: Comp. Biochem. 72, 409–145. doi: 10.1016/0305-0491(82)90219-X
Basedow SL., McKee D., Lefering I., Gislason A., Daase M., Trudnowska E., et al. (2019). Remote sensing of zooplankton swarms. Sci. Rep. 9, 6865. doi: 10.1038/s41598-018-37129-x
Baumgartner M. F. (2003). Comparisons of calanus finmarchicus fifth copepodite abundance estimates from nets and an optical plankton counter. J. Plankton Res. 25, 855–868. doi: 10.1093/plankt/25.7.855
Bengil F., McKee D., Beşiktepe ST., Calzado V. S., Trees C. (2016). A bio-optical model for integration into ecosystem models for the ligurian sea. Prog. Oceanography 149, 1–15. doi: 10.1016/j.pocean.2016.10.007
Bigelow H. B. (1926). Plankton of the Offshore Waters of the Gulf of Maine (Washington: Govt. Print. Off). doi: 10.5962/bhl.title.4192
Byron E. R. (1982). The adaptive significance of calanoid copepod pigmentation: A comparative and experimental analysis. Ecology 63, 1871. doi: 10.2307/1940127
Davies E. J., Basedow SL., McKee D. (2021). The hidden influence of large particles on ocean colour. Sci. Rep. 11, 39995. doi: 10.1038/s41598-021-83610-5
Dierssen H. M., Randolph K. (2013). “Remote Sensing of Ocean Color,” in Earth System Monitoring. Ed. Orcutt J. (Springer New York, New York, NY), 439–472. doi: 10.1007/978-1-4614-5684-1_18
Dierssen H. M., Vandermeulen R. A., Barnes B. B., Castagna A., Knaeps E., Vanhellemont Q. (2022). QWIP: A quantitative metric for quality control of aquatic reflectance spectral shape using the apparent visible wavelength. Front. Remote Sens. 3. doi: 10.3389/frsen.2022.869611
Dippner J. W., Krause M. (2013). Continuous plankton recorder underestimates zooplankton abundance. J. Mar. Syst. 111–112, 263–268. doi: 10.1016/j.jmarsys.2012.09.009
Fleminger A., Clutter R. I. (1965). AVOIDANCE OF TOWED NETS BY ZOOPLANKTON1. Limnology Oceanography 10, 96–1045. doi: 10.4319/lo.1965.10.1.0096
Giering S. L.C., Culverhouse P. F., Johns D. G., McQuatters-Gollop A., Pitois S. G. (2022). Are plankton nets a thing of the past? An assessment of in situ imaging of zooplankton for large-scale ecosystem assessment and policy decision-making. Front. Mar. Sci. 9. doi: 10.3389/fmars.2022.986206
Grieve B. D., Hare J. A., Saba V. S. (2017). Projecting the effects of climate change on calanus finmarchicus distribution within the U.S. Northeast continental shelf. Sci. Rep. 7, 62645. doi: 10.1038/s41598-017-06524-1
Groom S., Sathyendranath S., Ban Y., Bernard S., Brewin R., Brotas V., et al. (2019). Satellite ocean colour: current status and future perspective. Front. Mar. Sci. 6. doi: 10.3389/fmars.2019.00485
Häfker N. S., Teschke M., Last K. S., Pond D. W., Hüppe L., Meyer B. (2018). Calanus finmarchicus seasonal cycle and diapause in relation to gene expression, physiology, and endogenous clocks. Limnology Oceanography 63, 2815–2385. doi: 10.1002/lno.11011
Ji R., Runge J. A., Davis C. S., Wiebe P. H. (2022). Drivers of variability of calanus finmarchicus in the gulf of maine: roles of internal production and external exchange. ICES J. Mar. Sci. 79, 775–845. doi: 10.1093/icesjms/fsab147
Johnson C. L., Runge J. A., Curtis K.A., Durbin E. G., Hare J. A., Incze L. S., et al. (2011). Biodiversity and ecosystem function in the gulf of maine: pattern and role of zooplankton and pelagic nekton. PloS One 6, e164915. doi: 10.1371/journal.pone.0016491
Koomyart I., Nagamizu H., Khuwijitjaru P., Kobayashi T., Shiga H., Yoshii H., et al. (2017). Astaxanthin stability and color change of krill during subcritical water treatment. J. Food Sci. Technol. 54, 3065–3725. doi: 10.1007/s13197-017-2742-1
Liu H. X., Wu B., Liu Y., Huang M., Xu Y. F. (2012). A discussion on printing color difference tolerance by CIEDE2000 color difference formula. Appl. Mechanics Materials 262, 96–99. doi: 10.4028/www.scientific.net/AMM.262.96
Lo Prejato M., McKee D., Mitchell C. (2020). Inherent optical properties-reflectance relationships revisited. J. Geophysical Research: Oceans 125, e2020JC016661. doi: 10.1029/2020JC016661
Mascarenhas V., Keck T. (2018). “Marine Optics and Ocean Color Remote Sensing,” in YOUMARES 8 – Oceans Across Boundaries: Learning from Each Other. Eds. Jungblut S., Liebich V., Bode M. (Springer International Publishing, Cham), 41–54. doi: 10.1007/978-3-319-93284-2_4
Matsuno T. (2001). Aquatic animal carotenoids. Fisheries Sci. 67, 771–783. doi: 10.1046/j.1444-2906.2001.00323.x
McCarry C. L., Basedow SL., Davies E. J., Last K. S., McKee D. (2024). Determination of zooplankton absorption spectra and their potential contribution to ocean color. Optics Express 32, 413145. doi: 10.1364/OE.537062
McCarry C. L., Basedow SL., Davies E. J., McKee D. (2023). Estimating surface concentrations of calanus finmarchicus using standardised satellite-derived enhanced RGB imagery. Remote Sens. 15, 29875. doi: 10.3390/rs15122987
Melle W., Runge J., Head E., Plourde S., Castellani C., Licandro P., et al. (2014). The north atlantic ocean as habitat for calanus finmarchicus: environmental factors and life history traits. Prog. Oceanography 129, 244–284. doi: 10.1016/j.pocean.2014.04.026
Meyer-Gutbrod E., Greene C., Davies K., Johns D. (2021). Ocean regime shift is driving collapse of the north atlantic right whale population. Oceanography 34, 22–315. doi: 10.5670/oceanog.2021.308
Michaud J., Taggart C. (2007). Lipid and gross energy content of north atlantic right whale food,Calanus finmarchicus, in the bay of fundy. Endangered Species Res. 3, 77–94. doi: 10.3354/esr003077
Mobley C. D., Sundman L. K. (2016). HydroLight-EcoLight 5.3 (Sequoia Scientific Inc., Bellevue, DC, USA: Numerical Optics Ltd.).
Moore M. J., Rowles T. K., Fauquier D. A., Baker J. D., Biedron I., Durban J. W., et al. (2021). REVIEW assessing north atlantic right whale health: threats, and development of tools critical for conservation of the species. Dis. Aquat. Organisms 143, 205–226. doi: 10.3354/dao03578
Morel A., Prieur L. (1977). Analysis of variations in ocean color1. Limnology Oceanography 22, 709–225. doi: 10.4319/lo.1977.22.4.0709
Parent G. J., Plourde S., Turgeon J. (2012). Natural hybridization between calanus finmarchicus and C. Glacialis (Copepoda) in the arctic and northwest atlantic. Limnology Oceanography 57, 1057–1665. doi: 10.4319/lo.2012.57.4.1057
Ray R. (2023). Researchers identify unusually large bloom of brown algae in the Gulf of Maine. Available online at: https://www.unh.edu/unhtoday/news/release/2023/08/23/researchers-identify-unusually-large-bloom-brown-algae-gulf-maine.
Record N., Runge J., Pendleton D., Balch W., Davies K., Pershing A., et al. (2019). Rapid climate-driven circulation changes threaten conservation of endangered north atlantic right whales. Oceanography 32, 162–169. doi: 10.5670/oceanog.2019.201
Renaud P. E., Daase M., Banas N. S., Gabrielsen T. M., Søreide J. E., Varpe Ø., et al. (2018). Pelagic food-webs in a changing arctic: A trait-based perspective suggests a mode of resilience.“. ICES J. Mar. Sci. 75, 1871–1881. doi: 10.1093/icesjms/fsy063
Richardson A. J., Walne A. W., John A. W. G., Jonas T. D., Lindley J. A., Sims D. W., et al. (2006). Using continuous plankton recorder data. Prog. Oceanography 68, 27–74. doi: 10.1016/j.pocean.2005.09.011
Ross C. H., Runge J. A., Roberts J. J., Brady D. C., Tupper B., Record N. R. (2023). Estimating north atlantic right whale prey based on calanus finmarchicus thresholds. Mar. Ecol. Prog. Ser. 703, 1–16. doi: 10.3354/meps14204
Sorochan K. A., Plourde S., Baumgartner M. F., Johnson C. L. (2021). Availability, supply, and aggregation of prey (Calanus spp.) in foraging areas of the north atlantic right whale (Eubalaena glacialis ).“. ICES J. Mar. Sci. 78, 3498–3520. doi: 10.1093/icesjms/fsab200
Stegert C., Ji R., Li N., Davis C. S. (2012). Processes controlling seasonality and spatial distribution of centropages typicus: A modeling study in the gulf of maine/georges bank region. J. Plankton Res. 34, 18–35. doi: 10.1093/plankt/fbr084
Swaim Z. T., Westgate A. J., Koopman H .N., Rolland R. M., Kraus S. D. (2009). Metabolism of ingested lipids by north atlantic right whales. Endangered Species Res. 6, 259–271. doi: 10.3354/esr00163
Valente A., Sathyendranath S., Brotas V., Groom S., Grant M., Jackson T., et al. (2022). A compilation of global bio-optical in situ data for ocean colour satellite applications – version three. Earth System Sci. Data 14, 5737–5770. doi: 10.5194/essd-14-5737-2022
Vilgrain L., Maps F., Basedow S., Trudnowska E., Madoui M. -A., Niehoff B., et al. (2023). Copepods’ True colors: astaxanthin pigmentation as an indicator of fitness. Ecosphere 14, e44895. doi: 10.1002/ecs2.4489
Keywords: Calanus finmarchicus, zooplankton, ocean color, satellite remote sensing, Gulf of Maine
Citation: Shunmugapandi R, McCarry CL, McKee D and Mitchell C (2025) Ocean color anomaly detection to estimate surface Calanus finmarchicus concentration in the Gulf of Maine. Front. Mar. Sci. 12:1507638. doi: 10.3389/fmars.2025.1507638
Received: 08 October 2024; Accepted: 12 February 2025;
Published: 05 March 2025.
Edited by:
Cédric Jamet, UMR8187 Laboratoire d’Océanologie et de Géosciences (LOG), FranceReviewed by:
Robert J. Frouin, University of California, San Diego, United StatesCopyright © 2025 Shunmugapandi, McCarry, McKee and Mitchell. This is an open-access article distributed under the terms of the Creative Commons Attribution License (CC BY). The use, distribution or reproduction in other forums is permitted, provided the original author(s) and the copyright owner(s) are credited and that the original publication in this journal is cited, in accordance with accepted academic practice. No use, distribution or reproduction is permitted which does not comply with these terms.
*Correspondence: Catherine Mitchell, Y21pdGNoZWxsQGJpZ2Vsb3cub3Jn
Disclaimer: All claims expressed in this article are solely those of the authors and do not necessarily represent those of their affiliated organizations, or those of the publisher, the editors and the reviewers. Any product that may be evaluated in this article or claim that may be made by its manufacturer is not guaranteed or endorsed by the publisher.
Research integrity at Frontiers
Learn more about the work of our research integrity team to safeguard the quality of each article we publish.