
94% of researchers rate our articles as excellent or good
Learn more about the work of our research integrity team to safeguard the quality of each article we publish.
Find out more
ORIGINAL RESEARCH article
Front. Mar. Sci. , 04 March 2025
Sec. Marine Biogeochemistry
Volume 12 - 2025 | https://doi.org/10.3389/fmars.2025.1463734
 Luca Massi1*
 Caterina Nuccio1
 Chiara Melillo1
 Silvia Becagli2Giovanna Mori1Lorenzo Verdiani1
 Simone Bonamano3Alice Madonia4
 Viviana Piermattei4
 Marco Marcelli3
 Luigi Lazzara1
Within BioAPRoS project (Biogenic Aerosol and Primary production in the Ross Sea) two research campaigns were conducted in the coastal area of Terra Nova Bay (TNB) in front of the Italian Base Mario Zucchelli Station, Ross Sea, Antarctica, spanning from 13/11/2018 to 30/01/2019 (BioAPRoS18), and from 01/12/2019 to 30/01/2020 (BioAPRoS19), an area classified as Marginal Ice Zone (MIZ) during this period. The goal was to study nutrient dynamics, phytoplankton biomass and taxonomic composition in the upper mixed layer (UML), exploring assimilation preferences of different phytoplankton assemblages and their biogeochemical effects. The findings were compared with similar 1990s campaigns in the same region. In line with the previous outcome, UML was persistent and always very shallow (5-18 m). Nutrient concentrations showed decreasing trends from spring to summer synchronously opposite to Chla, highlighting pronounced consumption of nutrients during phytoplankton growth. Discrepancies emerged during phytoplankton summer bloom; in BioAPRoS18 N/P was about 40 due to ΔN/ΔP removal ratio of 11.8, a typical already known condition, while BioAPRoS19 showed an unprecedented N/P around 6 with ΔN/ΔP of 17.6. Also, differences in Si/P and Chla/Si ratios emerged. Diatoms were the primary group in both campaigns, but they exhibited highly differentiated composition. In BioAPRoS18 pennate diatoms, notably Fragilariopsis curta, were prevalent as in ‘90s campaigns, while BioAPRoS19 experienced the dominance of centric diatoms, especially Dactyliosolen tenuijunctus, never occurred before. These differences in nutrients dynamics and taxonomic composition between the two diatom assemblages, most likely indicate different assimilation modalities of N and P, with Dactyliosolen tenuijunctus favouring N assimilation over P, unlike Fragilariopsis curta. Biological and biogeochemical characteristics of TNB, a pivotal marine ecosystem, are then displaying shifts after relative stability since the 1990s that could be the result of current climate change. These trends necessitate in-depth investigations and monitoring to comprehend and manage these shifts effectively.
The Ross Sea holds immense ecological significance, encompassing diverse marine systems like polynyas, marginal ice zones, coastal and offshore areas. It is characterized by high biodiversity and is among the most productive regions in the Antarctic Ocean (Arrigo and McClain, 1994; Nelson et al., 1996; Smith and Gordon, 1997; Arrigo et al., 1998; Saggiomo et al., 2002; Vaillancourt et al., 2003; Arrigo et al., 2008; Smith and Kaufman, 2018; Smith, 2022), such that the Commission for the Conservation of Marine Living Resources (CCAMLR) in 2016 designated the Ross Sea a Marine Protected Area.
The investigation site, Terra Nova Bay (TNB) located along the Victoria Land coast between the Drygalsky Glacial tongue and Cape Washington (Figure 1), is one of the most productive sectors in the Ross Sea (Lazzara et al., 2000; Saggiomo et al., 2002). An essential aspect of the Ross Sea ecology involves the extent and dynamics of ice, closely connected to water column stabilization due to the UML formation. This process significantly impacts the temporal variability of seasonal production (Innamorati et al., 2000; Mangoni et al., 2017).
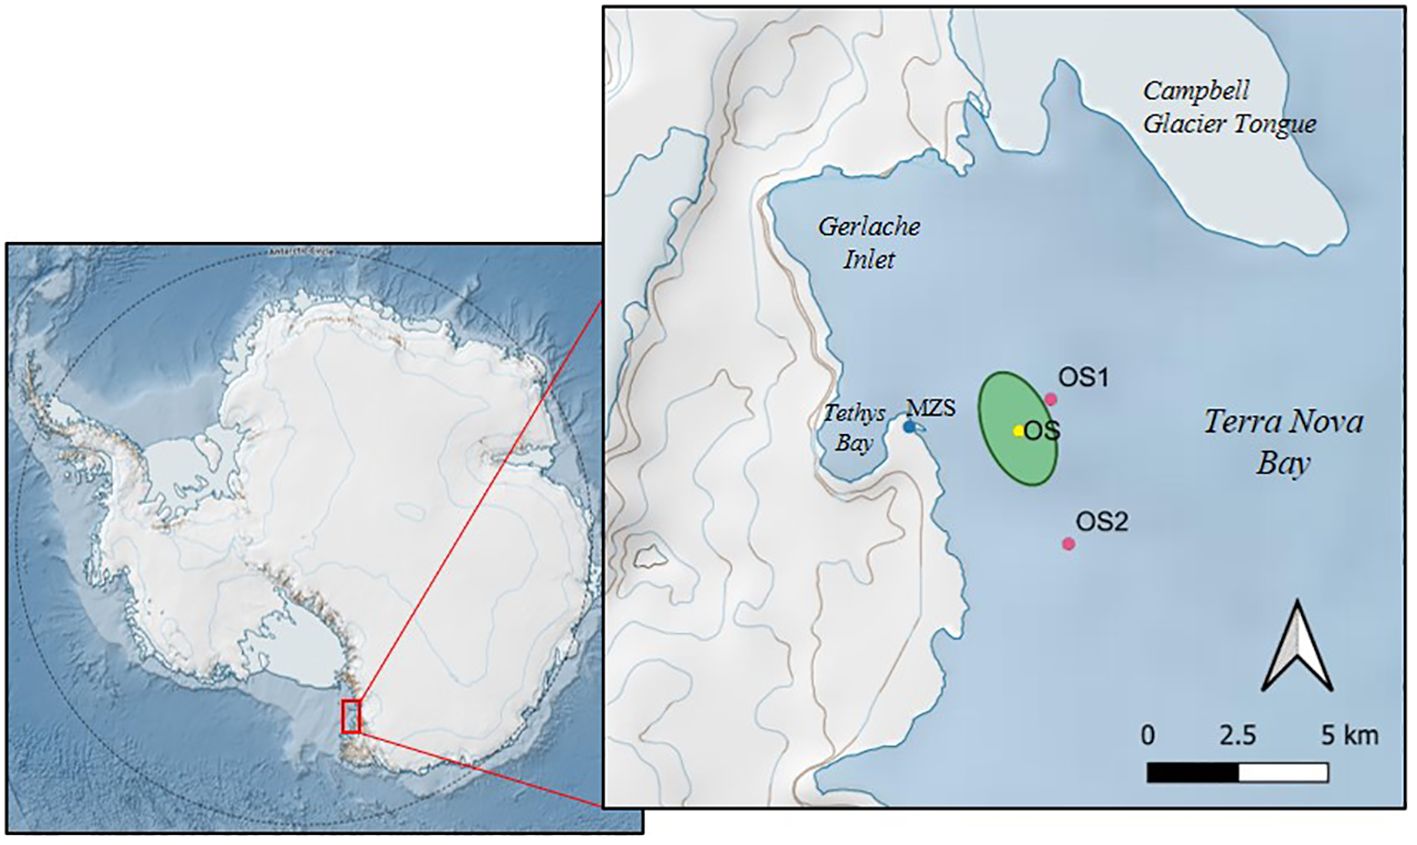
Figure 1. Sampling stations of BioAPRoS campaigns. OS station of BioAPRoS18, in some cases, in response to sea ice conditions has been moved within the green area; OS1 and OS2 are the sampling stations of BioAPRoS19. (This map was obtained with QGis and Quantartica, developed by Norwegian Polar Institute).
The homogenization of the water column, resulting from Circumpolar Deep Water (CDW) upwelling, leads to a substantial rise in nutrients concentration in the surface layer during early spring. Typically, during this time, at TNB, concentrations of NO2-+ NO3-, PO43- and Si(OH)4 can reach values of 35, 2, 80 µM respectively, with ratios approximating the theoretical values (Redfield et al. 1963; Catalano et al., 1997, 2000; Innamorati et al., 2000).
In spring, increasing irradiance, temperatures and CDW upwelling trigger ice melting, causing a dilution of surface waters and the formation of a less dense surface layer (UML) separated from the underlying waters, this process being particularly pronounced in the Marginal Ice Zones (MIZ). This strong water column stabilization enables phytoplankton to better utilize available irradiance and nutrients; moreover, the presence of ice further increases nutrient concentrations, including iron, a limiting factor in Antarctic waters (Martin et al., 1990; Sedwick and DiTullio, 1997; Sedwick et al., 2000; Alderkamp et al., 2012). These conditions - strong summer irradiation, stable UML and nutrients availability - contribute to rapid phytoplankton growth between December and the end of January early February, with chlorophyll a reaching 8-10 mg m-3 (Innamorati et al., 2000; Mangoni et al., 2004).
Phytoplankton assemblage dynamics in the Ross Sea alternate between diatoms and the Haptophyte Phaeocystis antarctica dominance, playing distinct role in terms of eco-physiology, biogeochemistry and food web functions (Smith et al., 2014). Biogeochemically, diatoms require silicon for frustules and assimilate N and P at lower ratio than that of Redfield (Arrigo et al., 2000; Sweeney et al., 2000; Dunbar et al., 2003). P. antarctica prevails in the offshore and southern waters (Arrigo et al., 2000; Liu and Smith, 2012), flourishing in the spring mixed water column and in polynya waters (Smith and Asper, 2001; Arrigo et al., 2003; Smith et al., 2010) due to its adaptation to low light conditions. In TNB, Phaeocystis dominance in the mixed water column under the UML has been observed (Goffart et al., 2000; Nuccio et al., 2000), while Mangoni et al. (2019) reported an unusual Phaeocystis bloom in the UML of TNB. The diatoms growth primarily occurs in the summer stratified waters of the MIZ (Garrison et al., 2005; Smith et al., 2014) and it is well documented in TNB by many authors (Goffart et al., 2000; Nuccio et al., 2000; Mangoni et al., 2004; Saggiomo et al., 2021). Despite interannual variability in ice melt and diatom bloom timing, there is a general consensus on the overall constancy of the diatoms bloom composition: centric diatoms (Thalassiosira, Chaetoceros, Dactyliosolen) dominate open waters (Leventer and Dunbar, 1996; Saggiomo et al., 2021), while pennate diatoms, particularly Fragilariopsis curta - known as “ice algal” species (Nelson and Smith, 1986) - predominate in the summer surface layer of TNB waters (Andreoli et al., 1995; Goffart et al., 2000; Nuccio et al., 2000). The relevant presence of this species has been observed into the annual sea-ice environment, during the spring-summer transition (Guglielmo et al., 2000, 2004; Lazzara et al., 2007).
The growth of diatoms leads to a substantial decrease in nutrients concentrations, in fact at TNB the concentrations of NO3- + NO2-, PO43- and Si(OH)4 in the UML fall down to values around 5, 0.05 and 15 µM respectively (Catalano et al., 2000; Innamorati et al., 2000; Saggiomo et al., 2002). These values remain high compared to other seas, also due to Iron deficiency acting as limiting factors for the phytoplankton growth, especially in the offshore Ross Sea areas (Martin et al., 1990; Sedwick and DiTullio, 1997). Additionally, nutrient ratios N/P, Si/N and Si/P undergo modifications due to differential nutrient utilization strategies, as distinct nutrient utilization strategies and biogeochemical consequences are linked to phytoplankton taxonomic composition. Ross Sea studies on inorganic elements removal ratios (ΔC/ΔN, ΔC/ΔP, ΔN/ΔP, ΔC/ΔN, ΔC/ΔSi/ΔN) reveal pronounced variations based on dominant species (Catalano et al., 1997; Arrigo et al., 2000; Sweeney et al., 2000; Smith and Asper, 2001; Saggiomo et al., 2002; Dunbar et al., 2003). Particularly, Phaeocystis antarctica-dominated assemblages exhibit significant higher ΔN/ΔP ratios (17.5-19.7) than Redfield, while diatom-dominated assemblages display lower ratio (10.1-15.2), underscoring the close connection between phytoplankton composition and biogeochemical properties in Ross Sea waters (Arrigo et al., 2000; Sweeney et al., 2000; Smith and Asper, 2001; Dunbar et al., 2003). A shift in the initial N/P ratio towards strong P deficiency during Fragilariopsis curta blooms is evident at TNB (Innamorati et al., 2000; Nuccio et al., 2000), showing that this phytoplankton assemblage assimilates greater quantities of P than N compared with the theoretical ones of Redfield (Catalano et al., 1997, 2000; Saggiomo et al., 2002).
This study is focused on the relationships between phytoplankton assemblage composition, studied through both pigment composition and optical microscopy, their nutrients assimilation preferences, and the resulting biogeochemical effects at TNB.
Analysis covers the temporal evolution of NO3-, NO2-, PO43- and Si(OH)4 concentrations in the UML, alongside phytoplankton biomass and taxonomic composition dynamics during austral springs and summers 2018-19 and 2019-20, from the ice melt until the end of January. The findings are compared with data from three ‘90s campaigns (1989-90, 1994-95, 1997-98), highlighting similarities, differences and the potential influence of climate change.
This study is part of the BioAPRoS (Biogenic Aerosol and Primary Production in the Ross Sea) project funded by the Italian National Antarctic Research Programme (PNRA). Two campaigns were carried out during the austral summers 2018/19 (13 November 2018, 30 January 2019, BioAPRoS18) and 2019/20 (1 December 2019, 30 January 2020, BioAPRoS19) in the coastal area of Terra Nova Bay (TNB) in front of the Italian base Mario Zucchelli Station (MZS) (Figure 1). Sampling was carried out from aboard a motorboat using 5 L Niskin bottles within the UML at depths of 0.5, 5, 10 and 15 m. The samples from 15 m were included in the data set of this study only on the days when this depth was included within the UML (1 sample in BioAPRoS18 and 5 for BioAPRoS19). During BioAPRoS18 the ice cover prevented sampling in open waters until 26 December and in three dates (13, 23 November, 1 December) water samples were collected at 0.5 and 5 m depth with a Niskin bottle from a hole previous drilled in the ice. From 26 December samples were collected in open waters at station OS. Since floating ice blocks were almost always present in the area, the position of the OS station was, depending on the case, slightly moved within a range of 1000 m to allow sampling operations.
In total, 46 samples in the BioAPRoS18 campaign and 57 samples in BioAPRoS19 were analyzed for chlorophyll a, pigments, nutrients and microscopic counts of phytoplankton.
Sampling area, modalities and periods of these two campaigns are the same as a series of campaigns carried out in 1990, 1995 and 1998 (Innamorati et al., 1991, 1994; Lazzara et al., 1997; Innamorati et al., 2000; Lazzara et al., 2000; Nuccio et al., 2000).
In the following representation, for the sake of simplicity, the days of the various campaigns have been reported by counting them from 1 November to 28 February, therefore with progressive numbers from 1 to 120.
In situ measurements were carried out in the upper 25 m of the water column with specially assembled prototypes of minimal low-cost instrumentation easy to use even in extreme conditions. In the first campaign, a FTB Idromar multiparametric probe equipped with temperature and pressure sensors as well as chlorophyll a fluorescence and backscattering meters (Dr Haardt) was used. In the second campaign the ACHAB (Antarctic Low-Cost Hydro Arduino Bio-optic) profiler was used, a low-cost Arduino based probe specifically developed within the BioAPRoS project to measure temperature, pressure, chlorophyll a fluorescence and backscattering (Turner Designs Cyclops7). The identification of the UML and its depth was carried out through the bathymetric profiles of temperature variation (Δt) with 1 m window. The results were compared and validated by the feature of the backscattering profiles. The identification of the UML depths was also carried out with C-GLORSv7 product distributed as a part of Copernicus Marine Service (CMS). It is a reanalysis product (built to be as close as possible to the observations) that simulates the effect of ice melting during the austral summer season thanks to the coupling between NEMO (1/4° horizontal resolution, 75 vertical levels) and LIM2 sea-ice models.
Seawater subsamples were filtered on prewashed Wathman GF/F filters (diameter 47 mm), poisoned with HgCl2 and stored in in 250 mL plastic bottles at 4°C. The dissolved inorganic nutrients (NO3-, NO2-, PO43- and Si(OH)4) were analyzed with a Bran+Luebbe AA3 Autoanalyzer following standard procedures (Grasshoff et al., 1999; Saggiomo et al., 2010). Detection limits for the determination of NO3-, NO2-, PO43- and Si(OH)4 were 0.02, 0.02, 0.01 and 0.1 µM respectively with precision of ±0.02 µM for NO2- and PO43; ± 0.3 µM for NO3 and ±1.5 µM for Si(OH)4. Since the concentrations of ammonia were not analyzed, it was not possible to obtain the concentrations of total dissolved inorganic nitrogen (DIN). The sum of nitrites and nitrates (NO2- + NO3-) summarized as total oxidised nitrogen (TNOx) was therefore used as its estimate since ammonia, in the Ross Sea, generally constitutes a small fraction, about 2-10% of the DIN (Knox, 1994).
Nutrients analytical procedure for the campaigns of the ‘90s are reported in Innamorati et al. (2000).
1-2 L of seawater were filtered on 47 mm Wathman GF/F filters. Filters with collected material were stored dry at -80°C. After about 4 months, each filter was homogenized manually in 10 mL 90% acetone and left to extract at 4°C for 24 hours before carrying out both Hight Performance Liquid Chromatography (HPLC) and spectrophotometric analyzes. HPLC analysis of pigments was carried out following Vidussi et al. (1996) and Barlow et al. (1997) by means of a Class VP system (SHIMAZDU) using ACME C8 column (Phase) with UV/VIS and fluorometric detectors to quantify chlorophyll a (Chla), other chlorophylls, carotenoid pigments, phaeopigments and phaeophorbids. The pigments recognition and calibration procedures were performed following Montura and Repeta (1997) using DHI pigment standards and B-Apo-8-Carotenal as internal standard. Spectrophotometric analyzes was carried out with a SHIMATZU UV 2600 spectrophotometer and Chlorophaeopigments concentrations (Chl) were calculated from the absorbance values using the monochromatic equation (Lazzara et al., 2010). This procedure was added in order to compare the data of the last campaigns with those of the ‘90s in which only spectrophotometric measurements were made (Innamorati et al., 2000). In this work phytoplankton biomass are expressed in terms of Chla; in addition, for comparison purpose, the phytoplankton biomass/nutrient ratios are also obtained using Chl as for of the ‘90s campaigns. The global quantitative relationships between HPLC Chla and spectrophotometric Chl are:
300 mL of seawater samples for microscopic analysis were stored in dark glass bottles, to better preserve the siliceous structures of diatoms, with buffered formalin (final concentration 4%) until their analyzes in Italy. Phytoplankton counting and identification was carried out after sedimentation of variable sample volumes (10-25 mL) with inverted microscopes (Zeiss IM35 or Zeiss Axiovert at 400x) following standard methods (Zingone et al., 2010). From 500 to 17,000 cells were counted in each sample.
In the summer period the water column in TNB is characterized by the constant presence of the separation between the uppermost layer (UML) and the deeper ones. The effectiveness of this separation barrier increases as the temperature and salinity difference enhances, due to melting of ice and heating, resulting in reduction or blockage of vertical transport (Catalano et al., 2000). Nutrient dynamics within the UML were analyzed together with the N/P, Si/N, Si/P ratios (with N = TNOx = NO3- + NO2-, and P = PO43-; Si = Si(OH)4). Nutrient concentrations dynamic in the UML can be associated to those of Chla, representing an estimate of phytoplankton biomass. How these relationships change following the evolution of phytoplankton biomass Chla/N and Chla/P dynamics has been considered. In addition, in order to compare these dynamics with that of previous campaigns, the logarithms of the ratios Chl/N and Chl/P and their model II regression line (Sokal and Rohlf, 1995) are calculated and plotted together with the 95% confidence ellipses of the points to better evaluate their distribution.
The stability of UML can allow, through the measurement of the nutrient dynamics, to evaluate the nutrients removal ratios in the UML and can provide an insight into how the phytoplankton community assimilated nutrients into cellular pools (and subsequently used). The quantitative estimate of the phytoplankton nutrient removal ratios (ΔN/ΔP, ΔSi/ΔN and ΔSi/ΔP) in the UML was carried out by using the angular coefficient of the regression line between each pair of nutrients (model II regression; Sokal and Rohlf, 1995).
UML depth in the sampling periods was similar for both campaigns and the in situ measures ranged from 5 m to 18 m. UML was more superficial at the start and near the end of the sampling period (Figure 2).
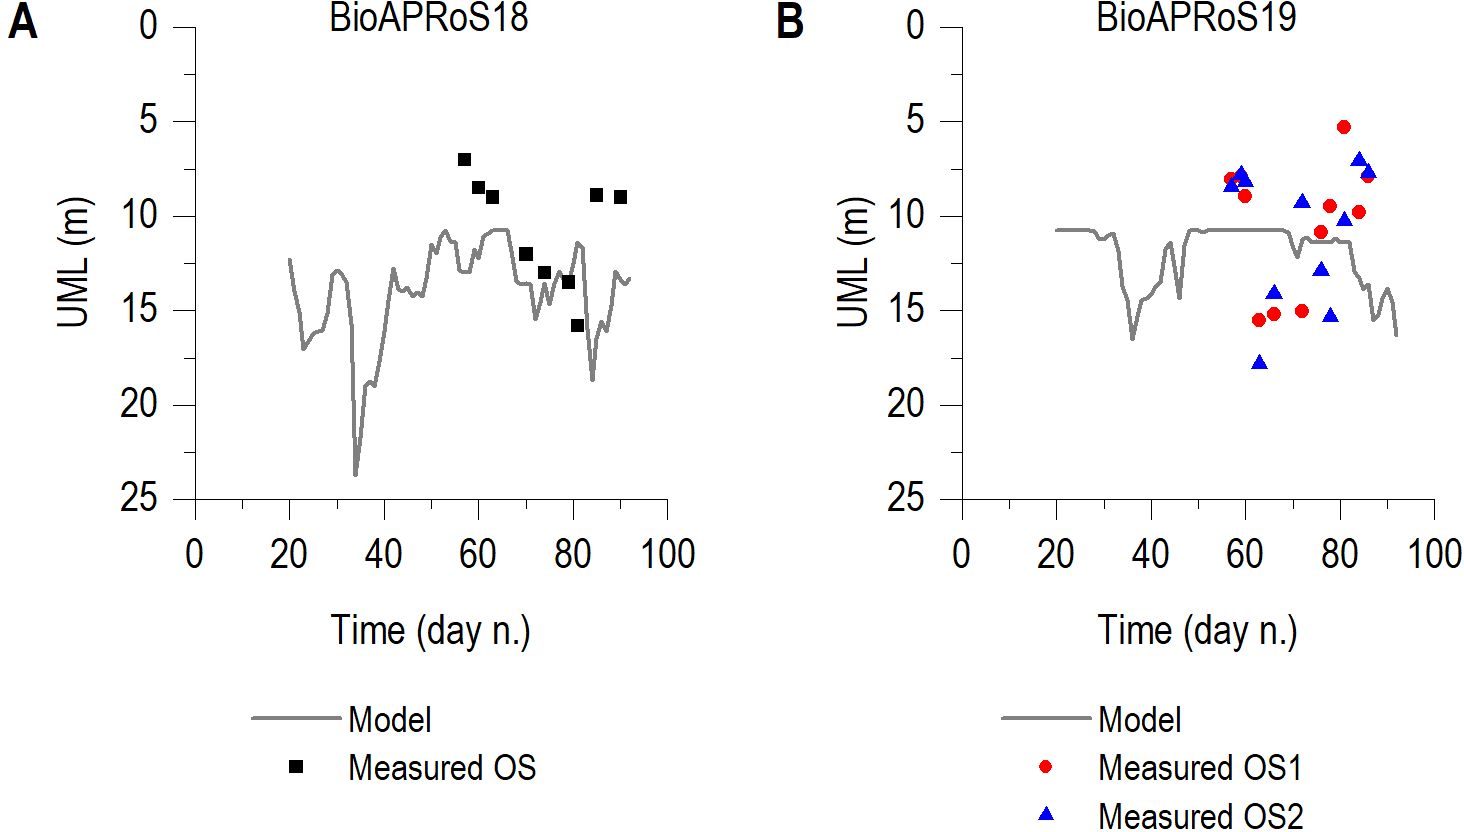
Figure 2. UML depth in BioAPRoS18 (A) and BioAPRoS19 (B). Single points from in situ measurements, lines from model.
The fluorescence maximum in both campaigns was always within the UML, between the depths of 5 and 15 m (Figure 3).
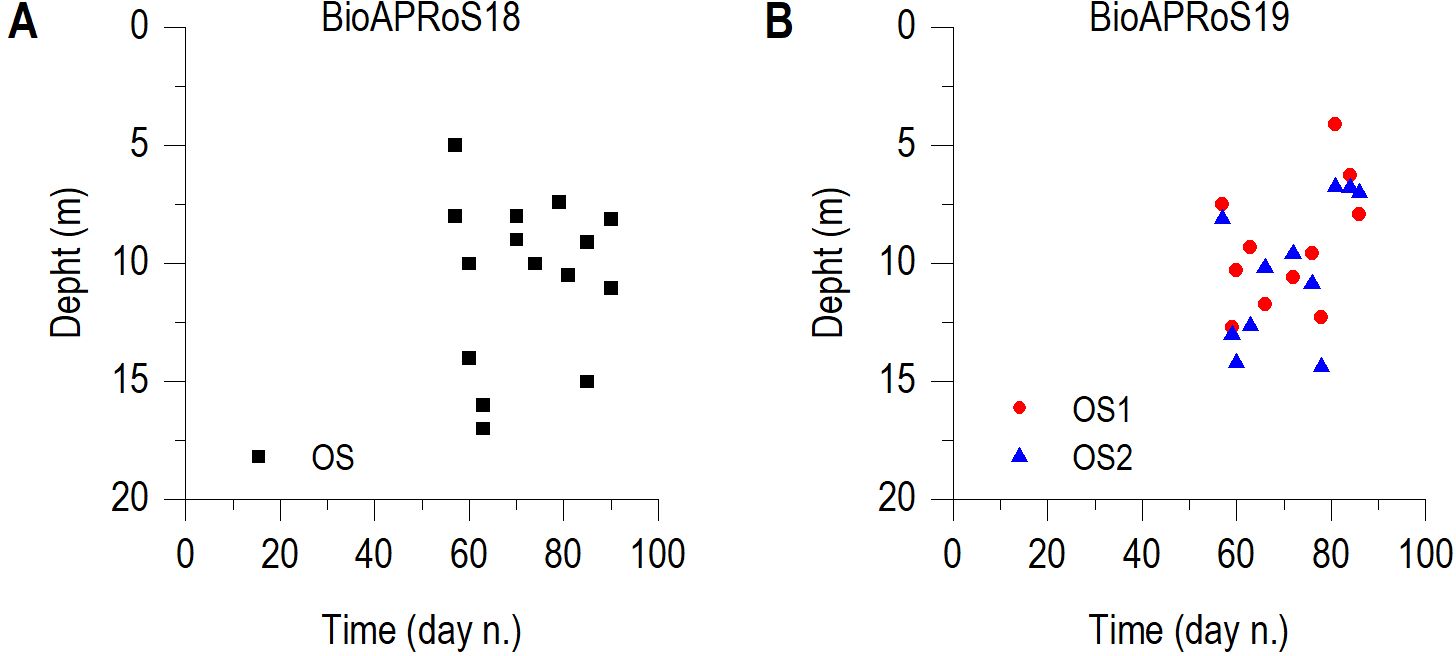
Figure 3. Depth of the fluorescence maximum in BioAPRoS18 (A) and BioAPRoS19 (B).
Sampling period of BioAPRoS18 started in mid-November when the ice cover was still present and Chla was low; at the end of December (from 27/12 to 30/12/2018) in ice free waters a maximum of about 4.5 mg m-3 was present (Figure 4A). Subsequently after a brief decrease there was a sharp Chla increase, reaching the absolute maximum of about 9 mg m-3at the end of January when sampling was stopped. BioAPRoS19 (Figure 4B) started on 14/12/2019 when Chla was nearly 1 mg m-3 in both stations and after a brief decrease reached its maximum of approximately 5.5 mg m-3 in OS1 and 6.5 mg m-3 in OS2 at 21/01/2020. Immediately after reaching their maximum, Chla began to decrease until the end of samplings which occurred on 30/01/2020.
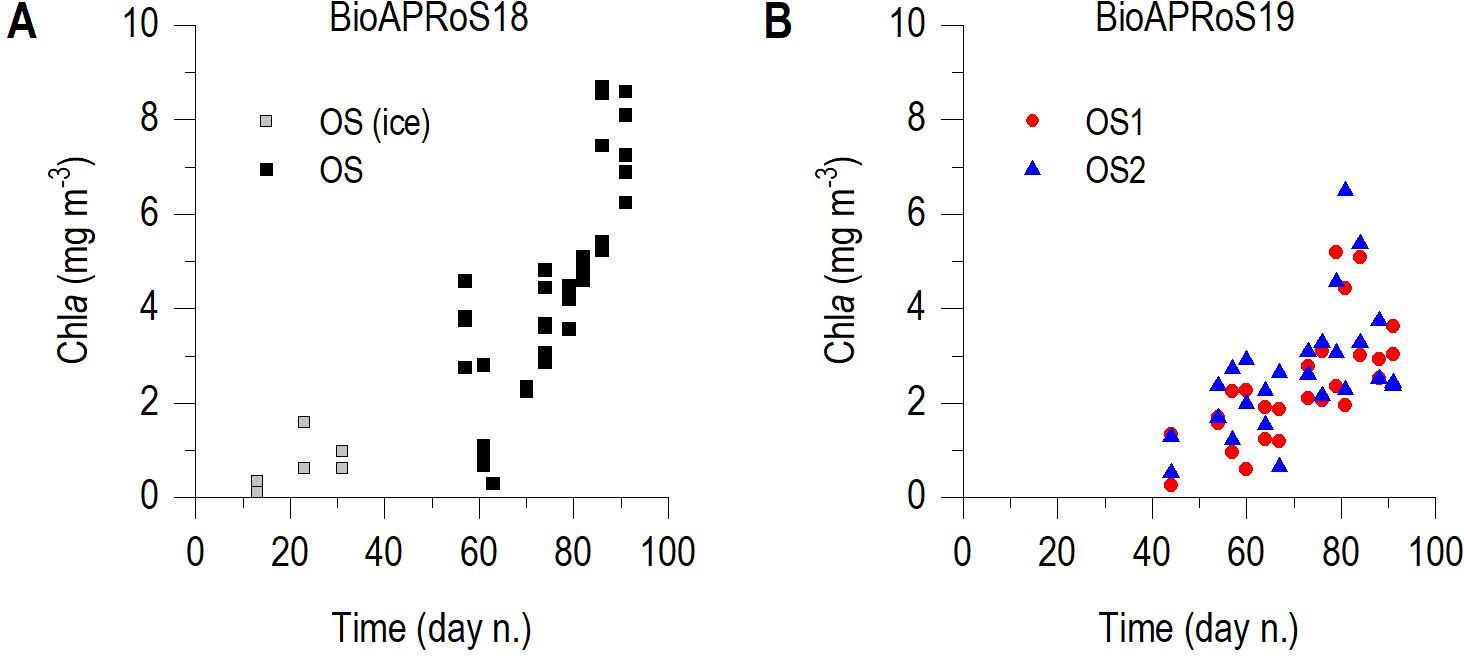
Figure 4. Temporal dynamic of Chla: (A) BioAPRoS18 and (B) BioAPRoS19. In (A) grey points refer to ice hole samples.
In both campaigns the hight initial concentrations showed a sharp decrease, reaching their minima at the same time with the Chla maxima (Figure 5).
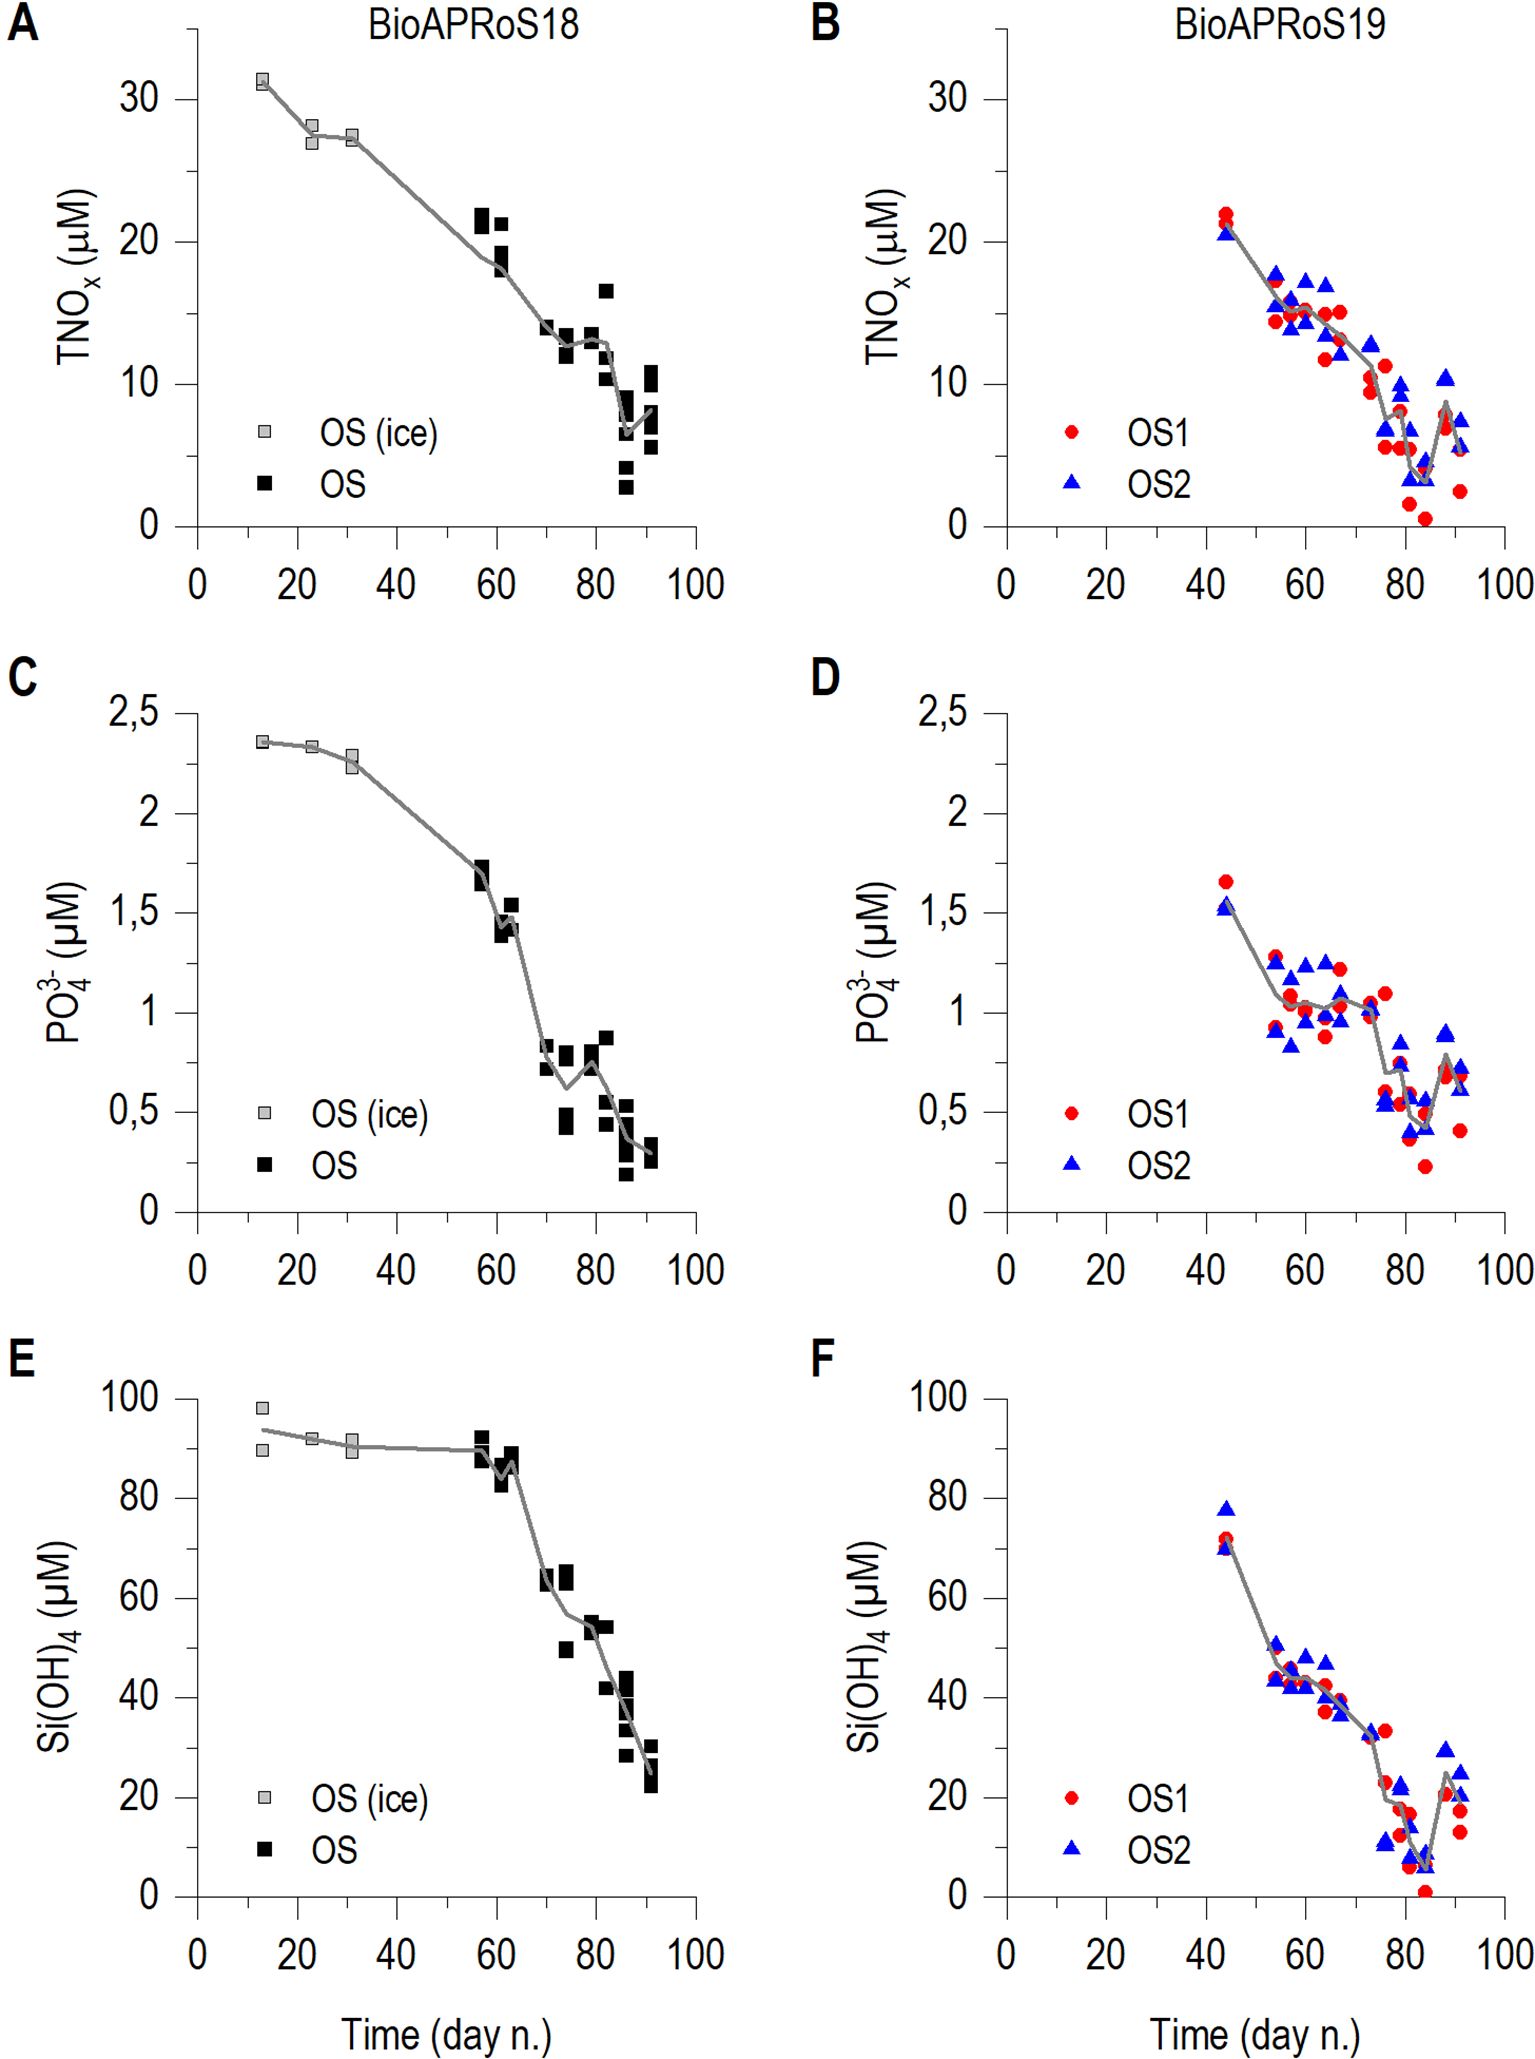
Figure 5. Temporal dynamics of: TNOx=(NO3+NO2-) (A) BioAPRoS18, (B) BioAPRoS19; PO43-, (C) BioAPRoS18, (D) BioAPRoS19; Si(OH)4, (E) BioAPRoS18, (F) BioAPRoS19. Grey points of BioAPRoS18 refer to ice hole sampling. Continuous lines represent daily mean of each nutrient.
In the ice-free UML TNOx (NO3- + NO2-) maxima were around 22 μM in both BioAPRoS campaigns (Figures 5A, B). The minimum concentrations in BioAPRoS18 were 1.75 μM (Figure 5A) while in BioAPRoS19 were lower, 0.17 μM (Figure 5B). Maxima PO43- were about 1.7 μM in BioAPRoS18 (Figure 5C) and about 1.5 μM in BioAPRoS19 (Figure 5D), minima were quite similar, 0.19 for BioAPRoS18 (Figure 5C) and 0.22 for BioAPRoS19 (Figure 5D). Maximum Si(OH)4 concentrations were about 90 μM in BioAPRoS18 (Figure 5E) and 80 μM in BioAPRoS19 (Figure 5F) and minima were different, about 20 μM (Figure 5E) and 0.99 μM respectively (Figure 5F).
From Figures 6A and 6B it is evident how the two campaigns had a very different trend of the N/P ratio. The N/P ratios under the ice cover in the first sampling days of BioAPRoS18 and at the beginning of BioAPRoS19 were about 13-14. In the first UML sampling in ice free water of BioAPRoS18 N/P ratio decreased up to 9 in correspondence with a short Chla increase and rose steeply reaching the value of 40 simultaneously at the Chla maximum (Figure 6A), reaching a condition of P deficiency. In BioAPRoS19 the N/P ratio (Figure 6B) underwent a continuous decrease up to the Chla maximum and values between 9 in OS2 and 4 in OS1 were reached, revealing a condition of N deficiency.
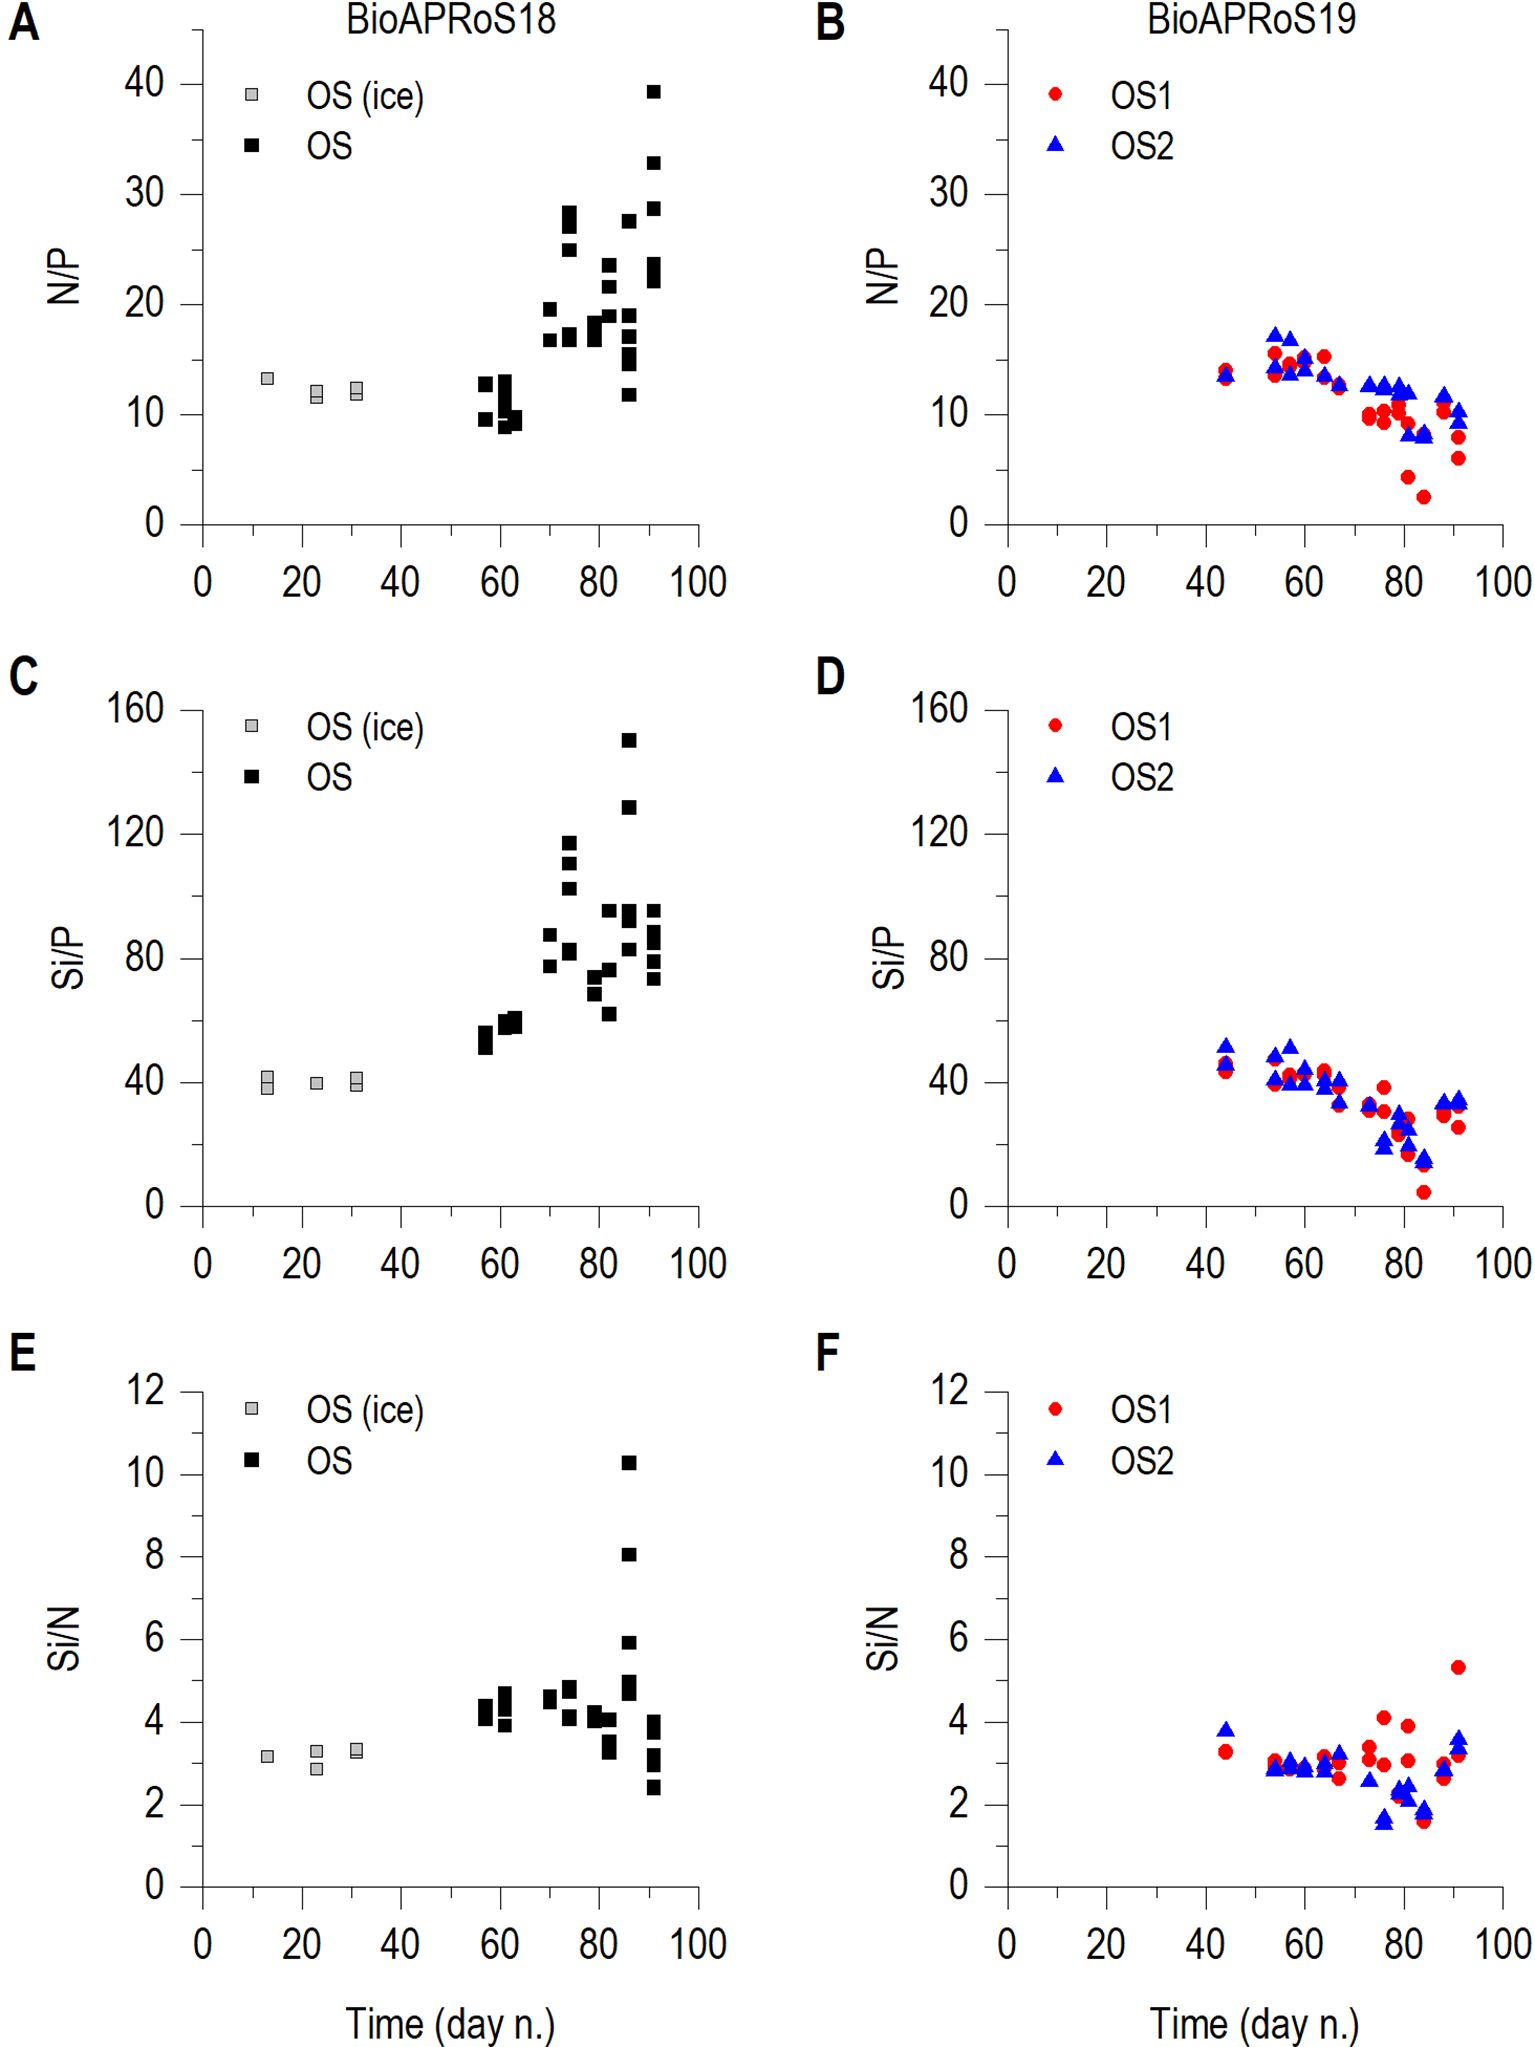
Figure 6. Temporal dynamic of: N/P, (A) BioAPRoS18, (B) BioAPRoS19; Si/P, (C) BioAPRoS18, (D) BioAPRoS19; Si/N, (E) BioAPRoS18, (F) BioAPRoS19. Grey points of BioAPRoS18 refer to ice hole sampling.
The Si/P ratio (Figures 6C, D), similarly to that of N/P, showed opposite trends in the two campaigns. The initial values were similar, both around 40, but in BioAPRoS18 (Figure 6C) they increased up to 150 at the Chla maximum, while in BioAPRoS19 (Figure 6C) decreased to a minimum of 4.3 in OS1 and 14 in OS2.
Si/N ratio in BioAPRoS18 had a biphasic trend (Figure 6E). The values of around 3, recorded during the period of ice cover, increased up to 5 and reached its maximum by exceeding 10 simultaneously with the blooming of the end of December. Subsequently Si/N decreased to about initial values of around 3. In BioAPRoS19 (Figure 6F) Si/N remained similar, initially around 2.8 and slightly increased in the last sampling days.
Chla/N ratio in the two campaigns showed a marked similarity for both temporal trend and maximum value, reaching about 1.2 µg Chla µMN-1 (Figures 7A, B). Chla/P ratio increased from very low values up to about 22.5 µg Chla µMP-1 in BioAPRoS18 (Figure 7C), while stopped at about 15 µg Chla µMP-1 in BioAPRoS19 (Figure 7D). Major differences were found in the Chla/Si ratio (Figures 7E, F). In both campaigns there was a first phase with fairly constant values of Chla/Si, with a subsequent increase which in BioAPRoS18 reached 0.25 µg Chla µMSi-1 (Figure 7E), while in BioAPRoS19 exceeded 1 and up to 3 µg Chla µMSi-1 (Figure 7F).
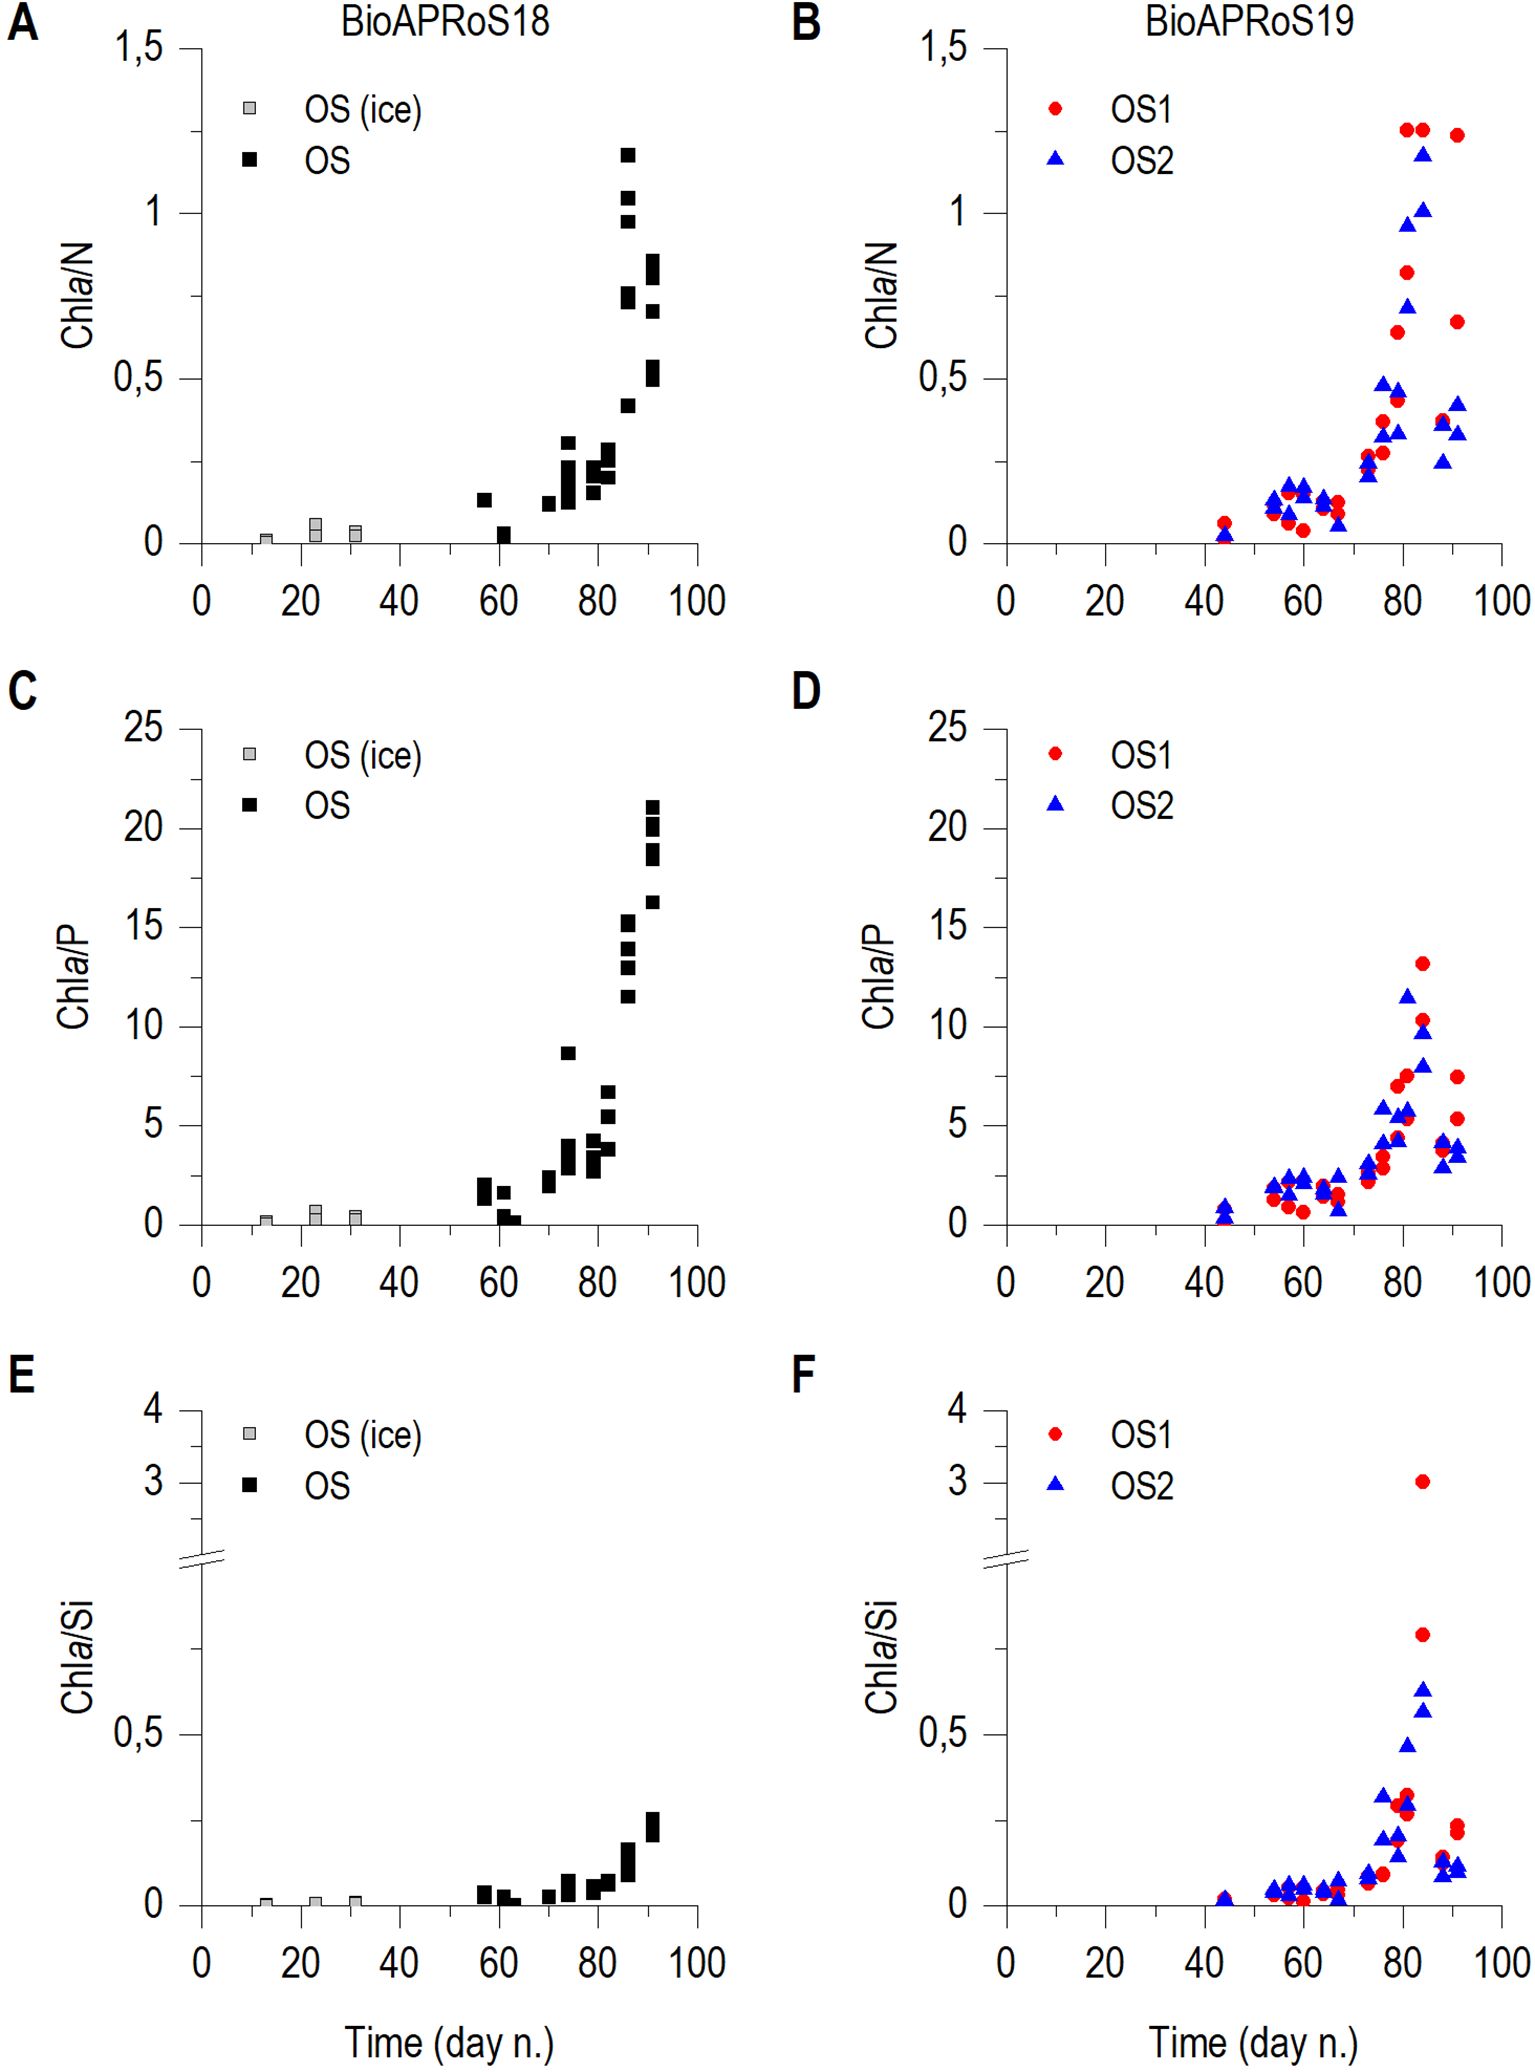
Figure 7. Temporal dynamic of: Chla/N, (A) BioAPRoS18, (B) BioAPRoS19; Chla/P, (C) BioAPRoS18, (D) BioAPRoS19; Chla/Si, (E) BioAPRoS18, (F) BioAPRoS19. Grey points of BioAPRoS18 refer to ice hole sampling.
In Figure 8 in order to compare BioAPRoS results to that of ‘90s campaigns are plotted the value of Chl/P vs Chl/N together with the 95% confidence ellipses and the relative regression lines. Figure 8A shows the data of two BioAPRoS campaigns. The points of the two campaigns located at the bottom left, i.e. which have the lowest Chl/(NP)½ ratio and belonging to the first sampling days, are very close to N/P = 16 (Figure 8A). Moving to the top right there are the data with a major value of the ratio Chl/(NP)½, corresponding to the Chl maxima. In this graph area the distribution of data points and the regression lines clearly diverge. Those of BioAPRoS18 lead to N/P values typical of the condition of P deficiency, while those of BioAPRoS19 lead toward N deficiency (Figure 8A). By comparing these distributions of points and related regression lines with those of the campaigns of the ‘90s (Figure 8B), the similarity with BioAPRoS18 emerges. In the latter campaigns there was evidence of a strong P deficiency in correspondence with Chl maxima, while in BioAPRoS19 the situation was opposite with an evident condition of N deficiency in conjunction with Chl maxima.
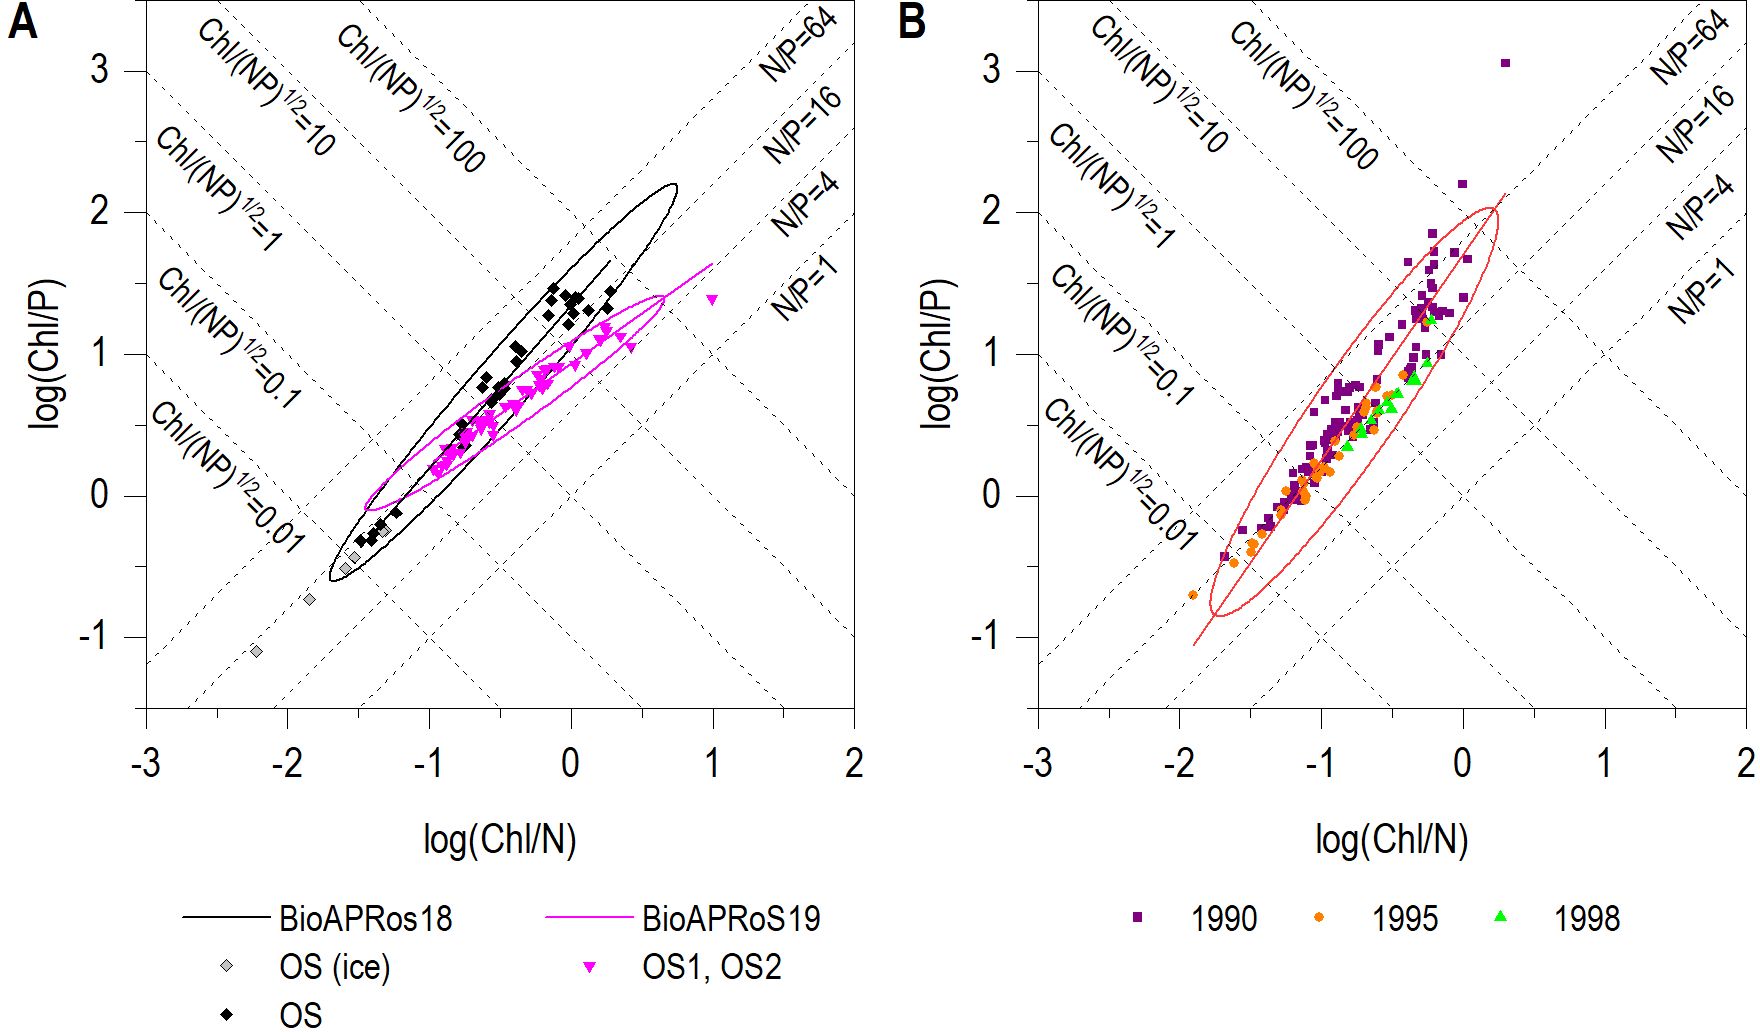
Figure 8. Plot of Chl/P vs Chl/N; (A) BioAPRoS Campaigns; (B) ‘90s campaigns. Grey points of BioAPRoS18 refer to ice hole sampling.
Pigments analysis (Figures 9A, 9B) synthetically shows how in both campaigns there was a strong dominance of diatoms deduced by the prevailing concentration of the Fucoxanthin (Fuco). The averages ratio Fuco/Chla were 0.65 and 0.50 in BioAPRoS18 and BioAPRoS19, respectively. The presence of Phaeocystis antarctica, estimated by Hex-Fuco (19-Hexanoyloxifucoxanthin), was significant only around the end of December in BioAPRoS18.
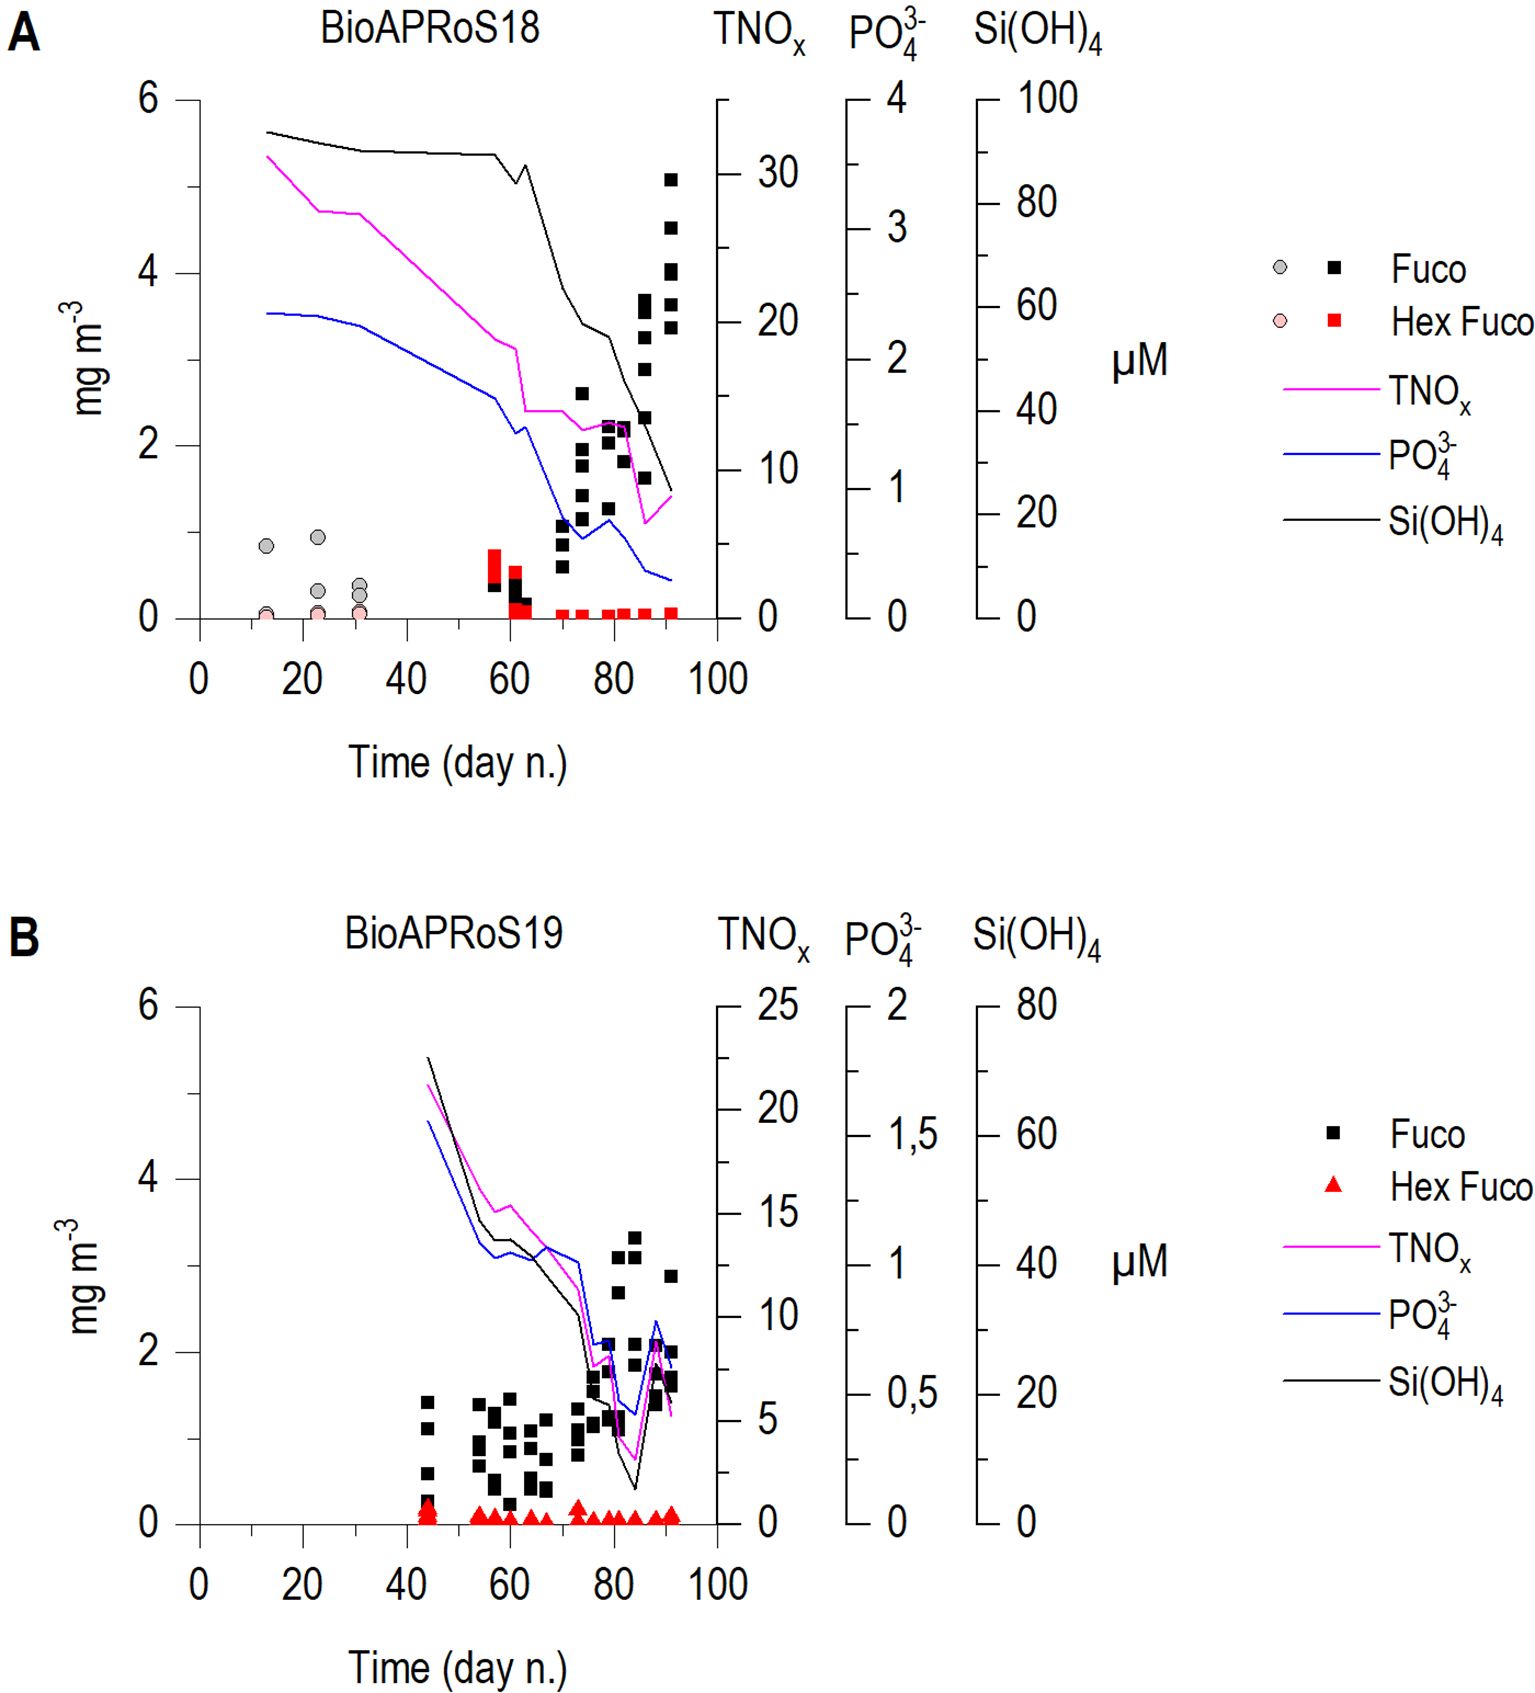
Figure 9. Temporal dynamic of concentration of Fuco and Hex-Fuco respectively diagnostic pigments for the presence of diatoms and Phaeocystis antarctica, (A) BioAPRoS18, grey and pink points refer to ice hole sampling; (B) BioAPRoS19. Continuous lines represent daily mean of each nutrient.
As already pointed out, excluding a short bloom of Phaeocystis antarctica in the last days of December 2018 (Figure 9A), the only sampling period in which their density and dominance were significant, diatoms were the most abundant group by far, even if the taxonomic composition in the two campaigns were significantly different. In BioAPRoS18 pennate dominated, never being less than the 85% of total diatoms, especially in correspondence of the Chla maxima (in the second half of January). The genus Fragilariopsis represented the bulk of the assemblage, mainly with Fragilariopsis curta followed by Fragilariopsis cylindrus/nana both reported in Figure 10 as Fragilariopsis spp. In BioAPRoS19 blooms of Phaeocystis were not detected and diatoms composition was more differentiated: in the pennate diatoms a greater presence of Pseudo-nitzschia (P. subcurvata, mainly prevailing in early summer, P. turgiduloides prevailing in late summer) together with Fragilariopsis curta (never dominant) was detected from late spring to summer, and especially a consistent presence of centrics with Chaetoceros spp. (mainly C. bulbosus) in late spring and an elevated bloom of Dactyliosolen tenuijunctus in January corresponding to the Chla maxima (Figure 10) were observed.
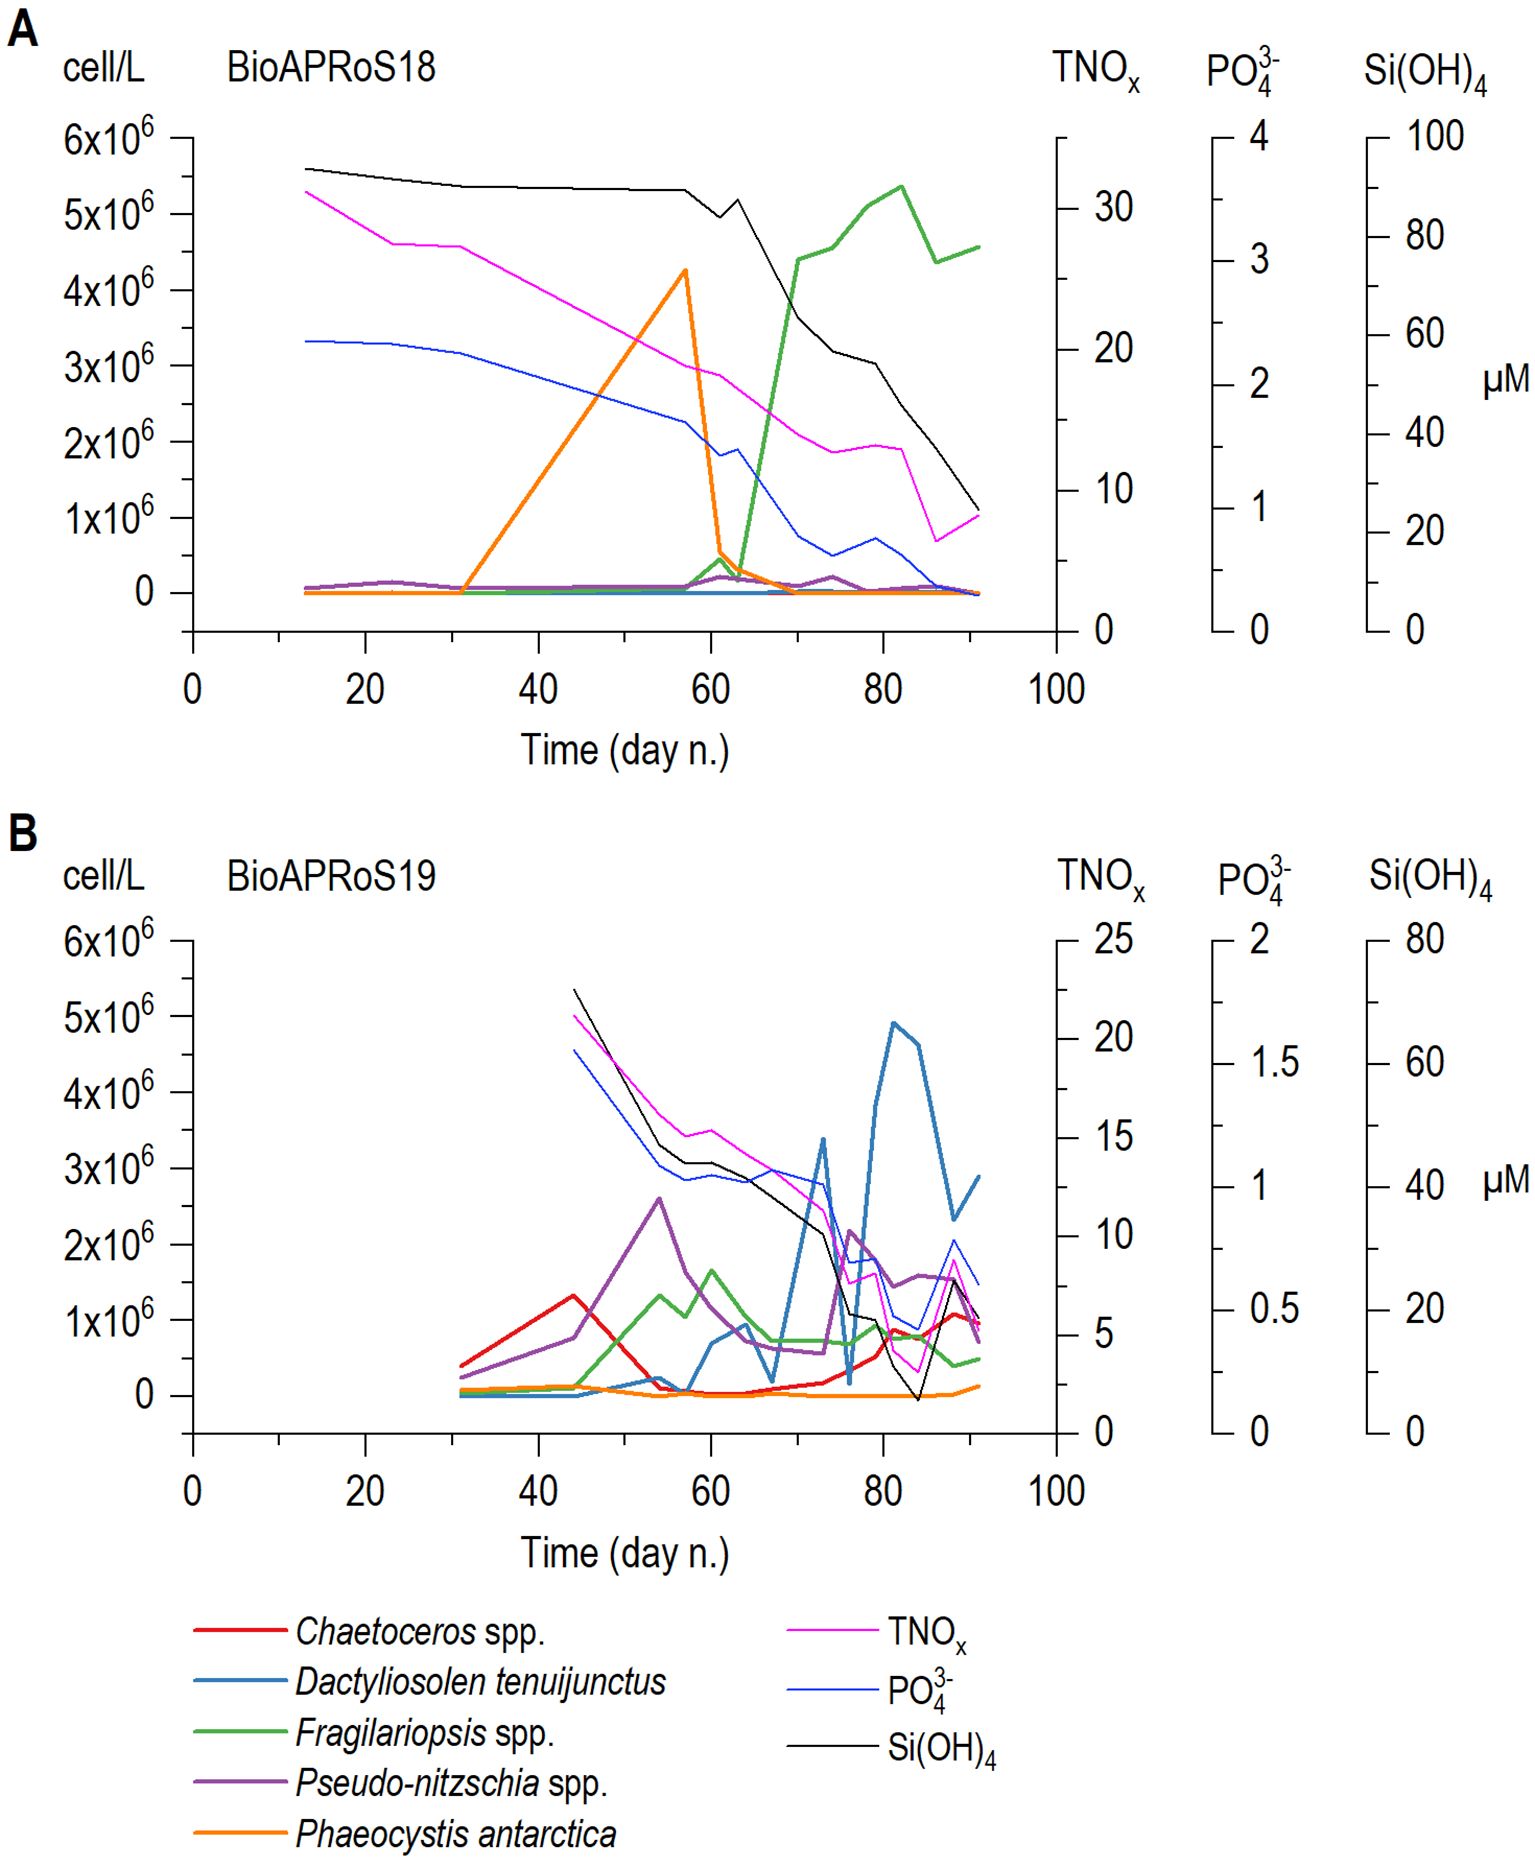
Figure 10. Temporal dynamics of the major phytoplankton genera or species abundances plotted together the daily mean of each nutrient; (A) BioAPRoS18, (B) BioAPRoS19.
Table 1 shows the removal ratios of nutrients of BioAPRoS campaigns together with the ‘90s ones, calculated using the slope of the regressions between nutrient pairs. In all cases determination coefficient, R2 of the regrssions between nutrient concentrations show high significance (p<0.01).

Table 1. ΔN/ΔP, ΔSi/ΔN and ΔSi/ΔP obtained from model II angular coefficient regressions between nutrients.
The histograms of Figure 11A show the ΔN/ΔP in TNB during the two BioAPRoS campaigns compared to that of the ‘90s. The removal ratio ΔN/ΔP, was quite similar between BioAPRoS18 and the campaigns of the ‘90s (Figure 11A) ranging from 11.32 to 12.28. During BioAPRoS18 ΔN/ΔP was 11.78 and the same ratio in 1990-1998 had an average of 11.50. Data of BioAPRoS19 were, instead very different in both stations, 17.71 and 17.53 in OS1 and OS2 respectively.
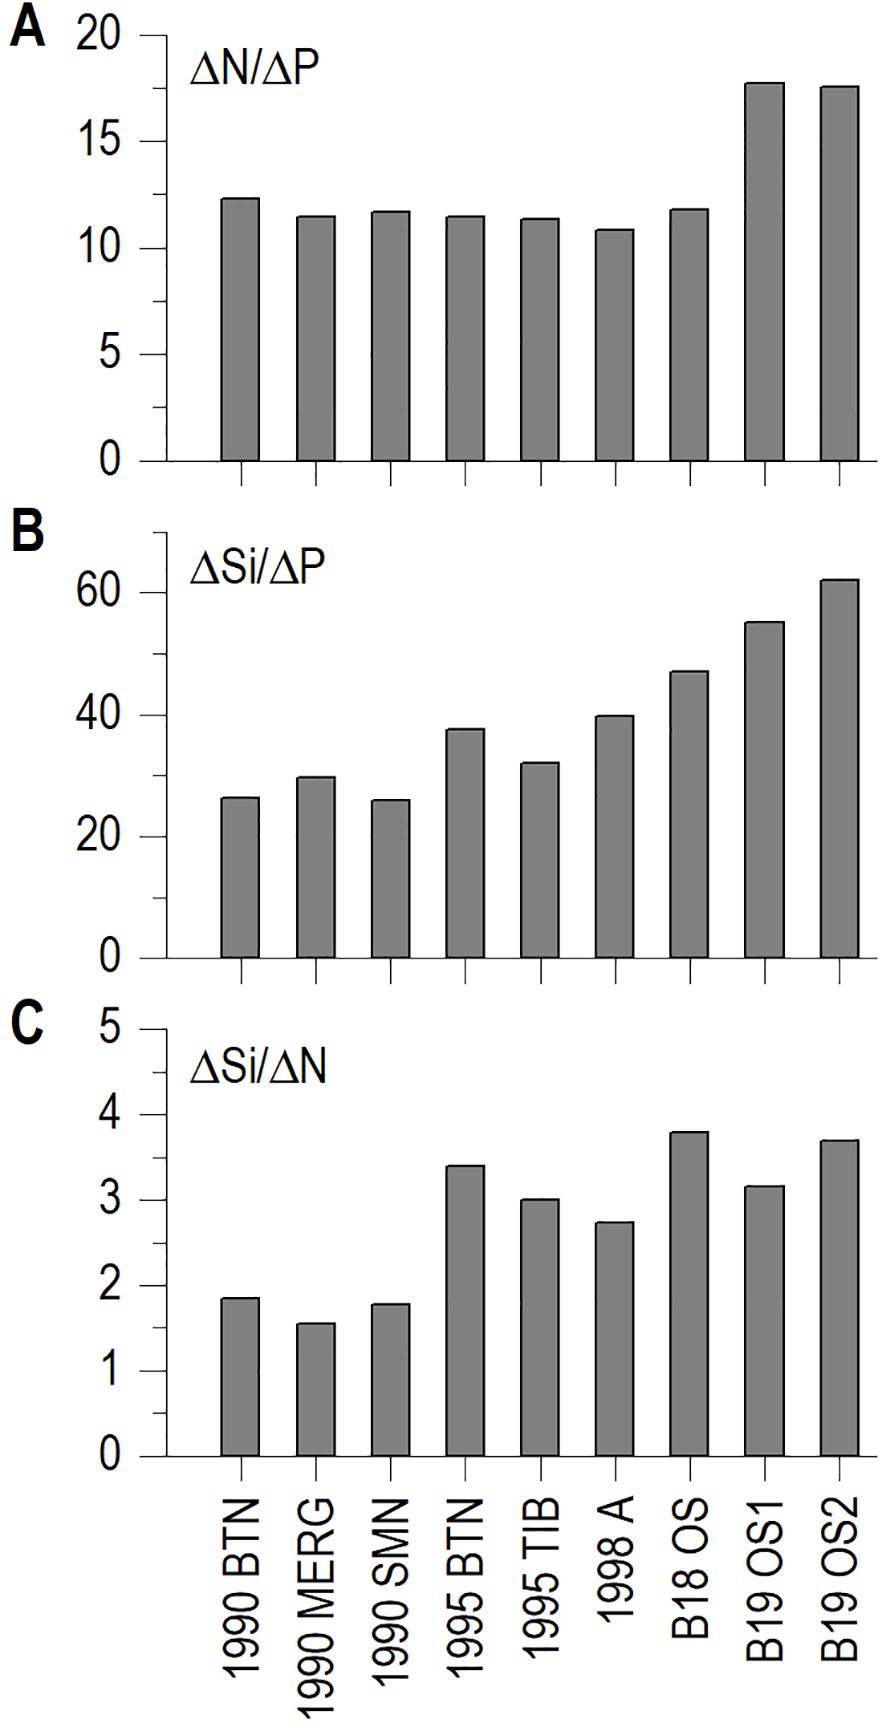
Figure 11. Histograms of ΔN/ΔP (A); ΔSi/ΔP (B); and ΔSi/ΔN (C) from angular coefficient of nutrients regressions.
Also, the ΔSi/ΔP of BioAPRoS19 differed considerably from those of the '90s, respectively with an average of 58.63 respect to 31.59 (Figure 11C) with BioAPRoS18 having an intermediate value of 47.05.
The ΔSi/ΔN of BioAPRoS19 was consistent with those of the other campaigns (Figure 11B); while the 1990 stations had lower values of the ratio around 1.3, the other averages were around 3.14, with BioAPRoS19 OS2 exceeded 3.5. In any case these values of ΔSi/ΔN are typical of phytoplankton assemblage dominated by diatoms.
The area in front of the Italian base at TNB experienced significant ice-driven dynamics, classifying it as Marginal Ice Zone (MIZ) during both spring and summer. The upwelling of Antarctic Deep Water in spring brings high concentrations of nutrients and warmer water to the surface layers, which, along with ice melting and warming due to increased solar irradiance, leads to the segregation of the UML. In line with the findings reported by Mangoni et al. (2004), in the coastal sampling stations of the BioAPRoS campaigns, the UML was persistent and always very shallow, never exceeding the depth of 20 m (Figure 2). UML thickness was at the minimum depth during the beginning of the sampling period (late November early December) and reached the maximum depths in mid-January, shortly before the maximum of Chla concentration observed within the UML (Figure 3).
The growth dynamics we have tried to represent with our sampling frequency (almost daily sampling), being higher or similar to phytoplankton growth rate (Smith et al, 1996), allows us to follow with a certain accuracy the temporal evolution of nutrient concentrations, phytoplankton biomass and its taxonomic composition in a largely segregated UML system (Catalano et al., 1997). UML spring summer phytoplankton growth is supported by favourable conditions of light, temperature and large nutrient availability (Figure 5). Under these conditions, variations in nutrient concentration appear to be essentially regulated by phytoplankton consumption. Only at the end of the cycle, at the end of summer, when nutrients become scarce, some other processes can supply the surface layers with nutrients in relation to weakening of the UML or on-site degradation of accumulated particulate and dissolved organic matter (Smith and Kaufman, 2018). These processes can modify the dynamics of phytoplankton biomass within the UML as highlighted by Mangoni et al. (2017). Innamorati et al. (2000) especially associate weakening of the UML and replenishing of nutrients with the appearance of a second maximum of Chla, not seen in the two more recent campaigns. These contributions can alter and affect the measurements of phytoplankton consumption/utilization of nutrients. In these cases, given the sensitivity of the system, we should expect a positive response of phytoplankton dynamics, which however has not been recorded (Figure 4).
Both BioAPRoS campaigns exhibited comparable temporal nutrient dynamics and concentrations within the UML. Maximum nutrient concentrations were detected as the ice cover vanished, followed by their minimum level during the Chla peaks (Figures 4, 5). Recent campaigns maximum and minimum nutrient concentrations mirror those reported for 1987/88, 1989/90 and 1994/95 at TNB by Innamorati et al. (2000) and Catalano et al. (2000). UML Nutrients dynamics was synchronously opposite to that of Chla highlighting a pronounced consumption of nutrients during the growth of phytoplankton biomass (Figures 4, 5). Although Chla values correspond to those reported by Innamorati et al. (2000) for ‘90s campaign, their temporal dynamics exhibited some deviations. The previous campaigns maximum occurred approximately a month earlier, between end of December-mid January, followed by a second rise in early February not observed in the BioAProS campaigns. Innamorati et al. (2000) outlined that phytoplankton biomass declines at TNB during summer primarily derive from reduced nutrients availability. As shown in Figure 8, the ratio Chl/(NP)½ approaches 100 in both BioAPRoS and 90s campaigns. This threshold poses a limitation of nutrients exploitation at TNB, which is still lower than the more efficient nutrient utilization in other seas (Innamorati and Giovanardi, 1992). Thus, the presence of other limiting factors beyond general nutrient scarcity can be assumed. Iron deficiency leads to the failure to exploit the still high concentrations of macro-nutrient. Although iron limitation has been postulated (Martin et al., 1990) and verified (Sedwick et al., 2000; Feng et al., 2010; Smith and Kaufman, 2018) to be a limiting factor in The Ross Sea, it seems more pertinent to offshore Ross Sea areas than TNB coastal zones (Sedwick and DiTullio, 1997; Sedwick et al., 2000; Arrigo et al., 2003) strongly influenced by the melting of the ice. However, the role of iron in the UML of coastal TNB requires further investigation. In summer, following robust phytoplankton growth, together with the lower nutrient concentrations a strong imbalance in their ratios occurs, which has been defined as an important limiting factor at TNB (Innamorati et al., 2000). Notably, the N/P ratio undergoes significant changes during the spring-summer period. Initially and early spring UML, N/P ratio was near the theoretical Redfield value (Figure 8A). Over time, during the phytoplankton bloom, in BioAPRoS18 and particularly in the ‘90s campaigns (Figure 8B), this ratio rises to remarkably high levels, leading to a pronounced P deficiency (Catalano et al., 2000; Innamorati et al., 2000; Sweeney et al., 2000; Saggiomo et al., 2002). In BioAPRoS18 the N/P ratio rose up to 40 and higher values was reached in ‘90s (Figures 8, 6A). Conversely, in the BioAPRoS19, N/P ratio fluctuated from the beginning of the season up to the Chla maximum, culminating at approximately 4 (Figure 6B), a condition of N deficiency unprecedented in previous observations at TNB. Modification of the in-water nutrients ratios in the UML likely arises from the distinct ways in which the phytoplankton assimilate these nutrients. A confirmation is evident in the dynamics of Si(OH)4. The concentration of Si(OH)4 remained constant during the short initial bloom of Phaeocystis in BioAPRoS18 (Figures 5E, 9A, 10A) and starts to decrease only when diatoms become dominant in the phytoplankton community. In BioAPRoS19, where the community has always been dominated by diatoms, Si(OH)4 shows a continuous decrease (Figure 5F). This dynamics underscores the system sensitivity to changes: even a slight shift in assemblage composition over a few days results in an immediate alteration in UML nutrient concentration, confirming the prevalent role of the phytoplankton and its taxonomic composition in UML nutrient removal following their preferences.
Based on this awareness, nutrient removal ratios ΔN/ΔP, ΔSi/ΔN and ΔSi/ΔP were estimated. Specifically, ΔN/ΔP ratio deviated from its theoretical value, assuming a lower value of about 11.8 during BioAPRoS18, similarly to the average of 11.5 measured during the ‘90s campaigns (Table 1; Figure 11). These values align with those reported by Catalano et al. (1997); Catalano et al. (2000); Saggiomo et al. (2002) for TNB, as well as by Arrigo et al. (2000); Sweeney et al. (2000); Smith and Asper (2001); Dunbar et al. (2003) for diatom dominated phytoplankton assemblage of the Ross Sea. This phenomenon, termed luxury consumption, signified that P removal surpasses theoretical N removal, a pattern often observed in diatoms. It is to be expected that the strategies of phytoplankton nutrients assimilation determine alteration in the original in-water N/P ratios. A ΔN/ΔP removal ratio of about 11.5 determines a P deficiency state over time. Conversely, the nutrients ratios dynamic during BioAPRoS19 displayed an opposite trend. The ΔN/ΔP ratio average was 17.6, surpassed the theoretic reference of 16 (Table 1; Figure 11), indicating a greater preference for N over P utilization. This accounts for the occurrence of N deficiency, an unprecedented event in previous years in TNB.
In BioAPRoS19, along with the previously unobserved N deficiency, an equally unprecedented bloom of Dactyliosolen tenuijunctus was identified (Figure 10B). In both BioAPRoS campaigns diatoms dominated; however, the phytoplankton bloom described since the ‘90s in TNB was typically dominated by pennate diatoms, mainly Fragilariopsis curta, as reported by Nuccio et al. (2000); Mangoni et al. (2017); Saggiomo et al. (2021). The same phytoplankton composition was also observed during the Chla maximum in BioAPRoS18 (Figure 10A). In BioAPRoS19, alongside the pennate diatoms (mostly Pseudo-nitzschia spp.), the centric Dactyliosolen tenuijunctus dominanted during the peak phase. Dactyliosolen tenuijunctus was previously found in TNB as the prevailed species in the November sea-ice column (Saggiomo et al., 2017), in limited quantities during the ice melting period (Nuccio et al., 2000; Mangoni et al., 2017), together with other centric diatoms, primarily in offshore waters (Saggiomo et al., 2021). The dominance of Dactyliosolen tenuijunctus, along with a notable presence of Pseudo-nitzschia spp. and Chaetoceros spp., and the reduced presence of Fragilariopsis, confirm the peculiar nature of the blooming phytoplankton assemblage of BioAPRoS19. A similar Dactyliosolen tenuijunctus bloom was recently documented by Lee et al. (2022) in the neighboring Amundsen Sea during austral summer 2020. The authors classified this event as an extraordinary occurrence, possibly associated to the ongoing effects of climate change. It is plausible that the Dactyliosolen tenuijunctus bloom could be connected through horizontal transport between the Amundsen Sea and the Ross Sea. Various waters fluxes in the coastal area of TNB lead to the growth and accumulation of centric diatoms assemblage, more typical of offshore waters (Saggiomo et al., 2021).
It is well known that grazing by krill and Copepods plays an important role in Antarctica and in the Ross Sea, through which about half of the phytoplankton primary production is transferred to higher trophic levels (Smith et al., 2017). Their intervention on the phytoplankton community is always very important on the biomass present, but it can also be important on the taxonomic composition due to the diet selectivity (Hopkins, 1987, Crescenti et al., 2000). This selectivity is essentially expressed on a dimensional basis and with the general preference of the diatoms over the Phaeocystis (Meyer and ElSayed, 1987, Hopkins 1987, Haberman et al., 2003; Nejstgaard et al., 2007; Smith et al., 2017). As far as it is known regarding grazing selectivity among diatoms, Meyer and El Sayed (1987) report that krill have a higher filtration efficiency for Nitzschia and Chaetoceros than for Fragilariopsis. On the contrary, we could not find information about the selectivity of grazing on Dactyliosolen tenuijunctus, therefore, it is very difficult to evaluate the role of grazing in selecting species dominance in TNB diatom assemblages. However, considering the size dominance of grazing process, it does not seem that this could be a strong discriminant between the dominance of Dactyliosolen tenuijunctus or Fragilariopsis curta.
By merging the described nutrients and phytoplankton dynamics, it can be assumed that the blooms of Fragilariopsis curta were associated with a condition of P deficiency due to their reliance of N and P with a ΔN/ΔP ratio within the 10.8-12.3 range, indicating a preferential assimilation of P over N. The BioAPRoS19 campaign in TNB stands out, not only for the different taxonomic composition of phytoplankton highlighted by the unexpected Dactyliosolen tenuijunctus bloom but also for its distinctive nutritional dynamics. Differing from all previous campaigns in TNB, the N/P ratio, at the Chla peak, showed a state of N deficiency, driven by the ΔN/ΔP ratio exceeding 17.5. This highlights elevated N disappearance respect to P, an opposite condition compared to the Fragilariopsis curta-dominated assemblage, indicating different nutrients assimilation modalities. An analogous increase in the ΔN/ΔP ratio was also noted in waters dominated by Phaeocystis antarctica, typically offshore and along the southern part of the Ross Ice Shelf in the Ross Sea. In these waters ΔN/ΔP ratio can rise beyond Redfield value, reaching approximately 19 due to the nutritional preferences of Phaeocystis antarctica (Arrigo et al., 2000; Sweeney et al., 2000; Smith and Asper, 2001; Dunbar et al., 2003). However, no Phaeocystis blooms were detected during BioAPRoS19, except for a very slight increase in its abundance in the final days of sampling. Instead, a short Phaeocystis antarctica bloom emerged between mid- December and the end of December during BioAPRoS18.
Typically, at TNB, in relation to the diatoms dominance, ΔSi/ΔN ratio consistently exceeds 1.5, often surpassing 3, particularly during the BioAPRoS campaigns. The Si concentrations in the two campaigns at blooming time are different, higher in BioAPRoS18 than in BioAPRoS19 (Figures 5E, F; 10). Also Si/P dynamics differ markedly between the two BioAPRoS campaigns (Figure 6): in BioAPRoS18 it increased in correspondence with the peak of Chla, whereas in contrast, it decreased in BioAPRoS19. Notably, in latter campaign, ΔSi/ΔP values surged to over 50, the highest recorded. Petrou et al. (2019) described changes in Si utilization by Antarctic diatoms in relation to the acidification of the Southern Ocean.
The assemblage dominated by Dactyliosolen tenuijunctus exhibited not only an elevated ΔN/ΔP ratio but also grater ΔSi/ΔP ratio (Figure 11). This can be explained by a greater N requirement, lower need of P by Dactyliosolen tenuijuncus unlike Fragilariopsis curta. Consequently, biogeochemical differentiation emerges between the two BioAPRoS campaigns which involves the concentrations and the relationships not only between N, P but also with Si, of which, most probably, the phytoplankton assemblage is the main protagonist. The series of campaigns of the ‘90s and further sampling of BioAPRoS18 exhibit a general stability in phytoplankton assemblage composition and biogeochemical characteristics (Catalano et al., 2000; Innamorati et al., 2000; Nuccio et al., 2000; Mangoni et al., 2017; Bolinesi et al., 2020; Saggiomo et al., 2021). The variations that arise from the comparison of this series of campaigns include a slight increasing trend of ΔSi/ΔP from 1990 to 2018, and lower ΔSi/ΔN in 1990, as well as the temporal differences in the dynamics of the phytoplankton biomass. The temporal discrepancies appear to correlate with the period of ice cover melting and disappearance, which, in turn, are connected to the annual weather variability. Conversely, the results of BioAPRoS19 show distinct conditions compared to previous year and entirety of the ‘90s. Specifically, in contrast to previous campaigns with the dominance of Fragilariopsis curta, where N/P reached hight values (Figure 8A), the appearance of a different phytoplankton composition with distinct nutrient requirements resulted in a state of N deficiency related to higher ΔN/ΔP. Literature has long highlighted the differing nutritional needs of the Ross Sea pennate diatoms assemblage and those dominated by Phaeocystis antarctica. This study, enabled by microscopic analyzes of the phytoplankton assemblage composition, further distinguished the nutritional requirements between the two assemblages dominated by Fragilariopsis curta and Dactyliosolen tenuijunctus.
These findings suggest at least two considerations. The first refers to the importance of deepening the study of the photo-physiological, ecological and biogeochemical behaviour of the different species, made possible by the recent development of bio-optical models for the estimation of pelagic primary production (Bonamano et al., 2020). The second refers to the conditions of the TNB ecosystems. The Ross Sea and TNB are among the planet most significant marine ecosystems, exerting a profound global influence, in fact these regions support high primary production and play a crucial role in generating the conveyor belt system that fuels ocean currents (Rahmstorf, 2006). TNB ecosystems, which remained fairly stable since the ‘90s, could potentially undergo shifts in their biological and biogeochemical characteristics, echoing concerns raised by Mangoni et al. (2017) and by Smith et al. (2012) for the entire Ross Sea. The insights gained so far underscore the need for in-depth research and ongoing monitoring into the context of planetary climate change.
The results of recent BioAPRoS18 and BioAPRoS19 campaigns compared with those carried out in the ‘90s at BTN show many similarities and some important differences. UML formation modalities and characteristics, nutrient concentrations and their ratios (like Redfield) in spring-early summer and their strong consumption associated with phytoplankton growth in summer are similar. At summer Chla maxima, reached with some temporal deviations between recent and ‘90s campaigns, nutrient concentrations were at their minima. At this stage in BioAPRoS18, a recurrent condition of P deficiency already observed at TNB, and elsewhere in the Ross Sea, was detected due to preferential assimilation of P over N (ΔN/ΔP about 11.5). Associated with this condition, the recurrent bloom of pennate diatoms like Fragilariopsis curta, was present. Conversely, the BioAPRoS19 campaign exhibited different nutritional dynamics, marked by N deficiency (ΔN/ΔP = 17.6) and a bloom of centric Dactyliosolen tenuijunctus, which shows different nutrient requirements among diatoms species and which was never detected in this area. Furthermore, during the bloom of the two phytoplankton assemblages differences also emerged in the Chla/Si and Si/P ratios, probably linked to their preferences in the utilization of Si.
These results highlight the importance of studying ecological and biogeochemical role of the different phytoplankton species, the potential for shifts in the TNB ecological and biogeochemical characteristics. Given their global influence on ocean currents, primary production, and carbon storage, understanding these ecosystems is vital in the context of planetary climate change. The study offers insights into the complex interactions between nutrient availability, phytoplankton dynamics, and the effects of changing ice cover, contributing to our understanding of the intricate relationships within these critical marine environments.
The raw data supporting the conclusions of this article will be made available by the authors, without undue reservation.
LM: Conceptualization, Data curation, Writing – original draft, Resources. CN: Data curation, Supervision, Validation, Writing – review & editing, Resources. CM: Data curation, Visualization, Writing – review & editing, Formal analysis, Resources. SBe: Data curation, Funding acquisition, Project administration, Writing – review & editing, Resources. GM: Data curation, Writing – review & editing, Resources. LV: Formal analysis, Writing – review & editing, Data curation, Resources. SBo: Writing – review & editing, Data curation, Resources, Validation. AM: Writing – review & editing, Data curation, Resources. VP: Writing – review & editing, Data curation, Resources. MM: Writing – review & editing, Data curation, Resources. LL: Writing – review & editing, Data curation, Resources, Supervision.
The author(s) declare financial support was received for the research, authorship, and/or publication of this article. This research is part of the “Biogenic Aerosol and Primary production in the Ross Sea-BioAPRoS” project, funded by the MIUR (Italian Ministry of University and Research) through PNRA (Programma Nazionale di Ricerca in Antartide) Grant no. PNRA16_00065-A1.
Thanks are due to Dr. Elia Petrozzi and Dr. Matilde Pelagatti for their collaboration in the microscopic analysis of phytoplankton. The authors want also to thank the referees whose comments improved the quality of the original mnuscript.
The authors declare that the research was conducted in the absence of any commercial or financial relationships that could be construed as a potential conflict of interest.
All claims expressed in this article are solely those of the authors and do not necessarily represent those of their affiliated organizations, or those of the publisher, the editors and the reviewers. Any product that may be evaluated in this article, or claim that may be made by its manufacturer, is not guaranteed or endorsed by the publisher.
Alderkamp A. C., Kulk G., Buma A. G. J., Visseret R. W., Van Dijken G. L., Mills M. M., et al. (2012). The effect of iron limitation on the photophysiology of Phaeocystis antarctica (Prymnesiophyceae) and Fragilariopsis cylindrus (Bacillariophyceae) under dynamic irradiance. J. Phycol. 48, 45–59. doi: 10.1111/j.1529-8817.2011.01098.x
Andreoli C., Tolomio C., Moro I., Radice M., Moschin E., Bellato S. (1995). Diatoms and Dinoflagellates in Terra Nova Bay (Ross Sea-Antarctica). Polar Biol. 15, 465–475. doi: 10.1007/BF00237460
Arrigo K. R., DiTullio G. R., Dunbar R. B., Robinson D. H., VanWoert M., Worthen D. L., et al. (2000). Phytoplankton taxonomic variability in nutrient utilization and primary production in the Ross Sea. J. Geophys. Res.: Oceans 105, 8827–8846. doi: 10.1029/1998JC000289
Arrigo K. S., McClain C. R. (1994). Spring phytoplankton production in the Western Ross Sea. Sci. NS 266, 261–263. Available at: https://www.jstor.org/stable/2884767.
Arrigo K. R., van Dijken G. L., Bushinsky S. (2008). Primary production in the Southern ocean 1997-2006. J. Geophys. Res.: Oceans 113, 1–27. doi: 10.1029/2007JC004551
Arrigo K. R., Weiss A. M., Smith W. O. Jr. (1998). Physical forcing of phytoplankton dynamics in the southwestern Ross Sea. J. Geophys. Res.: Oceans 103, 1007–1021. doi: 10.1029/97JC02326
Arrigo K. R., Worthen D. L., Robinson D. H. (2003). A coupled ocean-ecosystem model of the Ross Sea: 2. Iron regulation of phytoplankton taxonomic variability and primary production. J. Geophys. Res.: Oceans 108, 1–24. doi: 10.1029/2001JC000856
Barlow R. G., Cummings D. G., Gibb S. W. (1997). Improved resolution of mono- and divinyl chlorophylls a and b and zeaxanthin and lutein in phytoplankton extracts using reverse phase C-8 HPLC. Mar. Ecol. Prog. Ser. 161, 303–307. doi: 10.3354/meps161303
Bolinesi F., Saggiomo M., Ardini F., Castagno P., Cordone A., Fusco G., et al. (2020). Spatial-related community structure and dynamics in phytoplankton of the Ross Sea, Antarctica. Front. Mar. Sci. 7. doi: 10.3389/fmars.2020.574963
Bonamano S., Madonia A., Piermattei V., Stefanì C., Lazzara L., Nardello I., et al. (2020). Phyto-VFP: a new bio-optical model of pelagic primary production based on variable fluorescence measures. J. Mar. Syst. 204, 103304. doi: 10.1016/j.jmarsys.2019.103304
Catalano G., Benedetti F., Predonzani S., Goffart A., Ruffini S., Rivaro P., et al. (2000). “Spatial and temporal patterns of nutrient distributions in the Ross Sea,” in Ross Sea Ecology. Eds. Faranda F. M., Guglielmo L., Ianora A. (Springer, Berlin), 231–245. doi: 10.1007/978-3-642-59607-0_9
Catalano G., Povero P., Fabiano M., Benedetti F., Goffart A. (1997). Nutrient utilisation and particulate organic matter changes during summer in the upper mixed layer (Ross Sea, Antarctica). Deep Sea Res. Part I: Oceanogr. Res. Papers 44, 97–112. doi: 10.1016/S0967-0637(97)85248-X
Crescenti N., Guglielmo L., Costanzo G., Zagami G., Granata A. (2000). “Occurrence of Mysidacea (Crustacea) in the Pacitic Sector of Antarctica and Distribution of Antarctomysis ohlini in Terra Nova Bay (Western Ross Sea),” in Ross Sea Ecology. Eds. Faranda F. M., Guglielmo L., Ianora A. (Springer, Berlin), 335–350. doi: 10.1007/978-3-642-59607-0_26
Dunbar R. B., Arrigo K. R., Lutz M., DiTullio G. R., Leventer A. R., Lizotte M. P., et al. (2003). “Non-Redfield production and export of marine organic matter: a recurrent part of the annual cycle in the Ross Sea, Antarctica,” in Biogeochemistry of the Ross Sea, vol. 78 . Eds. DiTullio G. R., Dunbar R. B., American Geophysical Union (Washington, D.C.)., 179–196. doi: 10.1029/078ARS11
Feng Y., Hare C. E., Rose J. M., Handy S. M., DiTullio G. R., Lee P. A., et al. (2010). Interactive effects of iron, irradiance and CO2 on Ross Sea phytoplankton. Deep Sea Res. I 57, 368–383. doi: 10.1016/j.dsr.2009.10.013
Garrison D. L., Gibson A., Coale S. L., Gowing M. M., Okolodkov Y. B., Fritsen C. H., et al. (2005). Sea-ice microbial communities in the Ross Sea: autumn and summer biota. Mar. Ecol. Prog. Ser. 300, 39–52. Available at: https://www.jstor.org/stable/24869728.
Goffart A., Catalano G., Hecq J. H. (2000). Factors controlling the distribution of diatoms and Phaeocystis in the Ross Sea. J. Mar. Syst. 27, 161–175. doi: 10.1016/S0924-7963(00)00065-8
Grasshoff K., Kremling K., Ehrhardt M. (Eds.) (1999). Methods of seawater analysis (Weinheim: Wiley-VCH Verlag, GmbH), 600. doi: 10.1002/9783527613984
Guglielmo L., Carrada G. C., Catalano G., Cozzi S., Dell’Anno A., Fabiano M., et al. (2004). Biogeochemistry and algal communities in the annual sea ice at Terra Nova Bay (Ross Sea, Antarctica). Chem. Ecol. 20, 43–55. doi: 10.1080/02757540310001656657
Guglielmo L., Carrada G. C., Catalano G., Dell’Anno A., Fabiano M., Lazzara L., et al. (2000). Structural and function properties of sympagic communities in the annual sea ice at Terra Nova Bay (Ross Sea, Antarctica). Polar Biol. 23, 137–146. doi: 10.1007/s003000050019
Haberman K. L., Ross R. M., Quetin L. B. (2003). Diet of the Antarctic krill (Euphausia superba Dana): II. Selective grazing in mixed phytoplankton assemblages. J. Exp. Mar. Biol. Ecol. 283, 97–113. doi: 10.1016/S0022-0981(02)00466-5
Hopkins T. L. (1987). Midwater food web in McMurdo Sound, Ross Sea, Antarctica. Mar. Biol. 96, 93–106. Available at: https://link.springer.com/content/pdf/10.1007/BF00394842.pdf.
Innamorati M., Giovanardi F. (1992). Interrelationships between phytoplankton biomass and nutrients in the eutrophicated areas of the North-Western Adriatic Sea. Sci. Total Environ. Suppl. 1992), 235–250. doi: 10.1016/B978-0-444-89990-3.50024-9
Innamorati M., Lazzara L., Massi L., Mori G., Nuccio C., Saggiomo V., et al. (1994). Phytoplankton ecology: particles, fluorescence spectra, irradiance and phytoplankton species density in the Ross Sea. Eds. Faranda F., Guglielmo L. (Genova: National Scientific Commission for Antarctica, Oceanographic Campaign 1989-90), 101–178. Data Report Part III.
Innamorati M., Lazzara L., Mori G., Nuccio C., Saggiomo V. (1991). Phytoplankton ecology. Ed. Guglielmo L. (Genova: National Scientific Commission for Antartica, Oceanographic Campaign 1989-90), 141–252. Data Report Part I.
Innamorati M., Mori G., Massi L., Lazzara L., Nuccio C. (2000). “Phytoplankton biomass related to environmental factors in the Ross Sea,” in Ross Sea Ecology. Eds. Faranda F. M., Guglielmo L., Ianora A. (Springer, Berlin), 217–230. doi: 10.1007/978-3-642-59607-0_18
Lazzara L., Bianchi F., Massi L., Ribera d’Alcalà M. (2010). “Pigmenti clorofilliani per la stima della biomassa fototrofa,” in Metodologie di studio del plancton marino, Eds. Socal G., Buttino I., Cabrini M., Mangoni O., Penna A., Totti C., 365–377. Manuali e Linee Guida 56/2010 ISPRA SIBM (Roma).
Lazzara L., Massi L., Nuccio C., Biondi N., Innamorati M. (1997). Phytoplankton ecology: irradiance, particles, gilvin, pigments, absorption, fluorescence, production and species density in Terra Nova Bay, Ross Sea. Eds. Faranda F. M., Guglielmo L., Povero P. (Genova: National Programme Antarctic Research, ROSSMIZE 1993-1995). Data Report, 229-279.
Lazzara L., Nardello I., Ermanni C., Mangoni O., Saggiomo V. (2007). Light environment and seasonal dynamics of microalgae in the annual sea ice at Terra Nova Bay, Ross Sea, Antarctica. Antarc. Sci. 19, 83–92. doi: 10.1017/S0954102007000119
Lazzara L., Saggiomo V., Innamorati M., Mangoni O., Massi L., Mori G., et al. (2000). “Photosynthetic Parameters, Irradiance, Bio-optical Properties and Production Estimate in the Western Ross Sea,” in Ross Sea Ecology. Eds. Faranda F. M., Guglielmo L., Ianora A. (Springer, Berlin), 217–230. doi: 10.1007/978-3-642-59607-0_21
Lee Y., Park J., Jung J., Kim T. W. (2022). Unprecedented differences in phytoplankton community structures in the Amundsen Sea Polynyas, West Antarctica. Environ. Res. Lett. 17, 114022. doi: 10.1088/1748-9326/ac9a5f
Leventer A., Dunbar R. B. (1996). Factors influencing the distribution of diatom and other algae in the Ross Sea. J. Geophys. Res. 101, 18489–18500. doi: 10.1029/96JC00204
Liu X., Smith W. O. Jr. (2012). Physiochemical controls on phytoplankton distributions in the Ross Sea, Antarctica. J. Mar. Syst. 94, 135–144. doi: 10.1016/j.jmarsys.2011.11.013
Mangoni O., Modigh M., Conversano F., Carrada G. C., Saggiomo V. (2004). Effects of summer ice coverage on phytoplankton assemblages in the Ross Sea, Antarctica. Deep Sea Res. Part I Oceanogr. Res. Papers 51, 1601–1617. doi: 10.1016/j.dsr.2004.07.006
Mangoni O., Saggiomo M., Bolinesi F., Castellano M., Povero P., Saggiomo V., et al. (2019). Phaeocystis antarctica unusual summer bloom in stratified antarctic coastal waters (Terra Nova Bay, Ross Sea). Mar. Environ. Res. 151, 104733. doi: 10.1016/j.marenvres.2019.05.012
Mangoni O., Saggiomo V., Bolinesi F., Margiotta F., Budillon G., Cotroneo Y., et al. (2017). Phytoplankton blooms during austral summer in the Ross Sea, Antarctica: Driving factors and trophic implications. PloS One 12, 1–23. doi: 10.1371/journal.pone.0176033
Martin J. H., Fitzwater S. E., Gordon R. M. (1990). Iron deficiency limits phytoplankton growth in Antarctic waters. Global Biogeochem. Cycles 4, 5–12. doi: 10.1029/GB004i001p00005
Meyer M. A., El-Sayed S. Z. (1987). Grazing of Euphausia superba Dana on natural phytoplankton populations. Polar Biol. 1, 193–197. doi: 10.1007/BF00443187
Montura R. F. C., Repeta D. J. (1997). “Calibration methods for HPLC,” in Phytoplankton pigments in Oceanography. Monographs on oceanographic methodology, vol. 16 . Eds. Jeffrey S. W., Montura R. F. C., Wright S. W. (SCOR UNESCO, Paris), 407–428.
Nejstgaard J. C., Tang K. W., Steinke M., Dutz J., Koski M., Antajan E., et al. (2007). Zooplankton grazing on Phaeocystis: a quantitative review and future challenges. Biogeochemistry 83, 147–172. doi: 10.1007/s10533-007-9098-y
Nelson D. M., DeMaster D. J., Dunbar R. B., Smith W. O. Jr. (1996). Cycling of organic carbon and biogenic silica in the Southern Ocean: estimates of water-column and sedimentary fluxes on the Ross Sea continental shelf. J. Geophys. Res. 101, 519–532. doi: 10.1029/96JC01573
Nelson D. M., Smith W. O. Jr. (1986). Phytoplankton bloom dynamics of the western Ross Sea ice edge-II. Mesoscale cycling of nitrogen and silicon. Deep Sea Research Part A. Oceanogr. Res. Papers 33, 1389–1412. doi: 10.1016/0198-0149(86)90042-7
Nuccio C., Innamorati M., Lazzara L., Mori G., Massi L. (2000). “Spatial and temporal distribution of phytoplankton assemblages in the Ross Sea,” in Ross Sea Ecology. Eds. Faranda F. M., Guglielmo L., Ianora A. (Springer, Berlin), 231–245. doi: 10.1007/978-3-642-59607-0_19
Petrou K., Baker K. G., Nielsen D. A., Hancock A. M., Schulz K. G., Davidson A. T. (2019). Acidification diminishes diatom silica production in the Southern Ocean. Nat. Climate Change 9, 781–786. doi: 10.1038/s41558-019-0557-y
Rahmstorf S. (2006). “Thermohaline Ocean Circulation,” in Encyclopedia of Quaternary Sciences. Ed. Elias S. A. (Elsevier, Amsterdam), 1–10.
Redfield A. C., Ketchum B. H., Richards F. A. (1963). “The Influence of Organisms on the Composition of the Sea Water,” in The Sea, vol. 2 . Ed. Hill M. N. (Interscience Publishers, New York), 26–77.
Saggiomo V., Catalano G., Corato F., Ribera d’Alcalà M. (2010). “Metodi automatici di analisi dei nutrienti,” in Metodologie di studio del plancton marino. Eds. Socal G., Buttino I., Cabrini M., Mangoni O., Penna A., Totti C., 55–79. Manuali e Linee Guida 56/2010 ISPRA SIBM (Roma).
Saggiomo V., Catalano G., Mangoni O., Budillon G., Carrada G. C. (2002). Primary production processes in ice-free waters of the Ross Sea (Antarctica) during the austral summer 1996. Deep Sea Res. Part II: Topical Stud. Oceanogr. 49, 1787–1801. doi: 10.1016/S0967-0645(02)00012-7
Saggiomo M., Escalera L., Bolinesi F., Rivaro P., Saggiomo V., Mangoni O. (2021). Diatom diversity during two austral summers in the Ross Sea (Antarctica). Mar. Micropaleontol. 165, 101993. doi: 10.1016/j.marmicro.2021.101993
Saggiomo M., Poulin M., Mangoni O., Lazzara L., De Stefano M., Sarno D., et al. (2017). Spring-time dynamics of diatom communities in landfast and underlying platelet ice in Terra Nova Bay, Ross Sea, Antarctica. J. Mar. Syst. 166, 26–36. doi: 10.1016/j.jmarsys.2016.06.007
Sedwick P. N., DiTullio G. R. (1997). Regulation of algal blooms in Antarctic shelf waters by the release of iron from melting sea ice. Geophys. Res. Lett. 24, 2515–2518. doi: 10.1029/97GL02596
Sedwick P. N., DiTullio G. R., Mackey D. J. (2000). Iron and Manganese in the Ross Sea, Antarctica: Seasonal iron limitation in Antactic shelf waters. J. Geophys. Res. 105, 11321–11336. doi: 10.1029/2000JC000256
Smith W. O. Jr. (2022). Primary productivity measurements in the Ross Sea, Antarctica: a regional synthesis. Earth Syst. Sci. Data 14, 2737–2747. doi: 10.5194/essd-14-2737-2022
Smith W. O. Jr., Ainley D. G., Arrigo K. R., Dinniman M. S. (2014). The oceanography and ecology of the Ross Sea. Annu. Rev. Mar. Sci. 6, 469–487. doi: 10.1146/annurev-marine-010213-135114
Smith W. O. Jr., Asper V. L. (2001). The influence of phytoplankton assemblage composition on biogeochemical characteristics and cycles in the southern Ross Sea, Antarctica. Deep Sea Res. Part I 48, 137–161. doi: 10.1016/S0967-0637(00)00045-5
Smith W. O. Jr., Delizo L. M., Herbolsheimer C., Spencer E. (2017). Distribution and abundance of mesozooplankton in the Ross Sea, Antarctica. Polar Biol. 40, 2351–2361. doi: 10.1007/s00300-017-2149-5
Smith W. O. Jr., Dinniman M. S., Tozzi S., DiTullio G. R., Mangoni O., Modigh M., et al. (2010). Phytoplankton photosynthetic pigments in the Ross Sea: patterns and relationships among functional groups. J. Mar. Syst. 82, 177–185. doi: 10.1016/j.jmarsys.2010.04.014
Smith W. O. Jr., Gordon L. I. (1997). Hyperproductivity of the Ross Sea (Antarctica) polynya during austral spring. Geophys. Res. Lett. 24, 233–236. doi: 10.1029/96GL03926
Smith W. O. Jr., Kaufman D. E. (2018). Climatological temporal and spatial distributions of nutrients and particulate matter in the Ross Sea. Prog. Oceanogr. 168, 182–195. doi: 10.1016/j.pocean.2018.10.003
Smith W. O. Jr., Sedwick P. N., Arrigo K. R., Ainley D. G., Orsi A. H. (2012). The Ross Sea in a sea of change. Oceanography 25, 90–103. doi: 10.5670/oceanog.2012.80
Sokal R. R., Rohlf F. J. (1995). Biometry: the principles and practice of statistics in biological research. 3d ed (New York: W. H. Freeman and company), 887.
Sweeney C., Smith W. O. Jr., Hales B., Bidigare R. R., Carlson C. A., Codispoti L. A., et al. (2000). Nutrient and carbon removal ratios and fluxes in the Ross Sea, Antarctica. Deep Sea Res. Part II: Topical Stud. Oceanogr. 47, 3395–3421. doi: 10.1016/S0967-0645(00)00073-4
Vaillancourt R. D., Marra J., Barber R. T., Smith W. O. Jr. (2003). Primary productivity and in situ quantum yields in the Ross Sea and Pacific Sector of the Antarctic Circumpolar Current. Deep Sea Res. Part II 50, 559–578. doi: 10.1016/S0967-0645(02)00584-2
Vidussi F., Claustre H., Bustillos-Guzmàn J., Cailliau C., Marty J. C. (1996). Determination of chlorophylls and carotenoids of marine phytoplankton: separation of chlorophyll a from divinyl-chlorophyll a and zeaxanthin from lutein. J. Plankton Res. 18, 2377–2382. doi: 10.1093/plankt/18.12.2377
Zingone A., Totti C., Sarno D., Cabrini M., Caroppo C., Giacobbe M. G., et al. (2010). “Fitoplancton: metodiche di analisi quali-quantitativa,” in Metodologie di studio del plancton marino. Eds. Socal G., Buttino I., Cabrini M., Mangoni O., Penna A., Totti C., 213–237. Manuali e Linee Guida 56/2010 ISPRA SIBM (Roma).
Keywords: Terra Nova Bay, Ross Sea Antarctica, Dactyliosolen tenuijunctus, Fragilariopsis spp., nutrient utilization strategies, biogeochemistry
Citation: Massi L, Nuccio C, Melillo C, Becagli S, Mori G, Verdiani L, Bonamano S, Madonia A, Piermattei V, Marcelli M and Lazzara L (2025) Phytoplankton taxonomic composition, nutrients utilization and biogeochemistry in the upper mixed layer in the coastal area of the Terra Nova Bay, Ross Sea, Antarctica. Front. Mar. Sci. 12:1463734. doi: 10.3389/fmars.2025.1463734
Received: 12 July 2024; Accepted: 30 January 2025;
Published: 04 March 2025.
Edited by:
Manfredi Manizza, University of California, San Diego, United StatesReviewed by:
Andrés S. Rigual Hernández, University of Salamanca, SpainCopyright © 2025 Massi, Nuccio, Melillo, Becagli, Mori, Verdiani, Bonamano, Madonia, Piermattei, Marcelli and Lazzara. This is an open-access article distributed under the terms of the Creative Commons Attribution License (CC BY). The use, distribution or reproduction in other forums is permitted, provided the original author(s) and the copyright owner(s) are credited and that the original publication in this journal is cited, in accordance with accepted academic practice. No use, distribution or reproduction is permitted which does not comply with these terms.
*Correspondence: Luca Massi, bHVjYS5tYXNzaUB1bmlmaS5pdA==
Disclaimer: All claims expressed in this article are solely those of the authors and do not necessarily represent those of their affiliated organizations, or those of the publisher, the editors and the reviewers. Any product that may be evaluated in this article or claim that may be made by its manufacturer is not guaranteed or endorsed by the publisher.
Research integrity at Frontiers
Learn more about the work of our research integrity team to safeguard the quality of each article we publish.