
95% of researchers rate our articles as excellent or good
Learn more about the work of our research integrity team to safeguard the quality of each article we publish.
Find out more
BRIEF RESEARCH REPORT article
Front. Mar. Sci. , 03 February 2025
Sec. Marine Biogeochemistry
Volume 12 - 2025 | https://doi.org/10.3389/fmars.2025.1455803
 Pratha Sivasamy1
 Magdalena Diak1
 Aleksandra Winogradow1
 Hermann W. Bange2Marta Borecka1
 Przemysław Makuch1
 Katarzyna Koziorowska-Makuch1
 Karol Kuliński1Anna Mackiewicz1
 Beata Szymczycha1*
To determine the excess of dissolved dinitrogen gas (ΔN2 > 0 indicates the loss of bioavailable dissolved nitrogen) in the water column of the Baltic Proper, we measured N2/Ar ratios below the halocline at 19 stations during different seasons between 2017 and 2021. ΔN2 concentrations below the halocline ranged from 1.0 to 32.6 µmol L-1 for all seasons and sites. A significant spatial difference in ΔN2 (p = 0.0001) was observed, with the highest values found in the Gotland Deep. The seasonal changes in ΔN2 were statistically significant (p = 0.005) with the highest concentrations observed in winter. To our knowledge, this is the first study showing the variability of ΔN2 on a large scale in the Baltic Proper. Our findings suggest that the cumulative loss of bioavailable nitrogen via denitrification and anammox is an important mechanism in the Baltic Sea nitrogen cycle. The accumulated signal of N2 production is, however, not uniform across the Baltic Proper, exhibiting significant seasonal and spatial variabilities. This calls for future, investigations on a broad spatial scale and a seasonal resolution which focus on denitrification and anammox rates in the water column, by utilizing a consistent methodological approach. It is essential to ensure an accurate representation of the nitrogen loss, which in turn is important for managing eutrophication and maintaining a good environmental status in the Baltic Sea.
Denitrification and anammox (anaerobic ammonium oxidation) are the primary pathways responsible for the removal of bioavailable nitrogen (N) compounds, such as nitrate (NO3-), nitrite (NO2-), and ammonium (NH4+) from the marine environment. Denitrification is a microbial process that occurs under hypoxic/anoxic conditions, in which NO3- is sequentially reduced to dinitrogen gas (N2). Anammox is the anaerobic microbiological process in which NO2- and NH4+ are converted to N2 under anoxic conditions. Both processes result in a loss of bioavailable nitrogen and play a critical role in regulating nitrogen levels in marine ecosystems, particularly under stratified and oxygen-depleted conditions (Codispoti et al., 2001; Capone et al., 2008; Lam and Kuypers, 2011; Pajares and Ramos, 2019). Denitrification provides a critical ecosystem function in the Baltic Sea by removing bioavailable nitrogen thus mitigating eutrophication and maintaining ecosystem balance (Deutsch et al., 2010; Allin et al., 2017). A clear seasonal dependency on near-bottom water oxygen (O2) concentrations and increasing temperature, was identified to be the main factor controlling the overall recent increase in denitrification rates in Baltic Sea sediments (Aigars et al., 2015; Hellemann et al., 2020). The spatial distribution of sediment denitrification was correlated with the organic carbon content and the concentration of NO3- in the overlying bottom water (Asmala et al., 2017). Interestingly, it was also found that denitrification rates in the water column can exceed sedimentary denitrification rates, particularly in the hypoxic/anoxic deep layers of the Baltic Proper (Dalsgaard et al., 2013; Carstensen et al., 2014; Hellemann et al., 2020). In terms of nitrogen removal pathways in the Baltic Sea water column, denitrification plays a dominant role whereas the contribution from anammox is minimal (Hannig et al., 2007; Löffler et al., 2011; Dalsgaard et al., 2013; Bonaglia et al., 2016). For instance, Dalsgaard et al. (2013) showed that denitrification in the water column ranged from 132 to 547 kt N yr−1 for the entire Baltic Proper while in sediments equaled only 191 kt N yr−1. However, the spatial and seasonal variability of denitrification and anammox in the Baltic Sea water column remains understudied.
Various methods have been applied to measure bioavailable N loss through denitrification and anammox in marine environments. Common techniques include the acetylene inhibition method (Knowles, 1990; She et al., 2019), the 15N isotope pairing method (Nielsen, 1992; Risgaard-Petersen et al., 2005; Robertson et al., 2019), and high-resolution isotopomer analysis (Farías et al., 2009). The 15N isotope pairing method, widely used for quantifying dinitrogen gas production was introduced by Nielsen (1992). To address challenges in its application such as distinguishing between the coupling of nitrification with denitrification, direct denitrification pathways, and the coexistence of denitrification and anammox this method has been further refined and developed by Risgaard-Petersen et al. (2005) and Robertson et al. (2019). Microsensor measurements also offer a continuous, non-invasive approach to monitor nitrogen cycling in sediments. These sensors can detect nitrous oxide (N2O) accumulation, providing real-time estimates of sedimentary denitrification rates (Risgaard-Petersen et al., 2005; Palacin-Lizarbe et al., 2018). While metabolic inhibitors such as acetylene or methanol are often used to selectively suppress microbial processes like denitrification and anammox, their application may inadvertently affect microbial activity (Jensen et al., 2007; She et al., 2019). Overall all these methods require analytical tools for measuring the produced N2 such as isotope ratio mass spectrometers (IRMS), gas chromatograph-mass spectrometers (GC-MS), or membrane inlet mass spectrometers (MIMS). However, IRMS and GC-MS often involve sample manipulation, such as adding labeled standards or creating a headspace in vials, to measure gaseous nitrogen isotopes. In contrast, the N2/Ar ratio method (Kana et al., 1994; Inglett et al., 2013) offers a simpler, time-efficient alternative to measure dinitrogen gas (N2) distribution. It eliminates the need for pre-analysis sample preparation and directly determines oceanic N2 concentrations, which is the end product of both denitrification and anammox. However, this method requires careful consideration of all processes influencing N2 distribution in the water column.
In short, the distribution of N2 in the ocean is controlled by (i) a complex interplay of physical factors such as wind, temperature, and salinity that affect its gas exchange with the atmosphere, and (ii) microbiological processes, such as N2 fixation, denitrification and anammox, which are influenced by the availability of organic matter, nitrogenous nutrients (NO3-, NO2-, and NH4+), and O2. To distinguish between physical and microbial processes (such as denitrification and anammox), the distribution of N2 concentrations can be compared with the distribution of an inert gas, such as Ar, that is only affected by physical processes (Kana et al., 1994; Schmale et al., 2019). The applicability of the N2/Ar ratios to estimate bioavailable nitrogen loss via denitrification and anammox is particularly promising for stratified water bodies such as the Baltic Sea, where hypoxic and anoxic deep waters are separated from the surface water layer with permanent halocline, which is influenced by gas exchange with the atmosphere (Devol et al., 2006; Chang et al., 2010, 2012; Löffler et al., 2011; Hamme and Emerson, 2013; Shigemitsu et al., 2016; Seltzer et al., 2023). Therefore, usage of the N2/Ar method below halocline enables the investigation of spatial and seasonal excess N2 (cumulative effect) rather than the direct calculation of rates of specific microbial processes. Despite this limitation of not providing direct process rates, the N2/Ar method remains a valuable tool for assessing the marine inorganic nitrogen loss in stratified water bodies. In this study, we focus on the net accumulation of N2 in the layers below the halocline and bottom waters. This approach is appropriate, as these layers provide the environmental conditions and substrate availability necessary for nitrogen loss processes to occur. To this end, this study aimed (i) to quantify the cumulative effect of bioavailable N loss via denitrification and anammox expressed as excess dinitrogen gas (N2) in the Baltic Proper and (ii) to decipher the seasonal and spatial variability of excess N2.
The Baltic Sea with an area of 415,000 km2 (including the Kattegat) is the second-largest brackish water body in the world (Szymczycha et al., 2019). The Baltic Sea catchment area is four times greater than the sea itself. The shallow and narrow connection with the North Sea through the Danish Straits results in only sporadic inflows of saline and oxygen-rich water, which, in combination with the pronounced riverine discharge, causes strong vertical salinity gradients and density stratification (HELCOM, 2018a). The salinity-induced stratification in the water column is commonly described as a three-layer structure that consists of an upper layer (brackish, well-mixed, and oxygenated), a transitional middle layer (halocline, strong salinity gradient), and a deep layer (higher salinity and often occurring O2 deficits). The depth of the halocline is controlled by wind-induced mixing, advection, and volume of saline waters, which appear to change little over time (Dargahi et al., 2017; Liblik and Lips, 2019). The presence of a permanent halocline hampers vertical mixing in the water column, and thus also ventilation of the deep water layers. Inflows from the North Sea, the so-called Major Baltic Inflows (MBI), are the main source of O2 to the bottom layers and simultaneously the main cause of anoxic/hypoxic conditions in the stratified Baltic Sea. However, O2 supplied with MBIs is quickly consumed in the course of respiration and ultimately MBIs are responsible for enhancing stratification and limiting ventilation (Rak et al., 2020; Kuliński et al., 2022). Rak et al. (2020) estimated that 9 months after the MBI in 2014, anaerobic conditions reoccurred in the deep layer of the Bornholm Basin, and the amount of O2 pushed into the deep Gulf of Gdańsk layer was not sufficient to eliminate anoxia in the near-bottom layer. The results of numerous studies published so far indicate that the extent of hypoxic and anoxic areas has increased significantly in the central part of the Baltic Sea during the recent decades (Kuliński et al., 2022; Meier et al., 2022). This is directly related to high nutrient loads, primarily nitrogen and phosphorus-containing compounds, originating from agricultural runoff, wastewater discharge, and atmospheric deposition and resulting in eutrophication of the ecosystem (Gustafsson et al., 2012; Andersen et al., 2017). This, along with enhanced remobilizing phosphorus from anoxic sediments, in turn, fuels the growth of phytoplankton. Subsequent remineralization of sedimentary organic matter causes O2 depletion which can lead to the increase of hypoxic or anoxic zones, particularly in the deeper basins of the Baltic Proper with their limited water exchange (Kuliński et al., 2022). Recent assessments, such as those using the HELCOM Eutrophication Assessment Tool (HEAT 3.0), indicate ongoing eutrophication despite some improvements (HELCOM, 2018b; Murray et al., 2019).
Seawater samples were collected from 19 stations in the Baltic Proper (Figure 1) during multiple cruises aboard R/V Oceania in May 2017, March 2018, May 2019, September 2020, and January, April, and September/October 2021. Sampling sites were selected to cover diverse locations such as Gotland Deep (~249 m; characterized by strong stratification and anoxia), Gdańsk Deep (~118 m; influenced by coastal processes and variable oxygenation), and Bornholm Deep (~95 m; with better oxygenation due to North Sea inflows) (Szymczycha et al., 2019). In addition, samples were collected in different periods capturing seasonal shifts in substrates of denitrification and annamox substrate as well as oxygen availability.
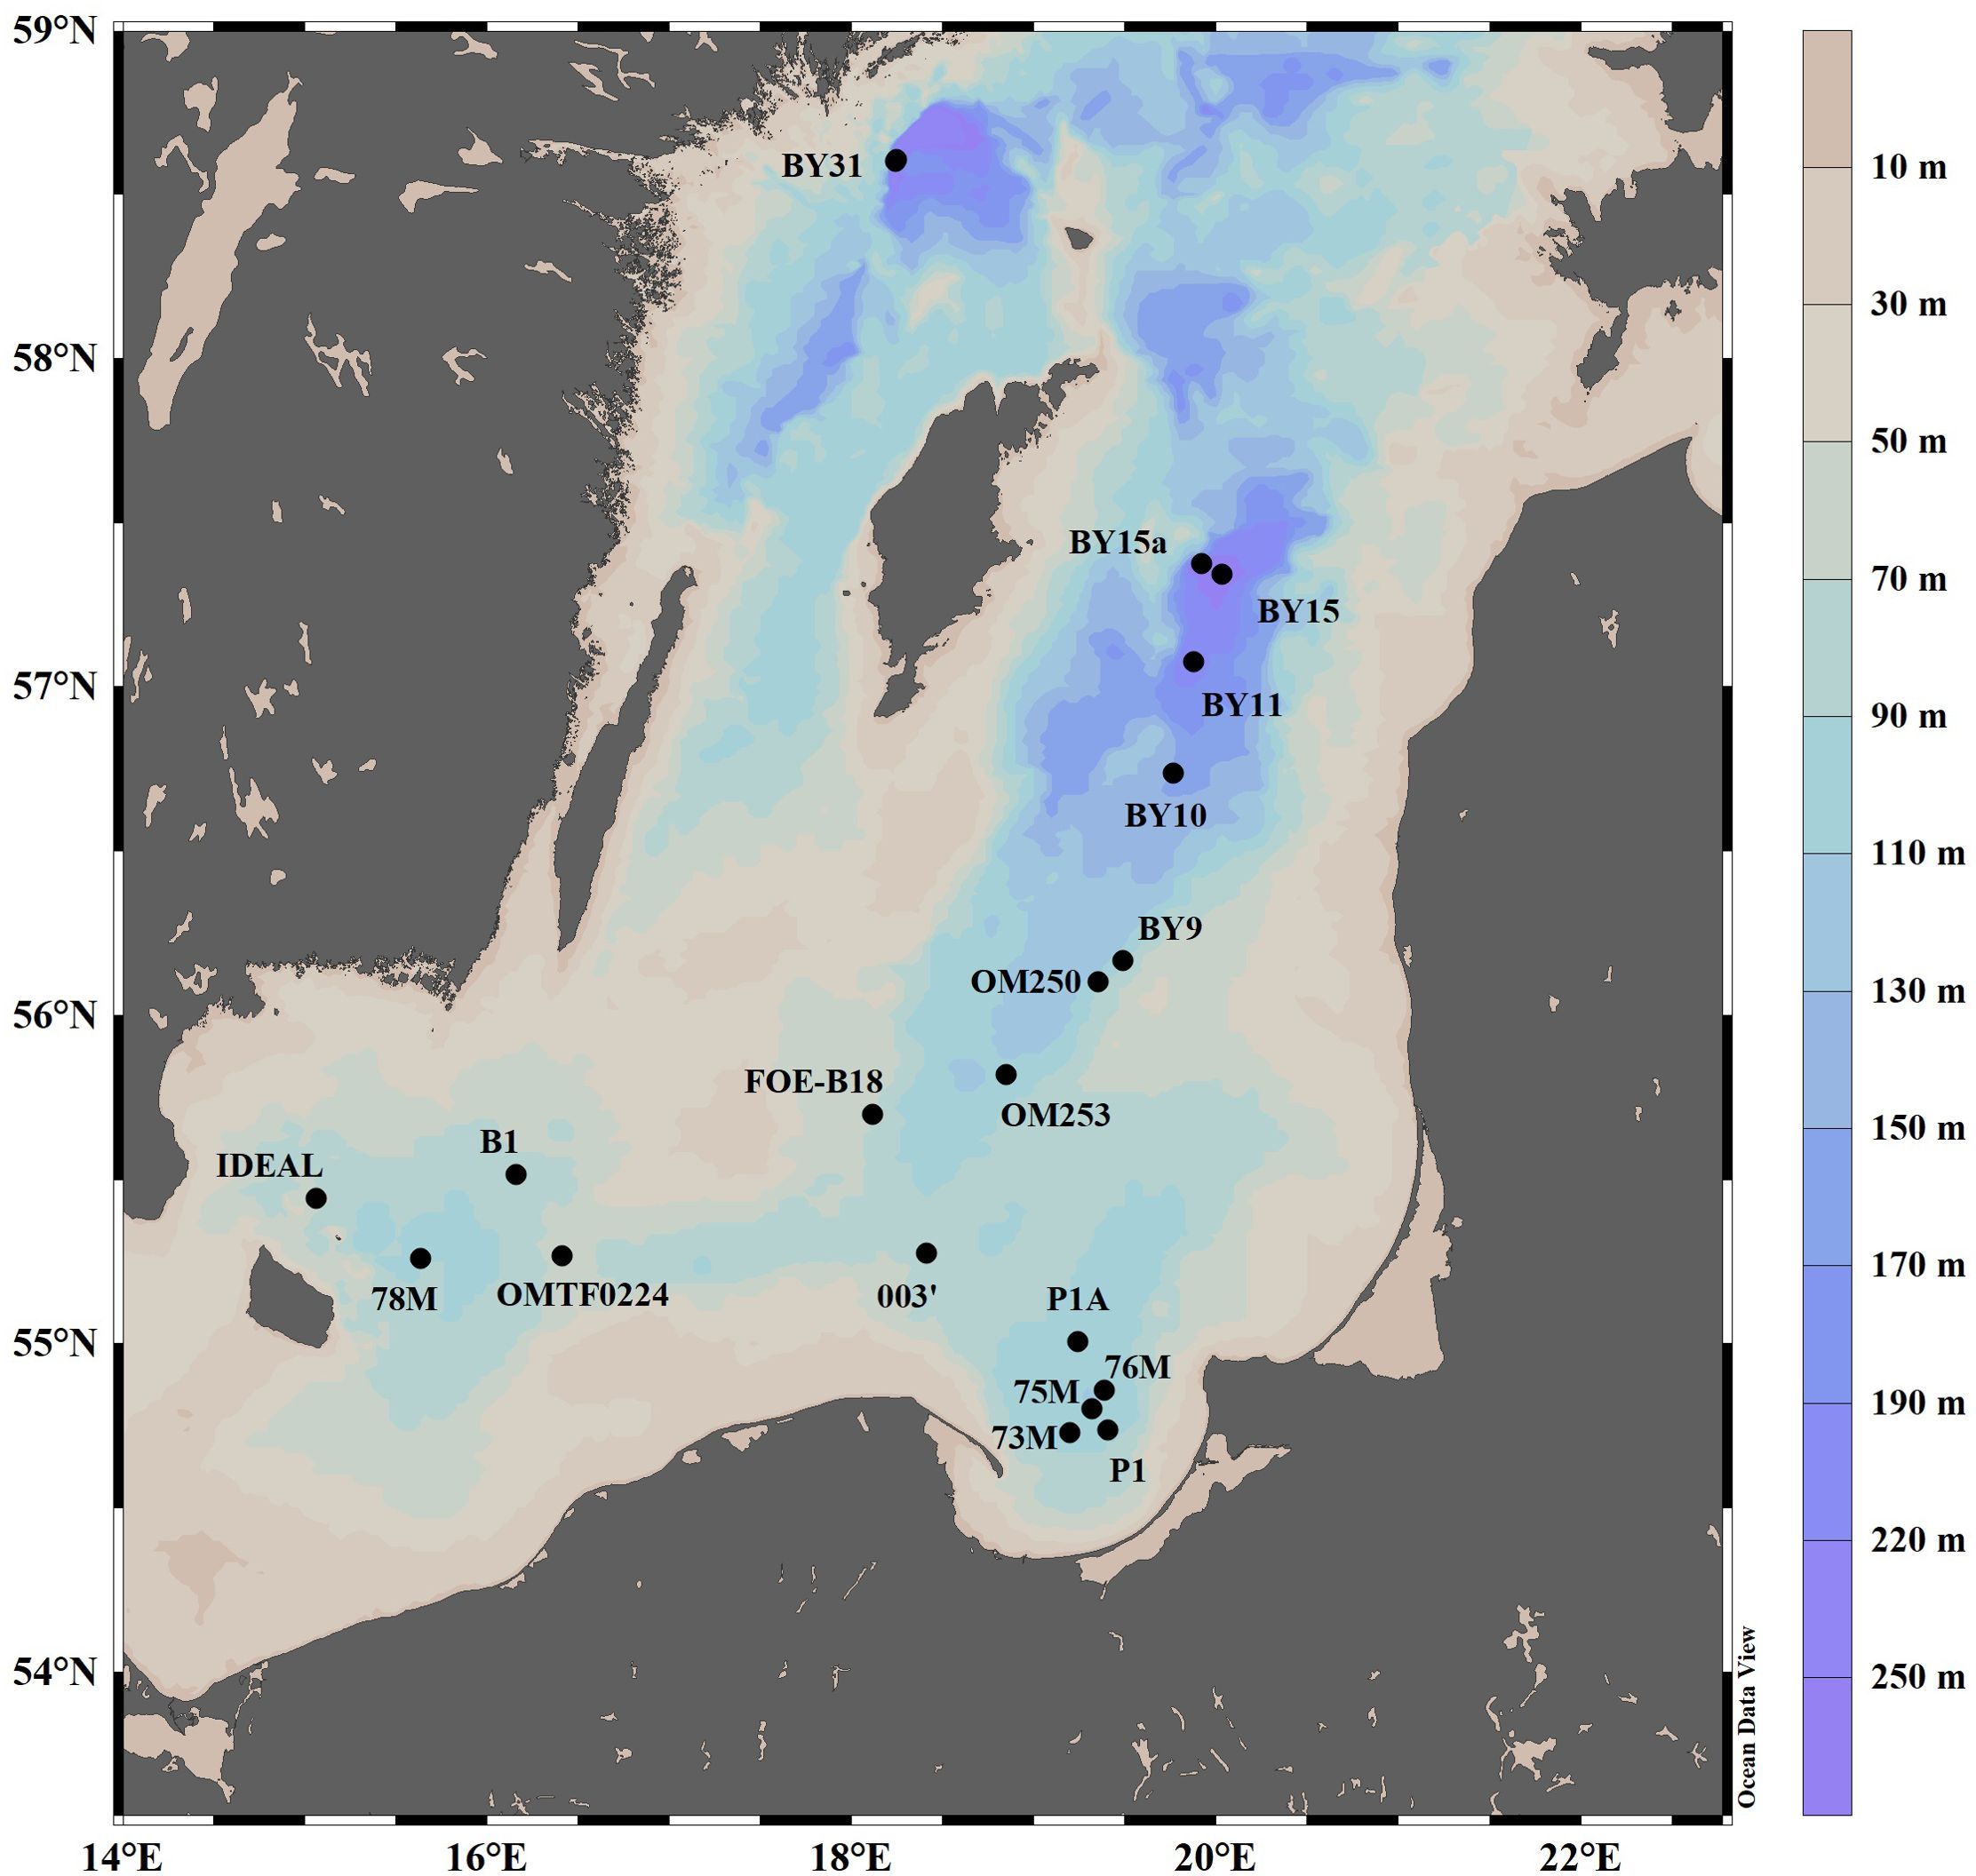
Figure 1. Location of the study sites in the Baltic Sea.
At each station, the water column was divided into four distinct layers based on salinity (S) and temperature (T) profiles: A – surface water; B – halocline; C – below halocline; and D – bottom water (up to 5 m above the seafloor/overlying bottom water) (Figure 2). Sampling primarily targeted layers C and D, which are isolated from atmospheric influence, to assess excess N2. This design enabled detailed insights into spatial and seasonal variability of processes in stratified zones.
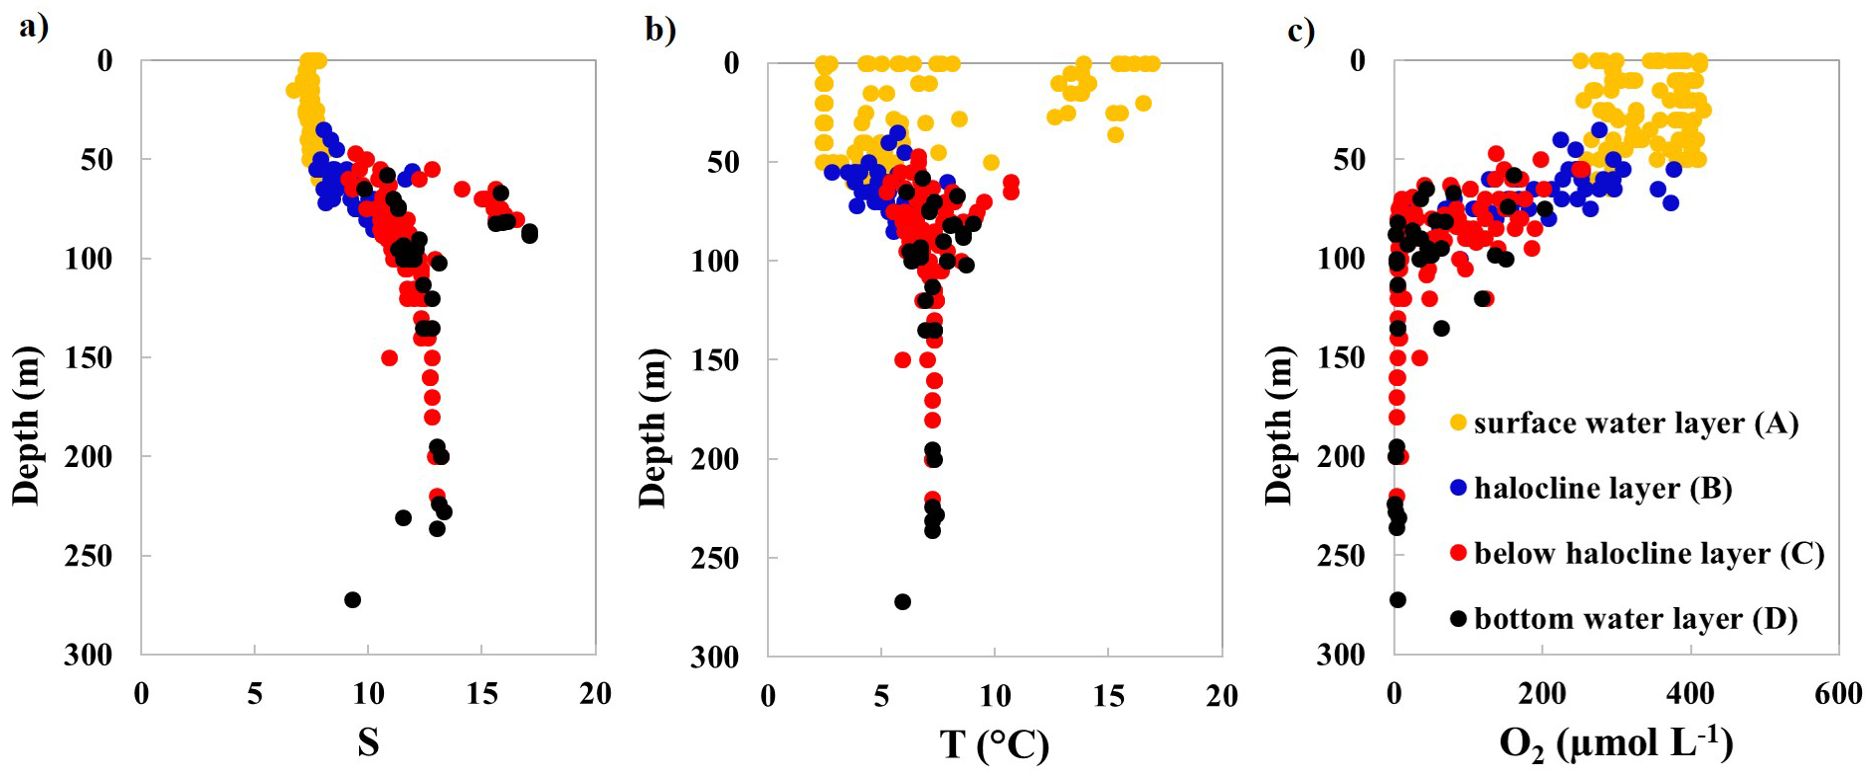
Figure 2. Vertical distribution of measured parameters: (A) salinity (S), (B) temperature (T), and (C) dissolved oxygen (O2) concentrations in the water column of the study area. Yellow dots represent the surface water layer (A); blue dots indicate the halocline layer (B); red dots signify below halocline layer (C); black dots designate bottom water layer (up to 5 m above the seafloor) (D).
Temperature (T), salinity (S), and dissolved oxygen (O2) concentration were measured in situ using a Sea-Bird Scientific SBE 911 Plus profiler. Water samples to determine the N2/Ar ratio were collected from Niskin bottles immediately after retrieving the CTD/Rosette sampler on the deck. They were carefully sampled via Viton™ tubing in Exetainers® vials (12 mL gastight borosilicate glass vials; Labco, UK) which were left to overflow with at least three times their volume. Then, they were immediately capped avoiding bubbles or any headspace. For each depth, samples were collected in triplicates. Subsequently, biological activity was stopped by injecting 0.1 mL of a saturated aqueous HgCl2 solution with a precise syringe and a needle through the chlorobutyl septum and having another needle to balance the excess volume. The samples were stored upside down in the refrigerator at 4 °C until later analyses that were performed within 3 months after sampling.
The concentrations of N2 and Ar were measured using the membrane inlet mass spectrometry technique (MIMS). The MIMS instrument consists of a Pfeiffer Vacuum model 422 quadrupole mass spectrometer (QMA 400 analyzer with cross-beam ion source) with a flow-through silicone capillary membrane inlet (Bay Instruments, Easton, Maryland). The precision was determined as ± 0.5 % for N2 and Ar and ± 0.05 % for N2/Ar. The detection limits for N2 and Ar were calculated as 3 multiplied by the standard deviation of 5 replicate measurements and equaled 6.5 µmol L-1 and 0.015 µmol L-1, respectively.
Anomalies in N2 concentrations, expressed as ΔN2, were calculated as the difference between the measured N2/Ar ratio and the N2/Ar ratio in seawater that would be in equilibrium with the atmosphere, as shown in Equation 1:
where (N2/Ar)mes and (N2/Ar)sat are the measured ratios and the equilibrium ratios, respectively. The latter corresponds to the equilibrium state between the seawater at a given temperature and salinity and the atmosphere (Schmale et al., 2019). The equation used for the estimation of equilibrium concentrations of N2 and Ar was presented by Hamme and Emerson (2004).
The N2/Ar background ratio (denoted as (N2/Ar)sat) was assumed to be identical to N2/Ar saturation at the in situ temperature and salinity. The fundamentals of this approach are outlined in Schmidt et al. (2008) and also applied by Löffler et al. (2011). According to Schmidt et al. (2008), deep-water concentrations of N2 may, under the influence of physical factors, deviate from the saturation state at the time of their last contact with the atmosphere by ± 3.8 μmol L−1, which corresponds to ± 0.6 %.
We assumed that excessive N2 is either produced in situ in the water column or can result from diffusion from sediments, in the latter case affecting mostly N2 concentrations in the overlying bottom water – layer D. Another factor that impacts N2 is the mixing of water masses. Different water masses having different N2/Ar ratios depending on the prevailing in situ denitrification and anammox rates.
Samples collected across all seasons (Figure 1) were utilized to examine the overall spatial variability of ΔN2. Additionally, we conducted statistical analysis, especially for the samples collected in September/October 2021 to exclude the impact of seasonality. Furthermore, the seasonal variability of ΔN2 was investigated for all sites collectively and separately for the Gulf of Gdańsk, to exclude the impact of spatial variability.
Seawater samples for nutrients were filtered (cellulose acetate filters with a pore size of 0.45 μm), collected into polyethylene bottles, and stored at -20 °C for further analysis. Nutrient concentrations were determined using a SEAL AA500 AutoAnalyzer (Seal Analytical) applying standard photometric methods (Grasshoff et al., 1983). Quality control consisted of repeated measurements of two different CRMs (QC3179, Sigma Aldrich, and HAMIL-20.2, Environment Canada). The recovery of NO2- + NO3−, NH4+, and PO43− measurements was 98.8 %, 98.8 %, and 99.0 %, respectively, while the precision (relative standard deviations/coefficient of variation) was ± 0.7 %, ± 0.6 % and ± 0.5 %, respectively. Method detection limits (LOD) were determined as 0.33 µmol L-1 for NO2- + NO3−, 0.27 µmol L-1 for NH4+, and 0.1 µmol L-1 for PO43-. To facilitate statistical analysis and to prevent artificial censure, values below the limit of detection (LOD) were substituted for half of the LOD. Half the LOD for PO43-, NH4+, NO2- + NO3+, was 0.05, 0.14 and 0.17 µmol L-1, respectively. The dependency of possible factors that influence the change in ΔN2 concentrations in layers C and D were examined and the results below the detection limit were not included (Supplementary Figure S1).
Statistical analyses were performed using STATISTICA software. To test for seasonal and spatial differences in ΔN2 Kruskal-Wallis test was used. For data visualization, MATLAB was used. All data presented in this article are available online at the IOPAN GEONETWORK database: https://doi.org/10.48457/iopan-2024-253 (Szymczycha et al., 2024).
The measured values of salinity, temperature, and dissolved oxygen were consistent with the previously published studies in the Baltic Proper (Figure 2; Lehmann et al., 2022). In layers C and D, salinity ranged from 9.1 to 17.1 while temperature was in the range from 5.2 to 9.1 °C. The vertical profiles of O2 confirmed that oxygen depletion (hypoxic conditions) prevails and is even close to zero below the water depth of 100 – 120 m in layers C and D, depending on the year and season of sampling.
NO2- + NO3−, NH4+ and PO43- concentrations from the cruises in 2020 and 2021 are presented in Figures 3A–C. Overall, NO2- + NO3− concentrations ranged from 0.17 to 11.84 µmol L-1 and exhibited varied patterns with the increasing water depth. PO43- ranged from 0.05 to 6.27 µmol L-1 while NH4+ ranged from 0. 14 to 40.49 µmol L-1, both parameters increased with water depth. NO2- + NO3− concentrations in layers C and D ranged from 0.17 to 11.84 µmol L-1 with the highest concentrations observed in the Bornholm Deep during autumn. NH4+ concentrations in layers C and D ranged from 0.14 to 38.86 µmol L-1 with the highest concentrations measured in autumn in the Gotland Deep. PO43- -similarly to NH4+ showed the highest concentrations in layers C and D ranging from 0.05 to 6.27 µmol L-1.

Figure 3. The vertical distribution of (A) nitrite + nitrate (NO2- + NO3-) concentrations, (B) ammonium (NH4+) concentrations, (C) phosphate (PO43-) concentrations, (D) calculated ΔN2 concentrations, (E) measured N2/Ar ratios and saturated N2/Ar ratios. Yellow dots represent the surface water layer (A); blue dots indicate the halocline layer (B); red dots signify below halocline layer (C); black dots designate bottom water layer (up to 5 m above the seafloor) (D). The grey-shaded area represents N2/Ar ratios in equilibrium with air.
Results of (N2/Ar)mes and (N2/Ar)sat are presented in Figure 3E. The colored dots represent the measured N2/Ar ratios and the gray shaded area indicates the saturated N2/Ar ratios. (N2/Ar)mes and (N2/Ar)sat in all layers varied from 36.5 to 39.1 µmol L-1 and from 36.9 to 37.8 µmol L-1, respectively (Figure 3E). In layer A, (N2/Ar)mes and (N2/Ar)sat ranged from 36.5 to 37.8 µmol L-1 and from 36.9 to 37.9 µmol L-1, respectively. Starting from layer B, (N2/Ar)mes increased with depths while (N2/Ar)sat was relatively constant. In layers C and D, (N2/Ar)mes ranged from 37.2 to 39.1 µmol L-1 while (N2/Ar)sat varied from 37.1 to 37.4 µmol L-1.
ΔN2 close to zero indicates that the seawater is in equilibrium with the atmosphere, hence this reflects the absence of significant physical or biological processes. This was observed in layers A and B (surface and halocline layers) in ~ 21 % of the samples in the Baltic Proper (Figure 3D). Undersaturation of ΔN2 (i.e. negative ΔN2) indicates N2 depletion related to the occurrence of N2 fixation by cyanobacteria (Schmale et al., 2019) and was observed in layers A and B (in ~20 % of the total number of samples) as this layers are prone to cyanobacterial blooms. Schmale et al. (2019), who used N2/Ar measurements to examine a cyanobacterial bloom in the Baltic Proper in the summer of 2015, reported values similar to ours.
The oversaturation of N2 (i.e. positive ΔN2) can be attributed to two factors: 1) a physical process such as air-sea gas exchange of N2 (Hamme and Emerson, 2013 and Schmale et al., 2019) and 2) biological processes such as denitrification and anammox (Löffler et al., 2011). The first factor can affect ΔN2 distributions in the surface layers (up to the halocline) where wind-induced breaking waves cause the injection of air beneath the water, where high pressure causes its dissolution. In fact, 69 % of the samples collected in layers A and B had positive ΔN2 ranging from 1.5 to 20.0 µmol L-1 (Figure 3D).
The stratification of the Baltic Sea water acts as a barrier that hampers the mixing of water and the ventilation of the deep water layers (Liblik and Lips, 2019). But also, one cannot exclude the fact that the exchange of gases through the halocline is also a possible mechanism that drives the N2 to the surface water from layers C and D (below the halocline) (Figure 3D). However, it is still not well characterized. In layers C and D, due to the absence of direct influence of the air-sea gas exchange, excess N2 can be attributed to biological production. Therefore the calculated excess ΔN2 at different sites from the Baltic Sea water, N2 can be produced in situ due to denitrification and anammox in the water column; can diffuse from sediments (due to benthic denitrification and anammox); and can be affected by lateral transport of below halocline waters. In general, layers C and D were characterized by positive ΔN2 values that exhibited significant variability, ranging from 1.0 to 32.6 µmol L-¹ and 3.0 to 26.6 µmol L-¹, respectively, with average values of approximately 14.0 µmol L-¹. However, both layers showed high standard deviations. At individual stations, trends in ΔN2 within these layers varied. For instance, at the Gdańsk Deep (P1 station) during winter, average ΔN2 in layer C was 15.0 ± 9.0 µmol L-1, and a clear increasing trend with depth was observed. Conditions during winter may favor stagnation in the deeper layers, making differences in ΔN2 with depth more pronounced. Thus, during spring and autumn this trend observed at station P1 was less noticeable. In contrast, during spring at the Gotland Deep (BY15 station), an opposite trend was noted, with ΔN2 decreasing with depth in layer C. At some stations in the Gotland and Bornholm Deeps during autumn, ΔN2 increased within layer C up to a certain depth, then declined in layer D. The lowest variability was observed at BY11 (Gotland Deep) during autumn. Here, six depths were sampled in layer C (88–170 m) and one depth in layer D (195 m). The ΔN2 values averaged 18.95 µmol L-¹ with a remarkably low standard deviation of 0.51 µmol L-¹, suggesting more homogenous conditions. These observations highlight the dynamic and location-specific nature of ΔN2 in deeper layers of the Baltic Sea. The observed differences between stations (e.g., riverine influence at P1 station compared to open-sea stratification at BY15 station) and seasons likely arise from a combination of factors, including oxygen and substrates availability, water stratification, and localized microbial processes.
To identify possible factors influencing ΔN2 we examined the dependence of temperature, salinity, O2, and NO2- + NO3-, NH4+, and PO43- with ΔN2 in layers C and D (Supplementary Figure S1). Temperature influences the decomposition rate of organic matter by affecting microbial activity and regulating substrate availability for nitrogen cycling processes. We did not observe a significant correlation with temperature (p = 0.1185; R2 = 0.0192), most likely because the variability of temperature below the halocline is negligible (Lehmann et al., 2022). The observed correlation may result from coupled interrelated processes that are temperature-dependent, making it challenging to isolate the effect of temperature alone. We also did not observe any significant correlation (p = 0.8107; R2 = 0.0005) with salinity. The results of various reports suggest that salinity has no influence on denitrification rates (Nowicki, 1994; Fear et al., 2005) or may have a negative impact, as high salinity negatively influences microbial diversity and productivity (Seo et al., 2008; Belkin et al., 2015). With decreasing O2 a significant increase of ΔN2 was observed (p = 0.0000; R2 = 0.2840, Supplementary Figure S1). This is caused by the fact that denitrification requires very low O2 concentrations (below 6 µmol L-1) and extends to anoxic conditions. Some of our measurements showed that concentrations of O2 > 6 µmol L-1 were associated with positive ΔN2, suggesting diffusion of N2 from sediments and/or influence of different water masses. The intrusion of oxygenated water masses could dilute the denitrification signal. Nitrate is, next to O2 concentrations, the major factor controlling denitrification, and denitrification rates increase with NO3− concentration (Moseman-Valtierra et al., 2011; Pajares and Ramos, 2019; Li et al., 2021). Denitrification is a stepwise reduction of NO3− via NO2− to N2, while during anaerobic ammonium oxidation, the anammox bacteria oxidize NH4+ to N2 using NO2− as the electron acceptor. Hence, both N-removal pathways require different substrates. In our study, we observed a significant correlation between NO2- + NO3- and ΔN2 (p = 0.00003; R2 = 0.1879). The availability of variable NO2- + NO3- enhances the microbial activity thereby increasing the rate of N2 production in the layers below the halocline. The observed variability in NO2- + NO3- concentration across the layers and seasons with the enhanced ΔN2 suggests the differences in organic matter availability and microbial processes. We did not observe a significant correlation with NH4+ (p = 0.4660; R2 = 0.0064), suggesting that the net effect of processes other than anammox is stronger, (e.g. ammonification, dissimilatory nitrate reduction to ammonium). We noted a positive correlation between PO43- and ΔN2 (p = 0.0024; R2 = 0.1059) concentrations. The PO43- concentrations increased as O2 concentration decreased. This is presumably due to the O2 deficiency, which causes a reduction in the retention capacity of PO43- in anoxic sediments and therefore an enhanced release of PO43- into the water column under low O2/anoxic conditions (Meier et al., 2019). Moreover, the addition of phosphorus can increase the efficiency of denitrification as it induces the growth of bacteria and improves their ability to reduce bioavailable nitrogen (Kim et al., 2015; Fan et al., 2018). From the obtained results, we suggest that oxygen is the most dominant factor, followed by NO2- + NO3-, both of which influence ΔN2 in the Baltic Sea water column.
Significant spatial variability in ΔN2 concentrations was observed when analyzing all samples (from layers C and D) from all cruises (p = 0.0001), and when focusing exclusively on samples from the September/October 2021 cruise (p = 0.00008). The highest ΔN2 concentrations were recorded in the eastern Gotland Basin (Figure 4A) at stations BY9, BY10, BY11, BY15, and BY15a, as well as in the Bornholm Deep (e.g. IDEAL station). Dinitrogen excess values measured previously in Gotland Deep below 150 m ranged from 0 to 41 µmol L-¹ (Löffler et al., 2011) and were in line with the values calculated in our study. In contrast, lower ΔN2 concentrations were observed in the southern Baltic Sea sites (Figures 4A, B). Such spatial variation might be attributed to local environmental factors, including nitrate concentration, salinity, temperature, and the depth of oxygen penetration, all of which can influence ΔN2 concentrations. The Gotland Basin, the largest basin of the Baltic Sea, has no direct connections to neighboring basins below a depth of 150 m and is largely insulated from lateral disturbances (Löffler et al., 2011). This insulation can lead to the accumulation of N2 produced through nitrogen removal processes, resulting in relatively high ΔN2 values at sites such as station BY15 (maximum depth ~240 m) and station BY11 (maximum depth ~200 m). The oxygen concentrations in the deep-water layers below halocline (layers C and D) in Gotland Basin ranged from 0.7 to 7.7 µmol L-1, conditions which favor denitrification. Furthermore, the measured high concentrations of ammonium and relatively elevated nitrite levels (Figures 3A, B) in the Gotland Basin indicate the availability of substrates necessary for anammox, another important nitrogen removal process. The observed spatial variability in ΔN2 may be also the net accumulative effect of N2 production over time (from different seasons).
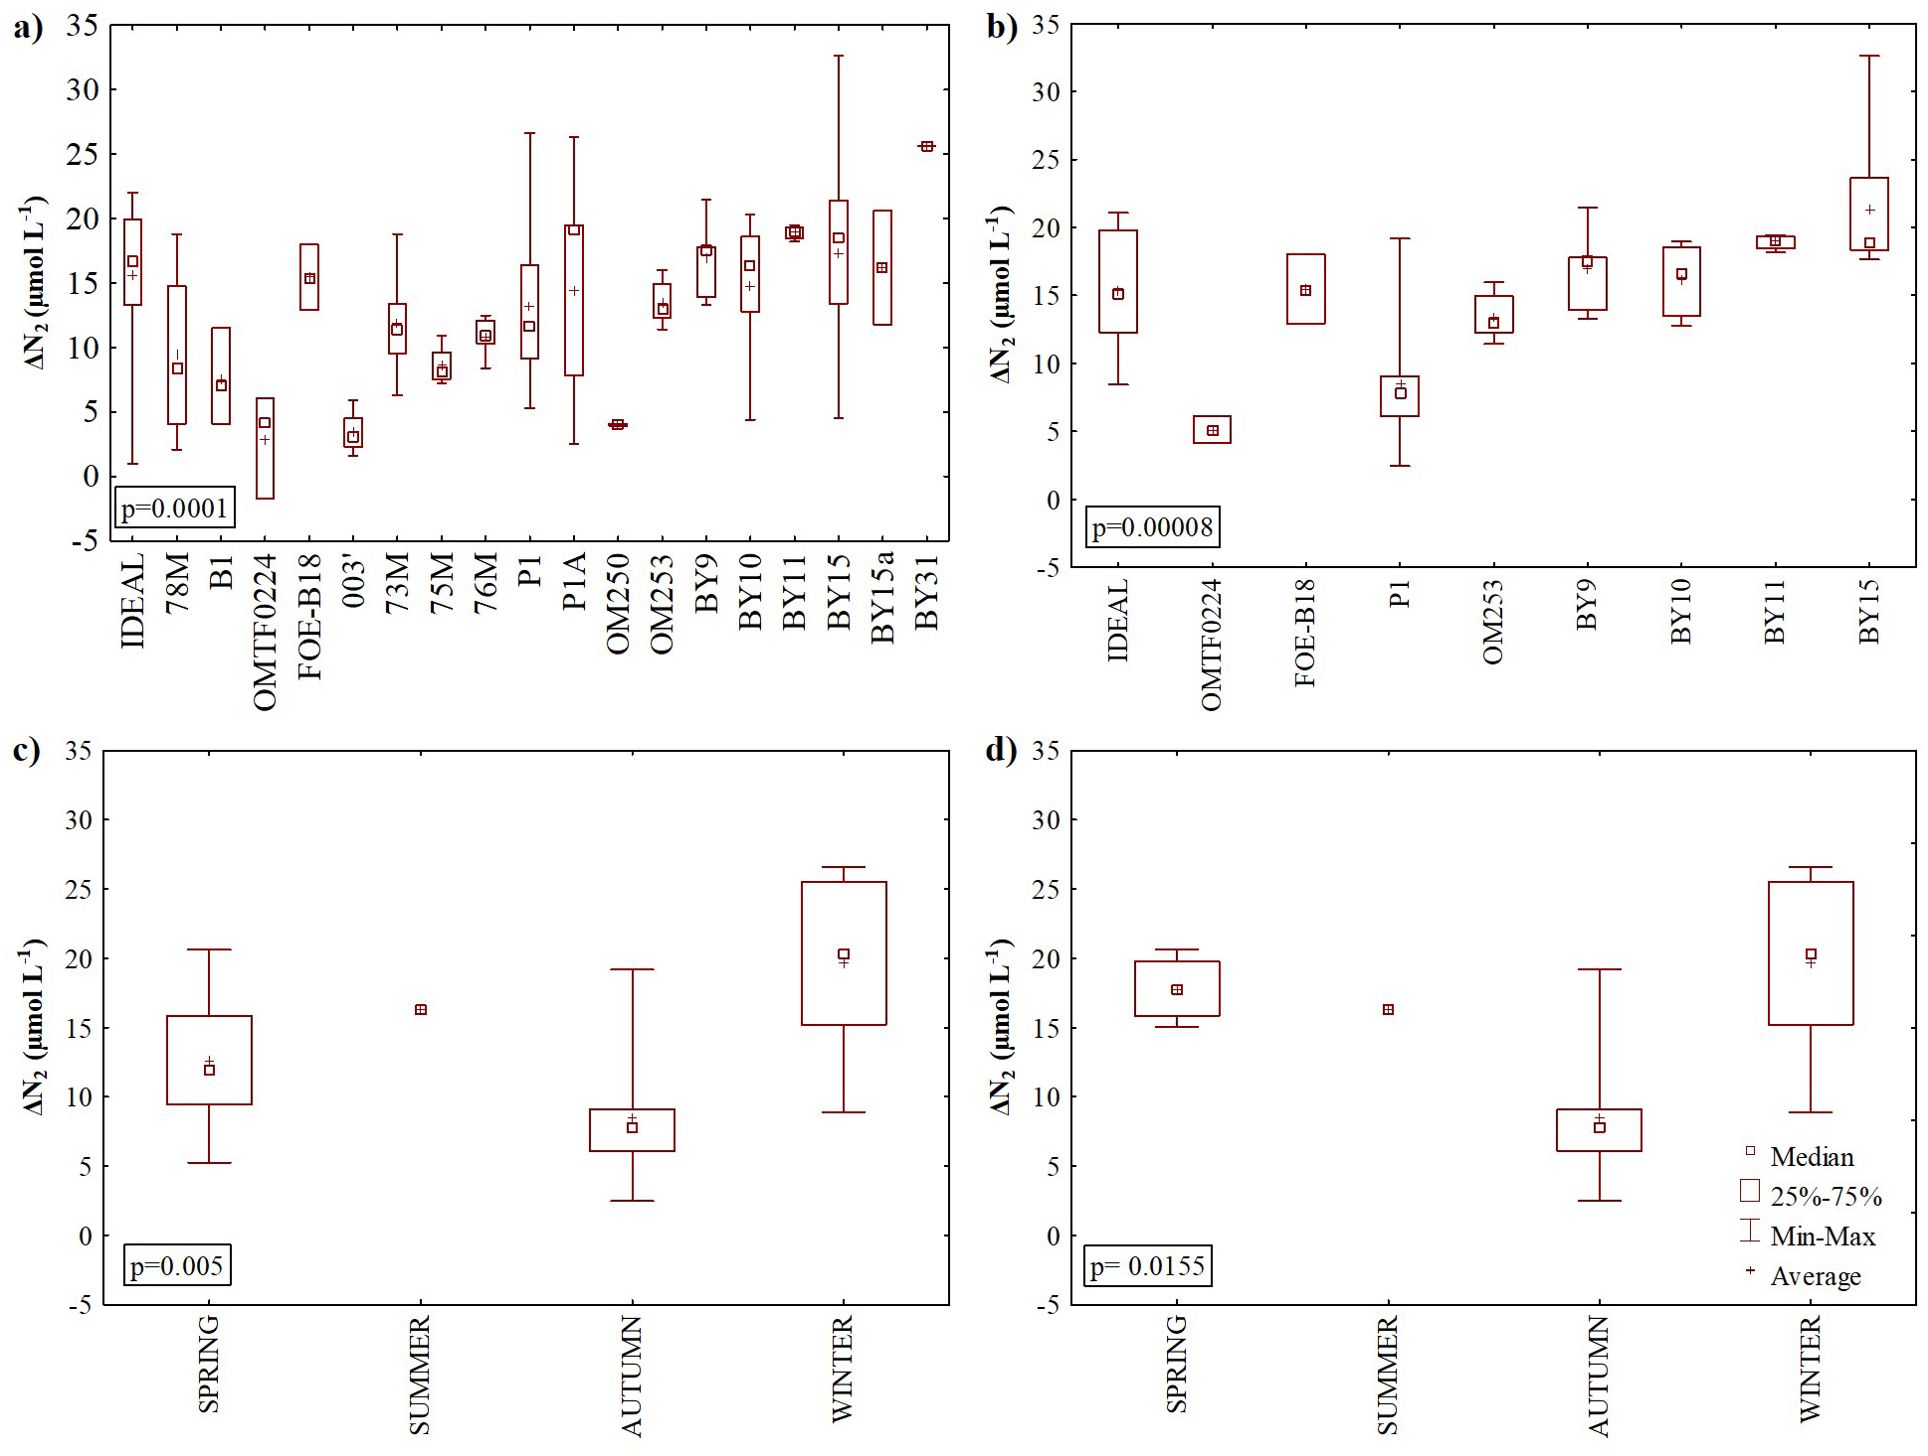
Figure 4. Excess dinitrogen gas (∆N2) concentration measured in the halocline layer (C) and bottom water (D): in stations sampled: (A) between 2017 and 2021, (B) in autumn 2021, (C) between 2017 and 2021, and (D) in 2020 and 2021 at the Gdańsk Deep.
The significant differences in ΔN2 were also observed seasonally in all samples (from layers C and D) collected from 2017 to 2021 (p = 0.005, Figure 4C), and for samples collected only at P1 in 2020 and 2021 (p = 0.0155, Figure 4D), with the highest ΔN2 concentrations observed in winter. Similar results were reported by Schneider et al. (2010) who observed the highest denitrification rates in winter in the Gotland Basin. The Baltic Sea exhibits significant seasonal variability in nutrient distribution, with the highest concentrations observed in winter (e.g., Kuss et al., 2020; Savchuk, 2018). This pattern is primarily driven by higher temperatures and increased light availability during spring, summer, and autumn, which stimulate primary production and deplete nutrient levels. Since nitrate is a key substrate for denitrification, it is likely that the highest denitrification rates and consequently the highest concentrations of N2 occur during winter, when nutrient concentrations are at their peak. Bonaglia et al. (2017) also observed seasonal differences in denitrification rates (between June and August) most likely due to variations in organic matter export from the surface layer.
The N2/Ar ratio method is a simple and efficient method to measure the cumulative dinitrogen gas accumulation without the need for prior sample preparation for analysis. This method is well-suited for stratified systems like the Baltic Sea. However, it provides a cumulative assessment of nitrogen loss processes, rather than direct rate measurements of specific microbial processes, such as dissimilatory nitrate reduction. Despite these limitations, the N2/Ar method remains a valuable tool for investigating spatial and seasonal changes in bioavailable nitrogen loss in the Baltic Sea. Thanks to this method, we were able to demonstrate for the first time the seasonal variability of dissolved dinitrogen gas excess on such a large scale in the Baltic Proper, providing new insights into the dynamics of nitrogen cycling in this region. Most studies related to the estimation of marine inorganic nitrogen loss are limited to subareas of the Baltic Sea and do not contain spatial and seasonal observations. Our measurements indicate that the cumulative effect of denitrification and anammox on the water column is not uniform across the Baltic Proper, exhibiting significant spatial and seasonal variabilities. Therefore, we recognize the need for spatial and seasonal investigations that focus on denitrification and anammox rates in the water column, utilizing a consistent methodological approach.
We investigated the cumulative effect of bioavailable N loss via denitrification and anammox accumulated in the water column of the Baltic Sea using the N2/Ar method. While the rates of denitrification and anammox were not directly measured, the N2/Ar ratio was used as a tracer to estimate the nitrogen loss through these processes. Thus, the calculated excess of dinitrogen gas reflects the cumulative effect of both nitrogen removal processes. It is important to emphasize that denitrification and anammox have already been extensively studied in the Baltic Sea. However, the use of several different methods hampers the comparison of obtained process rates and limits the overall understanding of the N cycle. Applying the same measurement method for estimating excess dinitrogen gas allowed, for the first time, to provide comparable data on the spatial and seasonal distribution of accumulated effects of these processes in the Baltic Sea ecosystem. This study shows that this accumulated signal expressed as ΔN2 (excess N2) is large and varies significantly spatially and seasonally. Hence, extrapolating the results from one station to larger areas or time intervals will be associated with considerable uncertainties. Nevertheless, the identified distribution of ΔN2 constitutes already a unique dataset to be used for validating biogeochemical models aiming at resolving the nitrogen cycle in the Baltic Sea on a large scale.
While nutrient availability plays a crucial role in regulating denitrification and anammox rates, and consequently, the production of excessive N2, the lack of comprehensive nutrient measurements (due to their initiation only in September 2020 in this study) prevented us from providing a detailed analysis of the relationship between ΔN2 and nutrient concentrations. This limitation was further compounded by inconsistent data collection across the various study sites, leading us to exclude this aspect of the analysis to avoid potential misinterpretation of the results.
In conclusions, the obtained results highlight the need for further research to attribute the observed effects to individual processes (denitrification and anammox) and to quantify their rates which could be complemented by direct measurements of denitrification and anammox in the water column. Moreover, denitrification is expected to influence climate change by affecting the oceanic nitrogen inventory, emissions of N2O, and ultimately alteration of oceanic CO2 sequestration (Falkowski, 1997; Altabet, 2007). Therefore, it is crucial to understand how ongoing environmental and climate changes will influence oceanic nitrogen and carbon inventories on a wide range of temporal and spatial scales.
The original contributions presented in the study are included in the article/Supplementary Material. Further inquiries can be directed to the corresponding author/s.
PS: Conceptualization, Data curation, Investigation, Methodology, Validation, Visualization, Writing – original draft, Writing – review & editing. MD: Investigation, Supervision, Writing – review & editing. AW: Writing – review & editing. HB: Writing – review & editing. MB: Investigation, Writing – review & editing. PM: Investigation, Writing – review & editing. KK-M: Investigation, Writing – review & editing. KK: Investigation, Writing – review & editing. AM: Writing – review & editing. BS: Conceptualization, Funding acquisition, Investigation, Supervision, Writing – review & editing.
The author(s) declare financial support was received for the research, authorship, and/or publication of this article. The reported results were obtained within the framework of the statutory activities of the Institute of Oceanology of the Polish Academy of Sciences and projects nr. 2019/34/E/ST10/00217 and 2024/52/L/ST10/00304 funded by the Polish National Science Centre.
We thank Todd Kana for the constructive comments and for supporting the mass spectrometry work. We are grateful to the captain and crew of the R/V Oceania. We also would like to thank P. Prusiński and M. Stokowski for their support during laboratory measurements and/or sampling, respectively.
The authors declare that the research was conducted in the absence of any commercial or financial relationships that could be construed as a potential conflict of interest.
All claims expressed in this article are solely those of the authors and do not necessarily represent those of their affiliated organizations, or those of the publisher, the editors and the reviewers. Any product that may be evaluated in this article, or claim that may be made by its manufacturer, is not guaranteed or endorsed by the publisher.
The Supplementary Material for this article can be found online at: https://www.frontiersin.org/articles/10.3389/fmars.2025.1455803/full#supplementary-material
Aigars J., Poikāne R., Dalsgaard T., Eglīte E., Jansons M. (2015). Biogeochemistry of N, P and SI in the Gulf of Riga surface sediments: Implications of seasonally changing factors. Continental Shelf Res. 105, 112–120. doi: 10.1016/j.csr.2015.06.008
Allin A., Schernewski G., Friedland R., Neumann T., Radtke H. (2017). Climate change effects on denitrification and associated avoidance costs in three Baltic river basin - coastal sea systems. J. Coast. Conserv. 21, 561–569. doi: 10.1007/s11852-017-0530-8
Altabet M. A. (2007). Constraints on oceanic N balance/imbalance from sedimentary 15N records. Biogeosciences 4, 75–86. doi: 10.5194/bg-4-75-2007
Andersen J. H., Carstensen J., Conley D. J., Dromph K., Fleming-Lehtinen V., Gustafsson B. G., et al. (2017). Long-term temporal and spatial trends in eutrophication status of the Baltic Sea. Biol. Rev. 92, 135–149. doi: 10.1111/brv.12221
Asmala E., Carstensen J., Conley D. J., Slomp C. P., Stadmark J., Voss M. (2017). Efficiency of the coastal filter:Nitrogen and phosphorus removal in the Baltic Sea. Limnol. Oceangr 62, S222–S238. doi: 10.1002/lno.10644
Belkin N., Rahav E., Elifantz H., Kress N., Berman-Frank I. (2015). Enhanced salinities, as a proxy of seawater desalination discharges, impact coastal microbial communities of the eastern Mediterranean Sea. Environ Microbiol. 17(10), 4105–4120. doi: 10.1111/1462-2920.12979
Bonaglia S., Hylén A., Rattray J. E., Kononets M. Y., Ekeroth N., Roos P., et al. (2017). The fate of fixed nitrogen in marine sediments with low organic loading: an in situ study. Biogeosciences 14, 285–300. doi: 10.5194/bg-14-285-2017
Bonaglia S., Klawonn I., De Brabandere L., Deutsch B., Thamdrup B., Brüchert V. (2016). Denitrification and DNRA at the Baltic Sea oxic–anoxic interface: Substrate spectrum and kinetics. Limnology Oceanography 61, 1900–1915. doi: 10.1002/lno.10343
Capone D. G., Bronk D. A., Mulholland M. R., Carpenter E. J. (2008). Nitrogen in the marine environment (Amsterdam: Elsevier).
Carstensen J., Conley D. J., Bonsdorff E., Gustafsson B. G., Hietanen S., Janas U., et al. (2014). Hypoxia in the Baltic Sea: biogeochemical cycles, benthic fauna, and management. Ambio. 43, 26–36. doi: 10.1007/s13280-013-0474-7
Chang B. X., Devol A. H., Emerson S. R. (2010). Denitrification and the nitrogen gas excess in the tropical South Pacific oxygen deficient zone. Deep Sea Research Part I: Oceanographic Research Papers. 57(9), 1092–1101. doi: 10.1016/j.dsr.2010.05.009
Chang B. X., Devol A. H., Emerson S. R. (2012). Fixed nitrogen loss from the eastern tropical North Pacific and Arabian Sea oxygen deficient zones determined from measurements of N2: Ar. Global Biogeochemical Cycles 26(3). doi: 10.1029/2011GB004207
Codispoti L. A., Brandes J. A., Christensen J. P., Devol A. H., Naqvi S. W. A., Paerl H. W., et al. (2001). The oceanic fixed nitrogen and nitrous oxide budgets: Moving targets as we enter the anthropocene? Sci. Mar. 65, 85–105. doi: 10.3989/scimar.2001.65s285
Dalsgaard T., De Brabandere L., Hall P. O. (2013). Denitrification in the water column of the central Baltic Sea. Geochimica Cosmochimica Acta 106, 247–260. doi: 10.1016/j.gca.2012.12.038
Dargahi B., Kolluru V., Cvetkovic V. (2017). Multi-layered stratification in the baltic sea: insight from a modeling study with reference to environmental conditions. J. Mar. Sci. Eng. 5, 2. doi: 10.3390/jmse5010002
Deutsch B., Forster S., Wilhelm M., Dippner J. W., Voss M. (2010). Denitrification in sediments as a major nitrogen sink in the Baltic Sea: an extrapolation using sediment characteristics. Biogeosciences 7, 3259–3271. doi: 10.5194/bg-7-3259-2010
Devol A. H., Uhlenhopp A. G., Naqvi S. W. A., Brandes J. A., Jayakumar D. A., Naik H., et al. (2006). Denitrification rates and excess nitrogen gas concentrations in the Arabian Sea oxygen deficient zone. Deep Sea Res. 53, 1533–1547. doi: 10.1016/J.DSR.2006.07.005
Falkowski P. G. (1997). Evolution of the nitrogen cycle and its influence on the biological sequestration of CO2 in the ocean. Nature 387, 272–275. doi: 10.1038/387272a0
Fan C., Wang P., Zhou W., Wu S., He S., Huang J., et al. (2018). The influence of phosphorus on the autotrophic and mixotrophic denitrification. Sci. total Environ. 643, 127–133. doi: 10.1016/j.scitotenv.2018.06.185
Farías L., Castro-González M., Cornejo M., Charpentier J., Faúndez J., Boontanon N., et al. (2009). Denitrification and nitrous oxide cycling within the upper oxycline of the eastern tropical South Pacific oxygen minimum zone. Limnology Oceanography 54, 132–144. doi: 10.4319/lo.2009.54.1.0132
Fear J. M., Thompson S. P., Gallo T. E., Pearl H. W. (2005). Denitrification rates measured along a salinity gradient in the eutrophic Neuse River Estuary, North Carolina, USA. Estuaries 28, 608–619. doi: 10.1007/BF02696071https://doi.org/10.1007/BF02696071
Grasshoff K., Erhardt M., Kremling K. (Eds.) (1983). Methods of seawater analysis (Germany: Verlag Chemie), 419. doi: 10.1002/iroh.19850700232
Gustafsson B. G., Schenk F., Blenckner T., Eilola K., Meier H. M., Müller-Karulis B., et al. (2012). Reconstructing the development of Baltic Sea eutrophication 1850–2006. Ambio 41, 534–548. doi: 10.1007/s13280-012-0318-x
Hamme R. C., Emerson S. R. (2004). The solubility of neon, nitrogen and argon in distilled water and seawater. Deep Sea Res. I Oceanogr Res. Pap. 51, 1517–1528. doi: 10.1016/j.dsr.2004.06.009
Hamme R. C., Emerson S. R. (2013). Deep-sea nutrient loss inferred from the marine dissolved N2/Ar ratio. Geophys. Res. Lett. 40, 1149–1153. doi: 10.1002/grl.50275
Hannig M., Lavik G., Kuypers M. M. M., Woebken D., Martens-Habbena W., Jürgens K. (2007). Shift from denitrification to anammox after inflow events in the central Baltic Sea. Limnology Oceanography 52, 1336–1345. doi: 10.4319/lo.2007.52.4.1336
HELCOM. (2018a). State of the Baltic Sea – Second HELCOM holistic assessment 2011-2016. Baltic Sea Environment Proceedings 155.
HELCOM. (2018b). HELCOM thematic assessment of eutrophication 2011–2016. (Helsinki, Finland: HELCOM).
Hellemann D., Tallberg P., Aalto S. L., Bartoli M., Hietanen S. (2020). Seasonal cycle of benthic denitrification and DNRA in the aphotic coastal zone, northern Baltic Sea. Mar. Ecol. Prog. Ser. 637, 15–28. doi: 10.3354/meps13259
Inglett P. W., Kana T. M., An S. (2013). Denitrification measurement using membrane inlet mass spectrometry. Methods biogeochemistry wetlands 10, 503–517. doi: 10.2136/sssabookser10.c27
Jensen M. M., Thamdrup B., Dalsgaard T. (2007). Effects of specific inhibitors on anammox and denitrification in marine sediments. Appl. Environ. Microbiol. 73, 3151–3158. doi: 10.1128/AEM.01898-06
Kana T. M., Darkangelo C., Hunt M. D., Oldham J. B., Bennett G. E., Cornwell J. C. (1994). Membrane lnlet mass spectrometer for rapid high-precision determination of N2, O2, and ar in environmental water samples. Anal. Chem. 66, 4166–4170. doi: 10.1021/ac00095a009
Kim S. Y., Veraart A. J., Meima-Franke M., Bodelier P. L. (2015). Combined effects of carbon, nitrogen and phosphorus on CH4 production and denitrification in wetland sediments. Geoderma 259, 354–361. doi: 10.1016/j.geoderma.2015.03.015
Knowles R. (1990). “Acetylene inhibition technique: development, advantages, and potential problems,” in Denitrification in soil and sediment (Springer US, Boston, MA), 151–166.
Kuliński K., Rehder G., Asmala E., Bartosova A., Carstensen J., Gustafsson B., et al. (2022). Biogeochemical functioning of the baltic sea. Earth Syst. Dynam 13, 633–685. doi: 10.5194/esd-13-633-2022
Kuss J., Nausch G., Engelke C., Weber M. V., Lutterbeck H., Naumann M., et al. (2020). Changes of nutrient concentrations in the western Baltic Sea in the transition between inner coastal waters and the central basins: Time series from 1995 to 2016 with source analysis. Frontiers in Earth Science 8, 106.
Lam P., Kuypers M. M. M. (2011). Microbial nitrogen cycling processes in oxygen minimum zones. Annu. Rev. Mar. Sci. 3, 317–345. doi: 10.1146/annurev-marine-120709-142814
Lehmann A., Myrberg K., Post P., Chubarenko I., Dailidiene I., Hinrichsen H. H., et al. (2022). Salinity dynamics of the baltic sea. Earth Syst. Dynam 13, 373–392. doi: 10.5194/esd-13-373-2022
Li Y., Jin H., Chen J., Wang D., Yang Z., Wang B., et al. (2021). Nitrogen removal through sediment denitrification in the Yangtze Estuary and its adjacent East China Sea: A nitrate limited process during summertime. Sci. Total Environ. 795, 148616. doi: 10.1016/j.scitotenv.2021.148616
Liblik T., Lips U. (2019). Stratification has strengthened in the baltic sea – an analysis of 35 years of observational data. Front. Earth Sci. 7. doi: 10.3389/feart.2019.00174
Löffler A., Schneider B., Schmidt M., Nausch G. (2011). Estimation of denitrification in Baltic Sea deep water from gas tension measurements. Mar. Chem. 125, 91–100. doi: 10.1016/j.marchem.2011.02.006
Meier H. M., Edman M., Eilola K., Placke M., Neumann T., Andersson H. C., et al. (2019). Assessment of uncertainties in scenario simulations of biogeochemical cycles in the Baltic Sea. Front. Mar. Sci. 6, 46. doi: 10.3389/fmars.2019.00046
Meier H. E. M., Kniebusch M., Dieterich C., Gröger M., Zorita E., Elmgren R., et al. (2022). Climate change in the Baltic Sea region: a summary. Earth Syst. Dynam 13, 457–593. doi: 10.5194/esd-13-457-2022
Moseman-Valtierra S., Gonzalez R., Kroeger K. D., Tang J., Chao W. C., Crusius J., et al. (2011). Short-term nitrogen additions can shift a coastal wetland from a sink to a source of N2O. Atmos. Environ. 45, 4390–4397. doi: 10.1016/j.atmosenv.2011.05.046
Murray C. J., Müller-Karulis B., Carstensen J., Conley D. J., Gustafsson B. G., Andersen J. H. (2019). Past, present and future eutrophication status of the baltic sea. Front. Mar. Sci. 6. doi: 10.3389/fmars.2019.00002
Nielsen L. P. (1992). Denitrification in sediment determined from nitrogen isotope pairing. FEMS Microbiol. Ecol. 86, 357–362. doi: 10.1111/j.1574-6968.1992.tb04828.x
Nowicki B. L. (1994). The effect of temperature, oxygen, salinity, and nutrient enrichment on estuarine denitrification rates measured with a modified nitrogen gas flux technique. Estuar. Coast. Shelf. S 38, 137–156. doi: 10.1006/ecss.1994.1009
Pajares S., Ramos R. (2019). Processes and microorganisms involved in the marine nitrogen cycle: knowledge and gaps. Front. Mar. Sci. 6. doi: 10.3389/fmars.2019.00739
Palacin-Lizarbe C., Camarero L., Catalan J. (2018). Estimating sediment denitrification rates using cores and N2O microsensors. J. Vis. Exp. (142), e58553. doi: 10.3791/58553
Rak D., Walczowski W., Dzierzbicka-Głowacka L., Shchuka S. (2020). Dissolved oxygen variability in the southern Baltic Sea in 2013–2018. Oceanologia 62, 525–537. doi: 10.1016/j.oceano.2020.08.005
Risgaard-Petersen N., Meyer R. L., Revsbech N. P. (2005). Denitrification and anaerobic ammonium oxidation in sediments: effects of microphytobenthos and NO3–. Aquat. Microbial Ecol. 40, 67–76. doi: 10.3354/ame040067
Robertson E. K., Bartoli M., Brüchert V., Dalsgaard T., Hall P. O., Hellemann D., et al. (2019). Application of the isotope pairing technique in sediments: use, challenges, and new directions. Limnology Oceanography: Methods 17, 112–136. doi: 10.1002/lom3.10303
Savchuk O. P. (2018). Large-scale nutrient dynamics in the Baltic Sea, 1970–2016. Frontiers in Marine Science 5, 95.
Schmale O., Karle M., Glockzin M., Schneider B. (2019). Potential of nitrogen/argon analysis in surface waters in the examination of areal nitrogen deficits caused by nitrogen fixation. Environ. Sci. Technol. 53, 6869–6876. doi: 10.1021/acs.est.8b06665
Schmidt M., Fennel W., Neumann T., Seifert T. (2008). “Description of the Baltic Sea with numerical models,” in State and evolution of the baltic sea 1952–2005. Eds. Feistel R., Nausch G., Wasmund N. (Hoboken, New Jersey, USA: Wiley), 583–624.
Schneider B., Nausch G., Pohl C. (2010). Mineralization of organic matter and nitrogen transformations in the Gotland Sea deep water. Mar. Chem. 119, 153–161. doi: 10.1016/j.marchem.2010.02.004
Seltzer A. M., Nicholson D. P., Smethie W. M., Tyne R. L., Le Roy E., Stanley R. H. R., et al. (2023). Dissolved gases in the deep North Atlantic track ocean ventilation processes. Proc. Natl. Acad. Sci. 120, e2217946120. doi: 10.1073/pnas.2217946120
Seo D. C., Yu K., Delaune R. D. (2008). Influence of salinity level on sediment denitrification in a Louisiana estuary receiving diverted Mississippi River water. Arch. Agron. Soil. Sci. 54, 249–257. doi: 10.1080/03650340701679075
She D., Sun X., Xia Y. (2019). Combining N 2: ar and bayesian methods to quantify underestimation and uncertainty of sediment denitrification determined by the acetylene inhibition method. Water Air Soil pollut. 230, 1–9. doi: 10.1007/s11270-019-4100-6
Shigemitsu M., Gruber N., Oka A., Yamanaka Y. (2016). Potential use of the N2/Ar ratio as a constraint on the oceanic fixed nitrogen loss. Glob. Biogeochem. Cycles 30, 576–594. doi: 10.1002/2015GB005297
Szymczycha B., Winogradow A., Mackiewicz A., Diak M., Prusiński P., Makuch P., et al. (2024). IDEAL PROJECT: Spatial and seasonal variability of excess nitrogen gas in the Baltic Sea (Data set) (Sopot, Poland: IOPAN Geonetwork). doi: 10.48457/iopan-2024-253
Keywords: denitrification, anammox, water column, halocline, N2/Ar
Citation: Sivasamy P, Diak M, Winogradow A, Bange HW, Borecka M, Makuch P, Koziorowska-Makuch K, Kuliński K, Mackiewicz A and Szymczycha B (2025) Spatial and seasonal variability of excess dinitrogen gas in the Baltic Sea. Front. Mar. Sci. 12:1455803. doi: 10.3389/fmars.2025.1455803
Received: 27 June 2024; Accepted: 13 January 2025;
Published: 03 February 2025.
Edited by:
Jun Sun, China University of Geosciences, ChinaReviewed by:
Elisa Soana, University of Ferrara, ItalyCopyright © 2025 Sivasamy, Diak, Winogradow, Bange, Borecka, Makuch, Koziorowska-Makuch, Kuliński, Mackiewicz and Szymczycha. This is an open-access article distributed under the terms of the Creative Commons Attribution License (CC BY). The use, distribution or reproduction in other forums is permitted, provided the original author(s) and the copyright owner(s) are credited and that the original publication in this journal is cited, in accordance with accepted academic practice. No use, distribution or reproduction is permitted which does not comply with these terms.
*Correspondence: Beata Szymczycha, YmVhdHN6QGlvcGFuLnBs
Disclaimer: All claims expressed in this article are solely those of the authors and do not necessarily represent those of their affiliated organizations, or those of the publisher, the editors and the reviewers. Any product that may be evaluated in this article or claim that may be made by its manufacturer is not guaranteed or endorsed by the publisher.
Research integrity at Frontiers
Learn more about the work of our research integrity team to safeguard the quality of each article we publish.