 Ivan Hernandez
 Leidy M. Castro-Rosero
 Manuel Espino
 Jose M. Alsina
- 1Laboratori d’Enginyeria Marítima, Universitat Politècnica de Catalunya, Barcelona, Catalunya, Spain
- 2Facultat de Ciències de la Terra, Universitat de Barcelona, Barcelona, Catalunya, Spain
- 3Departament d’Enginyeria Gràfica i de Disseny, Universitat Politècnica de Catalunya, Barcelona, Catalunya, Spain
Introduction: Coastal areas are considered potential sinks for plastic in marine environments. Data from a Lagrangian numerical simulation at a coastal scale using high-resolution hydrodynamic information and observational data of river debris discharge were analysed to determine the environmental variables from meteorological forcing or coastline orientation contributing to particle beaching.
Method: A beaching likelihood parameter was developed to quantitatively measure the propensity for an area to receive or accumulate particles from a known outflow source. Statistical analyses of particle beaching were conducted to reveal possible relationships with hydrodynamic variables. A debris mass budget was calculated from the river release observational data used in the simulation.
Results: Areas close to the release points received the highest amounts of particles and also registered the highest beaching likelihood values. Significant wave height mildly affected particle beaching (Pearson’s r=0.36). Relative perpendicular wave directions promoted beaching in coastlines with lower azimuths (vertical orientation), whereas those with higher azimuths (horizontal orientation) were more affected by relative alongshore wave directions. The mass contribution from river discharge on beaches where cleanup data was available was 6.0% of the total debris collected.
Discussion: The beaching likelihood parameter revealed the influence of coastal geometry on particle deposition in an area. Comparisons with other studies regarding beaching amounts and particle residence times are challenging due to the scale difference. The complexity of the beaching process makes it difficult to establish relationships with hydrodynamic variables, although a clear association between the coastline orientation and wave direction was established. The debris mass contribution from the two rivers included in the simulation was two orders of magnitude lower than indicated in other studies for the area.
1 Introduction
Plastic pollution in marine environments is one of the great environmental problems of our time and is inextricably linked and an intrinsic part of the climate change crisis (Ford et al., 2022). Subtropical gyres, the seafloor (encompassing the continental shelf and the deep ocean), and coastal zones have been identified as important accumulation regions for marine debris (Kaandorp et al., 2020; Lebreton et al., 2018; Onink et al., 2021; Liubartseva et al., 2018; Sonke et al., 2022).
Lagrangian numerical modelling has been typically used to simulate the movement of virtual particles as a proxy for plastic pollution although most studies have been conducted at large scales with long integration times. Ship data observations over 22 years and a homogeneous concentration of a passive tracer over 10 years served to identify that simulated particles converged in the North Atlantic subtropical gyre (Law et al., 2010). An even larger scale study over 30 years was conducted using both terrestrial and marine inputs, identifying convergence zones for plastic accumulation in the subtropical latitudes of the major ocean basins (Lebreton et al., 2012; Maximenko et al., 2012). Subsequently, polar regions were also found to be vulnerable to the transport of plastic pollution (Van Sebille et al., 2012). Initial estimates using visual observations and numerical modelling proposed a minimum budget of 5.25 trillion floating plastic particles in the global ocean which were substantially elevated more recently to 82–358 trillion plastic particles weighing 1.1–4.9 million tonnes (Eriksen et al., 2014, 2023). A global inventory for microplastics using virtual particles estimated that only <1% of the debris entering the ocean annually from land-based sources corresponds to floating macroplastic waste (Van Sebille et al., 2015). Virtually all plastics that have entered the ocean since the 1950s are considered removed from the ocean surface layer, presumably by fragmentation and settling (Koelmans et al., 2017). Fragmentation is dependent on particle size but plays a minor role in mass budgets compared to other sinks (Kaandorp et al., 2021). Studies in the NW Mediteranean, however, found rapid fragmentation of particles within the 1 km coastal strip suggesting removal of these particles by beaching (Pedrotti et al., 2016). Subsequent global modelling studies have shown that approximately 23% of macroplastics can be found on beaches, 67% has been removed from the upper ocean layer due to particle density, and 3-4% of debris (microplastics and macroplastics) is estimated to be floating (Isobe and Iwasaki, 2022). In contrast, studies conducted at smaller spatiotemporal scales reveal levels of >90% particle beaching from river outflows (Hernandez et al., 2024; Castro-Rosero et al., 2023).
Lagrangian numerical modelling studies of the Mediterranean Sea basin identified the connectivity of the sub-basins and interannual variability (Tsiaras et al., 2022; Mansui et al., 2015). Using the methodology by Maximenko et al. (2012) the south and southeastern Levantine basin were identified as net accumulation zones (Zambianchi et al., 2017). Studies in the eastern sub-basin demonstrated that the Aegean Sea is a source of debris rather than a recipient (Politikos et al., 2017). In contrast with other global studies, long-term accumulation of debris on the Mediterranean Sea surface is unlikely, with substantial accumulation of debris on coastlines and the seafloor, and strong seasonal variability (Liubartseva et al., 2018; Mansui et al., 2020). Another study in the Ionian Sea revealed retention of debris close to coastal areas for up to 80 days before moving offshore, with connectivity between areas due to a net northward movement of particles (Politikos et al., 2020). A comprehensive study by Tsiaras et al. (2021), however, demonstrated a more generalised net southward movement of macroplastics. The work by Kaandorp et al. (2020) further contributed to considering coastlines as sinks for debris, accumulating 49-63% of debris, and 37-51% sinking to the seafloor.
Modelling of vertical velocities in Lagrangian simulations has been sparse as most studies use 2D horizontal hydrodynamic data without including the complexities of a 3D ocean model. Particle size, buoyancy and biofouling play an important role in the vertical distribution of plastic particles (Jalón-Rojas et al., 2019; Lobelle and Cunliffe, 2011). Furthermore, the amount of biofouling exerts a greater influence on the sinking of virtual particles than the initial size of a particle (Lobelle et al., 2021). The simulation of neutrally buoyant particles using 3D Lagrangian numerical models suggests that the water column is a large reservoir of plastic pollution leading to lower plastic particle concentrations than regular 2D models, with the highest concentrations constrained to the mixed layer (Huck et al., 2022). Another 3D modelling study in the Mediterranean Sea showed that 80% of neutrally buoyant particles stayed within the photic layer (<35 m depth) (Soto-Navarro et al., 2020).
Hydrodynamic inputs can vary largely between Lagrangian numerical modelling studies. The effect of Stokes drift on accumulation patterns together with Ekman and geostrophic currents showed that the effect of windage, an important plastic particle transport mechanism, was not necessary to be accounted for if Stokes drift was included in the model (Onink et al., 2019). The inclusion of windage, however, requires the parameterisation of particle size, buoyancy and exposure above the water surface (Duhec et al., 2015; Ruiz et al., 2022; Ryan, 2015). This invariably increases the complexity of the model which in many cases (as in this study) considers only a virtual and generic particle type floating just beneath the surface without density or size. The inclusion of both wind drag and Stokes drift could lead to the wind effect being duplicated as the wave spectrum from which the Stokes drift is calculated may also include data from wind-sea and swell components (Dorsay et al., 2023; Pierson and Moskowitz, 1964; Thomson et al., 2013). The effect of windage and Stokes drift can produce nuanced results dependent on the significant wave height and whether the wind and wave directions are matched (Pärn et al., 2023). Thus, incorporating Stokes drift alone can provide a more accurate representation of residence times (time a particle spends in an area) and beaching amounts (Bosi et al., 2021; Castro-Rosero et al., 2023; Onink et al., 2019). Indeed, the accurate representation of Stokes drift was deemed necessary in models to prevent the overestimation of residence times (Bosi et al., 2021). The importance of using Stokes drift and its impact on particle beaching was demonstrated by a study in the Black Sea (Castro-Rosero et al., 2023). Furthermore, positively buoyant particles are likely to move onshore due to the action of Stokes drift in the shoaling region outside of the surf zone with no influence due to the size or density of floating particles (Alsina et al., 2020).
The present study focuses on the coastal region around Barcelona, Spain’s second-largest city, where 1,787 tonnes of debris are estimated to be discharged annually into the sea based on population estimates and approximations of the total debris amount entering the Mediterranean basin (Liubartseva et al., 2018). Barcelona is highly urbanised and industrialised, has a major port and is limited to the north by the Besòs River (BR), and to the south by the Llobregat River (LR). Concentrations of plastic in these coastal waters are comparable to those found in some subtropical oceanic gyres (De Haan et al., 2022; Sánchez-Vidal et al., 2021). Furthermore, previous numerical modelling studies have shown high flux rates and a constant exchange of debris between coastal and open waters and between beaches and coastal waters in this area (Liubartseva et al., 2018). Citizen science approaches that used paddle surfboards and manta trawls for sample collection demonstrated high proportions of microplastics in nearshore waters around Barcelona with a degree of seasonal variability probably due to changes in hydrodynamic conditions (De Haan et al., 2022). Other studies have demonstrated higher levels of microplastics in organisms of commercial importance due to ingestion in these waters compared to those in less industrialised areas (Martín-Lara et al., 2021). The highly rugose Barcelona coastline has multiple breakwaters and semi-enclosed beaches that may act as possible traps for debris, where the fragmentation rate may be high coupled with a prolonged accumulation of debris in coastal zones (De Haan et al., 2022).
Circulation patterns in the continental shelf of the Catalan Sea are highly influenced by the dynamics of the Northern Current (NC) which originates before the Ligurian Sea and extends southward to the Ibiza channel (Millot, 1999; Rubio et al., 2009). The wind and current regimes in the Catalan Sea experience seasonal variations, with the wind and wave directions also displaying topographic control (Font, 1990; Sánchez-Arcilla et al., 2008). During the autumn and winter seasons, prevailing winds predominantly originate from the north and northwest, whereas in spring and summer, winds originate from southerly and easterly directions (Font, 1990; Grifoll et al., 2012; Liste et al., 2014; Sánchez-Arcilla et al., 2014). The wave direction in the Catalan coast originates mainly from the south and east. These waves are characterised by short fetches with maxima of approximately 600 km from the east due to the presence of the Balearic Islands which also cast a shadow effect from Corsica and Sardinia. Generally, wave conditions are calmer during the summer months but become more energetic from October to May due to storm conditions, resulting in mixed sea states formed by wave trains of varying wave directions (Sánchez-Arcilla et al., 2008).
The role of coastal processes involved in the transport of marine debris is not yet entirely clear and the study of debris transport, dispersion, and accumulation in coastal zones is not yet mature (van Sebille et al., 2020). Coastal processes can include tidal forces (these are not a concern in this study as the Barcelona coastline is microtidal), wind-driven currents, or even storm surges during extreme weather events, and can be very energetic. Other coastal processes include wave action from the dissipation of energy as waves reach the shore derived from wave-driven currents, including rip and undertow currents. Longshore currents are generated when waves break at an angle to the coast, creating parallel currents in the surf zone releasing a burst of energy leading to the formation of a current, potentially depositing debris areas far away from the point of emission. The extent of the transport depends on seasonality, current intensity, and particle size and buoyancy since smaller items are likely to be caught in vertical vorticity and be transported offshore (Fernandino et al., 2016; Isobe et al., 2014; Kataoka et al., 2015).
An important shortcoming in Lagrangian numerical modelling for plastic dispersion predictions at smaller scales and coastal regions concerns the time and spatial resolution of the hydrodynamic input (Dauhajre et al., 2019). Additionally, the hydrodynamic data may not accurately represent the coastal processes involved in the transport of debris in coastal environments which are largely influenced by wave-induced motions (van Sebille et al., 2020). Depth-induced wave breaking plays an important role in the direct plastic motion and indirectly in the induced mean motions (Deike et al., 2017; Svendsen, 1984). In experimental studies in the absence of wind, microplastics released in the shoaling region and in the surf zone moved in an onshore direction with irregular (non-breaking and breaking) waves, eventually becoming beached (Larsen et al., 2023). There is, however, a paucity of studies that focus on the transport of debris at localised scales. The present work aims to build on previous studies that have taken place in the Barcelona region while addressing the gap in knowledge of Lagrangian numerical modelling at coastal scales (De Haan et al., 2022; Sánchez-Vidal et al., 2021; Schirinzi et al., 2020). This study focuses on determining the processes and environmental variables that influence particle beaching, such as those from meteorological forcing, or coastline orientation, of floating plastic particles released from rivers in coastal regions.
2 Methodology
2.1 Lagrangian numerical model
To date, most Lagrangian numerical modelling studies of marine debris have been conducted at large scales using low-resolution hydrodynamic data which is insufficient for coastal scale studies. Indeed, simulating the dispersion of floating marine debris at coastal scales is particularly challenging due to the difficulties in resolving coastal processes. Meshes with high spatial discretisation also tend to have small spatial domains with particles potentially moving out of the domain boundaries quickly, especially under energetic conditions. The LOCATE (Prediction of pLastic hOtspots in Coastal regions using sATellite derived plastic detection, cleaning data and numErical simulations in a coupled system) model addresses this challenge and was used to produce the simulation data analysed in this study (Hernandez et al., 2024). It was developed specifically to simulate the dispersion of marine debris at coastal scales based on the Parcels Lagrangian particle solver to simulate the motion of virtual plastic particles (Delandmeter and Sebille, 2019; OceanParcels, 2020). The LOCATE model integrates Eulerian hydrodynamic data at varying resolutions with nested hydrodynamic grids to account for coastal processes. Nested grids can cover relatively large areas of the coastline with lower-resolution data, while focussing on areas of high interest with higher-resolution data, such as the Barcelona coastline.
The simulation output data from Hernandez et al. (2024) was further analysed in this study to determine the environmental variables that contribute towards particle beaching and accumulation around the Barcelona coastline using high-resolution hydrodynamic data. Circulation data at varying resolutions of 2.5 km, 350 m and 70 m, and wave data at a resolution of 2.5 km were coupled within LOCATE, and a distance-to-shore-based beaching module was included that uses high-resolution shoreline data to help resolve areas of high structural complexity and provide uniformity across domains with varying resolutions (Hernandez et al., 2024). The input data of floating macrolitter was sourced from Schirinzi et al. (2020) and comprised visual observations on bridges from the Llobregat River (LR) to the south of Barcelona city, and from the Besòs River (BR) to the north between 1 February 2017 and 30 September 2017. These observations had a mean frequency of 7.9 days for the LR and 11.3 days for the BR and were interpolated to a daily frequency, with particles released evenly every hour. A total of 552,480 particles (122,784 originating from BR and 429,264 originating from LR) were simulated around the Barcelona coastline for 261 days from 1 February 2017. For more detailed information on the simulation methodology, timeframe, geographical setting and input data please refer to Hernandez et al. (2024).
2.2 Study domain
The study domain was divided into 16 demarcated zones according to municipal boundaries from Área Metropolitana de Barcelona (AMB) or prominent features. Additionally, five zones were designated along the perimeter of the study area to record particles which were exported (move outside of the study domain) as illustrated in Figure 1. Detailed information regarding the demarcation of these zones which were kept in the current study for continuity and the selection of release points can be found in Hernandez et al. (2024). Particle origins and destinations were calculated using the Python Shapely module that determined whether a coordinate lay within a polygon based on the release points and demarcated zones illustrated in Figure 1 (Gillies et al., 2023). The linear length of each demarcated zone along the coastline involved in particle beaching likelihood calculations in Section 2.3 was determined using QGIS software and high-resolution shoreline data.
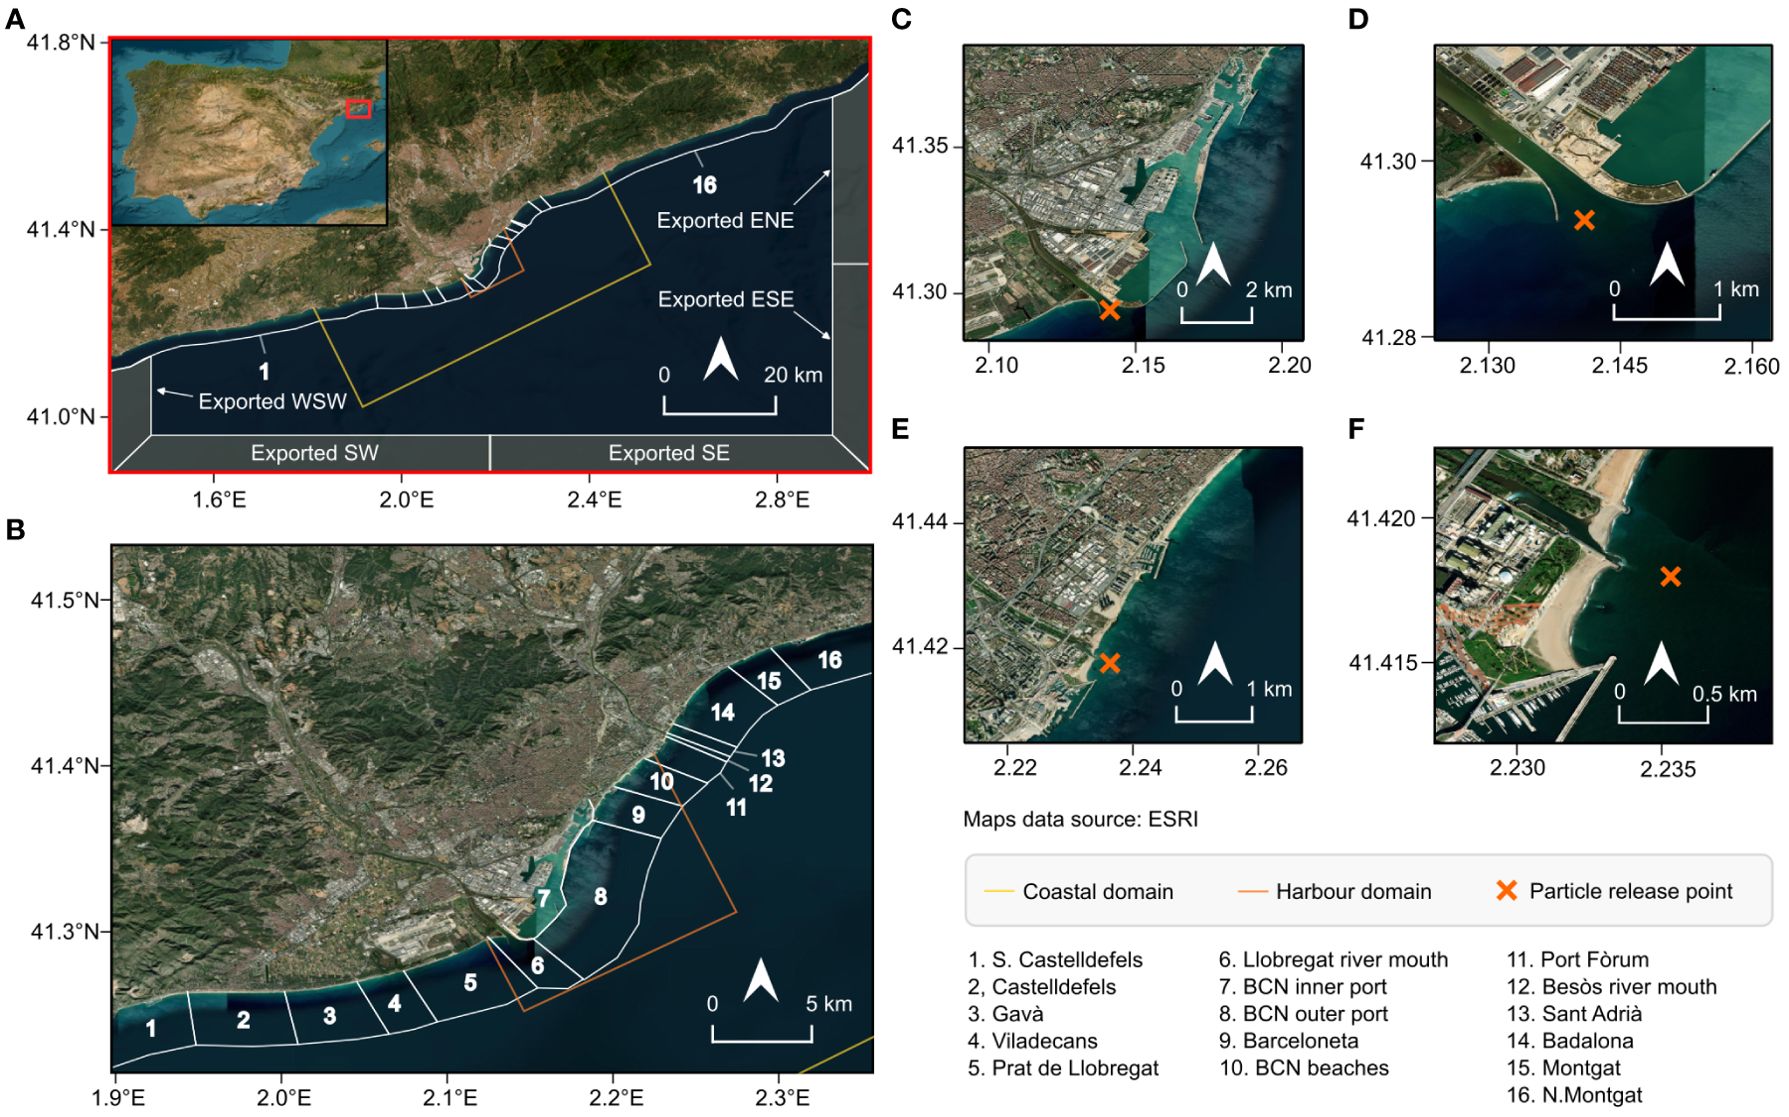
Figure 1. Demarcated zones used to determine particle end locations as per Hernandez et al. (2024) on the Barcelona (Spain) coastline. (A) Study domain with coastline demarcated zones and the 5 particle export zones. The area in the red rectangle represents the study area. (B) The 16 coastline demarcated zones within the Barcelona metropolitan area. (C, D) LR mouth with the particle release point at 41.29285°N, 2.14149°E. (E, F) BR mouth with the particle release point at 41.417671°N, 2.235227°E. Data source for (A–F) is ESRI.
2.3 Beaching likelihood
The proximity to the source of particle discharge was found to be a major factor in the accumulation of particles in prior simulations, with coastline areas adjacent to the debris release points seeming more prone to receive particles. To determine whether this apparent trend obscures a comprehensive analysis of the transport mechanisms that may be veiled by the proximity to the source and their impact on particle beaching, a measure of potential beaching likelihood (BL) was introduced which can be expressed as:
where Bz is the proportion of beached particles in a zone originating from a source, and Lz is the proportion of coastline of a demarcated zone from the total of the study domain. A z-score standardisation was conducted on the values of all demarcated zones from a release point. Positive values indicate a propensity for a demarcated coastal zone to receive or accumulate particles from a known outflow source. In contrast, negative values denote a lack of propensity or external influence on particle beaching.
2.4 Beached and exported particle amounts
To investigate the effect of the hydrodynamic variables on the particles, the proportion of particles that became beached or were exported was calculated from the total number of particles in the system (also referred to as drifting) at any time instance (i). This involved multiple variables; such as the number of particles released (p), the number of particles that became beached (b), and those that were exported (e) from the system. The running number of particles drifting in the system at any time instance (di) from the influx of particles released from all sources can be taken as:
The summation of the particles released, beached and exported over time was used to reflect the possible accumulation of particles over time and their subsequent removal. The proportion of particles that became beached at any time instance was calculated using the total number of particles in the system at any given time:
Likewise, the proportion of exported particles in the domain can be expressed as:
2.5 Particle beaching hydrodynamic factors
The hydrodynamic conditions and coastline configuration are considered relevant factors in controlling the beaching of particles. To investigate this, daily wave direction (mean spectral peak direction using a north-clockwise convention) and significant wave height data were obtained from the Spanish Port Authority (Puertos del Estado) for the simulation period. These data were collected from a buoy outside the Barcelona port area (Boya de Barcelona II) at 68 m depth, at coordinates 41.3234°N, 2.2072°E. The current velocity module was calculated using data from the most proximal node to the Barcelona port buoy. The node selected for the current data was from the port grid at coordinates 41.323402°N, 2.208445°E, at a distance of 17.5 m from the buoy. Hourly u and v velocity data were extracted to calculate the hourly current velocity module as:
To address possible relationships between hydrodynamic variables and the beaching proportion, time series tests were carried out with a 3-hourly discretisation, to allow for maximum statistical significance possible and the cumulative aspect of particle beaching to be conserved. Significant wave height and current velocity were log-transformed, and a logit transformation was applied to the beaching proportion to substantially reduce right-skewness. A Pearson’s time-series correlation test was applied for the transformed hydrodynamic variables over the total coastline, correlated against the beached/exported proportion to assess the strength and direction of any relationships. Linear time-series regressions were also conducted for the total coastline to determine the nature of the relationships between the hydrodynamic variables and beaching proportion.
2.6 Coastal orientation and particle beaching
The Catalan coastline around Barcelona is oriented from southwest to northeast as illustrated in Figure 1A. The coastal orientation (forward azimuth) for each demarcated zone was calculated using the Geodesic function from the Python Pyproj module using each zone’s most distal points on the coastline from the centrepoint (Pyproj, 2022). The wave and current direction rose plots in Figure 2 reveal a predominant northeasterly current direction, with wave directions characterised by easterly to southerly directions.
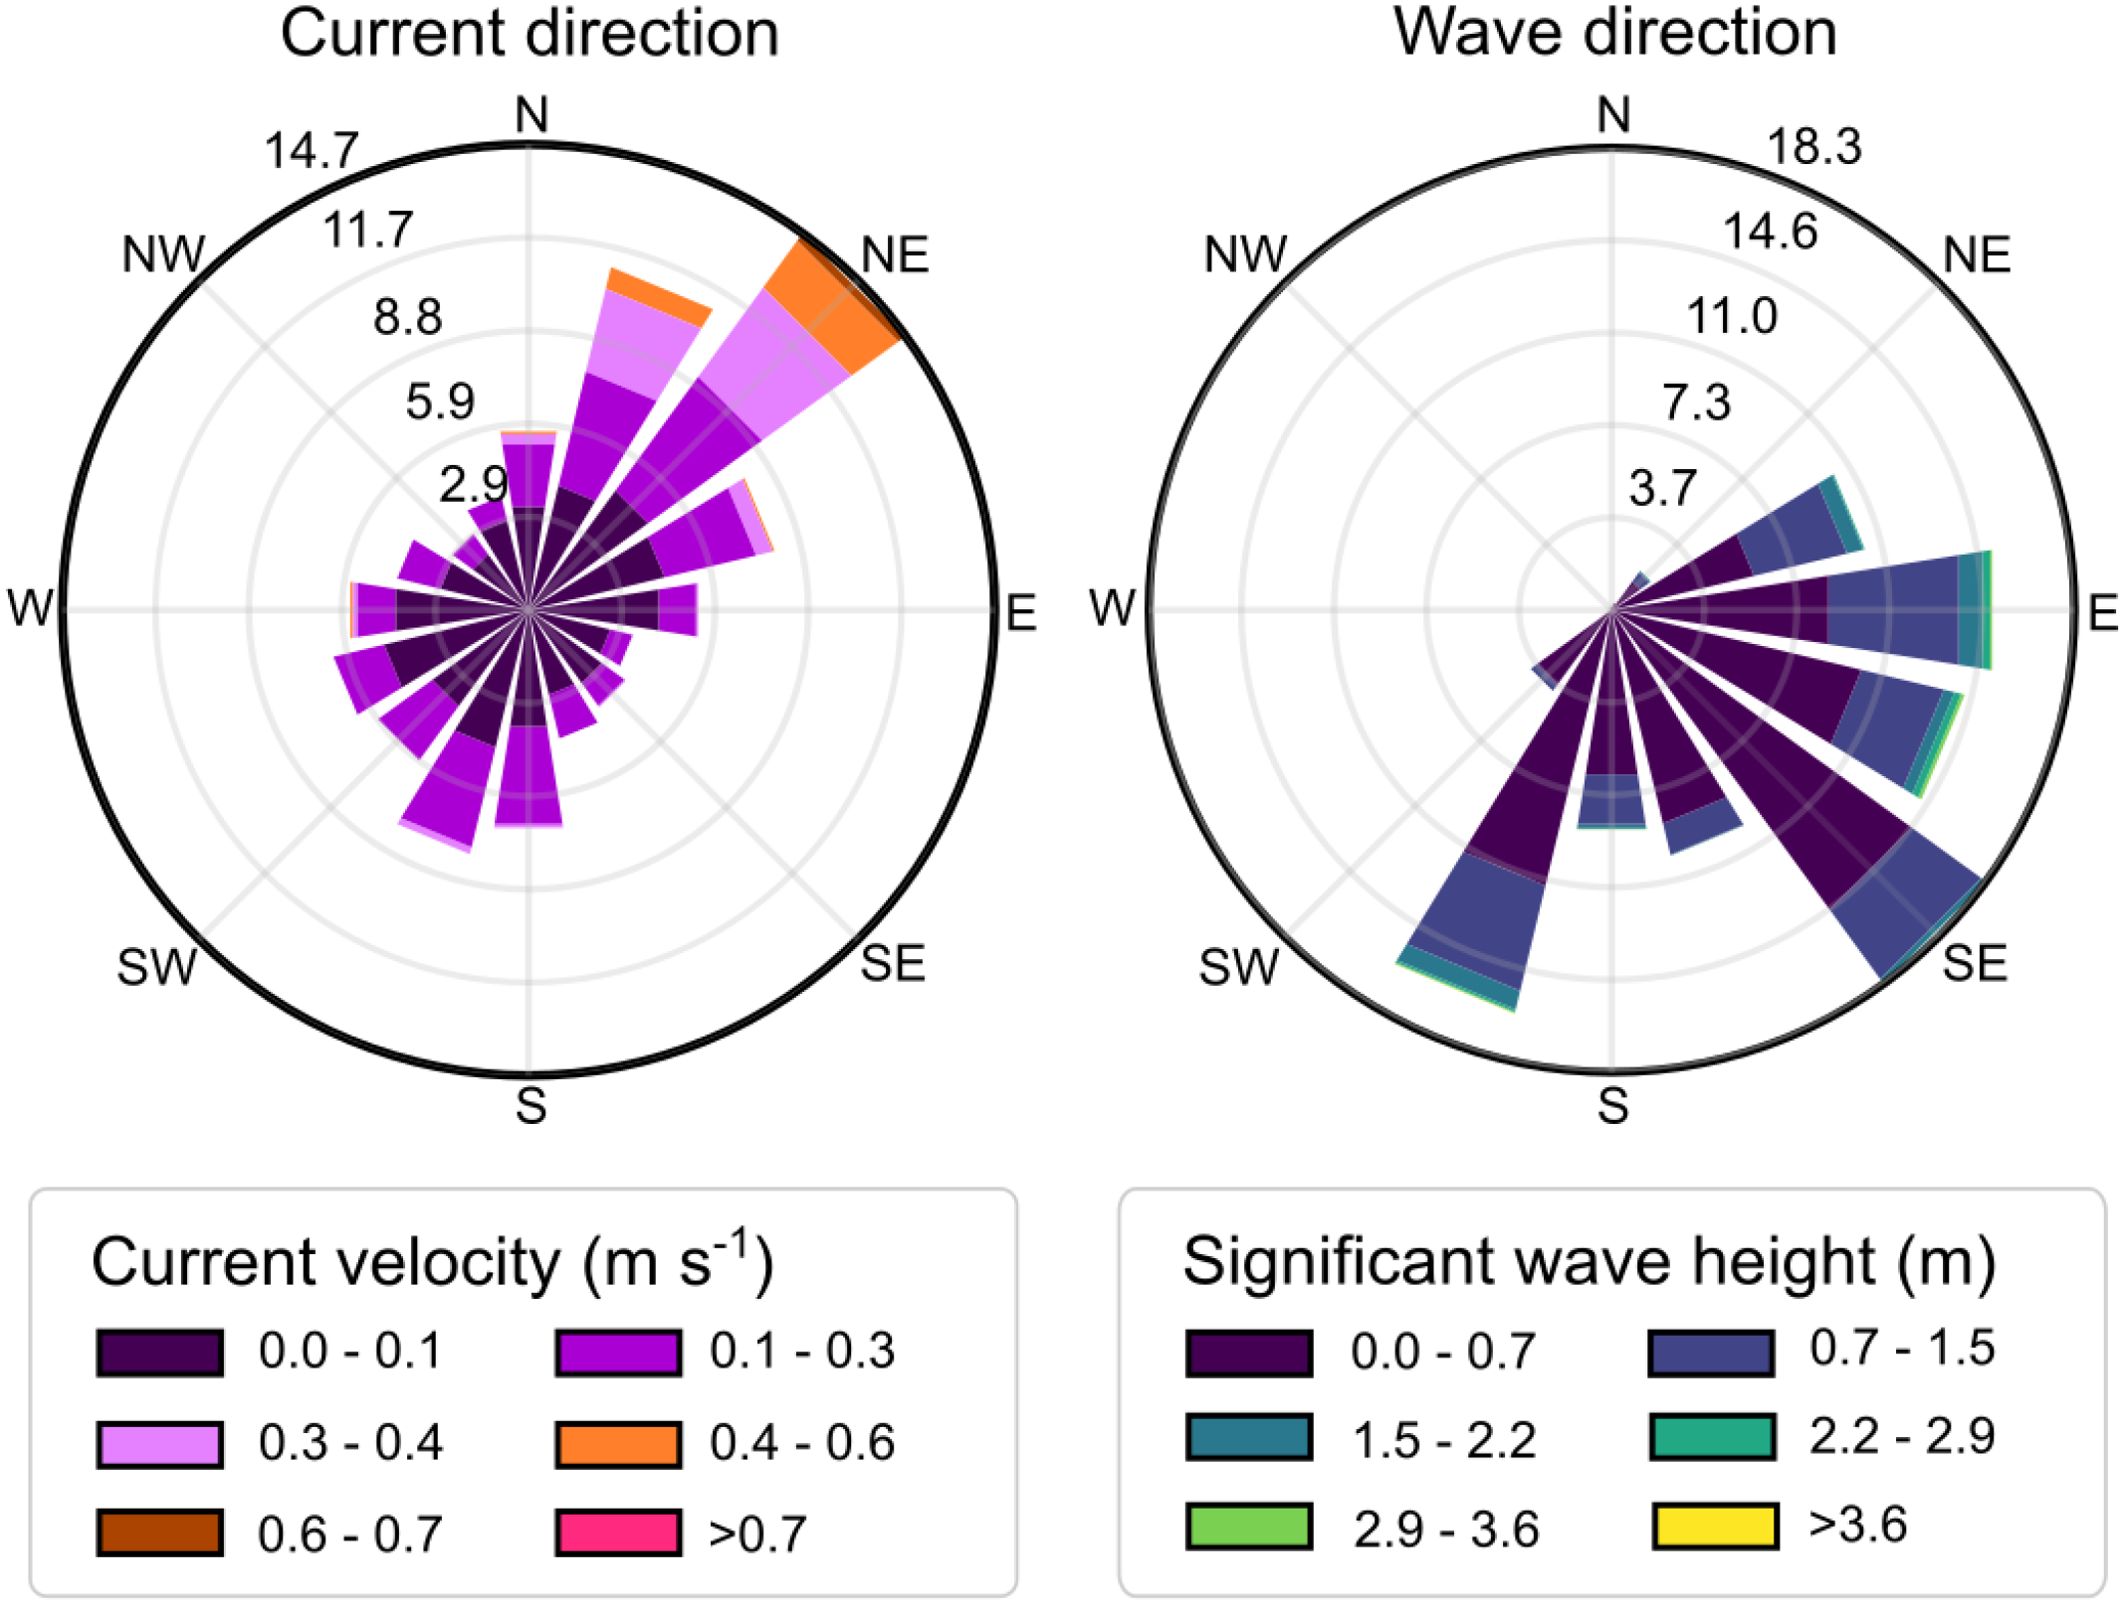
Figure 2. Current direction rose plot with current velocity for the hourly means (left), and wave direction (spectral peak) rose plot with significant wave height for the hourly means (right). Directions are from true N.
The wave direction provided in the hydrodynamic data in section 2.5 at the time of beaching of each particle (n=504,900) was converted to a relative wave direction at the zone where the particle became beached. To determine this, the clockwise coastal orientation of the zone from due N became the azimuth point from which relative directions were calculated, thus becoming relative 0°. The difference between the relative azimuth point and the wave direction from due N became the relative direction to the coastline zone. Illustrated in Figure 3 is a schematic diagram of how relative wave directions were determined. Relative clockwise directions from 0° were assigned positive values until 180°, and anticlockwise directions were assigned negative values until -180°. Relative directions were then grouped into twelve directional bins of 30° each for analysis.
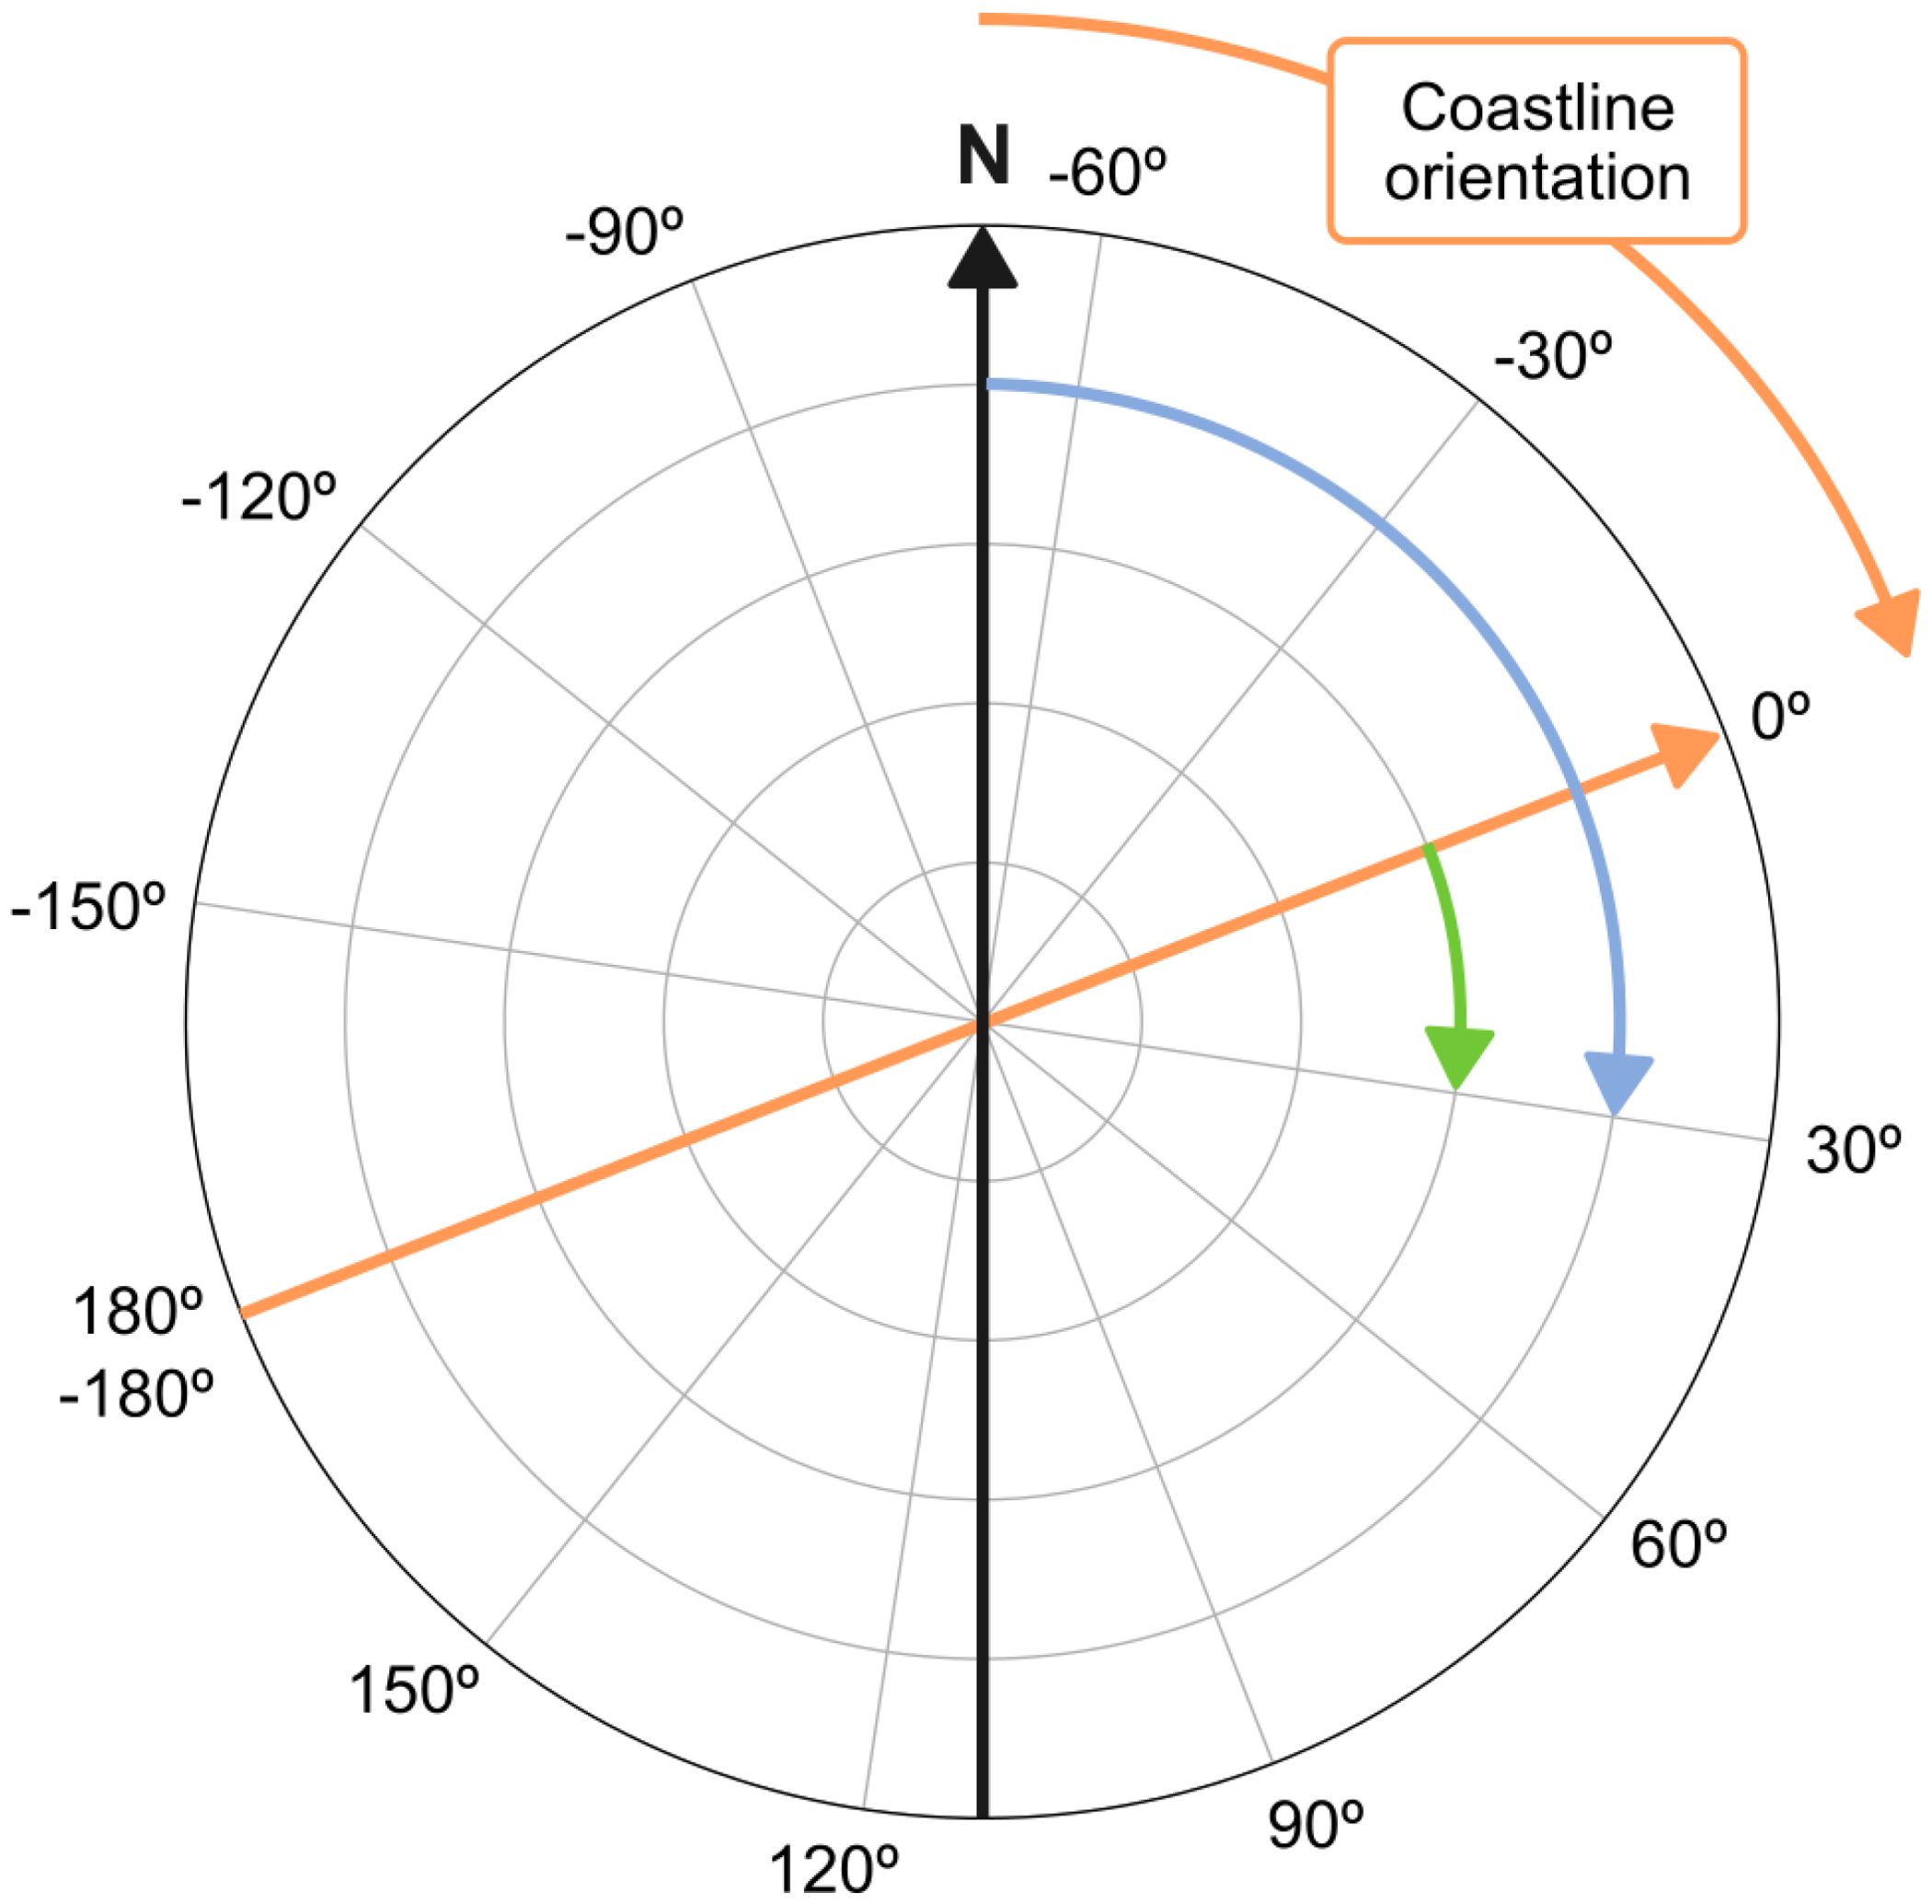
Figure 3. Schematic diagram illustrating how relative wave directions were determined. In this example, the orientation of the study domain of 68.6° (orange line) from true N (black line) is shown. A relative wave direction of 30.0° (green line) is determined using the difference between the wave direction from due N (in this example 98.6°), represented by the blue line, and the new azimuth point.
To determine whether the beaching proportion, coastline orientation, and wave directions were indeed independent of each other, Chi-square (χ2) tests were applied which assumed independence between the directional and orientation variables as the null hypothesis. The χ2 test is sensitive to the sample size, therefore to overcome this limitation a random sample of 500 beached particles was selected. Furthermore, 1000 iterations of the test were performed to obtain a representative mean value of the χ2 statistic and p-value with a significance level threshold set at 0.05.
2.7 Beach cleaning data for 2017
The impact of macrolitter originating from LR and BR on the study domain coastline during the simulation period was assessed based on the composition, size and proportions from Schirinzi et al. (2020). Beach macrolitter cleaning data were obtained from the AMB at monthly intervals throughout the year for 2017. The proportions of the different categories of debris, together with the item mass calculations were used to provide a mass budget by debris type and demarcated area. The total amounts of debris were compared with those from the beach cleaning data provided by AMB.
The zones covered in the beach cleaning data for non-organic waste included Castelldefels (Figure 1B, demarcated zone 2), Gavà (Figure 1B, demarcated zone 3), Viladecans (Figure 1B, demarcated zone 4), Prat de Llobregat (Figure 1B, demarcated zone 5), Badalona (Figure 1B, demarcated zone 14), and Montgat (Figure 1B, demarcated zone 15). These data were not categorised by debris type and only represented the total amount collected in kilograms.
Densities for the different types of plastic items were provided based on the polymer composition, calculated from the mean river discharge amounts provided Schirinzi et al. (2020). Representative item masses were then calculated using mean values for minimum and maximum dimensions or typical sizes for specific item types. Rubber items posed some ambiguity as rubber balls and tyres were listed as the most common objects in this category for the LR, thus the number of particles granted to this category was divided equally between the two types of objects for the LR only. Similarly, paper items such as packaging material and newspaper/magazines in the BR were equally divided between the two types of objects for the BR only, with the mass for newspaper/magazines based on a 20-page paper item. Debris categories, polymer types, standardised density and dimensions to calculate a representative item mass can be found in Table 1.
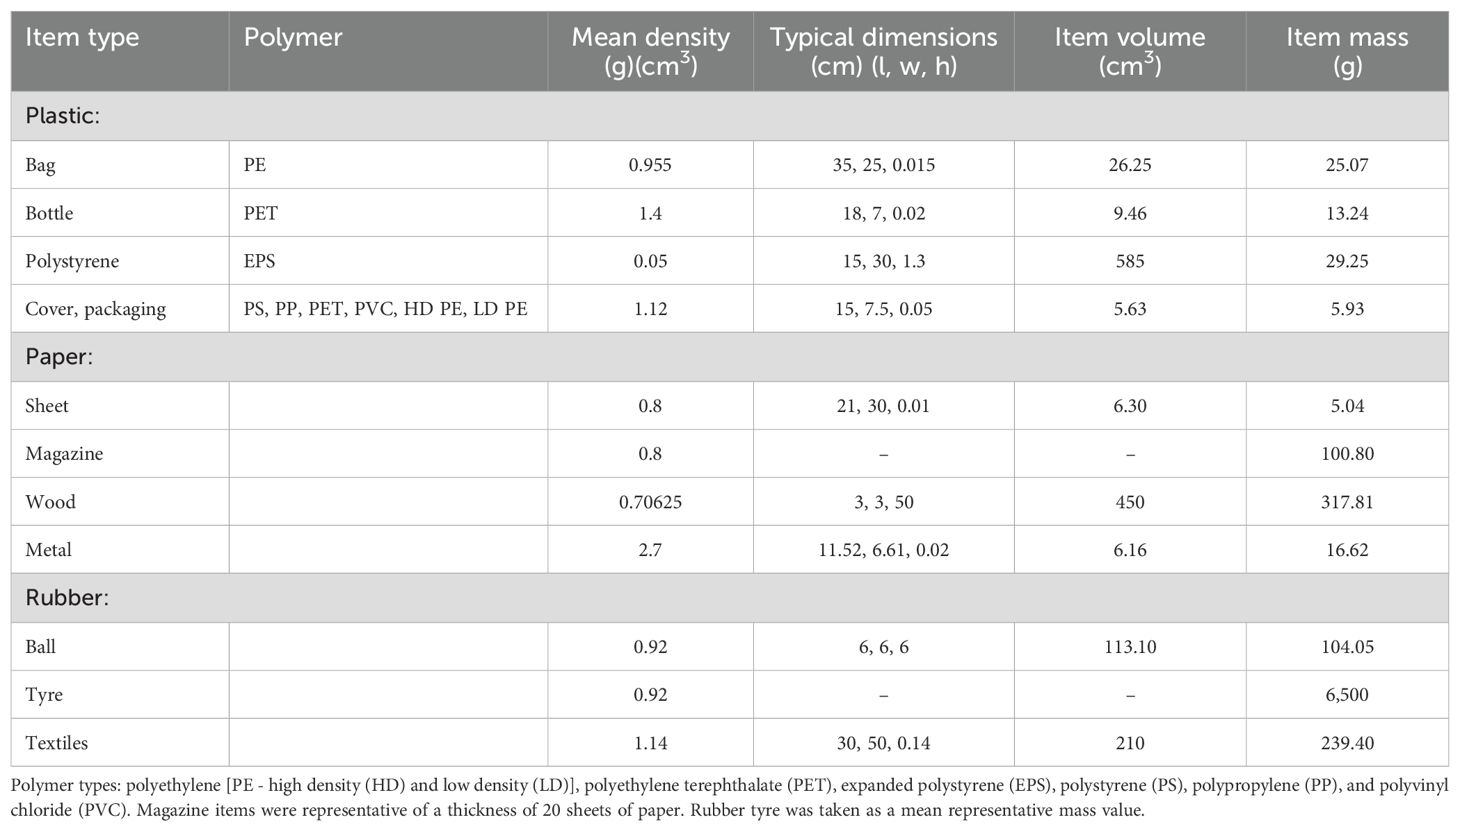
Table 1. Mean dimensions, volume, and mass for each type of plastic debris type for mass calculations to establish litter budgets from the present simulation.
3 Results
3.1 Particle end location distribution
In Figure 4 which illustrates particle release trends across the year, the number of particles released from each river over the period studied, and the number of beached and exported particles are provided. Beaching peaks occurred in mid-February, late March, and early May 2017 possibly related to environmental conditions, as mentioned in Section 3.3. During the summer months, the number of beached particles closely follows the number of released particles. Exported particles comprised 8.53% of the simulated particles, as illustrated in Table 2. The proportion of particles that left the study domain in a SW direction of all exported particles was 48.27%, and 32.23% were exported in a WSW direction, suggesting a conditioning of the direction of where particles leave the domain by the current direction, which is predominantly from the NE as seen in Figure 2. Three particle exporting peaks were seen during April 2017 as illustrated in Figure 4.
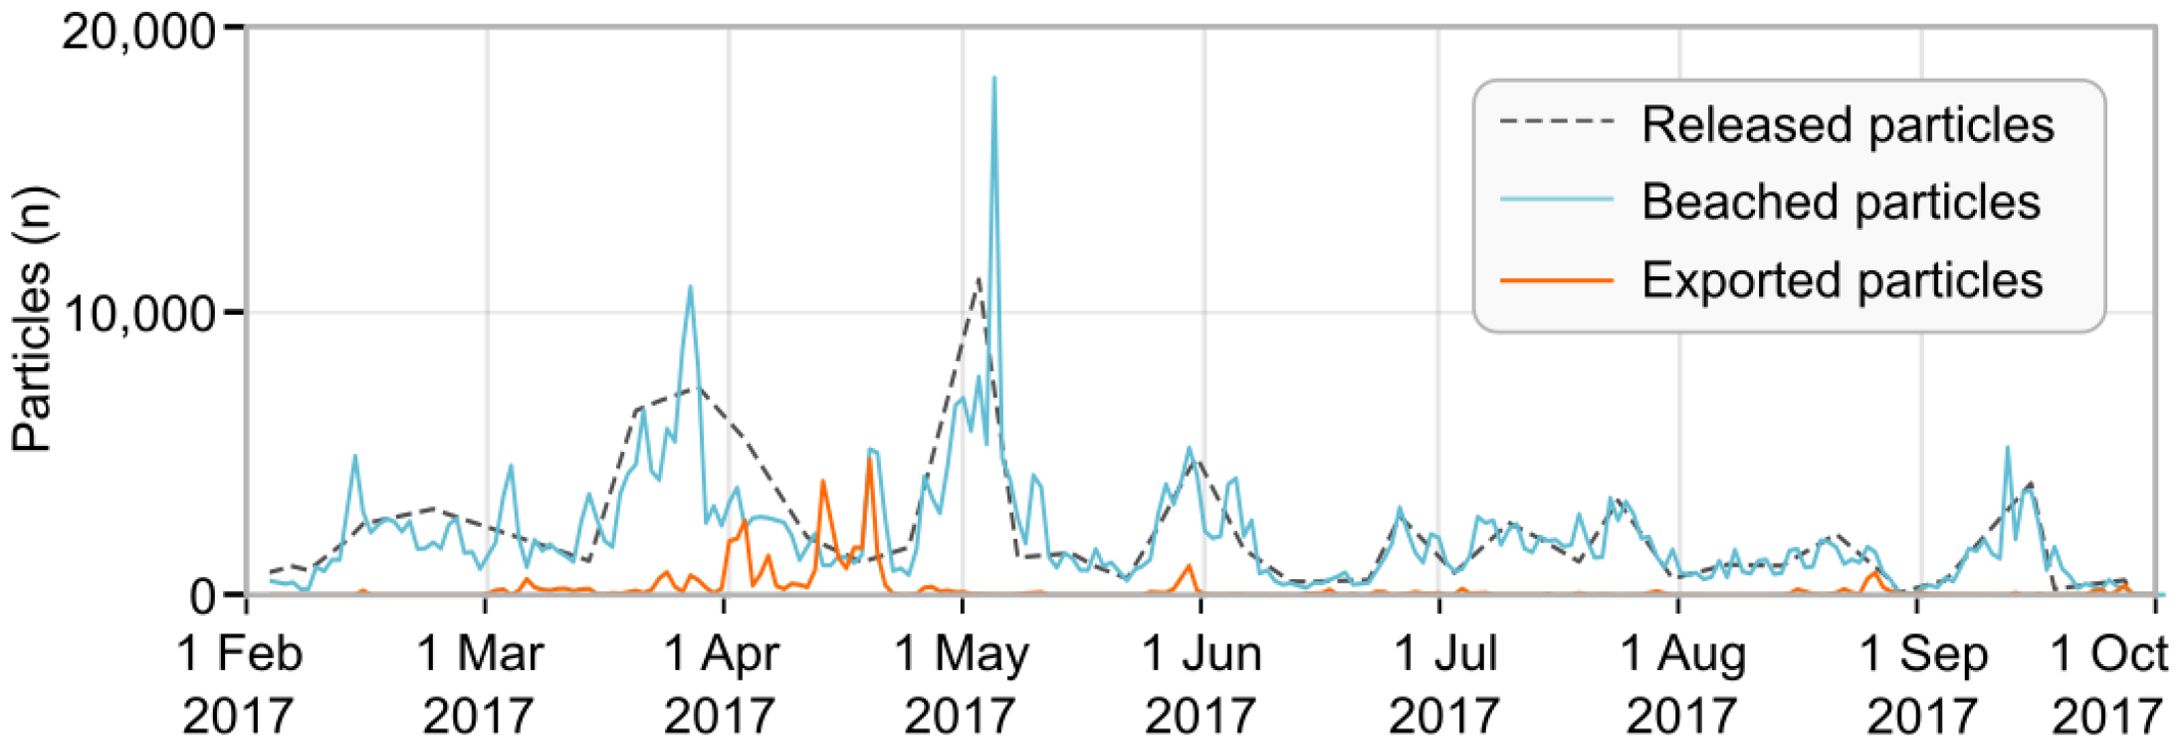
Figure 4. Total number of particles released from LR and BR, beached particles and exported particles for the total study domain.
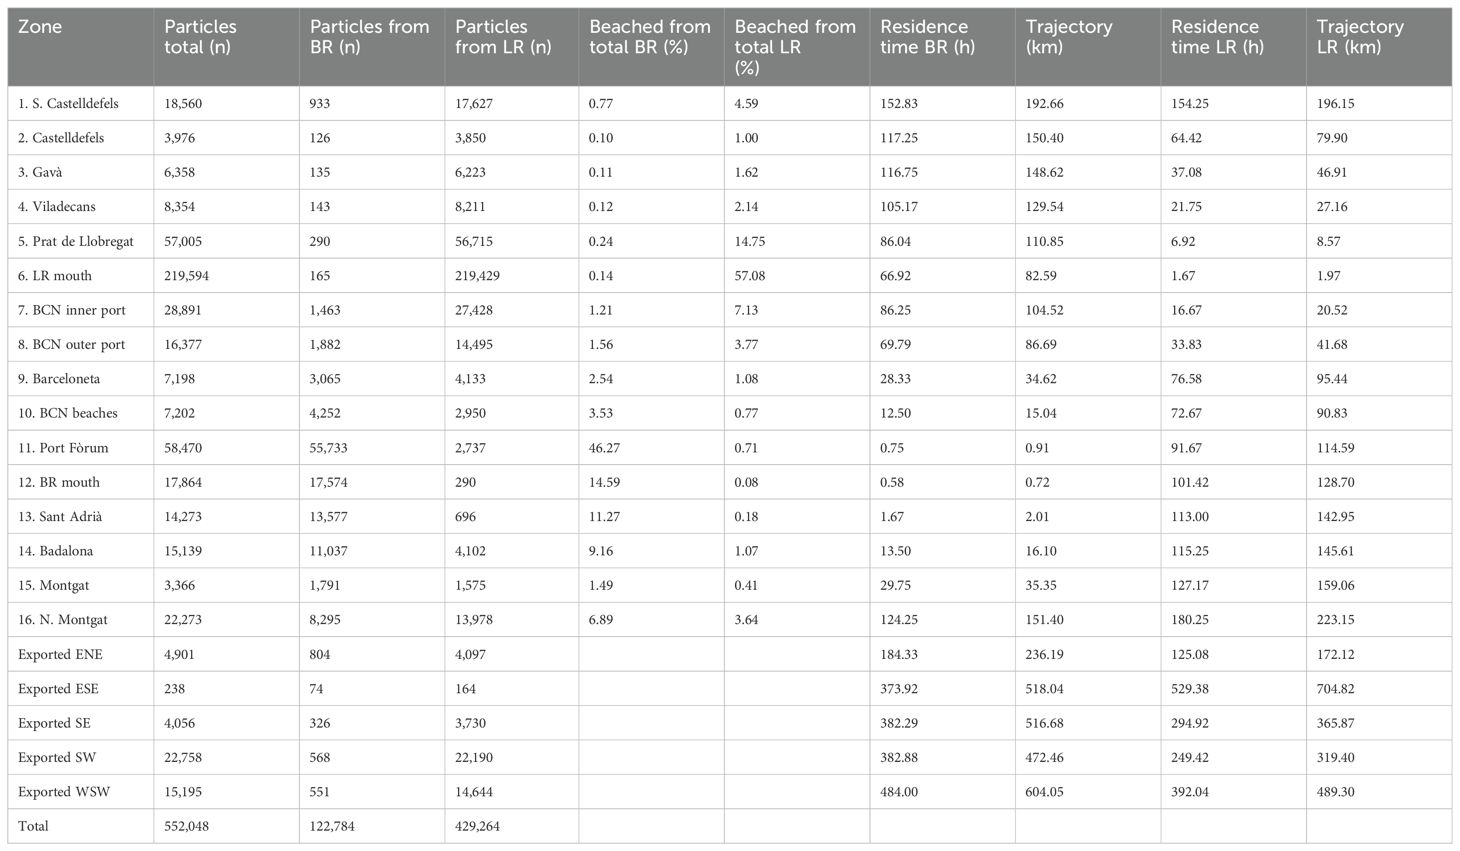
Table 2. Beached and exported particle statistics by demarcated zone, median residence time and median trajectory distance.
Full details of the amounts of beached and exported particles found in each demarcated zone by origin from each river are provided in Table 2, including residence times and trajectory distances. Beached and exported amounts are also depicted in Figure 5 which includes the percentage of the total particles in each zone. A decreasing trend was found in the number of beached particles with the distance from the particle release point. This pattern was particularly prominent for particles released from the LR and zones located south of the LR release point, extending approximately 18.11 km to the south. For the BR, despite most particles moving to the south, such a trend was disrupted by the port structure although the decreasing trend can be found to the north, extending to zones 11.38 km from the release point. The areas S. Casteldefells (Figure 1B, demarcated zone 1) and N. Montgat (Figure 1B, demarcated zone 16) go against the trend due to the high amount of coastline these two areas cover. The LR mouth received the highest number of particles, accounting for 39.78% of total particles. Prat de Llobregat to the south of LR, ranked second in terms of the number of beached particles from the LR release point, constituting 10.33% of the total. This was comparable to the Port Fòrum (Figure 1B, demarcated zone 11) which received the highest number of particles released from the BR release point. The two adjacent areas to the north of the BR, namely Sant Adrià (Figure 1B, demarcated zone 13) and Badalona, received a similar number of beached particles as the BR mouth, indicating a relatively even distribution of particles originating from the BR, contrasting with the distribution of particles around the LR mouth originating from the LR. Despite a predominant southwestward movement of particles from the BR, some particle deposition would still be expected to the north as seen in Badalona and St. Adrià due to >30% frequency in south-to-west current directions transporting particles north of the BR and >15% frequency in wave directions from the SSW as illustrated in the rose plots in Figure 2. Particles from the BR exhibited a more even distribution among the four zones to the north and south as seen in the pie charts per demarcated zone. Furthermore, particles from the LR were more prevalent along 92.48% of the coastline than those originating from the BR, which could be due to 3.5 times more particles being released from the LR and the limited extent of influence of particles released from the BR as seen from the lower distance of decreasing deposition trend to the north mentioned above. Particles from the LR that move northwards would have to initially move further offshore to circumvent the port structure, which combined with a larger number of particles released could explain the higher amount of particles deposited in the area N. Montgat covering the largest stretch of coastline. Residence times, shown in Table 2, increased with the distance from a particle release point, exhibiting a comparable pattern to beached particles. Inside of the port area, however, BR particles had a greater median residence time (>86 h) indicating greater retention by the semi-enclosed port area as particles move in a southward and westward direction.
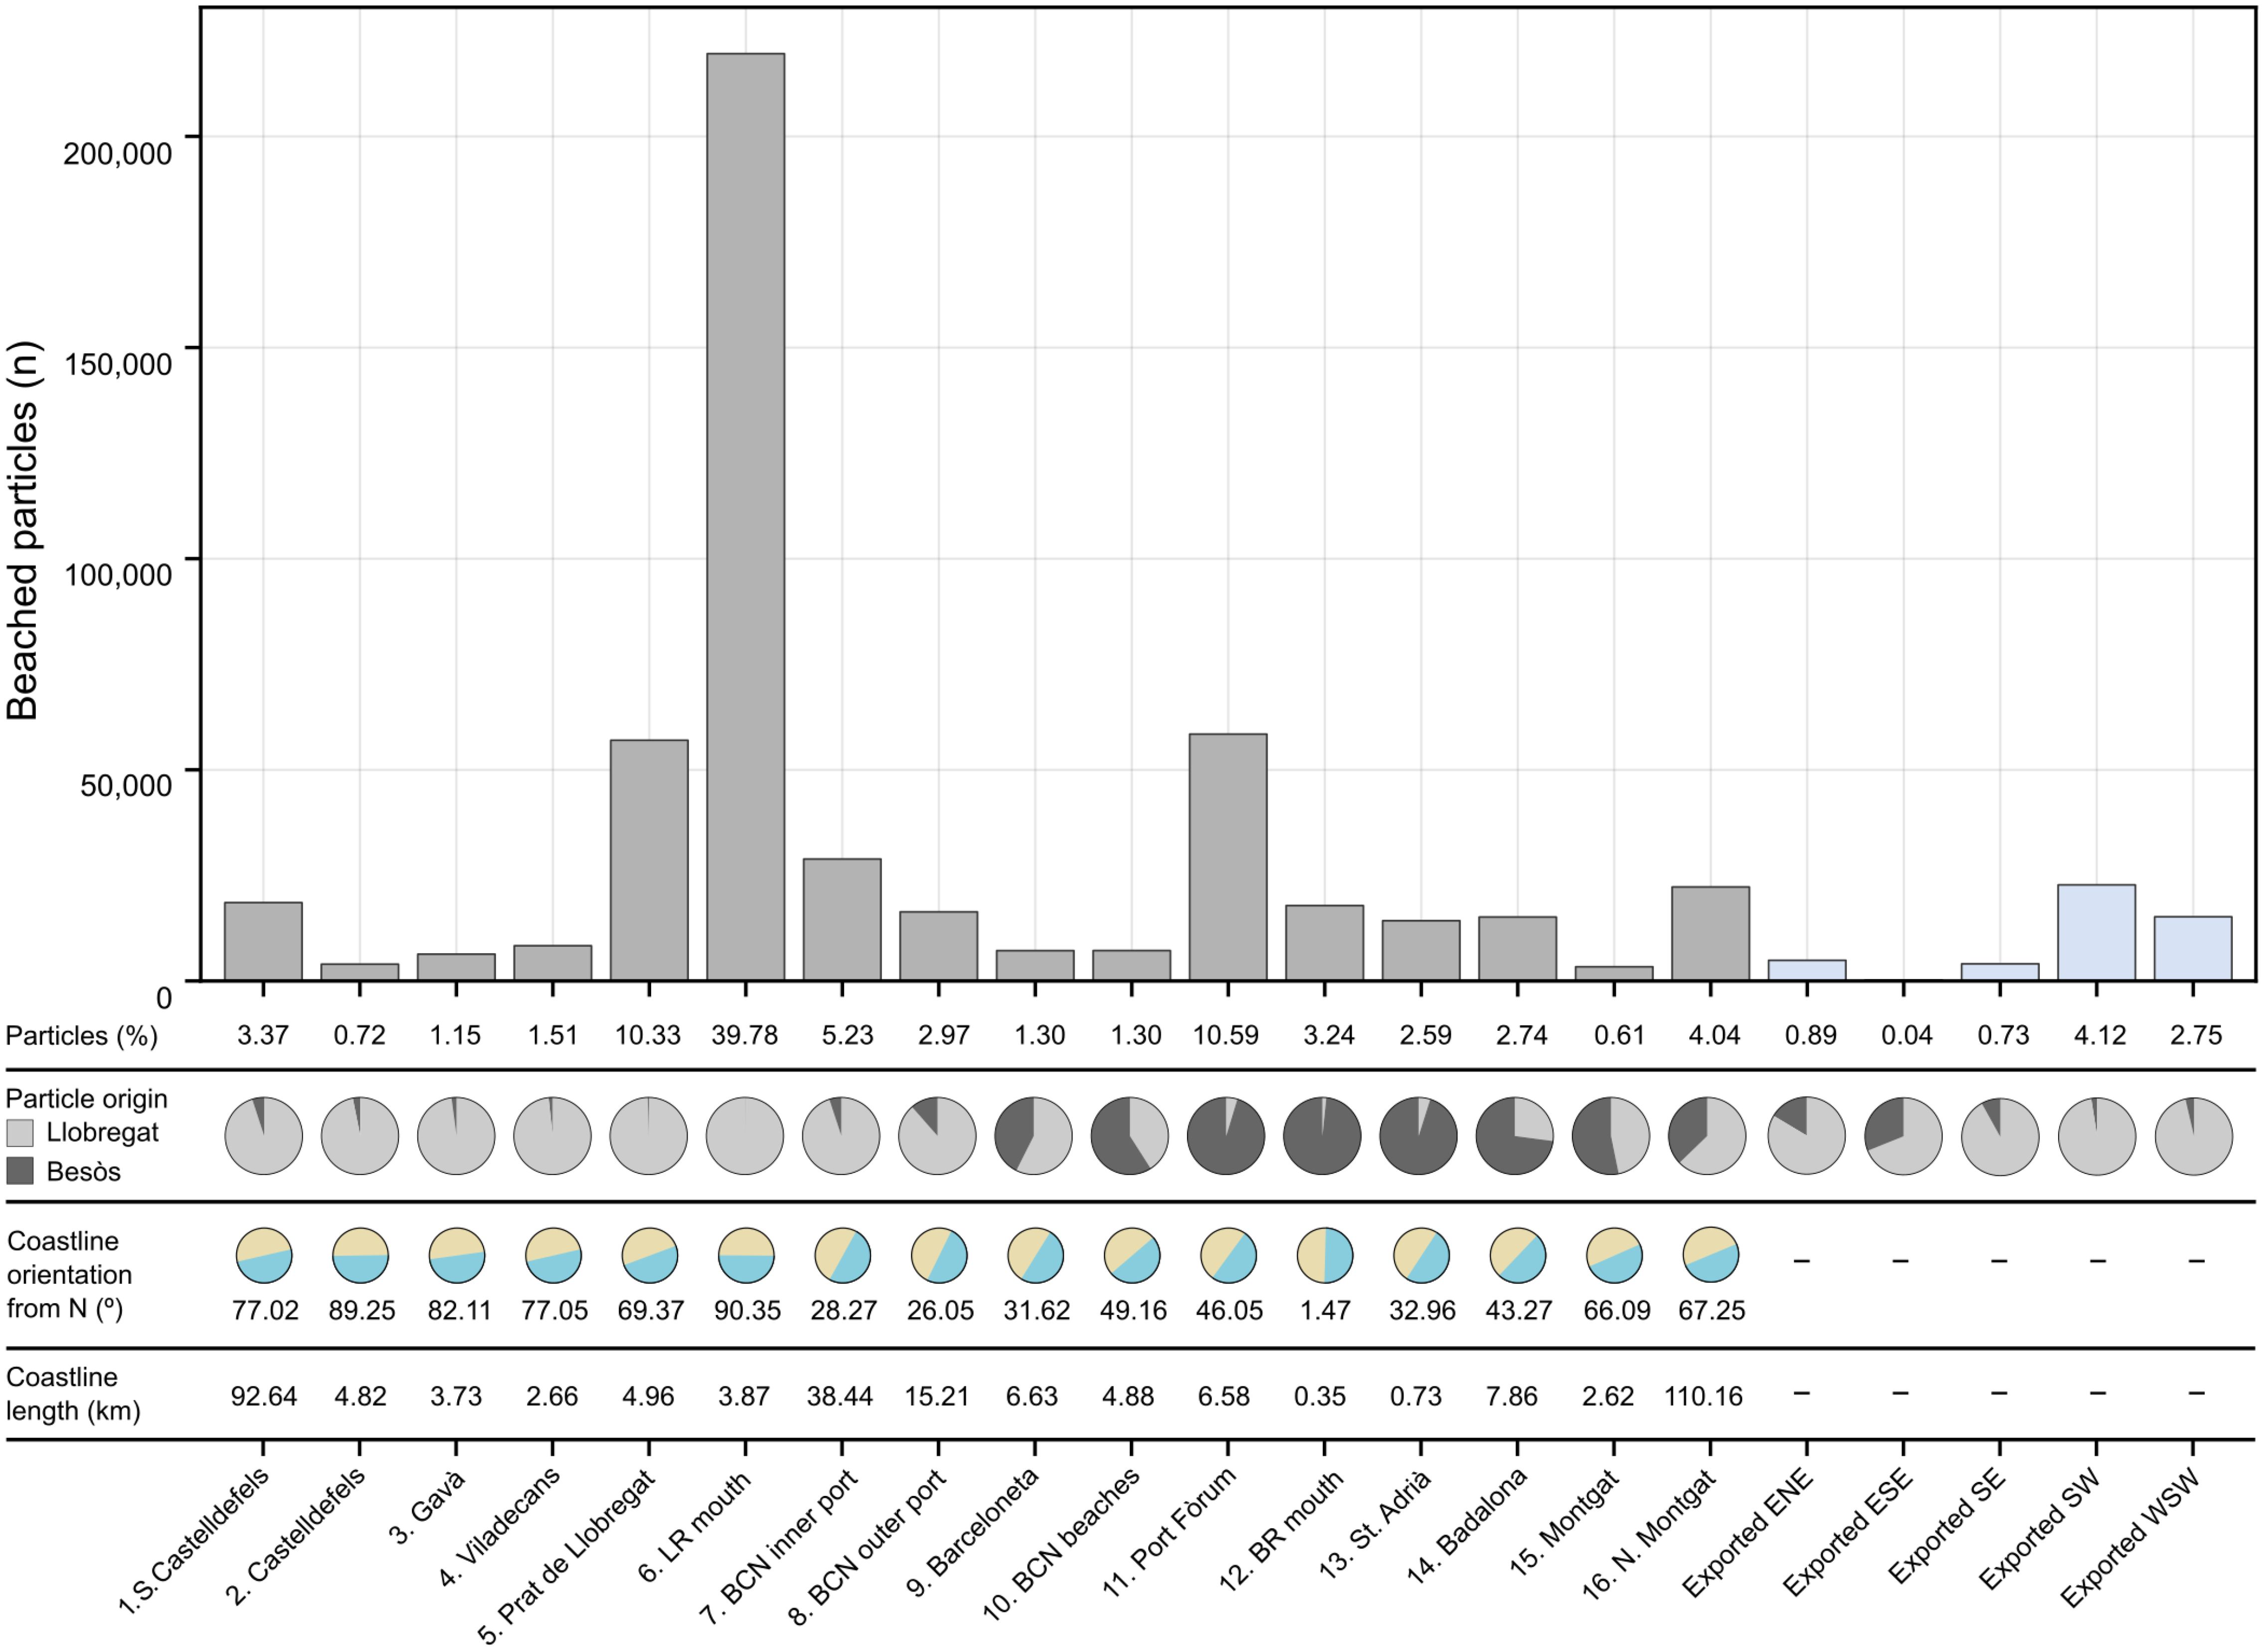
Figure 5. Number of particles beached in each of the demarcated zones on the coastline and exported in each of the zones at the perimeter of the study domain. The proportion of beached particles originating from each release point is represented in the pie charts under the bar chart values for each zone, calculated from a particle origin variable in the simulation. Coastline orientation and length are also provided for reference. Further statistics can be found in Table 2.
3.2 Beaching likelihood
Beaching likelihood values are represented on a map across the demarcated zones from each release point in Figure 6. These are further detailed in Table 3 where the coastline proportions per demarcated zone and beached proportions can be found for the BL calculations. For clarification, only the standardised BL values are discussed hereon. As illustrated in Figure 6A positive BL values were found at the BR mouth and adjacent areas (Port Fòrum and St. Adrià). Despite Port Fòrum receiving over four times the number of particles from the BR release point, the coastline length was over 9 times smaller for St. Adrià contributing to a higher BL value. In Figure 6B, the LR mouth displayed the highest BL value, with Prat de Llobregat showing a slight predisposition to receive particles from the LR. The coastline length of the LR mouth is 11 times higher (Figure 5) than that of the BR mouth, suggesting that the propensity for retention and accumulation of particles by the LR mouth is much higher than the BR mouth and that other factors aside from proximity to the source (which is common to both areas) such as the geometrical setting and shielding of currents by the port structure could be responsible.
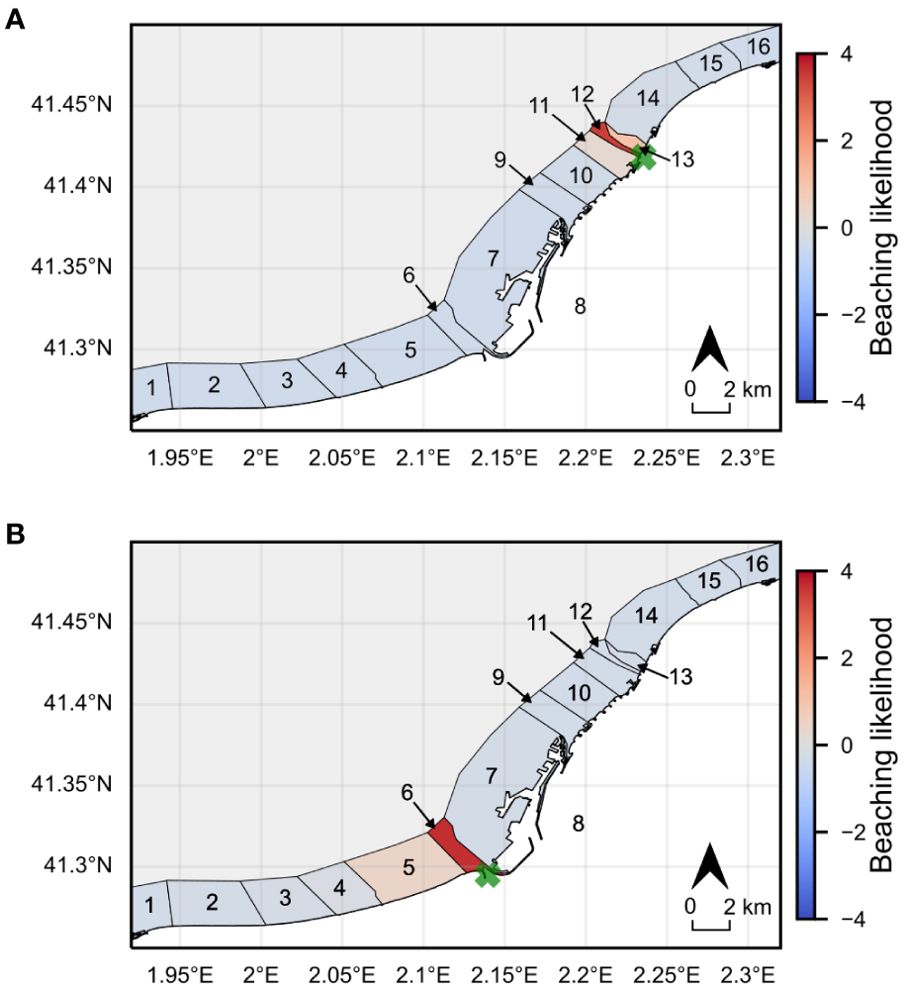
Figure 6. Beaching likelihood (BL) for each demarcated zone. For particles released from the BR (A) positive values were registered for demarcated zone 11 (Port Fòrum) BL=0.24, demarcated zone 12 (BR mouth) BL=3.48, and demarcated zone 13 (Sant Adrià) BL=1.03. For particles released from the LR (B) positive values were registered for demarcated zone 5 (Prat de Llobregat) BL=0.46 and demarcated zone 6 (LR mouth) BL=3.68. Release points in each plot are shown as a green cross. Demarcated zones are numbered as per Figure 1. Full details can be seen in Table 3.
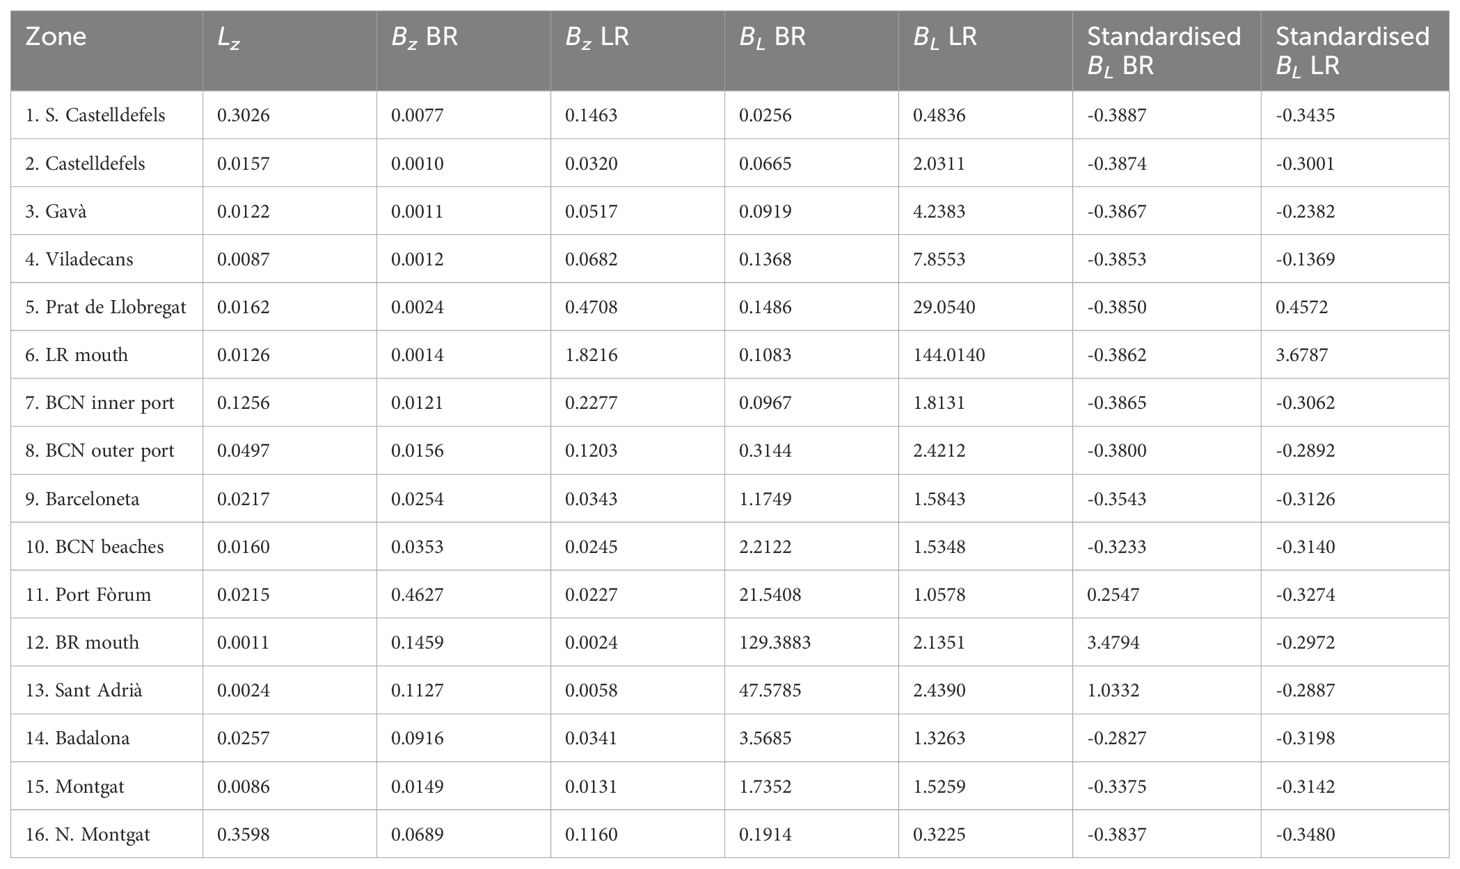
Table 3. Coastline proportion (Lz), beached particle proportion Bz, and beaching likelihood BL values for demarcated zones, including final standardised values for BL comparison.
3.3 Beaching proportion and hydrodynamic variables
Time-series data for the beached proportion for the entire coastline, significant wave height and the current velocity module are depicted in Figure 7 with the corresponding log-transformed data. Considerable variability was found for the beaching proportion. A prominent peak in June could be due to climatological conditions leading to a greater particle release as seen in Figure 4 and a small peak in current velocity as observed in Figure 7. Larger peaks in February and April can be linked to higher significant wave heights possibly due to stormy conditions. Throughout the summer months, the proportion of daily beaching was generally higher than in previous months, which can be attributed to similar numbers of beached and released particles in absolute terms throughout this period. A gradual decrease in the daily beaching proportion was apparent from September, where a reduction in particles released and increased drifting in the system could be responsible. This pattern can also be seen qualitatively for the significant wave height time series data where there were numerous alignments of peaks with the proportion of beaching, and the peaks in the number of beached particles seen in Figure 4 demonstrating a relationship between particle beaching and wave-related environmental conditions. However, no discernible patterns could be qualitatively observed for current velocity. A time series Pearson correlation (r) was conducted for beached particles along the entire coastline revealing a weak positive value for significant wave height of r=0.36, indicating more energetic conditions due to higher wave heights mildly influencing the deposition of particles in a positive manner. No substantial correlation was found for current velocity (r=-0.10). There was no correlation for exported particles for either hydrodynamic variable (r=0.08 for significant wave height, and r=0.12 for current velocity). The time series regression for the total coastline in Table 4 showed that significant wave height displays the highest positive influence of the hydrodynamic variables on the beaching proportion (coefficient=0.939). Although all R2 values were low, only the significant wave height had values that could be taken as having any influence, albeit weak, over the beaching proportion possibly due to more energetic conditions required for higher material transport, supporting the time-series Pearson’s correlation test results.
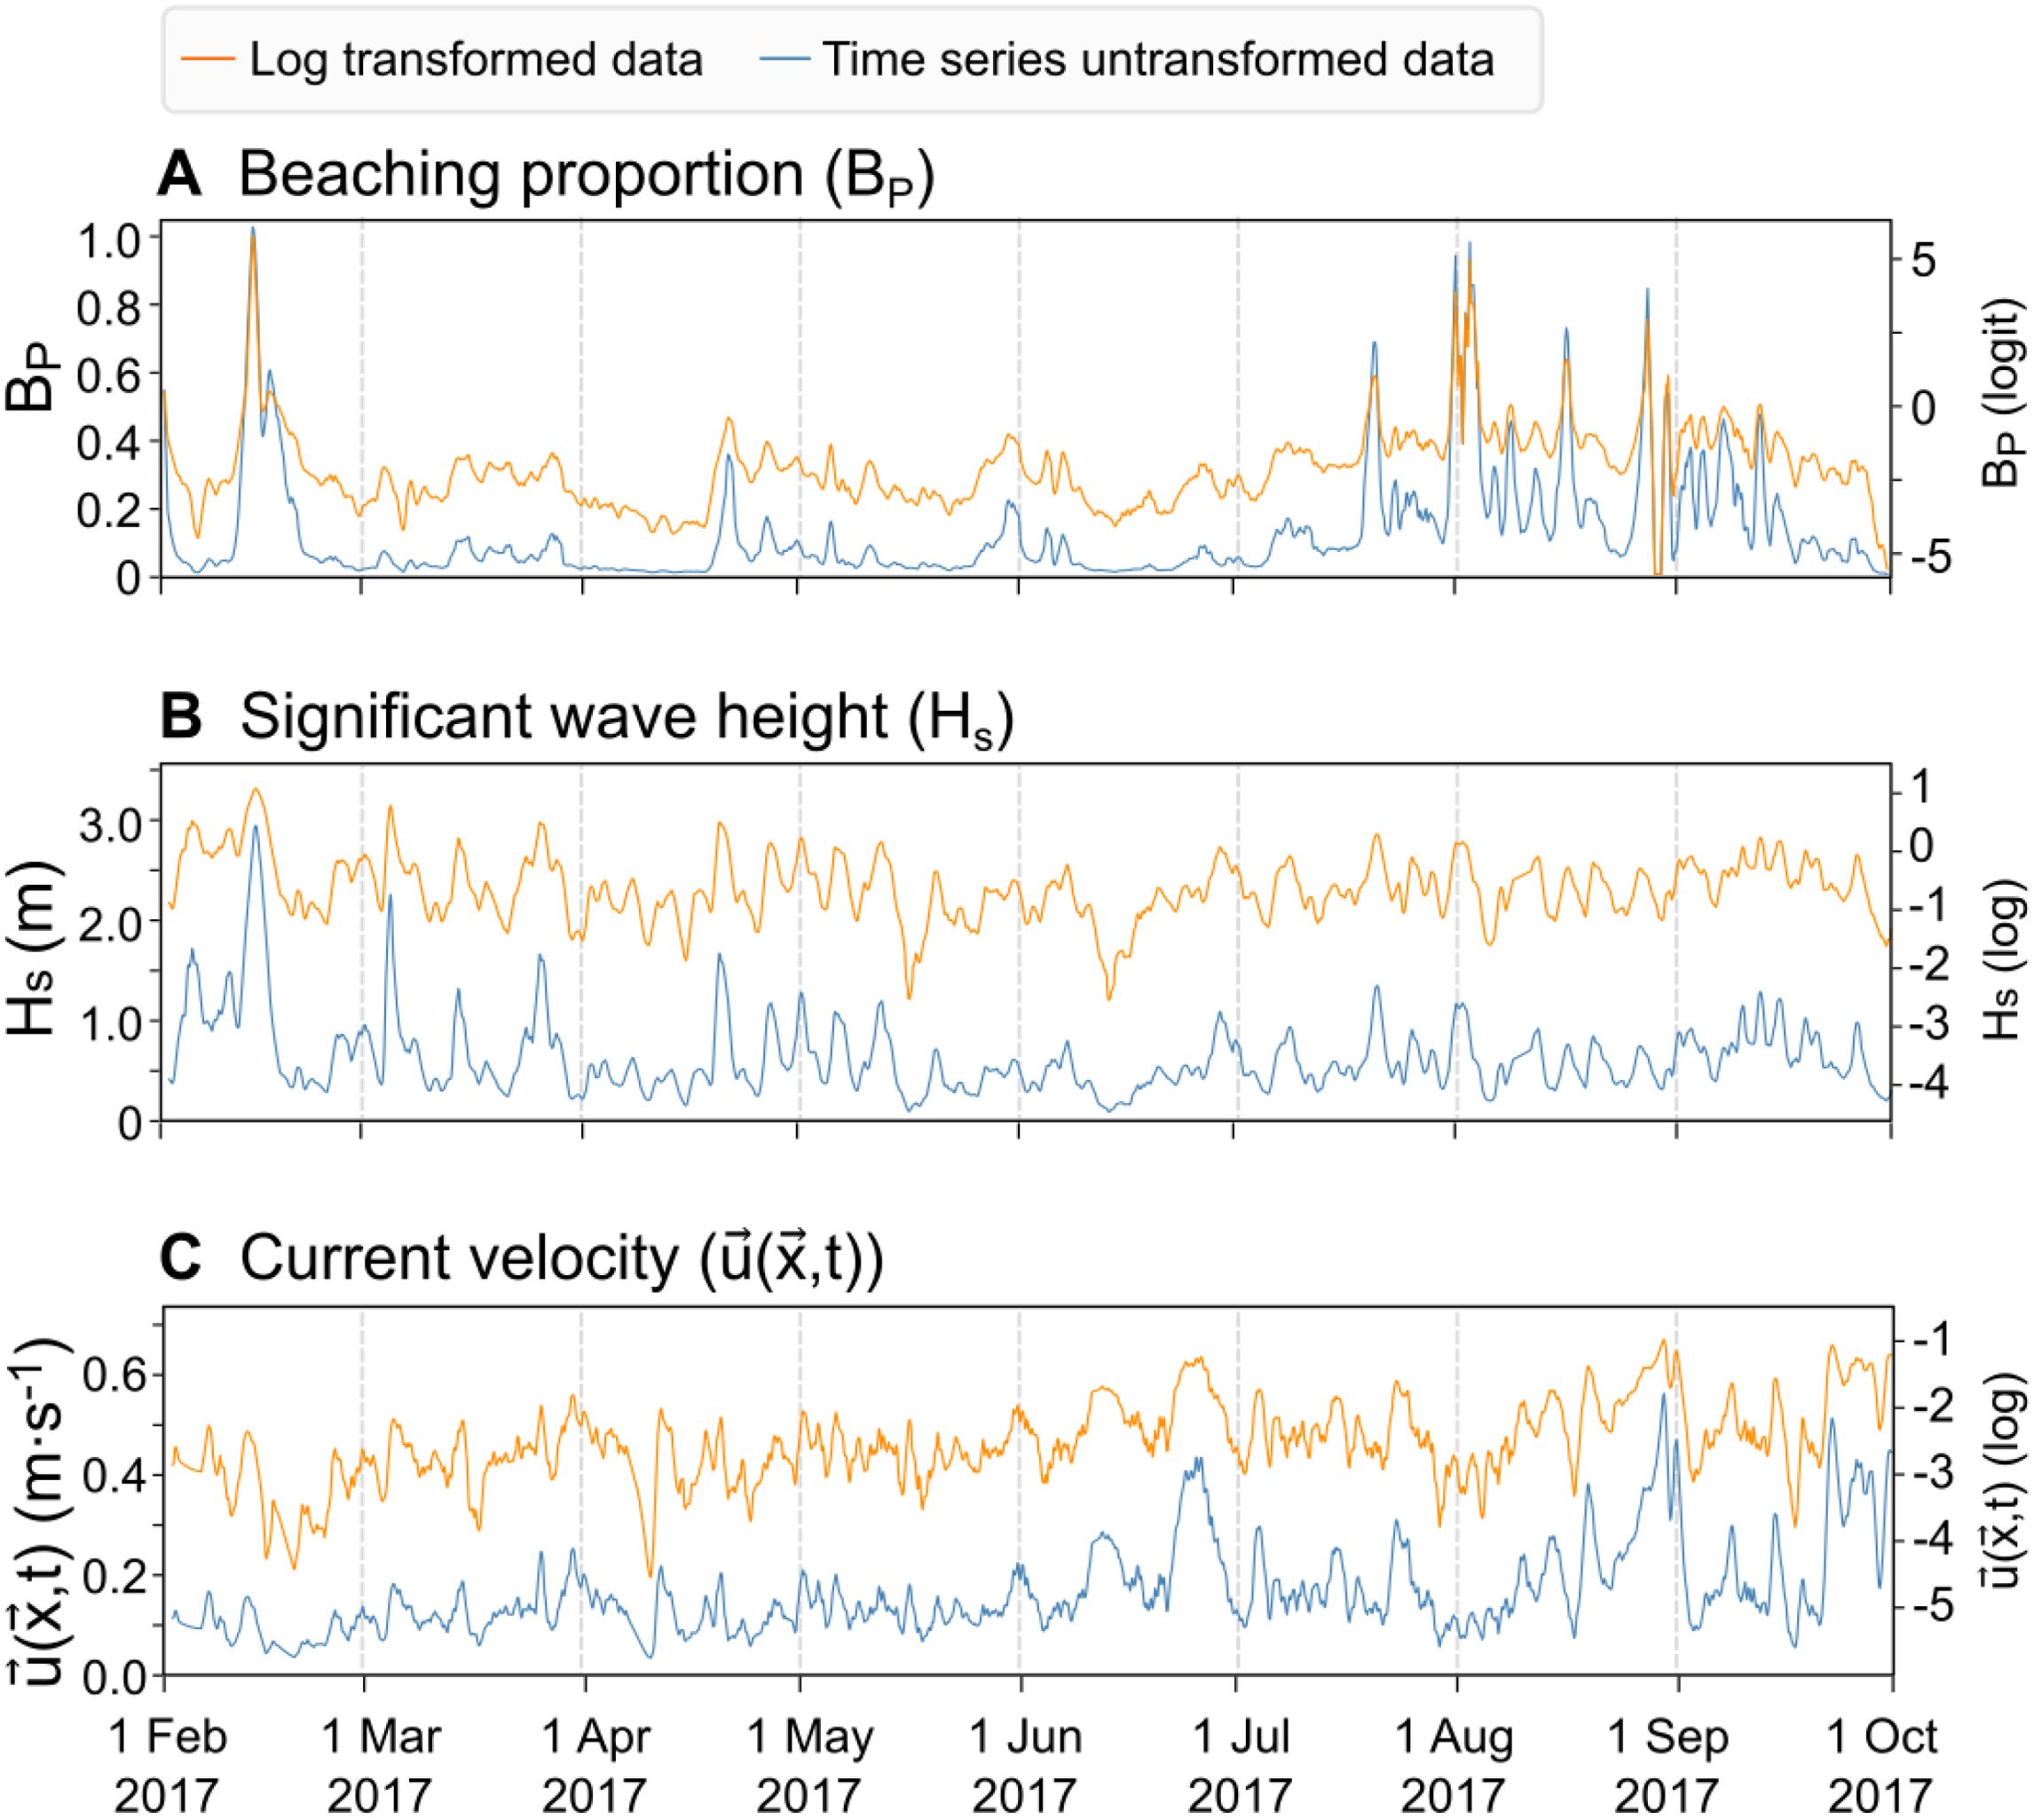
Figure 7. Time series data for (A) the beached particle proportion, (B) significant wave height, (C) current velocity, discretised to 3-hourly interval means for the simulation period, shown in blue lines. Log transformation data for the hydrodynamic data, and a logit transformation for the BP data are shown in orange.
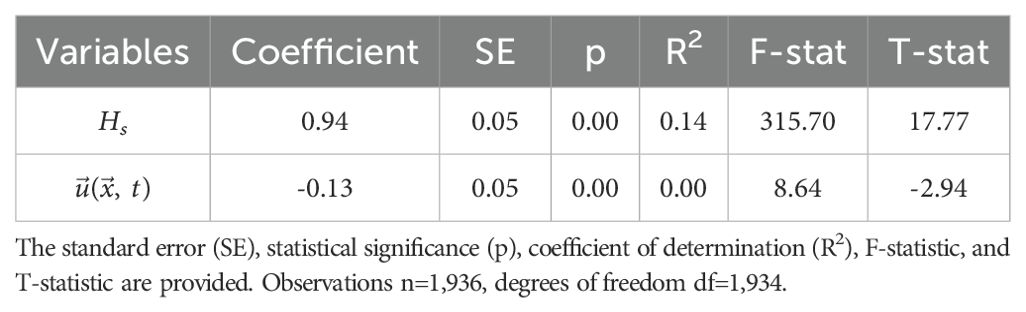
Table 4. Time series regression for the hydrodynamic variables (Hs significant wave height, and current velocity module) and the beaching proportion for the 3-hourly means.
3.4 Coastal orientation
Only the wave direction was tested for associations with the coastal orientation since a statistical relationship between particle beaching and current hydrodynamic variables was not found. The χ2 test results revealed a clear dependence between the coastal orientation, wave direction and particle beaching. The χ2 value was statistically significant at 20.50 ± 3.07 (p=0.02 ± 0.02 with 42.20% of tests showing statistical significance), higher than the critical value of 16.92% with 9 degrees of freedom.
The number of beached particles per relative wave directional bin is depicted in Figure 8, with most of the beached particles becoming beached at relative directions between 0° and 120° and the highest frequency in numbers was found for oblique directions (30° and 60° bins). The heatmap in Figure 9 illustrates the proportion of beached particles for each relative wave directional bin for each demarcated zone. Coastline orientations <50° show a greater proportion of beached particles between the 30° and 90° relative directional bins. For coastline orientations >70° there was a clear increase in beaching between the -30° relative directional bin (negative relative values to the new azimuth point are illustrated in Figure 3) corresponding to northeasterly wave directions, and 60° corresponding to southeasterly directions for those areas.
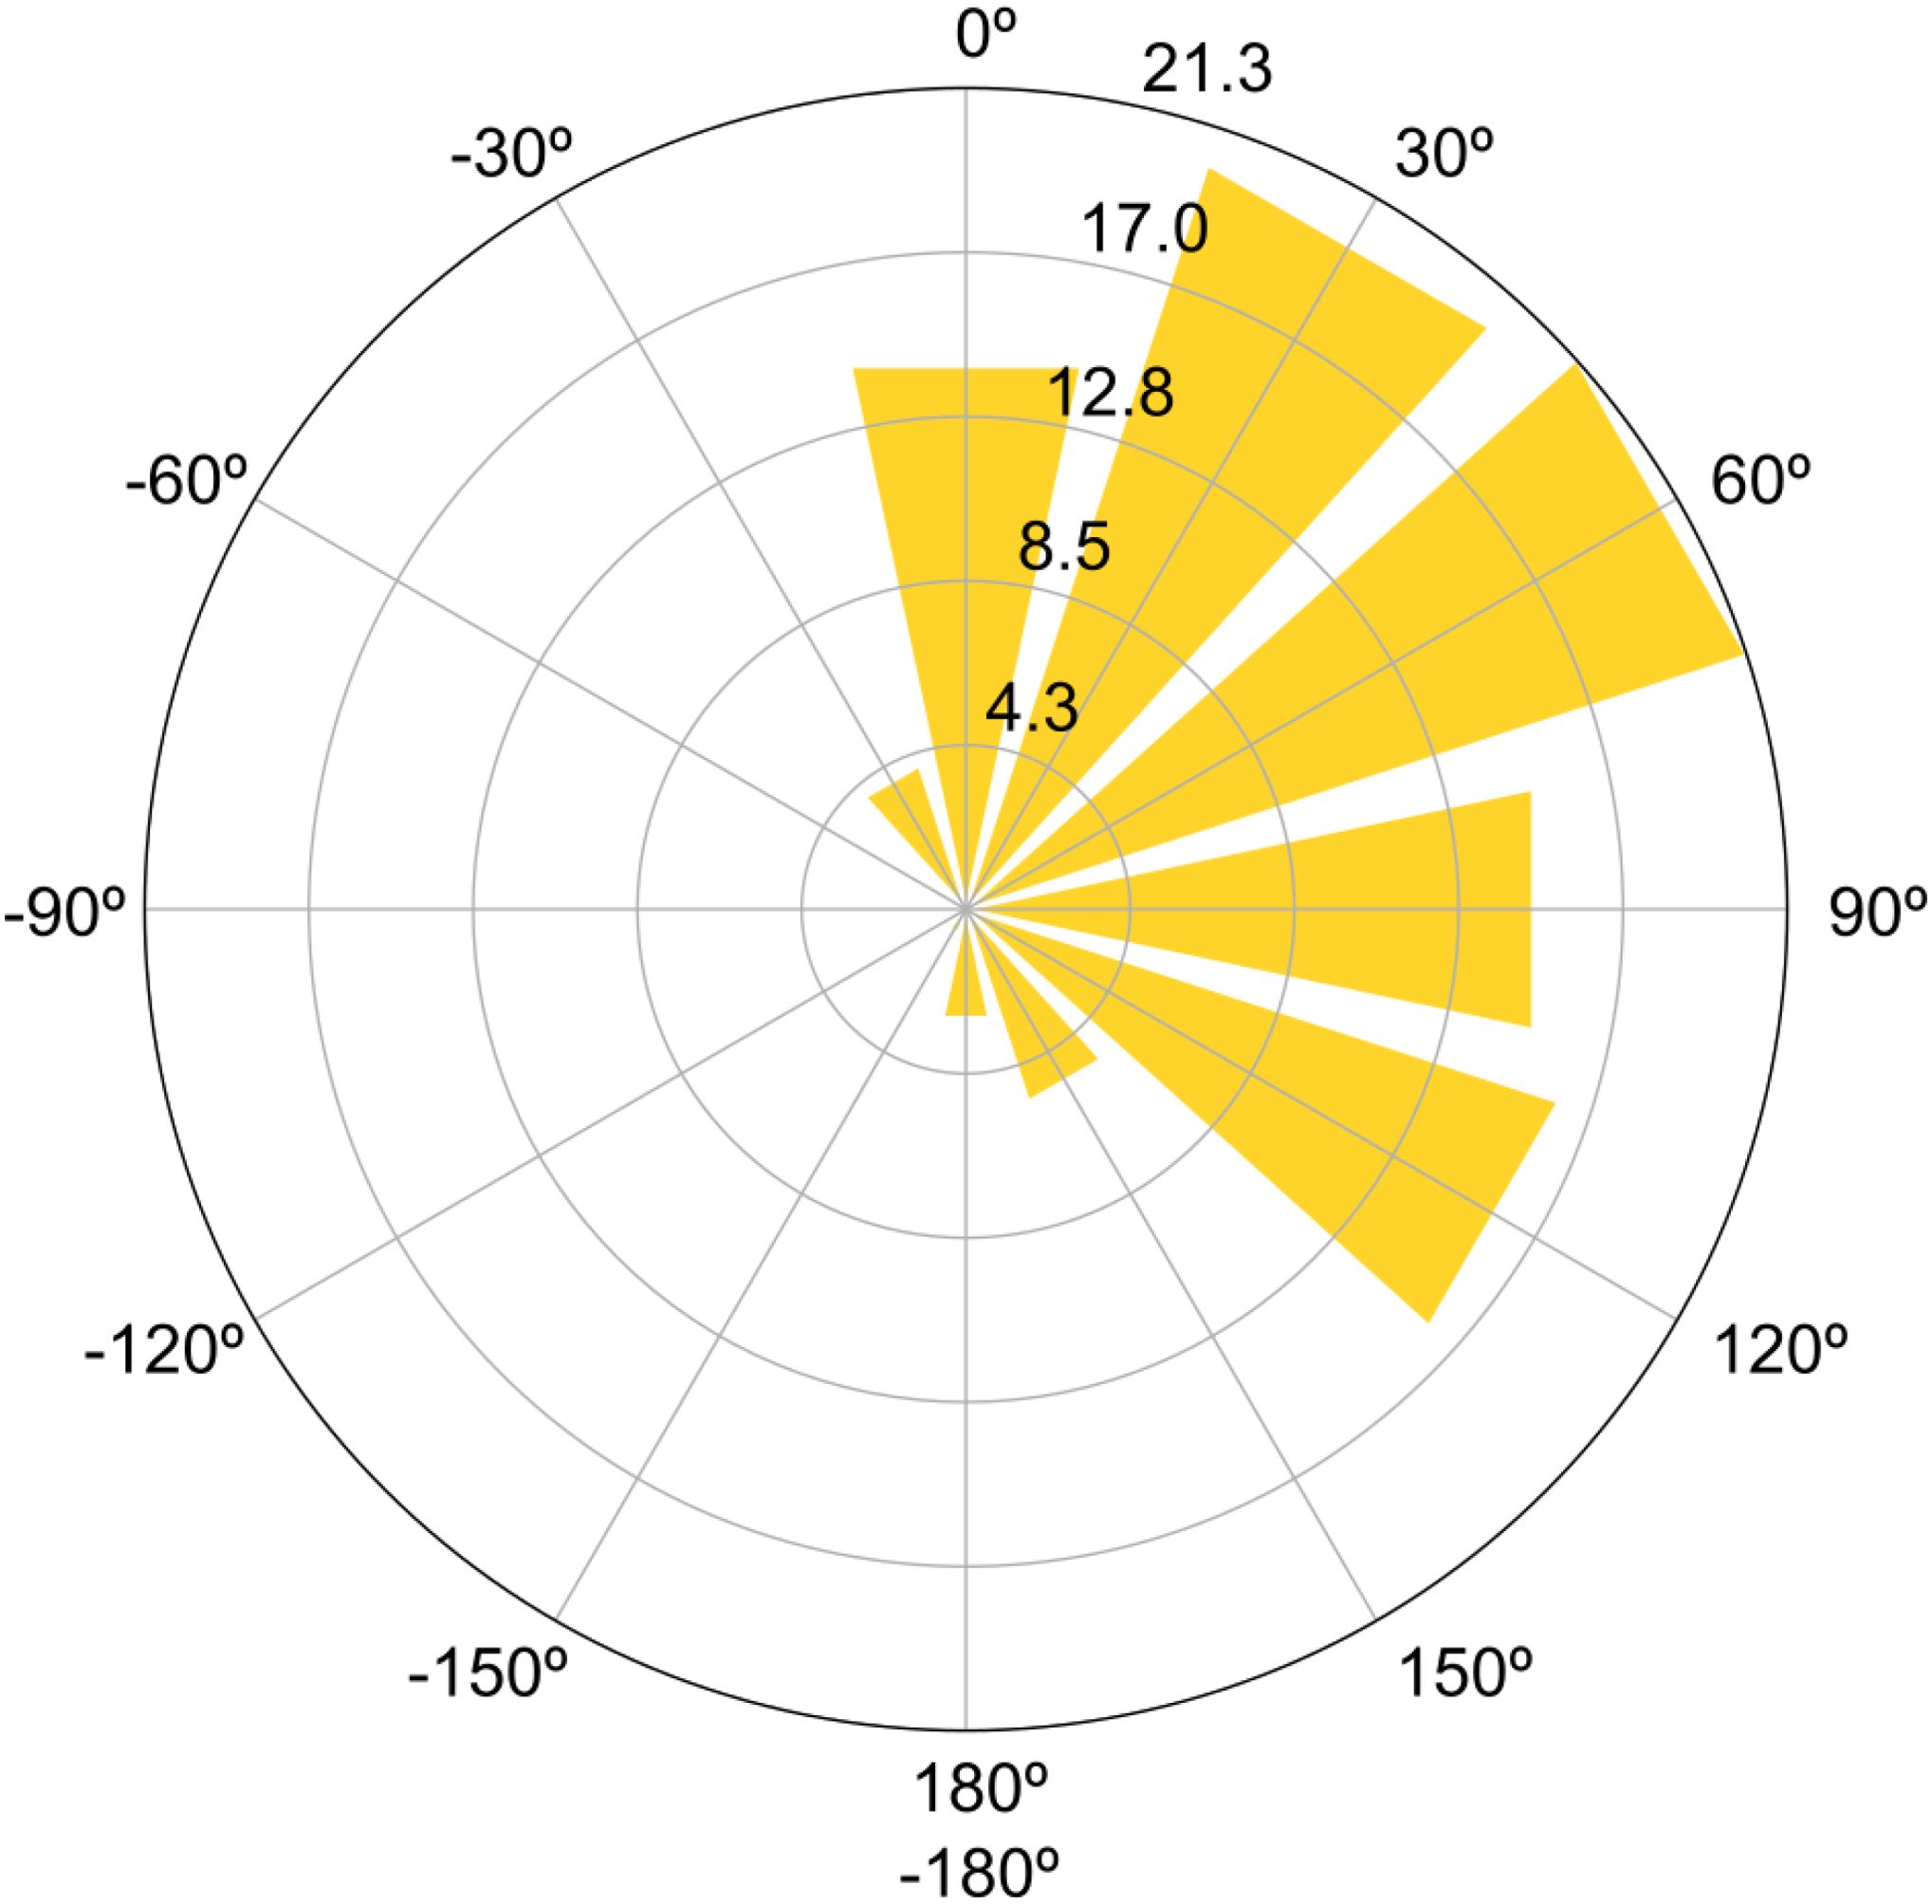
Figure 8. Total frequency of beached particles for each relative wave directional bin.
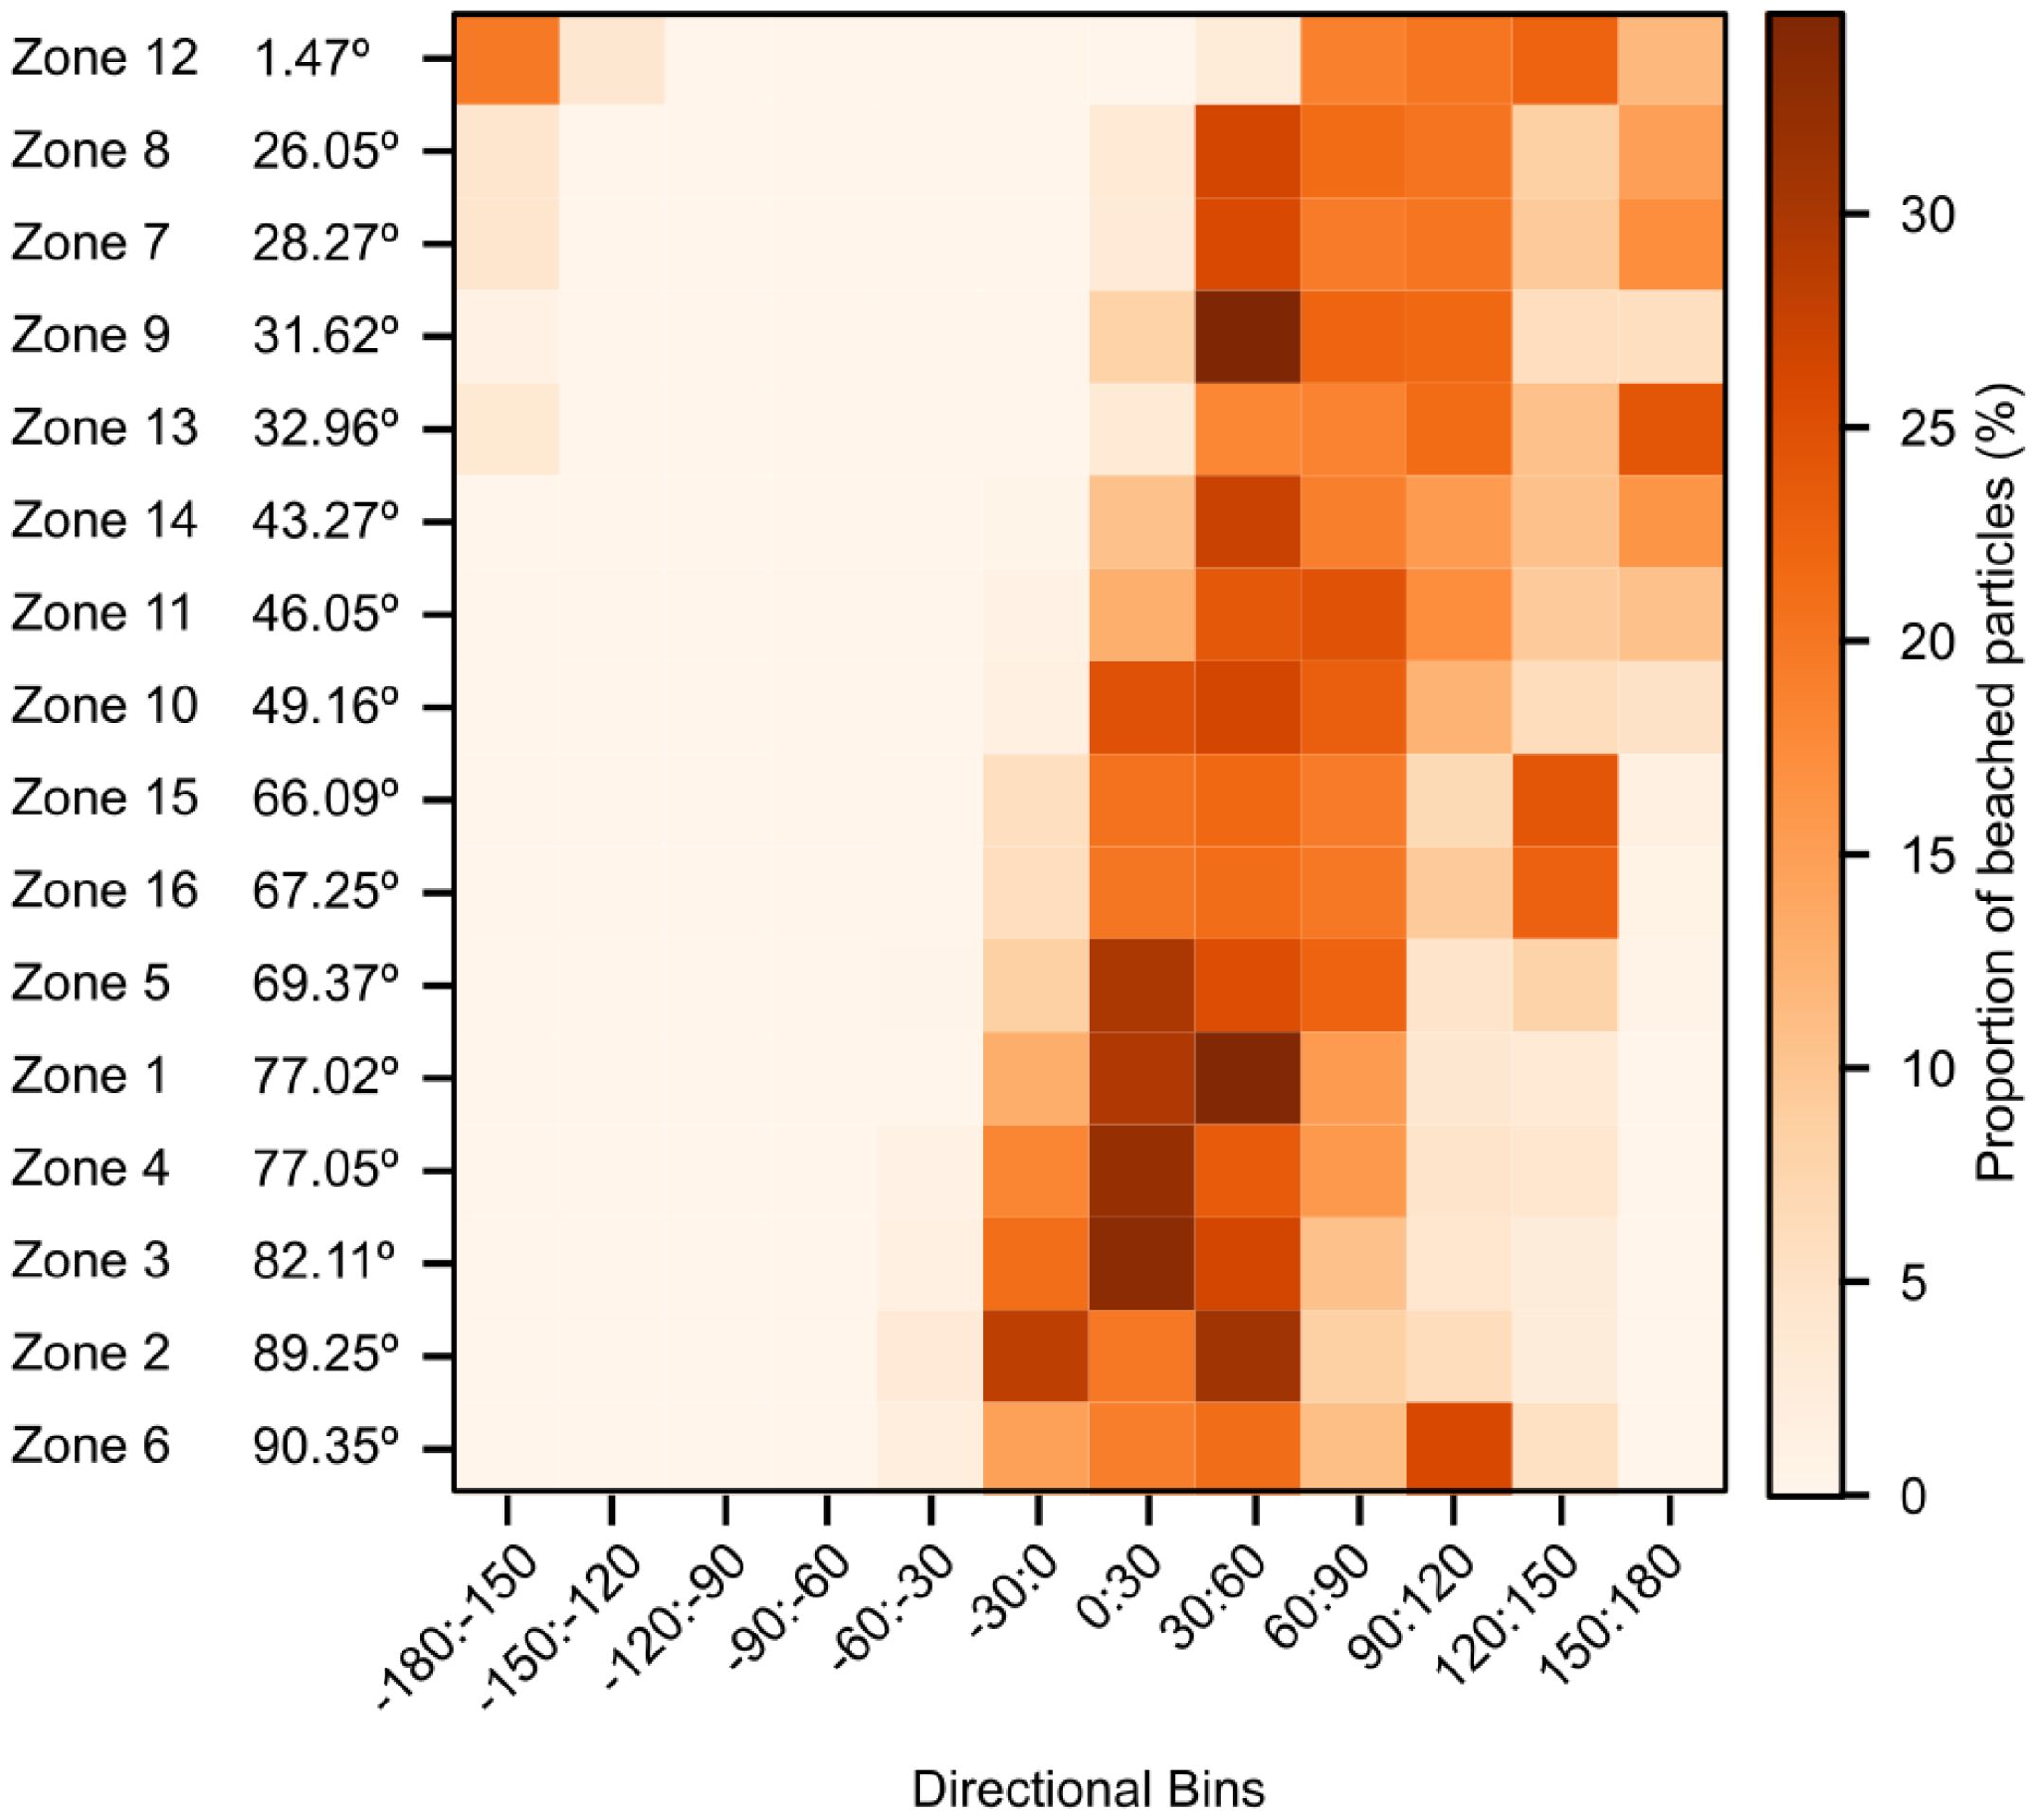
Figure 9. Beached particle proportions for relative wave directions in descending order of demarcated zone coastal orientation. Demarcated zones are numbered as per Figure 1.
3.5 Debris budgets from beach cleaning data
The macrolitter budgets for particles released from the BR and LR for the total coastline and for the areas covered by the AMB beached cleanup presented in Table 5 reveal substantial variations in debris discharge between the BR and LR. The total mass of debris from the BR amounted to 5,922 kg, while the LR contributed a substantially higher mass of 147,360 kg, resulting in a combined total of 153,282 kg. Among the debris originating from the BR, textiles accounted for the largest proportion with a mass of 2,767 kg (46.74%). In contrast, rubber items dominated the debris composition from the LR, contributing 130,278 kg (88.41%). The total mass exported from the study domain amounted to 15,500 kg, with 99.2% originating from the LR (see Supplementary Materials).
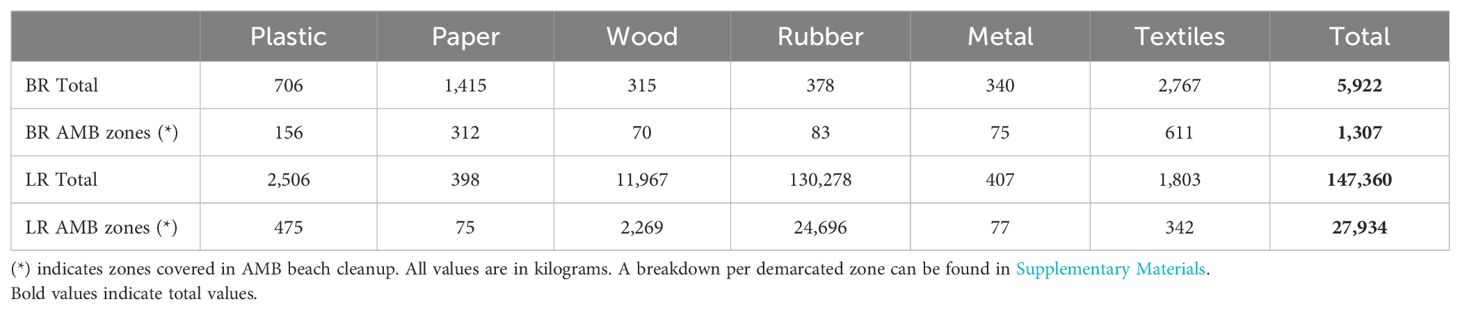
Table 5. Total macrolitter mass budgets for particles released from the BR and LR.
The beach cleanup data provided by the AMB in Table 6 which illustrates the areas covered by the AMB beach cleanup during the simulation period only include some of the demarcated zones in this study. Furthermore, the debris mass values were not segmented by litter type. For the demarcated zones that align with the AMB cleanup data, the total debris mass is 1,400 kg for the BR (23.6% BR total), and 22,722 kg for the LR (15.4% LR total). The total amount of debris in the same zones as the AMB beach cleanup data (29,241 kg) in Table 5 accounts for only 6.0% of the total debris collected by the AMB (487,940 kg).
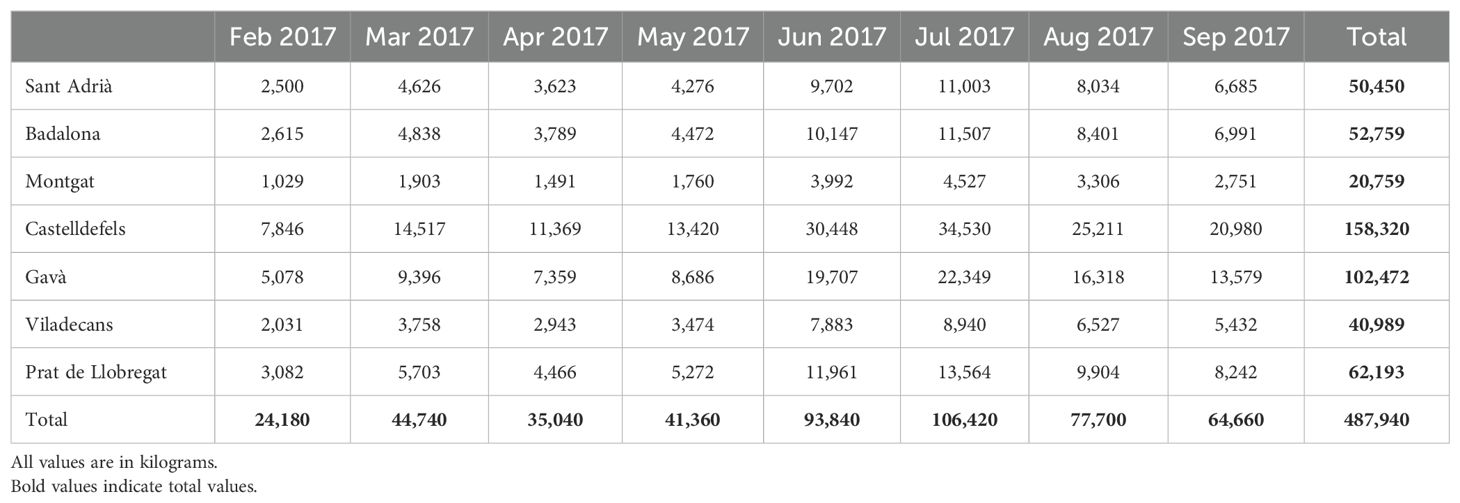
Table 6. Beach cleanup macrolitter data from the AMB for 2017 for the months of the simulation (February to September).
4 Discussion
4.1 Particle beaching and residence times
The total number of particles that became beached (91.5%) was considerably higher than in other studies to date, such as Onink et al. (2021) with 77.0%, Lebreton et al. (2019) with 66.8%, or Ruiz et al. (2022) with 80.0%. The different scales, methodologies, and beaching parameterisations, make direct comparisons challenging at best. Additionally, there is a paucity of studies that model the beaching of particles from river outflow using Lagrangian numerical models. A recent study by Castro-Rosero et al. (2023) that used observational data from nine prominent rivers along the Black Sea also using the LOCATE model registered beaching amounts of 92.6% with particles becoming beached close to their release points, thus aligning with the present study.
Unexpectedly, 51.1% of the particles emitted by the LR became beached around the LR mouth, contributing to the high beaching likelihood value (BL=3.68). The influence of the topography and geometry of the area surrounding the LR mouth, especially that exerted from the southern pier of the Barcelona port as seen in Figures 1C, D, however, could have a shielding effect from the NC resulting in almost stagnant current velocities in this area during the simulation period, thus allowing wave action to be the main factor promoting beaching in an area.
A correlation between the proximity of discharge areas, especially from ports and the number of particles beached in an area has been found in other studies (Menicagli et al., 2022). In this study, coastal processes and hydrodynamic regimes seem to be responsible for the retention of particles close to the point of emission, preventing them from drifting to open waters. This is consistent with microplastics distribution found in other modelling studies in the Mediterranean Sea where higher concentrations were found close to coastal areas with input sources than in offshore areas (Tsiaras et al., 2021). The effect of proximity to the discharge source, in conjunction with prevailing E or SE wave direction, as seen in Figure 2, may have promoted the deposition of particles, shortening particle residence times, and prevented particles from moving away from the LR mouth, thus increasing the propensity of beaching in this area.
In the case of the BR mouth, there are no adjacent complex structures in the aspect of the predominant current direction to the north. Here, an elevated beaching likelihood value could be due solely to the proximity of the discharge source, with the effect being much more localised due to the shorter coastline length when compared to the LR mouth. However, the presence of a sandbar at this location could be limiting the amount and rate of debris released as seen in Figure 1F, enabling the transport of particles from the BR mouth to the Port Fòrum area adjacent to the south, which received 45.4% of all particles from the BR. Interestingly, the beaching likelihood value of this zone suggests that particle deposition is mainly influenced by the hydrodynamics of the area. In contrast, St. Adrià received approximately four times fewer particles yet had a higher beaching likelihood value due to its lower coastline length. One possible shortfall of the beaching likelihood calculation may be that the coastline’s geometry is not considered; in the latter example, Port Fòrum is a marina with piers and a more complex geometrical structure than the St. Adrià area which could make the accumulation of particles more likely. Freshwater plumes generated from LR and BR discharges typically move in a southwesterly direction due to prevailing along-shelf circulation of the NC (Grifoll et al., 2012; Liste et al., 2014).
As with beaching amounts, drawing comparisons regarding residence times between this study and others is challenging due to differences in scales and methodologies. Global scale studies, such as Lebreton et al. (2012); Van Sebille et al. (2012); Maximenko et al. (2012); Koelmans et al. (2017); van der Mheen et al. (2020), or Kaandorp et al. (2023) assume integration times spanning years in their simulations. Such long residence times may be meaningless for smaller-scale regional or coastal studies, where beaching times are observed in days. For example, Critchell and Lambrechts (2016) reported a maximum beaching time of 8 days in the North Sea, Liubartseva et al. (2018) observed residence times ranging from approximately 7 to 80 days in the Mediterranean Sea, and Liubartseva et al. (2016) reported half-lives of approximately 40 days in the Adriatic Sea. In the present work, the maximum median residence time was observed in the S. Castelldefels with 152.8 h (6.4 d). Nonetheless, the areas closest to each release point exhibited median residence times of less than a day, encompassing 20.4 km of coastline around the BR release point and 49.9 km of coastline around the LR release point. Short residence times and high beaching amounts align with findings by Liubartseva et al. (2018) which identified the Barcelona coastline as an accumulation zone with debris remaining close to the point of entry due to the weakening of the NC in this area.
Wind and current patterns are subject to seasonal variations, with prevailing southerly winds being more frequent during the summer months, which could result in the northward dispersion of particles towards the areas north of the BR mouth (Font, 1990; Liste et al., 2014; Sánchez-Arcilla et al., 2014). The proportion of exported particles was slightly lower than studies such as Zhang et al. (2020) which focussed on microplastics in the South China Sea.
4.2 Hydrodynamic variables and coastal processes
Significant wave height is one of several factors involved in the complex process of particle beaching. Therefore, it is reasonable that the Pearson correlation value obtained was mild yet statistically significant despite there being few episodes where the significant wave height was >1.5 m. A larger time-series dataset that includes a greater variety of wave conditions would be required to clarify the relationship. Additionally, the hydrodynamic data was taken from a single point outside the Barcelona port, thus not considering more localised variations due to the effect of topographical features. Wave-induced coastal processes, especially those found in the swash zone, are not currently resolved in the model. If wave-induced coastal processes and higher-resolution Stokes drift data were included, future work could include more complex beaching parameterisations such as resuspension events and the inclusion of different types of substrates that may alter particle beaching behaviour. In areas with clear and prominent tidal influences, these interactions may also need to be included as a variable. Windage as a variable was not considered in this case due to the inclusion of Stokes drift, which could lead to its effect being duplicated and would have required further parameterisation of particles (buoyancy and size) in the simulation.
In experimental settings, the buoyancy of particles is determinant in how fast they travel, with velocities in the surf zone increasing to become closer to that of wave celerity (Larsen et al., 2023). A lower particle buoyancy can cause entrapment at sea when waves are small, with buoyancy, settling velocity, and wave steepness being important factors for whether debris can enter the surf zone and become beached (Li et al., 2023; Núñez et al., 2023). The present work assumes a positive buoyancy of particles, and the results obtained reinforce a relationship between the significant wave height (and steepness) and the proportion of particles that become beached. The linear regression results support the mildly positive correlation, with only the significant wave height positively impacting the beaching proportion.
Debris accumulation with regards to beach or coastline orientation has been previously studied for the effect of wind direction, with strong relationships found due to localised settings (Critchell et al., 2015; Hengstmann et al., 2017; Prevenios et al., 2018; Cloux et al., 2022; Renjaan et al., 2020). However, there is a paucity of information regarding establishing relationships between particle beaching, the wave direction and the coastline orientation. The interaction between these variables is illustrated in Figure 9, where the wave direction can be inferred to have a rather direct effect on particle beaching. For more horizontal azimuths (approximately 45° to 90°) there was more beaching with relative wave directions close to that of the azimuth of the coastline. This could indicate that alongshore wave directions are more effective in entrapping particles than deposited on the shore for those coastline orientations. For more vertical azimuths (approximately 0 to 45°), relative wave directions more perpendicular to the coastline promoted higher levels of particle beaching. Interestingly, in the BR mouth, where the azimuth is almost vertical, the directional impact was more widespread, with relative perpendicular directions (easterly) and relative alongshore directions (southerly) increasing beaching amounts. One possibility could be that SSW wave directions also have a higher significant wave height as illustrated in Figure 2.
The influence of the hydrodynamic variables on the exported particles was much less clear due to a lack of data from particle exporting events. It is worth noting that when particles are exported from the domain, they may become beached elsewhere on the coastline and not necessarily move offshore. Low particle export amounts also indicate much lower flux rates with the open sea than those observed in Liubartseva et al. (2018), at least from debris originating from rivers in coastal areas. The general direction of the exported particles was in alignment with the predominant current direction from the NC as illustrated in Figure 2, consistent with the observed current direction during the simulation period.
4.3 Beach cleanup data
Several assumptions were made when calculating the mass budgets, particularly for debris categories other than plastic. For instance, rubber showed a difference of 62.5 times in the mass between the item types considered in this category, rubber tyres potentially skewing the results since the proportion of rubber item types was not provided in the observational data from Schirinzi et al. (2020), and an equal distribution was assumed. Conversely, there was no distinction between manufactured/processed wood and natural wood, with some items possibly being larger than the typical dimensions used for the calculations, potentially leading to underestimations. Furthermore, the difference in debris mass between the two rivers was also higher than expected. The LR emitted 3.5 times more particles than the BR, yet the mass of these particles was 24.9 times greater, which can be attributed to the rubber category. Based on the proportions of litter types, it can be inferred that debris originating from the BR was more domestic and the LR can be characterised as more industrial.
The beach cleanup data from the AMB covered only seven of the sixteen demarcated zones, the equivalent of 27.4 km (8.9%) of the total coastline. The proportion of debris mass in these areas from each river was similar, as they did not include the most heavily affected zones for each river. River discharge can only account for 6.0% of debris found at these beaches, which can be partly explained by seasonality, use of the coastline, and other unaccounted contributors of debris outflow in the area.
There are difficulties in comparing the values of debris included in this study with other studies that include the Barcelona area, which estimates 1,787 tonnes of plastic entering the sea from Barcelona city (Liubartseva et al., 2018). Basing this value on a population of approximately 1.612 million inhabitants results in 1.109 kg p-1 y-1 (INE, 2024). Extrapolating this to the areas included in the AMB figures, with a total population of approximately 0.503 million inhabitants, would provide 558 t y-1, or 399 t for the simulation period. While this is comparable to the total debris collected for the AMB areas in Table 6, the proportion attributable to plastic is unknown. From the river release debris in Table 5, approximately 2.1% of the total is plastic, which would indicate that the AMB cleanup figures from plastic are two orders of magnitude lower than estimated in Liubartseva et al. (2018). This observation is consistent with recent findings where flux estimates from river runoff may have been overestimated by two to three orders of magnitude (Weiss et al., 2021). Additionally, there is a large amount of variability between the amount of plastic from each river (11.9% from the BR, and 1.7% from the LR), adding uncertainty when extrapolating this proportion to urban waste.
The observed 4-fold increase in debris mass cleaned up by the AMB between the peak in summer months and the minimum in winter months indicates the influence of increased beach use for tourism and social activities. Indeed, a study conducted on Mediterranean island beaches demonstrated a 4.7-fold increase in debris during the summer months due to mass tourism (Grelaud and Ziveri, 2020). The proportion of the coastal debris budget that can be attributed to rivers globally is estimated to be 59-69 kilotonnes per year, one order of magnitude less than other previous estimates of 800-2,700 kilotonnes per year (Kaandorp et al., 2023; Meijer et al., 2021). This reduction in the budget is consistent with the amount of debris that can be attributed to the river output in the simulation. Other factors, such as storm drains (including private or underwater), sewers and residual waters, streams and canals, underground pipes, rainfall-runoff, direct dumping or improper waste management, are likely to contribute to debris accumulation on the coastline and are believed to be unaccounted debris sources (Weiss et al., 2024). Data from these outflows would be crucial to gain a comprehensive understanding of the remaining 94.0% of debris cleaned up by the AMB which does not originate from river release points and may have underrepresented the amount of debris originating from the nearby rivers.
5 Conclusion
Particle beaching amounts were very high in this simulation, with residence times considerably shorter compared to other studies, making comparisons difficult due to the difference in scale of other studies. Areas close to the particle release points were more impacted by particle beaching with the proximity to the source established as one of the main factors influencing the deposition of particles, as seen with the beaching likelihood values of both river mouths. The beaching likelihood parameter thus provides a quantitative indication of the factors contributing to particle beaching in an area, such as proximity to the source and the influence that coastal geometry can exert on the hydrodynamic conditions of the area, such as a sheltering effect, as seen from the LR mouth.
It was not possible to determine clear associations between particle beaching and current velocity, although significant wave height positively influences the deposition of particles possibly due to more energetic conditions. Strong correlations, however, were not expected due to the complex processes involved or the number of coastal processes not resolved by the model due to limitations in the hydrodynamic data. A clear dependence was established between the amount of particle beaching, the orientation of the coastline, and the relative wave directions, where coastlines with more horizontal azimuths were more affected by alongshore relative wave directions, and those with more vertical azimuths were more affected by relative perpendicular wave directions.
The mass of debris originating from the LR and BR river outflow accounted for a small fraction of the debris on coastlines collected from the AMB beach cleanup data. This finding is consistent with other studies demonstrating that the impact of river outflow may be considerably less than previously thought. Other sources of debris outflow, such as municipal sewage and wastewater outflows, or the impact of recreational beach use and its seasonality should also considered for a more accurate representation of debris inputs when conducting Lagrangian simulations of marine debris at coastal scales.
Data availability statement
The original contributions presented in the study are included in the article/Supplementary Material. Further inquiries can be directed to the corresponding author.
Author contributions
IH: Data curation, Formal analysis, Investigation, Methodology, Software, Writing – original draft, Writing – review & editing. LC: Formal analysis, Investigation, Methodology, Writing – review & editing. ME: Conceptualization, Methodology, Project administration, Supervision, Writing – review & editing. JA: Conceptualization, Data curation, Formal analysis, Investigation, Methodology, Project administration, Resources, Software, Supervision, Visualization, Writing – review & editing.
Funding
The author(s) declare financial support was received for the research, authorship, and/or publication of this article. The present study was developed within the TRACE (Tools for a better management of marine litter in coastal environments to accelerate the tRAnsition to a Circular plastic Economy) project (TED2021-130515B-I00) funded by the Spanish Science and Innovation Ministry (MCIN/AEI/10.13039/501100011033) and by the EU “NextGenerationEU”/PRTR.
Acknowledgments
IH acknowledges funding from Formació de Professorat Universitari (FPU-UPC 2020). LC-R acknowledges funding from the Ministerio de Ciencia y Tecnología – Scholarship Program no. 885. JA acknowledges funding from the Serra Húnter Programme (SHP).
Conflict of interest
The authors declare that the research was conducted in the absence of any commercial or financial relationships that could be construed as a potential conflict of interest.
Generative AI statement
The author(s) declare that no Generative AI was used in the creation of this manuscript.
Publisher’s note
All claims expressed in this article are solely those of the authors and do not necessarily represent those of their affiliated organizations, or those of the publisher, the editors and the reviewers. Any product that may be evaluated in this article, or claim that may be made by its manufacturer, is not guaranteed or endorsed by the publisher.
Supplementary material
The Supplementary Material for this article can be found online at: https://www.frontiersin.org/articles/10.3389/fmars.2024.1534678/full#supplementary-material
References
Alsina J. M., Jongedijk C. E., van Sebille E. (2020). Laboratory measurements of the wave-induced motion of plastic particles: influence of wave period, plastic size and plastic density. J. Geophys. Res.: Oceans 125, 1–17. doi: 10.1029/2020JC016294
Bosi S., Broström G., Roquet F. (2021). The role of stokes drift in the dispersal of North Atlantic surface marine debris. Front. Mar. Sci. 8. doi: 10.3389/fmars.2021.697430
Castro-Rosero L. M., Hernandez I., Alsina J. M., Espino M. (2023). Transport and accumulation of floating marine litter in the Black Sea: insights from numerical modeling. Front. Mar. Sci. 10. doi: 10.3389/fmars.2023.1213333
Cloux S., Allen-Perkins S., de Pablo H., Garaboa-Paz D., Montero P., Pérez Muñuzuri V. (2022). Validation of a Lagrangian model for large-scale macroplastic tracer transport using mussel-peg in NW Spain (Ría de Arousa). Sci. Total Environ. 822, 153338. doi: 10.1016/j.scitotenv.2022.153338
Critchell K., Grech A., Schlaefer J., Andutta F. P., Lambrechts J., Wolanski E., et al. (2015). Modelling the fate of marine debris along a complex shoreline: Lessons from the Great Barrier Reef. Estuar. Coast. Shelf Sci. 167, 414–426. doi: 10.1016/j.ecss.2015.10.018
Critchell K., Lambrechts J. (2016). Modelling accumulation of marine plastics in the coastal zone; what are the dominant physical processes? Estuar. Coast. Shelf Sci. 171, 111–122. doi: 10.1016/j.ecss.2016.01.036
Dauhajre D. P., McWilliams J. C., Renault L. (2019). Nearshore lagrangian connectivity: submesoscale influence and resolution sensitivity. J. Geophys. Res.: Oceans 124, 5180–5204. doi: 10.1029/2019JC014943
De Haan W. P., Uviedo O., Ballesteros M., Canales Í., Curto X., Guart M., et al. (2022). Floating microplastic loads in the nearshore revealed through citizen science. Environ. Res. Lett. 17, 045018. doi: 10.1088/1748-9326/ac5df1
Deike L., Pizzo N., Melville W. K. (2017). Lagrangian transport by breaking surface waves. J. Fluid Mechanics 829, 364–391. doi: 10.1017/jfm.2017.548
Delandmeter P., Sebille E. V. (2019). The parcels v2.0 lagrangian framework: New field interpolation schemes. Geosci. Model. Dev. 12, 3571–3584. doi: 10.5194/gmd-12-3571-2019
Dorsay C., Egan G., Houghton I., Hegermiller C., Smit P. B. (2023). Proxy observations of surface wind from a globally distributed network of wave buoys. J. Atmos. Oceanic Technol. 40, 1403–1415. doi: 10.1175/JTECH-D-23-0044.1
Duhec A. V., Jeanne R. F., Maximenko N., Hafner J. (2015). Composition and potential origin of marine debris stranded in the Western Indian Ocean on remote Alphonse Island, Seychelles. Mar. pollut. Bull. 96, 76–86. doi: 10.1016/j.marpolbul.2015.05.042
Eriksen M., Cowger W., Erdle L. M., Coffin S., Villarrubia-Gómez P., Moore C. J., et al. (2023). A growing plastic smog, now estimated to be over 170 trillion plastic particles afloat in the world’s oceans—Urgent solutions required. PloS One 18, e0281596. doi: 10.1371/journal.pone.0281596
Eriksen M., Lebreton L. C., Carson H. S., Thiel M., Moore C. J., Borerro J. C., et al. (2014). Plastic Pollution in the World’s Oceans: More than 5 Trillion Plastic Pieces Weighing over 250,000 Tons Afloat at Sea. PloS One 9, 1–15. doi: 10.1371/journal.pone.0111913
Fernandino G., Elliff C. I., Silva I. R., Brito T., d. S., Bittencourt A. C., et al. (2016). Plastic fragments as a major component of marine litter: a case study in Salvador, Bahia, Brazil. Rev. Gestão Costeira Integrada 16, 281–287. doi: 10.5894/rgci649
Font J. (1990). A comparison of seasonal winds with currents on the continental slope of the Catalan Sea (northwestern Mediterranean). J. Geophys. Res. 95, 1537. doi: 10.1029/JC095iC02p01537
Ford H. V., Jones N. H., Davies A. J., Godley B. J., Jambeck J. R., Napper I. E., et al. (2022). The fundamental links between climate change and marine plastic pollution. Sci. Total Environ. 806, 150392. doi: 10.1016/j.scitotenv.2021.150392
Gillies S., van der Wel C., Van den Bossche J., Taves M. W., Arnott J., Ward B. C., et al. (2023). Shapely. doi: 10.5281/zenodo.7583915
Grelaud M., Ziveri P. (2020). The generation of marine litter in Mediterranean island beaches as an effect of tourism and its mitigation. Sci. Rep. 10, 1–11. doi: 10.1038/s41598-020-77225-5
Grifoll M., Aretxabaleta A. L., Espino M., Warner J. C. (2012). Along-shelf current variability on the Catalan inner-shelf (NW Mediterranean). J. Geophys. Res.: Oceans 117, n/a–n/a. doi: 10.1029/2012JC008182
Hengstmann E., Gräwe D., Tamminga M., Fischer E. K. (2017). Marine litter abundance and distribution on beaches on the Isle of Rügen considering the influence of exposition, morphology and recreational activities. Mar. pollut. Bull. 115, 297–306. doi: 10.1016/j.marpolbul.2016.12.026
Hernandez I., Castro-Rosero L. M., Espino M., Alsina Torrent J. M. (2024). LOCATE v1.0: Numerical Modelling of Floating Marine Debris Dispersion in Coastal Regions Using Parcels v2.4.2. Geophys. Model. Dev. 1, 2221–2245. doi: 10.5194/gmd-2023-160
Huck T., Bajon R., Grima N., Portela E., Molines J.-M., Penduff T. (2022). Three-dimensional dispersion of neutral “Plastic” particles in a global ocean model. Front. Anal. Sci. 2. doi: 10.3389/frans.2022.868515
Isobe A., Iwasaki S. (2022). The fate of missing ocean plastics: Are they just a marine environmental problem? Sci. Total Environ. 825, 153935. doi: 10.1016/j.scitotenv.2022.153935
Isobe A., Kubo K., Tamura Y., Kako S., Nakashima E., Fujii N. (2014). Selective transport of microplastics and mesoplastics by drifting in coastal waters. Mar. pollut. Bull. 89, 324–330. doi: 10.1016/j.marpolbul.2014.09.041
Jalón-Rojas I., Wang X. H., Fredj E. (2019). A 3D numerical model to Track Marine Plastic Debris (TrackMPD): Sensitivity of microplastic trajectories and fates to particle dynamical properties and physical processes. Mar. pollut. Bull. 141, 256–272. doi: 10.1016/j.marpolbul.2019.02.052
Kaandorp M. L., Dijkstra H. A., Van Sebille E. (2020). Closing the Mediterranean marine floating plastic mass budget: inverse modeling of sources and sinks. Environ. Sci. Technol. 54, 11980–11989. doi: 10.1021/acs.est.0c01984
Kaandorp M. L., Dijkstra H. A., van Sebille E. (2021). Modelling size distributions of marine plastics under the influence of continuous cascading fragmentation. Environ. Res. Lett. 16, 054075. doi: 10.1088/1748-9326/abe9ea
Kaandorp M. L. A., Lobelle D., Kehl C., Dijkstra H. A., van Sebille E. (2023). Global mass of buoyant marine plastics dominated by large long-lived debris. Nat. Geosci. 16, 689–694. doi: 10.1038/s41561-023-01216-0
Kataoka T., Hinata H., Kato S. (2015). Backwash process of marine macroplastics from a beach by nearshore currents around a submerged breakwater. Mar. pollut. Bull. 101, 539–548. doi: 10.1016/j.marpolbul.2015.10.060
Koelmans A. A., Kooi M., Law K. L., Van Sebille E. (2017). All is not lost: Deriving a top-down mass budget of plastic at sea. Environ. Res. Lett. 12, 114028. doi: 10.1088/1748-9326/aa9500
Larsen B. E., Al-Obaidi M. A. A., Guler H. G., Carstensen S., Goral K. D., Christensen E. D., et al. (2023). Experimental investigation on the nearshore transport of buoyant microplastic particles. Mar. pollut. Bull. 187, 114610. doi: 10.1016/j.marpolbul.2023.114610
Law K. L., Morét-Ferguson S., Maximenko N. A., Proskurowski G., Peacock E. E., Hafner J., et al. (2010). Plastic accumulation in the North Atlantic subtropical gyre. Science 329, 1185–1188. doi: 10.1126/science.1192321
Lebreton L., Egger M., Slat B. (2019). A global mass budget for positively buoyant macroplastic debris in the ocean. Sci. Rep. 9, 1–10. doi: 10.1038/s41598-019-49413-5
Lebreton L. C., Greer S. D., Borrero J. C. (2012). Numerical modelling of floating debris in the world’s oceans. Mar. pollut. Bull. 64, 653–661. doi: 10.1016/j.marpolbul.2011.10.027
Lebreton L., Slat B., Ferrari F., Sainte-Rose B., Aitken J., Marthouse R., et al. (2018). Evidence that the Great Pacific Garbage Patch is rapidly accumulating plastic. Sci. Rep. 8, 1–15. doi: 10.1038/s41598-018-22939-w
Li H., Feng X., Ni X., Feng W. (2023). Beaching process of floating marine debris associated with the evolution of the nearshore wave. Mar. pollut. Bull. 197, 115695. doi: 10.1016/j.marpolbul.2023.115695
Liste M., Grifoll M., Monbaliu J. (2014). River plume dispersion in response to flash flood events. Application to the Catalan shelf. Cont. Shelf Res. 87, 96–108. doi: 10.1016/j.csr.2014.06.007
Liubartseva S., Coppini G., Lecci R., Clementi E. (2018). Tracking plastics in the Mediterranean: 2D Lagrangian model. Mar. pollut. Bull. 129, 151–162. doi: 10.1016/j.marpolbul.2018.02.019
Liubartseva S., Coppini G., Lecci R., Creti S. (2016). Regional approach to modeling the transport of floating plastic debris in the Adriatic Sea. Mar. pollut. Bull. 103, 115–127. doi: 10.1016/j.marpolbul.2015.12.031
Lobelle D., Cunliffe M. (2011). Early microbial biofilm formation on marine plastic debris. Mar. pollut. Bull. 62, 197–200. doi: 10.1016/j.marpolbul.2010.10.013
Lobelle D., Kooi M., Koelmans A. A., Laufkötter C., Jongedijk C. E., Kehl C., et al. (2021). Global modeled sinking characteristics of biofouled microplastic. J. Geophys. Res.: Oceans 126, 1–15. doi: 10.1029/2020JC017098
Mansui J., Darmon G., Ballerini T., van Canneyt O., Ourmieres Y., Miaud C. (2020). Predicting marine litter accumulation patterns in the Mediterranean basin: Spatio-temporal variability and comparison with empirical data. Prog. Oceanogr. 182, 102268. doi: 10.1016/j.pocean.2020.102268
Mansui J., Molcard A., Ourmières Y. (2015). Modelling the transport and accumulation of floating marine debris in the Mediterranean basin. Mar. pollut. Bull. 91, 249–257. doi: 10.1016/j.marpolbul.2014.11.037
Martín-Lara M. A., Godoy V., Quesada L., Lozano E. J., Calero M. (2021). Environmental status of marine plastic pollution in Spain. Mar. pollut. Bull. 170, 112677. doi: 10.1016/j.marpolbul.2021.112677
Maximenko N., Hafner J., Niiler P. (2012). Pathways of marine debris derived from trajectories of Lagrangian drifters. Mar. pollut. Bull. 65, 51–62. doi: 10.1016/j.marpolbul.2011.04.016
Meijer L. J., van Emmerik T., van der Ent R., Schmidt C., Lebreton L. (2021). More than 1000 rivers account for 80% of global riverine plastic emissions into the ocean. Sci. Adv. 7, 1–14. doi: 10.1126/sciadv.aaz5803
Menicagli V., De Battisti D., Balestri E., Federigi I., Maltagliati F., Verani M., et al. (2022). Impact of storms and proximity to entry points on marine litter and wrack accumulation along Mediterranean beaches: Management implications. Sci. Total Environ. 824, 153914. doi: 10.1016/j.scitotenv.2022.153914
Millot C. (1999). Circulation in the Western Mediterranean Sea. J. Mar. Syst. 20, 423–442. doi: 10.1016/S0924-7963(98)00078-5
Núñez P., Romano A., García-Alba J., Besio G., Medina R. (2023). Wave-induced cross-shore distribution of different densities, shapes, and sizes of plastic debris in coastal environments: A laboratory experiment. Mar. pollut. Bull. 187, 114561. doi: 10.1016/j.marpolbul.2022.114561
Onink V., Jongedijk C. E., Hoffman M. J., van Sebille E., Laufkötter C. (2021). Global simulations of marine plastic transport show plastic trapping in coastal zones. Environ. Res. Lett. 16, 064053. doi: 10.1088/1748-9326/abecbd
Onink V., Wichmann D., Delandmeter P., van Sebille E. (2019). The role of Ekman currents, geostrophy, and stokes drift in the accumulation of floating microplastic. J. Geophys. Res.: Oceans 124, 1474–1490. doi: 10.1029/2018JC014547
Pärn O., Davulienė L., Macias Moy D., Vahter K., Stips A., Torsvik T. (2023). Effects of Eulerian current, Stokes drift and wind while simulating surface drifter trajectories in the Baltic Sea. Oceanologia 65, 453–465. doi: 10.1016/j.oceano.2023.02.001
Pedrotti M. L., Petit S., Elineau A., Bruzaud S., Crebassa J. C., Dumontet B., et al. (2016). Changes in the floating plastic pollution of the mediterranean sea in relation to the distance to land. PloS One 11, e0161581. doi: 10.1371/journal.pone.0161581
Pierson W. J., Moskowitz L. (1964). A proposed spectral form for fully developed wind seas based on the similarity theory of S. A. Kitaigorodskii. J. Geophys. Res. 69, 5181–5190. doi: 10.1029/JZ069i024p05181
Politikos D. V., Ioakeimidis C., Papatheodorou G., Tsiaras K. (2017). Modeling the fate and distribution of floating litter particles in the Aegean Sea (E. Mediterranean). Front. Mar. Sci. 4. doi: 10.3389/fmars.2017.00191
Politikos D. V., Tsiaras K., Papatheodorou G., Anastasopoulou A. (2020). Modeling of floating marine litter originated from the Eastern Ionian Sea: Transport, residence time and connectivity. Mar. pollut. Bull. 150, 110727. doi: 10.1016/j.marpolbul.2019.110727
Prevenios M., Zeri C., Tsangaris C., Liubartseva S., Fakiris E., Papatheodorou G. (2018). Beach litter dynamics on Mediterranean coasts: Distinguishing sources and pathways. Mar. pollut. Bull. 129, 448–457. doi: 10.1016/j.marpolbul.2017.10.013
Pyproj (2022). Python interface to PROJ (cartographic projections and coordinate transformations library).
Renjaan E. A., Silubun D. T., Latar D. I., Makailipessy M. (2020). Beach orientation and exposure accumulate types of marine debris on the coast of Dullah Island, kei archipelago, Indonesia. IOP Conf. Series: Earth Environ. Sci. 517, 12015. doi: 10.1088/1755-1315/517/1/012015
Rubio A., Barnier B., Jordà G., Espino M., Marsaleix P. (2009). Origin and dynamics of mesoscale eddies in the Catalan Sea (NW Mediterranean): Insight from a numerical model study. J. Geophys. Res.: Oceans 114, 1–17. doi: 10.1029/2007JC004245
Ruiz I., Ana J. A., Basurko O. C., Rubio A. (2022). Modelling the distribution of fishing-related floating marine litter within the Bay of Biscay and its marine protected areas. Environ. pollut. 292, 118216. doi: 10.1016/j.envpol.2021.118216
Ryan P. G. (2015). Does size and buoyancy affect the long-distance transport of floating debris? Environ. Res. Lett. 10, 084019. doi: 10.1088/1748-9326/10/8/084019
Sánchez-Arcilla A., González-Marco D., Bolaños R. (2008). A review of wave climate and prediction along the Spanish Mediterranean coast. Natural Hazards Earth System Sci. 8, 1217–1228. doi: 10.5194/nhess-8-1217-2008
Sánchez-Arcilla A., Wolf J., Monbaliu J. (2014). Oceanography at coastal scales: Introduction to the special issue on results from the EU FP7 FIELD AC project. Cont. Shelf Res. 87, 1–6. doi: 10.1016/j.csr.2014.01.023
Sánchez-Vidal A., Uviedo O., Higueras S., Ballesteros M., Curto X., de Haan W., et al. (2021). “Paddle surfing for science on microplastic pollution: a successful citizen science initiative,” in Paddle surfing for science on microplastic pollution: a successful citizen science initiative, vol. vol. EGU21-10579. (EGU), 1–1.
Schirinzi G. F., Köck-Schulmeyer M., Cabrera M., González-Fernández D., Hanke G., Farré M., et al. (2020). Riverine anthropogenic litter load to the Mediterranean Sea near the metropolitan area of Barcelona, Spain. Sci. Total Environ. 714, 136807. doi: 10.1016/j.scitotenv.2020.136807
Sonke J. E., Koenig A. M., Yakovenko N., Hagelskjær O., Margenat H., Hansson S. V., et al. (2022). A mass budget and box model of global plastics cycling, degradation and dispersal in the land-ocean-atmosphere system. Microplastics Nanoplastics 2, :28–42. doi: 10.1186/s43591-022-00048-w
Soto-Navarro J., Jordá G., Deudero S., Alomar C., Amores Á., Compa M. (2020). 3D hotspots of marine litter in the Mediterranean: A modeling study. Mar. pollut. Bull. 155, 111159. doi: 10.1016/j.marpolbul.2020.111159
Svendsen I. (1984). Mass flux and undertow in a surf zone. Coast. Eng. 8, 347–365. doi: 10.1016/0378-3839(84)90030-9
Thomson J., D’Asaro E. A., Cronin M. F., Rogers W. E., Harcourt R. R., Shcherbina A. (2013). Waves and the equilibrium range at Ocean Weather Station P. J. Geophys. Res.: Oceans 118, 5951–5962. doi: 10.1002/2013JC008837
Tsiaras K., Costa E., Morgana S., Gambardella C., Piazza V., Faimali M., et al. (2022). Microplastics in the Mediterranean: variability from observations and model analysis. Front. Mar. Sci. 9. doi: 10.3389/fmars.2022.784937
Tsiaras K., Hatzonikolakis Y., Kalaroni S., Pollani A., Triantafyllou G. (2021). Modeling the pathways and accumulation patterns of micro- and macro-plastics in the Mediterranean. Front. Mar. Sci. 8. doi: 10.3389/fmars.2021.743117
van der Mheen M., van Sebille E., Pattiaratchi C. (2020). Beaching patterns of plastic debris along the Indian Ocean rim. Ocean Sci. Discussions. 16, 1–31. doi: 10.5194/os-2020-50
van Sebille E., Aliani S., Law K. L., Maximenko N., Alsina J. M., Bagaev A., et al. (2020). The physical oceanography of the transport of floating marine debris. Environ. Res. Lett. 15, 044040. doi: 10.1088/1748-9326/ab6d7d
Van Sebille E., England M. H., Froyland G. (2012). Origin, dynamics and evolution of ocean garbage patches from observed surface drifters. Environ. Res. Lett. 7. doi: 10.1088/1748-9326/7/4/044040
Van Sebille E., Wilcox C., Lebreton L., Maximenko N., Hardesty B. D., Van Franeker J. A., et al. (2015). A global inventory of small floating plastic debris. Environ. Res. Lett. 10, 124006. doi: 10.1088/1748-9326/10/12/124006
Weiss L., Estournel C., Marsaleix P., Mikolajczak G., Constant M., Ludwig W. (2024). From source to sink: part 1—characterization and Lagrangian tracking of riverine microplastics in the Mediterranean Basin. Environ. Sci. pollut. Res. doi: 10.1007/s11356-024-34635-6
Weiss L., Ludwig W., Heussner S., Canals M., Ghiglione J. F., Estournel C., et al. (2021). The missing ocean plastic sink: Gone with the rivers. Science 373, 107–111. doi: 10.1126/science.abe0290
Zambianchi E., Trani M., Falco P. (2017). Lagrangian transport of marine litter in the Mediterranean Sea. Front. Environ. Sci. 5. doi: 10.3389/fenvs.2017.00005
Keywords: marine debris, plastic pollution, marine litter, dispersion, beaching, Lagrangian numerical modelling, coastal regions, plastic particles
Citation: Hernandez I, Castro-Rosero LM, Espino M and Alsina JM (2025) Processes controlling the dispersion and beaching of floating marine debris in the Barcelona coastal region. Front. Mar. Sci. 11:1534678. doi: 10.3389/fmars.2024.1534678
Received: 26 November 2024; Accepted: 24 December 2024;
Published: 27 January 2025.
Edited by:
Teresa Bottari, National Research Council (CNR), ItalyReviewed by:
Sedat Gundogdu, Çukurova University, TürkiyeV. Suneel, Council of Scientific and Industrial Research (CSIR), India
Mohamed Ben-Haddad, Ibn Zohr University, Morocco
Copyright © 2025 Hernandez, Castro-Rosero, Espino and Alsina. This is an open-access article distributed under the terms of the Creative Commons Attribution License (CC BY). The use, distribution or reproduction in other forums is permitted, provided the original author(s) and the copyright owner(s) are credited and that the original publication in this journal is cited, in accordance with accepted academic practice. No use, distribution or reproduction is permitted which does not comply with these terms.
*Correspondence: Ivan Hernandez, aXZhbi5oZXJuYW5kZXoxQHVwYy5lZHU=