- 1Digital Engineering Technology Research and Development Center for Maritime Safety and Security, Jiangsu Maritime Institute, Nanjing, China
- 2Laboratory for Regional Oceanography and Numerical Modeling, Qingdao Marine Science and Technology Center, Qingdao, China
- 3First Institute of Oceanography, Ministry of Natural Resources, Qingdao, China
This paper examines the intraseasonal variabilities (ISVs) of the Wyrtki Jet in boreal spring and fall and their impacts on the oceanic ISVs along the southern coast of Sumatra-Java Island. The results reveal that the Wyrtki Jet ISVs in spring are significantly stronger than those in fall, with the standard deviation of the 0-30m-averaged zonal current reaching up to 0.25 m/s in spring, while the highest value in fall is only 0.2 m/s. The Wyrtki Jet ISVs are significantly correlated with surface zonal wind anomalies and sea level anomalies (SLAs) in the equatorial Indian Ocean (EIO) at intraseasonal timescale, and are modulated by the propagation of equatorial Kelvin waves. The intraseasonal SLAs along the southern coast of the Sumatra-Java Island are significantly correlated with the Wyrtki Jet ISVs, exhibiting similar seasonal fluctuation characteristics. In spring, the Wyrtki Jet intraseasonal signals initially appear near 75°E at the equator, approximately 10 days before the positive peaks of the intraseasonal SLAs, while in fall, the Wyrtki Jet intraseasonal signals first appear about 15 days before the peaks near 60°E at the equator, which is relatively further west compared to signals in spring. In addition, the composite Wyrtki Jet ISVs in spring are approximately 0.2 m/s stronger than those in fall. The enhanced ISVs of sea surface zonal wind forcing and Wyrtki Jet in spring, relative to those in fall, indicate that the seasonality in the intraseasonal SLAs along the southern coast of Sumatra-Java is attributable to the combined effects of surface wind forcing and current fields.
1 Introduction
The Wyrtki Jet refers to the eastward surface jet that occurs during the transition periods of the equatorial Indian Ocean (EIO) monsoon (April-May and October-November, spring and fall in the Northern Hemisphere, hereinafter referred to as spring and fall respectively; Wyrtki, 1973), which is a crucial component of the tropical Indian Ocean circulation system. When the Wyrtki Jet occurs, the velocity of surface zonal current in the EIO reaches 1.5m/s, triggering a significant water mass transport that can carry warm and salty seawater in the upper layer of the western Indian Ocean eastward. This results in the redistribution of upper-layer ocean water and thermohaline in the tropical Indian Ocean, altering the oceanic stratification in both the eastern and western EIO (Gordon et al., 2010; Chen et al., 2016a, 2016b; Zhang et al., 2016; Cao et al., 2018, 2019; Li S. et al., 2018; Xu et al., 2018; Du et al., 2019b; Deng et al., 2021). Additionally, the Wyrtki Jet is closely related to large-scale air-sea interaction events such as the El Niño-Southern Oscillation and the Indian Ocean Dipole (Nagura and McPhaden, 2010; Gnanaseelan et al., 2012; Nyadjro and McPhaden, 2014; Zhang et al., 2014; Du and Zhang, 2015; McPhaden et al., 2015; Wu et al., 2018; Du et al., 2019a; Huang et al., 2023; Xie et al., 2023). Therefore, as a key carrier for achieving the redistribution of upper ocean heat and salinity in the tropical Indian Ocean, the Wyrtki Jet is not only an indispensable part of the ocean circulation system in the tropical Indian Ocean but also directly impacts the ecology, environment, and climate change in the tropical Indian Ocean and its surrounding regions.
The intraseasonal variabilities (ISVs) of Wyrtki Jet in this study refer to variations at intraseasonal timescale (with a significant period of 20-90 days). Deshpande et al. (2017) showed the role of ISVs in spring Wyrtki Jet and hinted about the possible influence of Madden Julian Oscillation (MJO) in driving the Wyrtki Jet along the equator. Moum et al. (2014) noticed that MJO wind bursts along the eastern EIO can considerably strengthen the magnitude of fall Wyrtki Jet. Prerna et al. (2019) showed that Wyrtki Jet shows predominant semiannual spectral peaks in spring and fall, but significant intraseasonal energy is evident during spring in the central and eastern EIO. The tropical Indian Ocean, where the Wyrtki Jet is located, is one of the regions with the strongest air-sea interactions in the world and a crucial region for the eastward and northward propagation of atmospheric ISVs. The changes in the upper ocean stratification caused by ISVs of the Wytrki Jet will affect the propagation of atmospheric ISVs through the abundant air-sea interactions within this area (Li K. et al., 2018; Liu and Yang, 2023). Furthermore, researches based on observation data have shown that the ISVs can regulate the seasonal and interannual variations of Wyrtki Jet across timescales (Duan et al., 2016; Deshpande et al., 2017; Han et al., 2017). Therefore, the impact of the Wyrtki Jet ISVs on oceanic circulation and air-sea interaction processes in the tropical Indian Ocean and its surrounding regions is not only limited to the intraseasonal timescale, but also extended to longer timescales by regulating seasonal and interannual variations of Wyrtki Jet across different timescales, making it a potentially important player in tropical eastern Indian Ocean and even global climate variability. This paper mainly analyzes the seasonal differences in the Wyrtki jet ISVs discovered in previous research, mainly considering that without a deep understanding of the seasonal differences of Wyrtki Jet ISVs, it is impossible to fully comprehend the characteristics of its seasonal and interannual variations, and thus impossible to truly understand the structure and dynamics of the tropical Indian Ocean circulation system.
In summary, this paper aims to conduct an in-depth analysis in the seasonal differences of Wyrtki Jet ISVs, and further explore the impacts of these seasonal variations on the oceanic ISVs along the Sumatra-Java Southern Coast. The relevant research results can fill the gap in the study of Wyrtki Jet ISVs, enhance the understanding of the tropical Indian Ocean circulation, and improve the assessment and prediction level of the oceanic and atmospheric environment in the tropical Indian Ocean.
2 Data and methods
Analyses in this paper are based mainly on the variable of current from HYbrid Coordinate Ocean Model (HYCOM) product. Version 3.0 of the Global Ocean Forecasting System is used in this study, which provides diagnostic output with a 1/12° horizontal resolution, daily time interval, and standard Levitus depth levels (Conkright et al., 1994; Levitus et al., 1994; Levitus and Boyer, 1994a, 1994b). In addition, we also used observation data from the Research Moored Array for African Asian-Australian Monsoon Analysis and Prediction (RAMA) buoys in the EIO to obtain more accurate analysis results and validate the accuracy of the HYCOM data. In addition, Ocean Surface Current Analyses Realtime (OSCAR) surface currents calculated from satellite datasets are also used to examine the simulation accuracy of surface current in HYCOM product. To investigate the impact of surface ocean current on sea surface height, we also used daily sea level anomaly (SLA) data in this study, obtained from the Archiving, Validation, and Interpretation of Satellite Oceanography (AVISO), and are compiled onto a 0.25°× 0.25°grid. The reference field used to compute the SLA is based on a 20-year period (1993-2012) (Le Traon et al., 1998; Ducet et al., 2000; DUACS/AVISO, 2014). We have assessed the gridded SLAs used in this paper with tidal gauge observations archived by the Permanent Service for Mean Sea Level (Holgate et al., 2013). The results showed consistent variations between these two datasets with correlation coefficients >0.6 above the 95% confidence level (figures not shown). Wind forcing data used in this study with horizontal intervals of 0.25° and time interval of 6 hours are from version 2.0 of Cross‐Calibrated Multi-Platform (CCMP v2.0) sea surface wind fields provided by Remote Sensing Systems. This data set includes wind data from the Remote Sensing Systems radiometer, the Quick Scatterometer (QuikSCAT) and Advanced Scatterometer (ASCAT), moored buoys, and the ERA‐Interim model (Atlas et al., 2011; Wentz et al., 2015). Considering the temporal ranges of these data sets, we analyze these data within a unified period from 1 January 2004 to 31 December 2014.
The Wyrtki Jet in this paper is characterized by the vertical average zonal current above 30m in the ocean surface. A cosine‐recursive Butterworth filter (Emery and Thomson, 2001) with a time band of 20-90 days and the empirical mode decomposition (EMD; Huang et al., 1998) methods have been used to extract the variability at intraseasonal timescale. For wavelet analysis, we designate the Morlet wavelet as the mother wavelet and calculate the 95% confidence level based on a red noise background spectrum with an autoregressive lag-1 correlation of 0.72 (Torrence and Compo, 1998).
3 Seasonal differences of Wyrtki Jet ISVs
Madden Julian Oscillation (MJO) is the most important signal of ISVs in the tropical atmosphere. It originates in the tropical Indian Ocean and gradually propagates eastward, eventually dissipating near the central Pacific Ocean (Madden and Julian, 1971, 1972, 1994; Zhang, 2013; Li K. et al., 2018). Influenced by this oscillation, the Wyrtki Jet also displays pronounced intraseasonal fluctuation signals (Masumoto et al., 2005; Sengupta et al., 2007; Nagura and McPhaden, 2008; Chatterjee et al., 2013; Moum et al., 2014; Chen et al., 2019). Thanks to the deployment of the RAMA buoy array (Mcphaden et al., 2009), long-term on-site observation data in the EIO have been collected, with two buoys located at 0°N, 80.5°E and 0°N, 90°E respectively. In order to obtain the period of ISVs, this paper conducted EMD on the vertical average zonal current above 30m and calculated the significant periods of the Intrinsic Mode Functions (IMFs) obtained from the decomposition (Table 1). Due to equipment failure during the observation period, there are missing measurements at both buoy stations. Therefore, the data from each station was divided into two separate segments for decomposition: one before and one after the missing measurement period. The first row of data for each station in Table 1 represents the decomposition result of the data before the missing measurement, while the second row represents the decomposition result of the data after the missing measurement. Hilbert spectral energy time series of the IMFs at intraseasonal timescale were plotted to capture the fluctuation characteristics of Wyrtki Jet ISVs (Figures 1A, C). Furthermore, the seasonality in Wyrtki Jet ISVs was revealed by calculating the monthly average value of these IMFs’ Hilbert spectral energy (Figures 1B, D). Notably, upper 30m vertical average zonal current at 0°N, 80.5°E revealed significant intraseasonal periods about 22 and 45 days respectively (corresponding to IMF 3 and IMF 4), and the significant intraseasonal period at 0°N, 90°E is about 18 and 43 days (corresponding to IMF 3 and IMF 4). Given that the surface current in the EIO will be affected by equatorial Kelvin wave, Rossby wave and wave resonance at the same time (Han et al., 1999; Nagura and McPhaden, 2010; Chen et al., 2015), the periodic characteristics of these two buyos are slightly different. Considering that the significant period of IMF3 for 90°E is close to 20 days, which is the lower period limit of the ISVs defined in this paper, we also include this IMF in the ISVs components. It can be seen that both points exhibit a clear seasonal difference in the energy of ISVs, with stronger ISVs in spring than those in fall (Figures 1B, D).
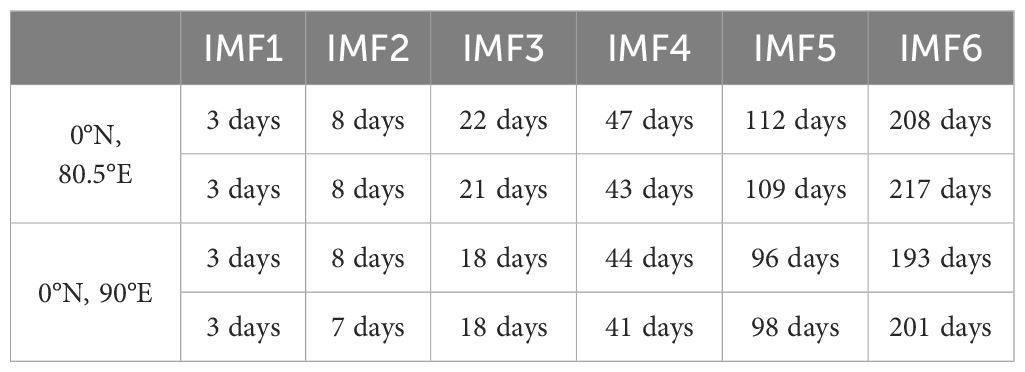
Table 1. The IMF periods obtained through EMD of the vertical average zonal current above 30m from buoys located at 0°N, 80.5°E and 0°N, 90°E (The first and second row for each buoy station represents the decomposition results of the data before and after the missing observations respectively).
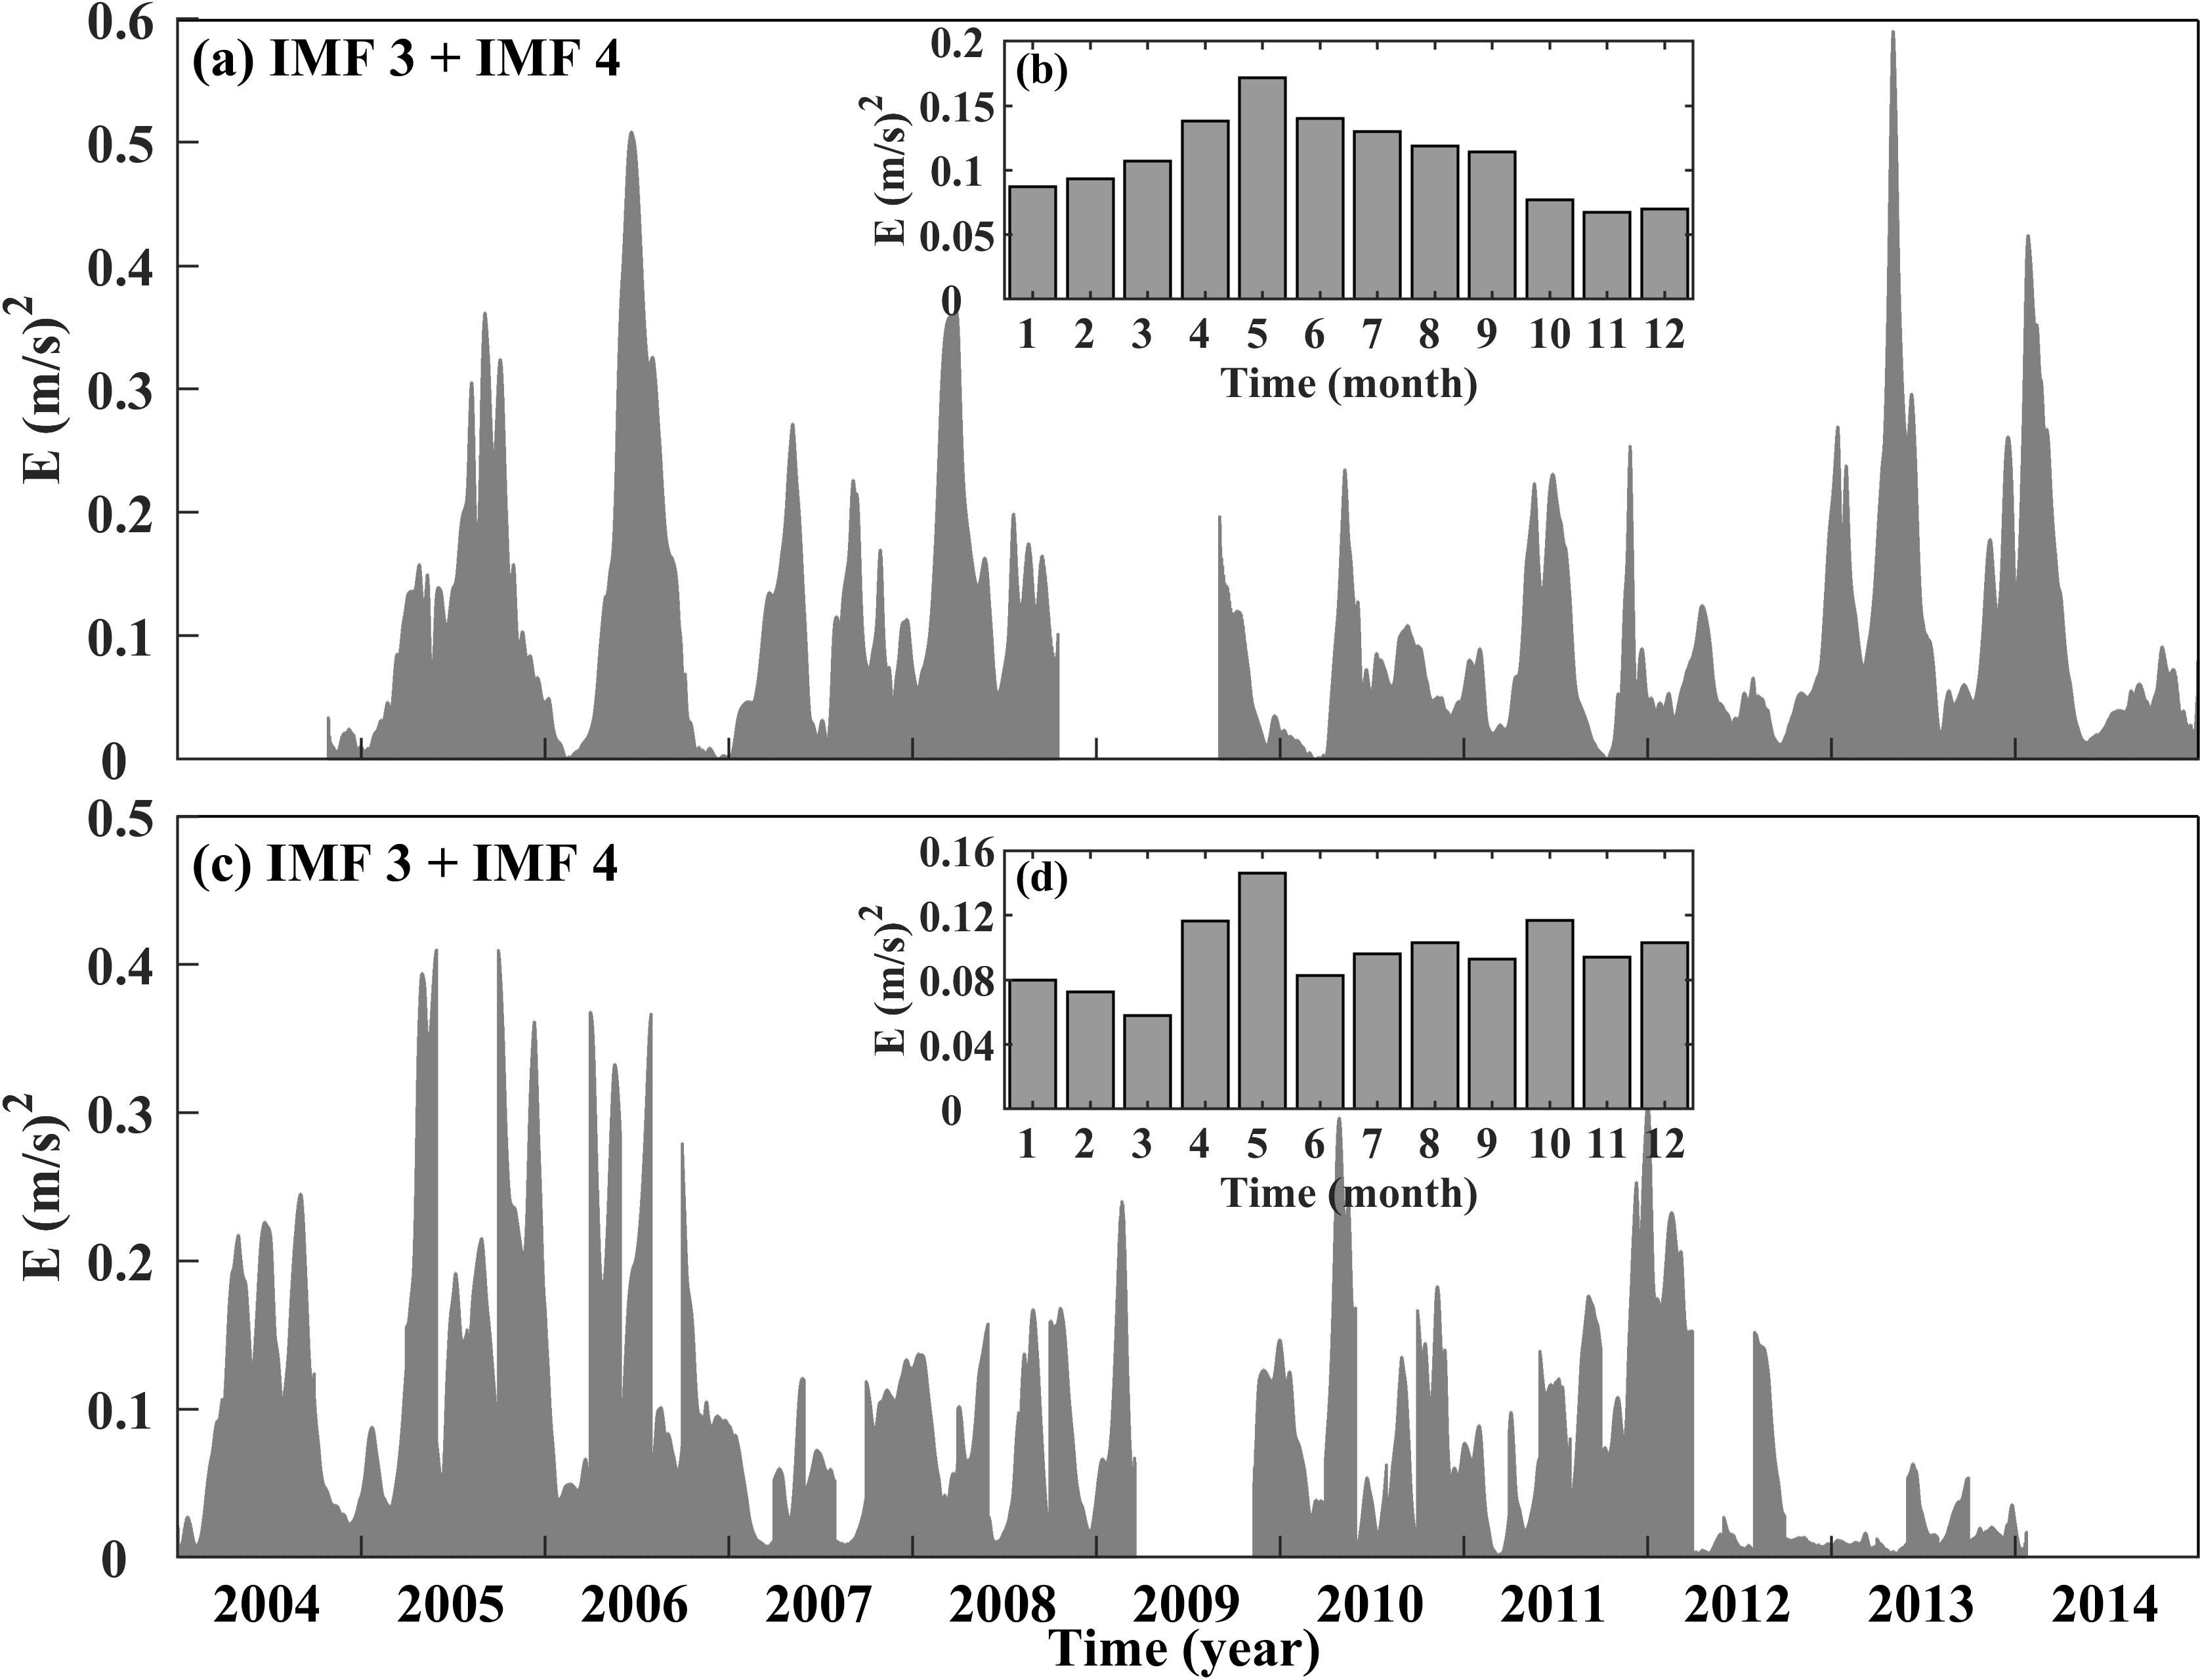
Figure 1. (A) Hilbert spectral energy of IMF 3 + IMF 4 decomposed from the time series of vertical average zonal current above 30m located at 0°N, 80.5°E, (B) represents the monthly average value of spectral energy, (C, D) Same as (A, B), but for IMF 4 spectral energy series and monthly average value at 0°N, 90°E.
Summarizing previous research findings on the Wyrtki Jet, it is evident that majority studies have focused on its seasonal variations, with relatively less attention paid to its ISVs, especially the seasonal differences of ISVs. This is partly due to the most pronounced seasonal variation characteristics of the Wyrtki Jet, and partly due to the limited temporal resolution of data, which makes analysis of ISVs relatively challenging. Considering that the measured data only covers a few stations and a relatively short period of time, to further clarify the ISVs of the Wyrtki Jet, the study also incorporated HYCOM data for supplementary analysis. Prior to its use, the accuracy of HYCOM data in revealing Wyrtki Jet ISVs was first verified. The vertical average surface zonal current at buoy stations located at 0°N, 80.5°E and 0°N, 90°E in the model dataset underwent a 20–90-day band-pass filtering process (black line in Figures 2A, B), and were compared with the data from corresponding RAMA buoy observation points (red line in Figures 2A, B). The comparison results showed that the characteristics of ISVs presented by these two datasets are very similar. The correlation coefficients of the intraseasonal time series of surface zonal current revealed by these two datasets at 0°N, 80.5°E and 0°N, 90°E are 0.68 and 0.58, respectively, both passing the statistical significance test with a confidence level of 95%. Additionally, the standard deviations of the ISVs revealed in HYCOM and RAMA data at 0°N, 80.5°E are 0.18 m/s and 0.17 m/s, respectively. While at 0°N, 90°E, the standard deviations calculated on the basis of these two datasets are 0.19 m/s and 0.18 m/s, respectively. This comparison result indicates that the HYCOM numerical model data can accurately reveal the Wyrtki Jet ISVs. Furthermore, the intraseasonal signals of surface zonal current revealed in the HYCOM dataset also exhibit the same seasonal variation characteristics as the RAMA buoy measured data, that is, the intraseasonal signals are stronger in spring than those in fall (Figures 2C, D).
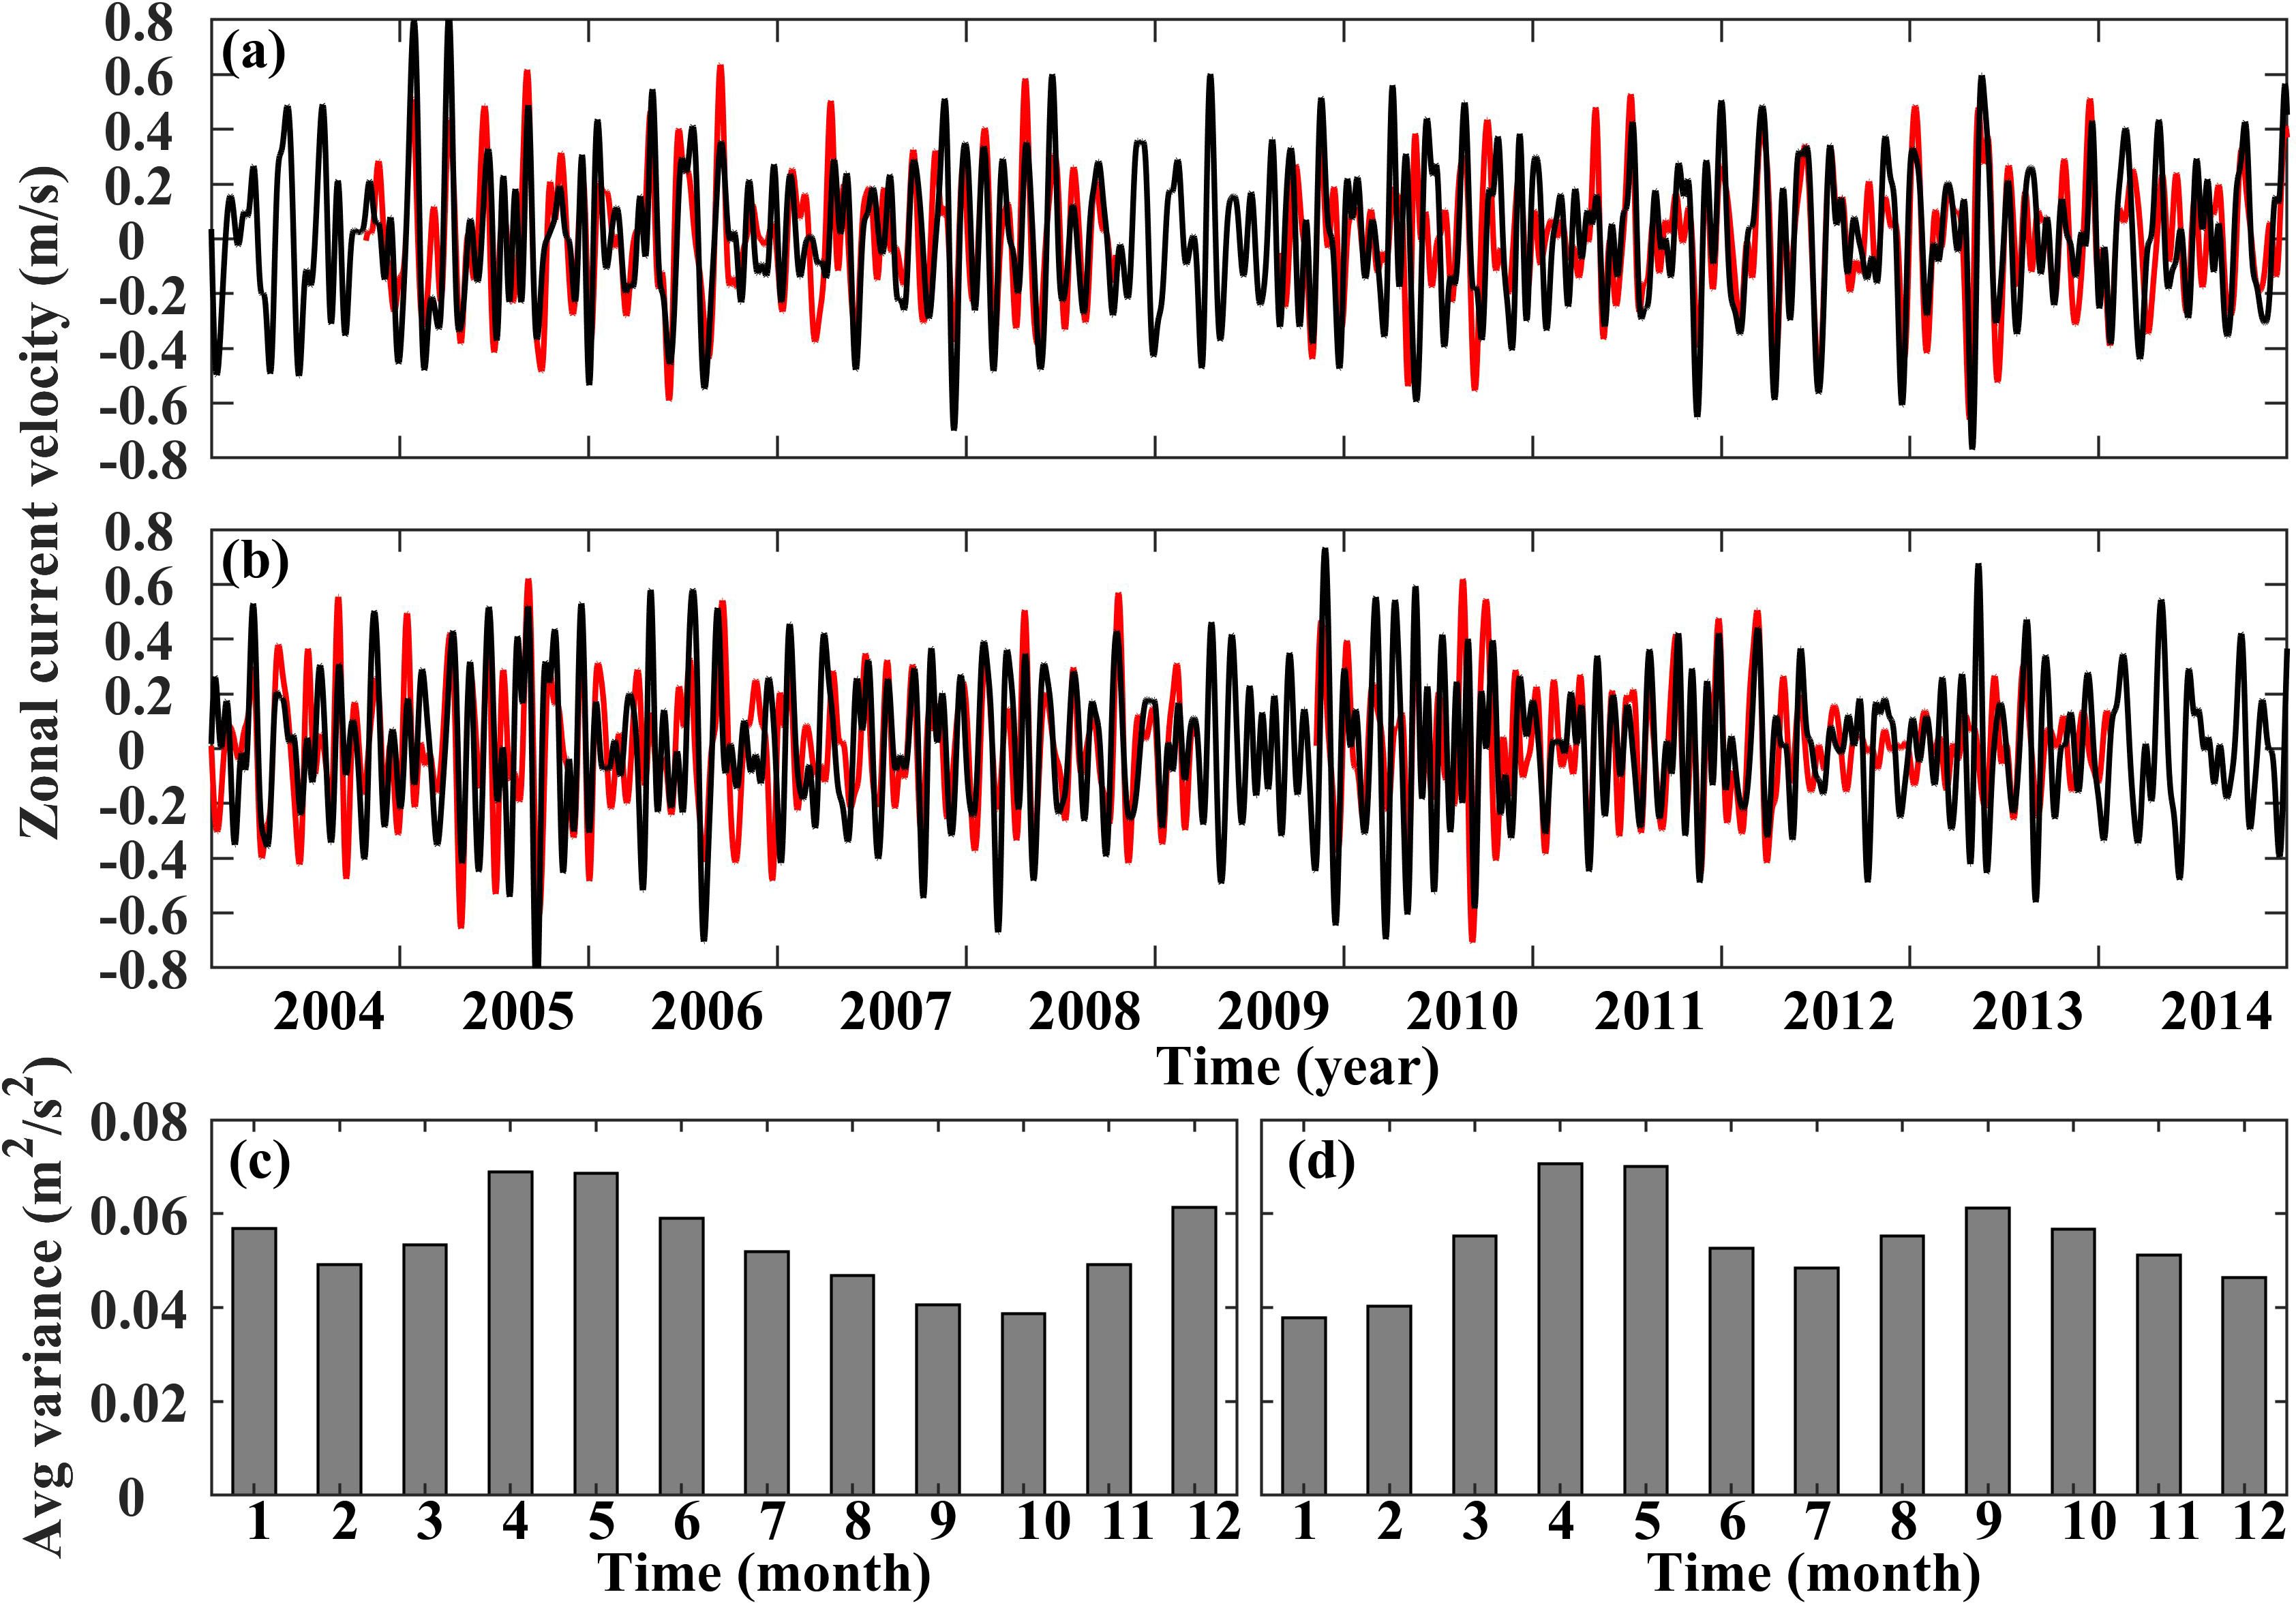
Figure 2. (A) The time series of 0-30m-averaged zonal current (20–90-day bandpass filtered) from HYCOM (black line) dataset and RAMA buoy measurement (red line) at 0°N, 80.5°E. (C) Seasonal variation of the averaged wavelet power variance on 20–90-day band of HYCOM data in (A). (B, D) Same as (A, C), but for the results at 0°N, 90°E.
Previous comparisons have confirmed that HYCOM data can accurately capture the ISVs of the surface zonal current in the EIO. Whether this dataset can well reproduce the horizontal distribution characteristics of the Wyrtki Jet ISVs has also been verified. The validation uses satellite observation data from OSCAR dataset. Considering that the surface current in OSCAR dataset is the average value of the surface current above upper 30m, the surface current from HYCOM dataset is also selected as the average above the upper 30m for comparison. The comparison results show that HYCOM data can accurately simulate the intensity and horizontal distribution characteristics of the Wyrtki Jet ISVs in both spring and fall. First of all, the regions with strong Wyrtki Jet ISVs presented by these two datasets are similar (black box in Figure 3). Secondly, the correlation coefficients of time series averaged in this region calculated on the basis of these two datasets are 0.88 (spring) and 0.76 (fall) respectively, and the correlation degree in other regions is also relatively high. Based on the above data verification results, HYCOM data can not only accurately simulate the ISVs of surface zonal current in the EIO and its surrounding regions, but also accurately reproduce the seasonal differences of these ISVs. In addition, as shown in Figure 3, the ISVs of Wyrtki Jet in spring and fall differ greatly in terms of horizontal distribution characteristics and intensity. The Wyrtki Jet ISVs are stronger in spring than those in fall, and the standard deviation of the Wyrtki Jet ISVs in spring can reach 0.25m/s, while the maximum value in fall is only 0.2m/s. In order to obtain the seasonal differences of the vertical distribution characteristics of the Wyrtki Jet ISVs, the longitude-depth profiles of the intraseasonal signal standard deviation are compared. This paper selected the average value between 2°S-2°N latitude range as the index of surface zonal current in Figure 4 to more accurately reflect the total energy changes of Wyrtki Jet. The comparison results also reflect the significant seasonal difference of the Wyrtki Jet ISVs, that is, the ISVs of the Wyrtki Jet in the range of 80°E-90°E are significantly stronger in spring than those in fall. In addition, the seasonal differences of Wyrtki Jet ISVs have obvious vertical variation, which is most obvious in the range of upper 30m. In spring, the standard deviations of the zonal current ISVs in the range of upper 30m are basically between 0.2m/s and 0.25m/s, while in fall, those values are basically below 0.2m/s (Figure 4).
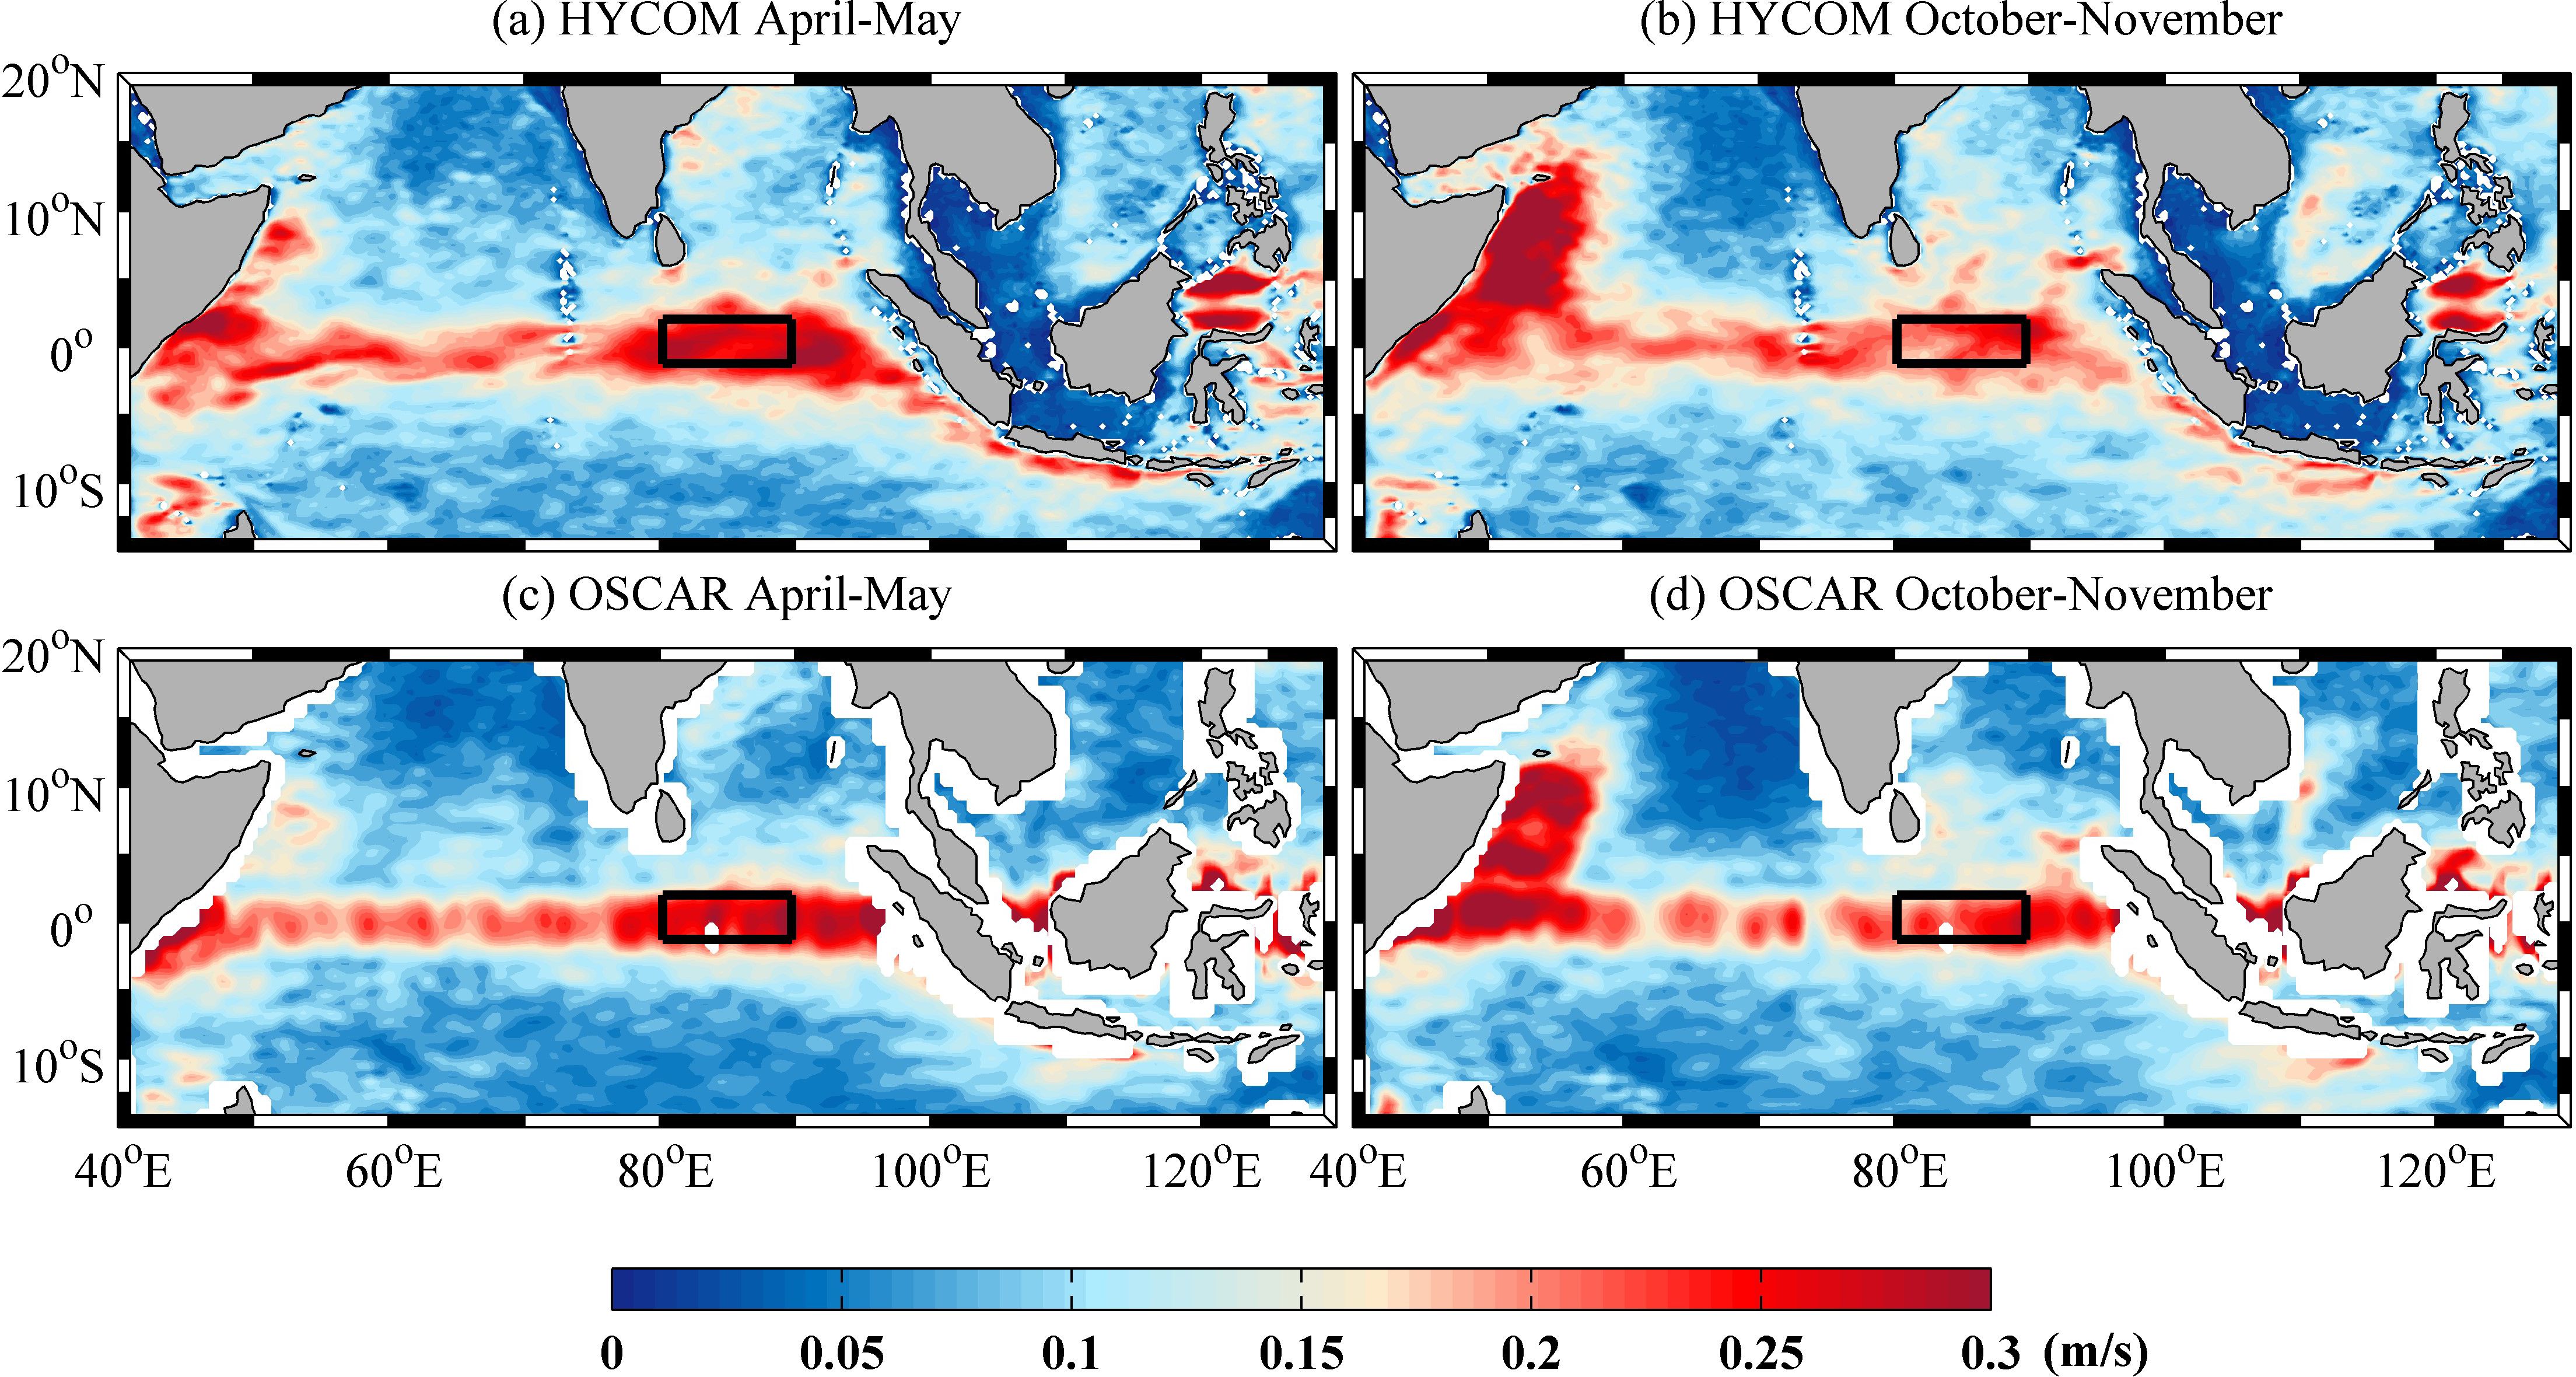
Figure 3. Standard deviation of intraseasonal surface zonal current during boreal spring (April-May) and fall (October-November). (A, B) Represent results from HYCOM dataset and (C, D) represent results from OSCAR dataset. Black boxes indicate areas with prominent ISVs in both spring and fall Wyrtki Jet.

Figure 4. The longitude-depth profile of the standard deviation of 2°S–2°N-averaged intraseasonal zonal current during (A) boreal spring and (B) boreal fall.
To delve deeper into the generation process of the Wyrtki Jet ISVs, this study conducted composite analyses of the surface zonal wind (SZW), SLA and surface zonal current at various layers before and after the occurrence of the positive Wyrtki Jet abnormal events, which are illustrated in Figures 5, 6. The Wyrtki Jet here takes the mean value of the 0-30m-averaged zonal current among the region with the strongest ISVs in Figure 3 as the index. Figure 5 shows the lag correlations of intraseasonal SLA and SZW in the EIO and its surrounding regions with Wyrtki Jet. As shown in Figure 5, 15-20 days before the Wyrtki Jet ISVs reach the peak, the western EIO begins to show the westerlies and positive SLAs (Figures 5A, B). With the evolution of the intraseasonal event, the westerlies that originally appeared only in the western EIO also gradually expand to the central and eastern EIO. With the eastward propagation of the westerlies, the positive SLAs also propagate eastward (Figures 5C, D). Under the condition of zero lag, the maximum westerlies and positive SLAs reach the southwestern coast of Sumatra Island (Figure 5E). In the next 5 days, the signals of westerlies and positive SLAs propagate southward and northward separately from the equator (Figure 5F). With the sea surface westerlies turning into easterlies, the positive SLAs propagating along the southwestern coast of Sumatra-Java Island also gradually attenuated, and the Wyrtki Jet intraseasonal event ended (Figures 5G, H).
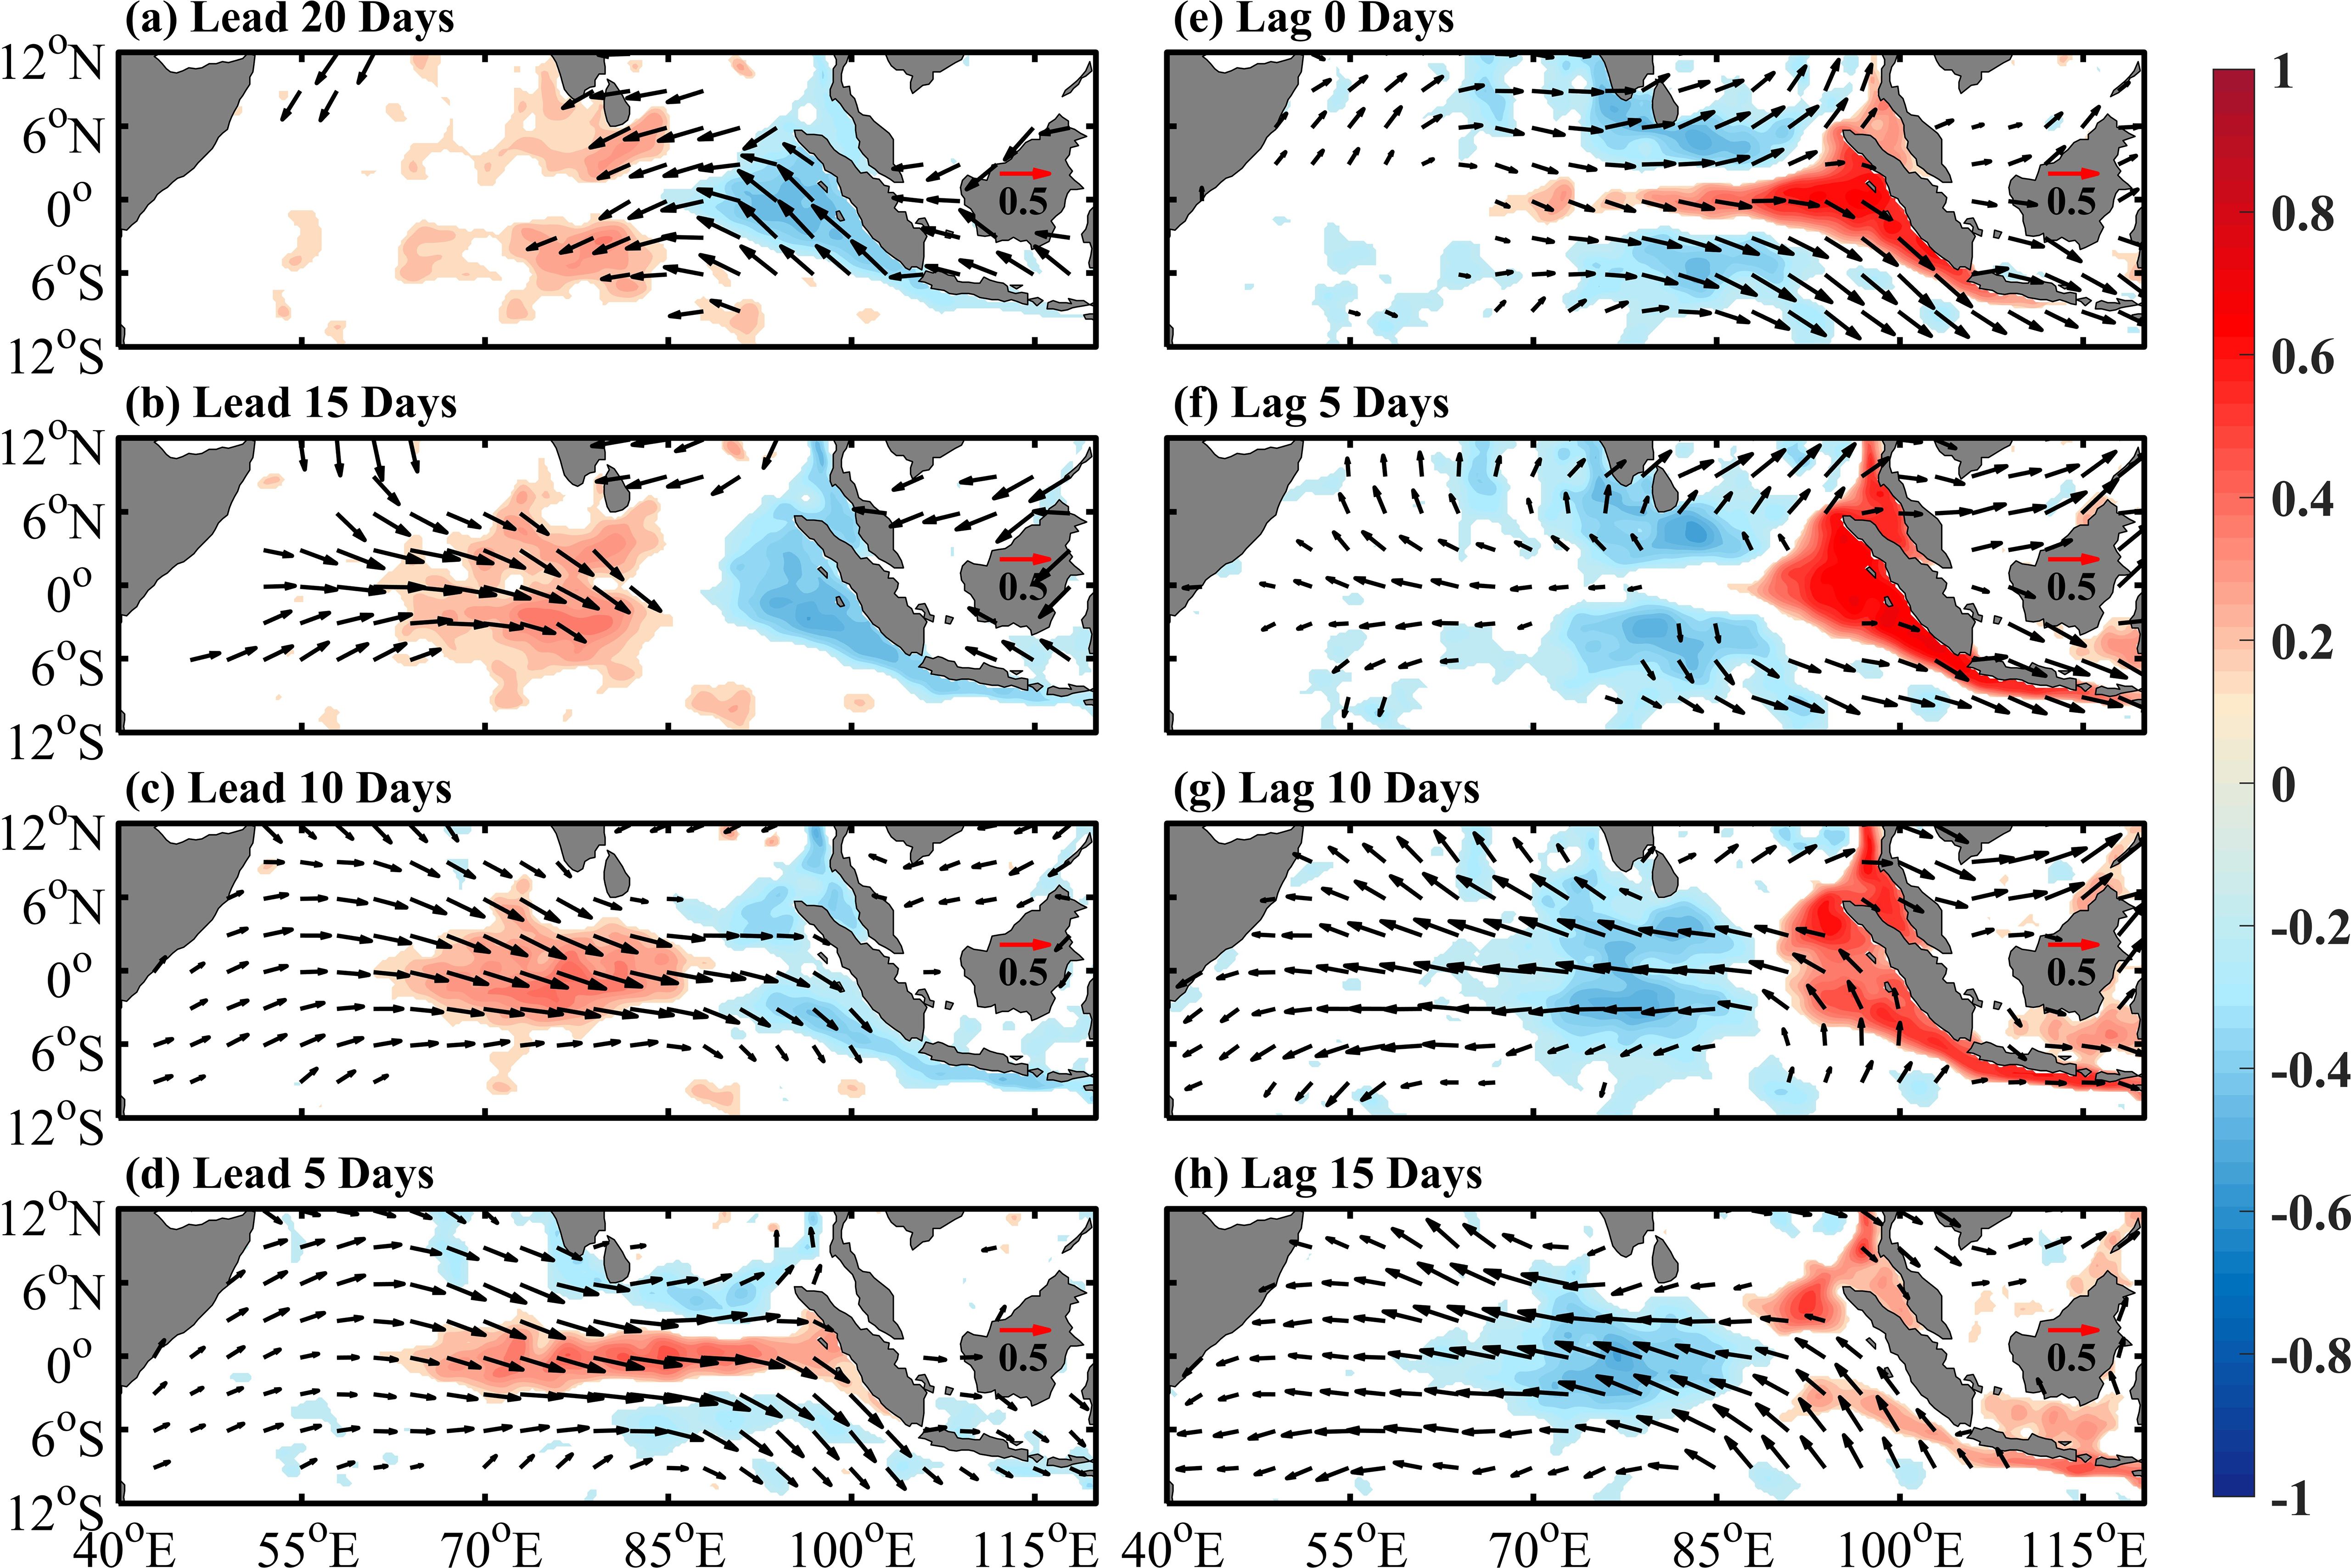
Figure 5. Lag correlation of intraseasonal SLA and SZW in the EIO and surrounding seas with Wyrtki Jet (take the 0-30m-averaged zonal current among the black box in Figure 3 as the index). (A–H) Successively depict the evolution of correlation coefficients of SZW and SLA from 20 days ahead of Wyrtki Jet to 15 days behind Wyrtki Jet. Shading indicates correlation above the 95% confidence level.

Figure 6. The lead lag correlation coefficient between the zonal flow and Wyrtki Jet in each layer at intraseasonal timescale (20-90 day band), and only the part that can pass the 95% confidence test is retained in the figure.
For a continuously stratified ocean, if the disturbance propagates in the form of Kelvin waves, the vertical propagation velocity of the disturbance signal can be expressed as:
Where, ω is the Kelvin wave frequency, and N(z) is the Brunt-väisälä frequency. For intraseasonal signals with a period of 20-90 days, when propagating as Kelvin waves of the first and second baroclinic modes, the wave velocity is 1.5-2.9 m/s, and the estimated vertical propagation velocity is about 15-133 m/d. As shown in Figure 6, before the Wyrtki Jet intraseasonal event, the intraseasonal zonal flow in the area where the jet occurred shows obvious vertical upward phase propagation characteristics, and its vertical upward propagation speed is estimated to be 16 m/d, which is within the range of theoretical evaluation. The composite analysis results in Figures 5, 6 show that the Wyrtki Jet ISVs are not only locally forced by the zonal wind on the sea surface, but also regulated by the propagation of oceanic waves from the deep ocean, and their seasonal differences are also the result of the joint action of these two factors.
4 Impact of seasonality in Wyrtki Jet ISVs on surrounding regions
Previous studies (Masumoto et al., 2005; Iskandar and McPhaden, 2011; Nagura and McPhaden, 2012; Han et al., 2017) and the above results have confirmed that the intraseasonal signals of surface currents in the EIO will propagate eastward in the form of equatorial Kelvin waves, affecting the Maritime Continent in the eastern Indian Ocean. The propagation path of Kelvin waves is shown by the white line in Figure 7. However, the impact of the seasonal differences of the Wyrtki Jet ISVs on the oceanic ISVs along the southern coast of Sumatra-Java Island has not been discussed in previous studies. As can be seen from Figure 7, SLA along the southern coast of Sumatra-Java Island has significant ISVs, with variance values exceeding 32 cm². Therefore, this paper takes the intraseasonal SLA signal as a representative of oceanic ISVs, and makes an in-depth analysis of the impact of the seasonality in the Wyrtki Jet ISVs on the southern coast of the island chain. In addition, it should be noted that although the intraseasonal SLA signal in the tropical southeast Indian Ocean (95°-120°E, 10°-12°S) is also strong, which can reach more than 40 cm2, previous studies have shown that the intraseasonal SLA signal here is generated and controlled by the baroclinic instability of the South Equatorial Current, which is different from the generation and influence mechanism of the Wyrtki Jet ISVs and the intraseasonal SLAs along the island chain that we are concerned about, so we have not involved in the intraseasonal SLA signal among this area in the subsequent studies.
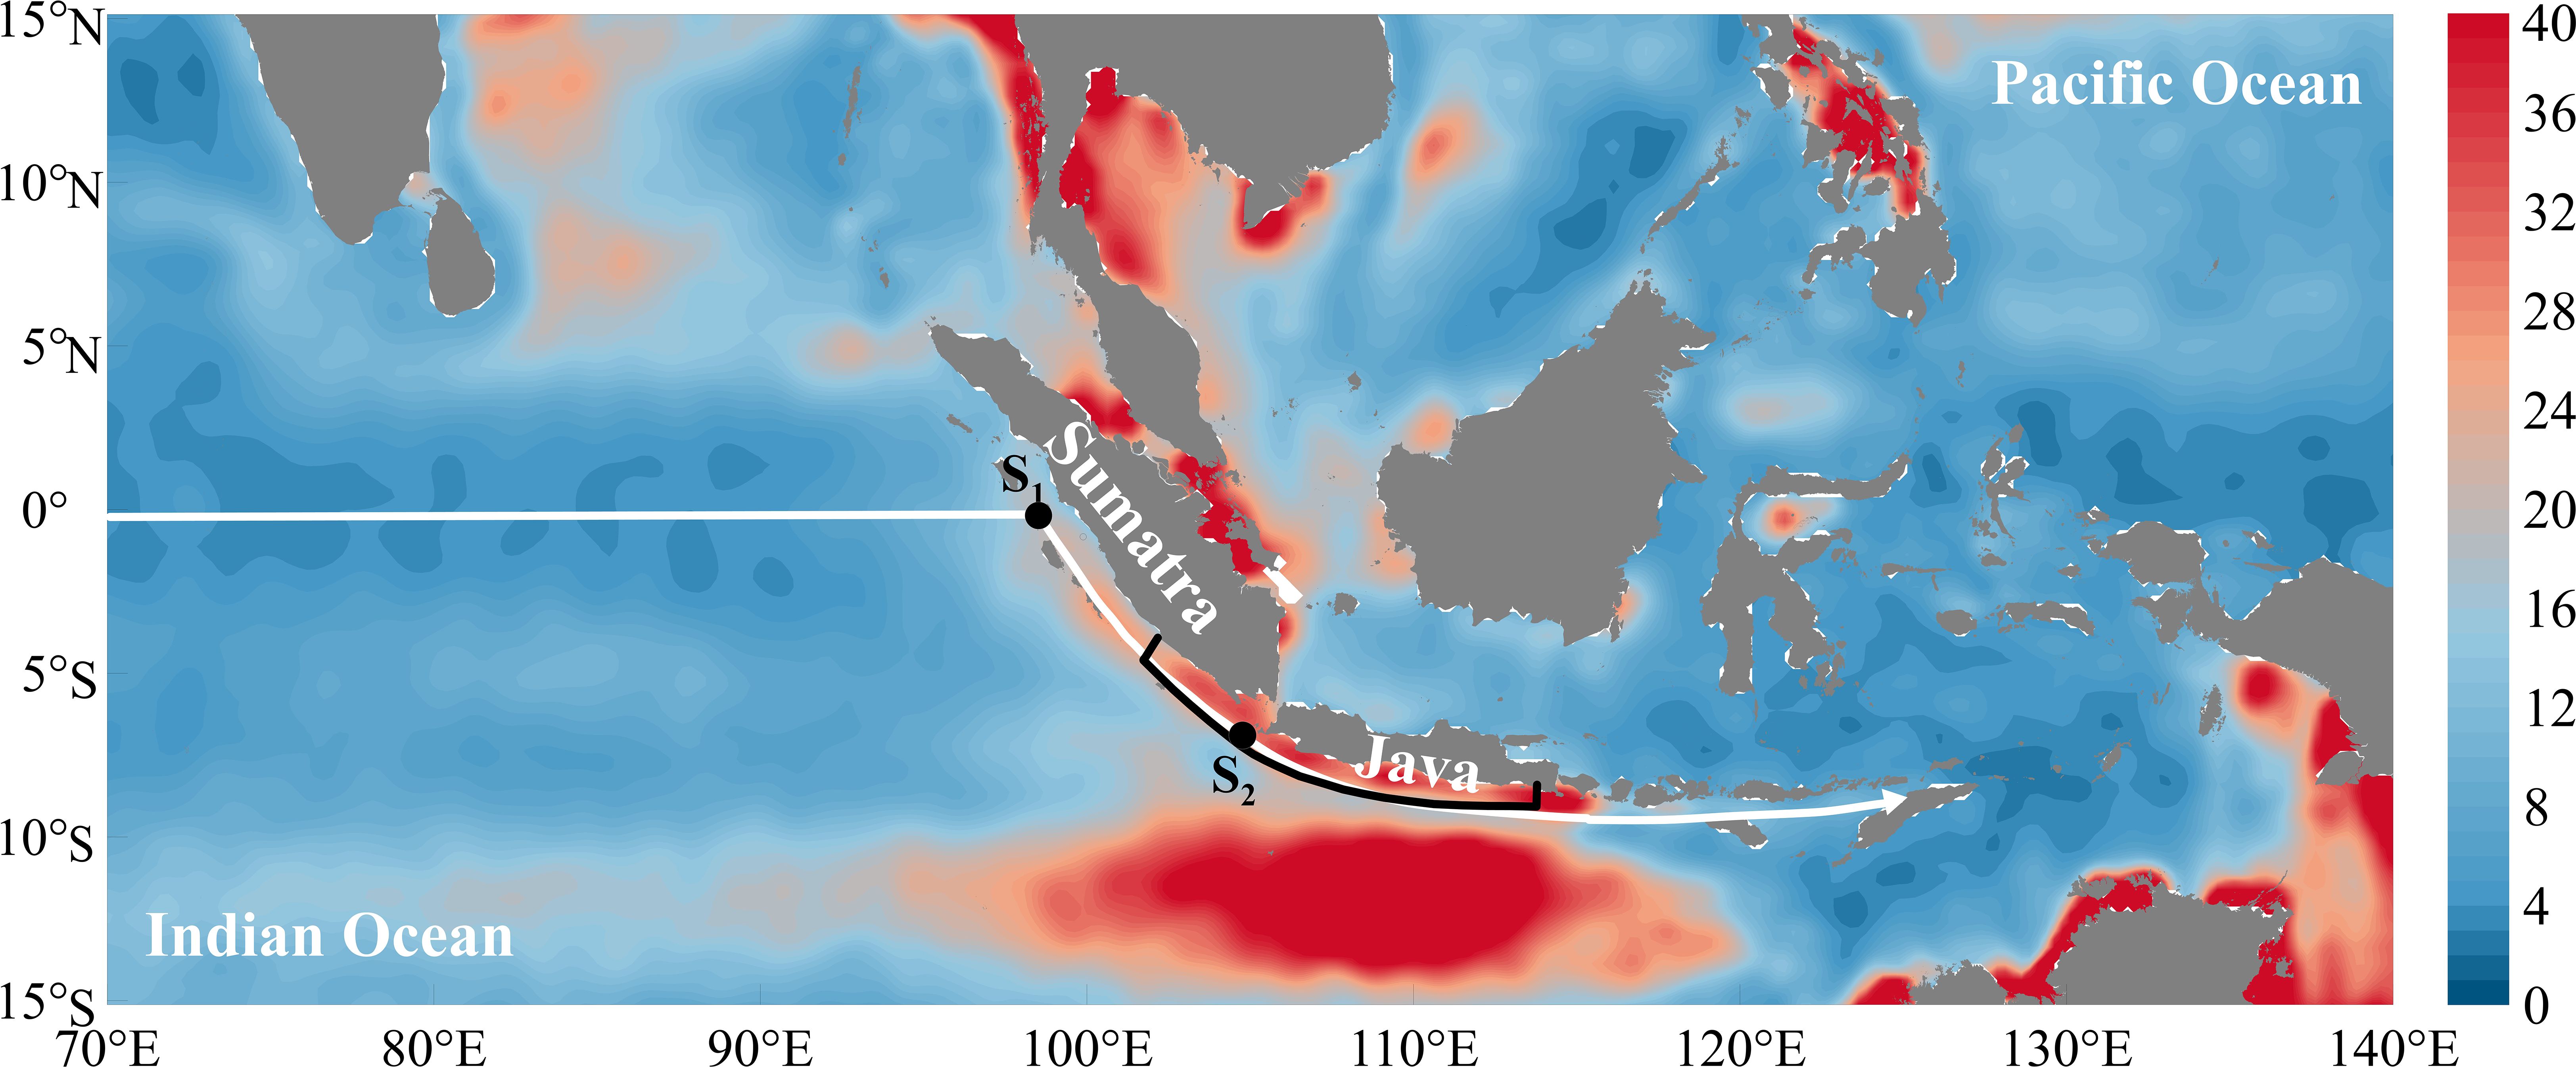
Figure 7. Horizontal distribution of the variance of intraseasonal SLAs (20-90-day band-pass filtered) in the eastern EIO and its surrounding seas based on AVISO data (unit: cm2). White line shows waveguide of Kelvin waves and black boxes highlight the areas with remarkable intraseasonal SLA signals along the southern coast of Sumatra-Java Island.
To understand the characteristics of intraseasonal SLAs along the southern coast of the Sumatra-Java Island, the research first employed wavelet analysis on the regional average intraseasonal SLAs (i.e., the average value within the black box in Figure 7), with the results depicted in Figure 8. It can be seen that the intensity of intraseasonal SLA signals along the southern coast of Sumatra-Java Island show obvious seasonal variation characteristics, specifically as follows: the intraseasonal SLA signals in boreal spring is stronger than those in boreal fall. In addition, the results of power spectrum analysis show that the significant periods of intraseasonal SLAs in this region are 30 days and 52 days respectively, which are similar to the periods of Wyrtki Jet ISVs. The separate power spectrum analysis results of spring and fall show that there are some differences in the significant periods of intraseasonal SLAs, that is, the intraseasonal SLAs in 30-40 day band in spring are significantly stronger than those in fall (figures not shown).
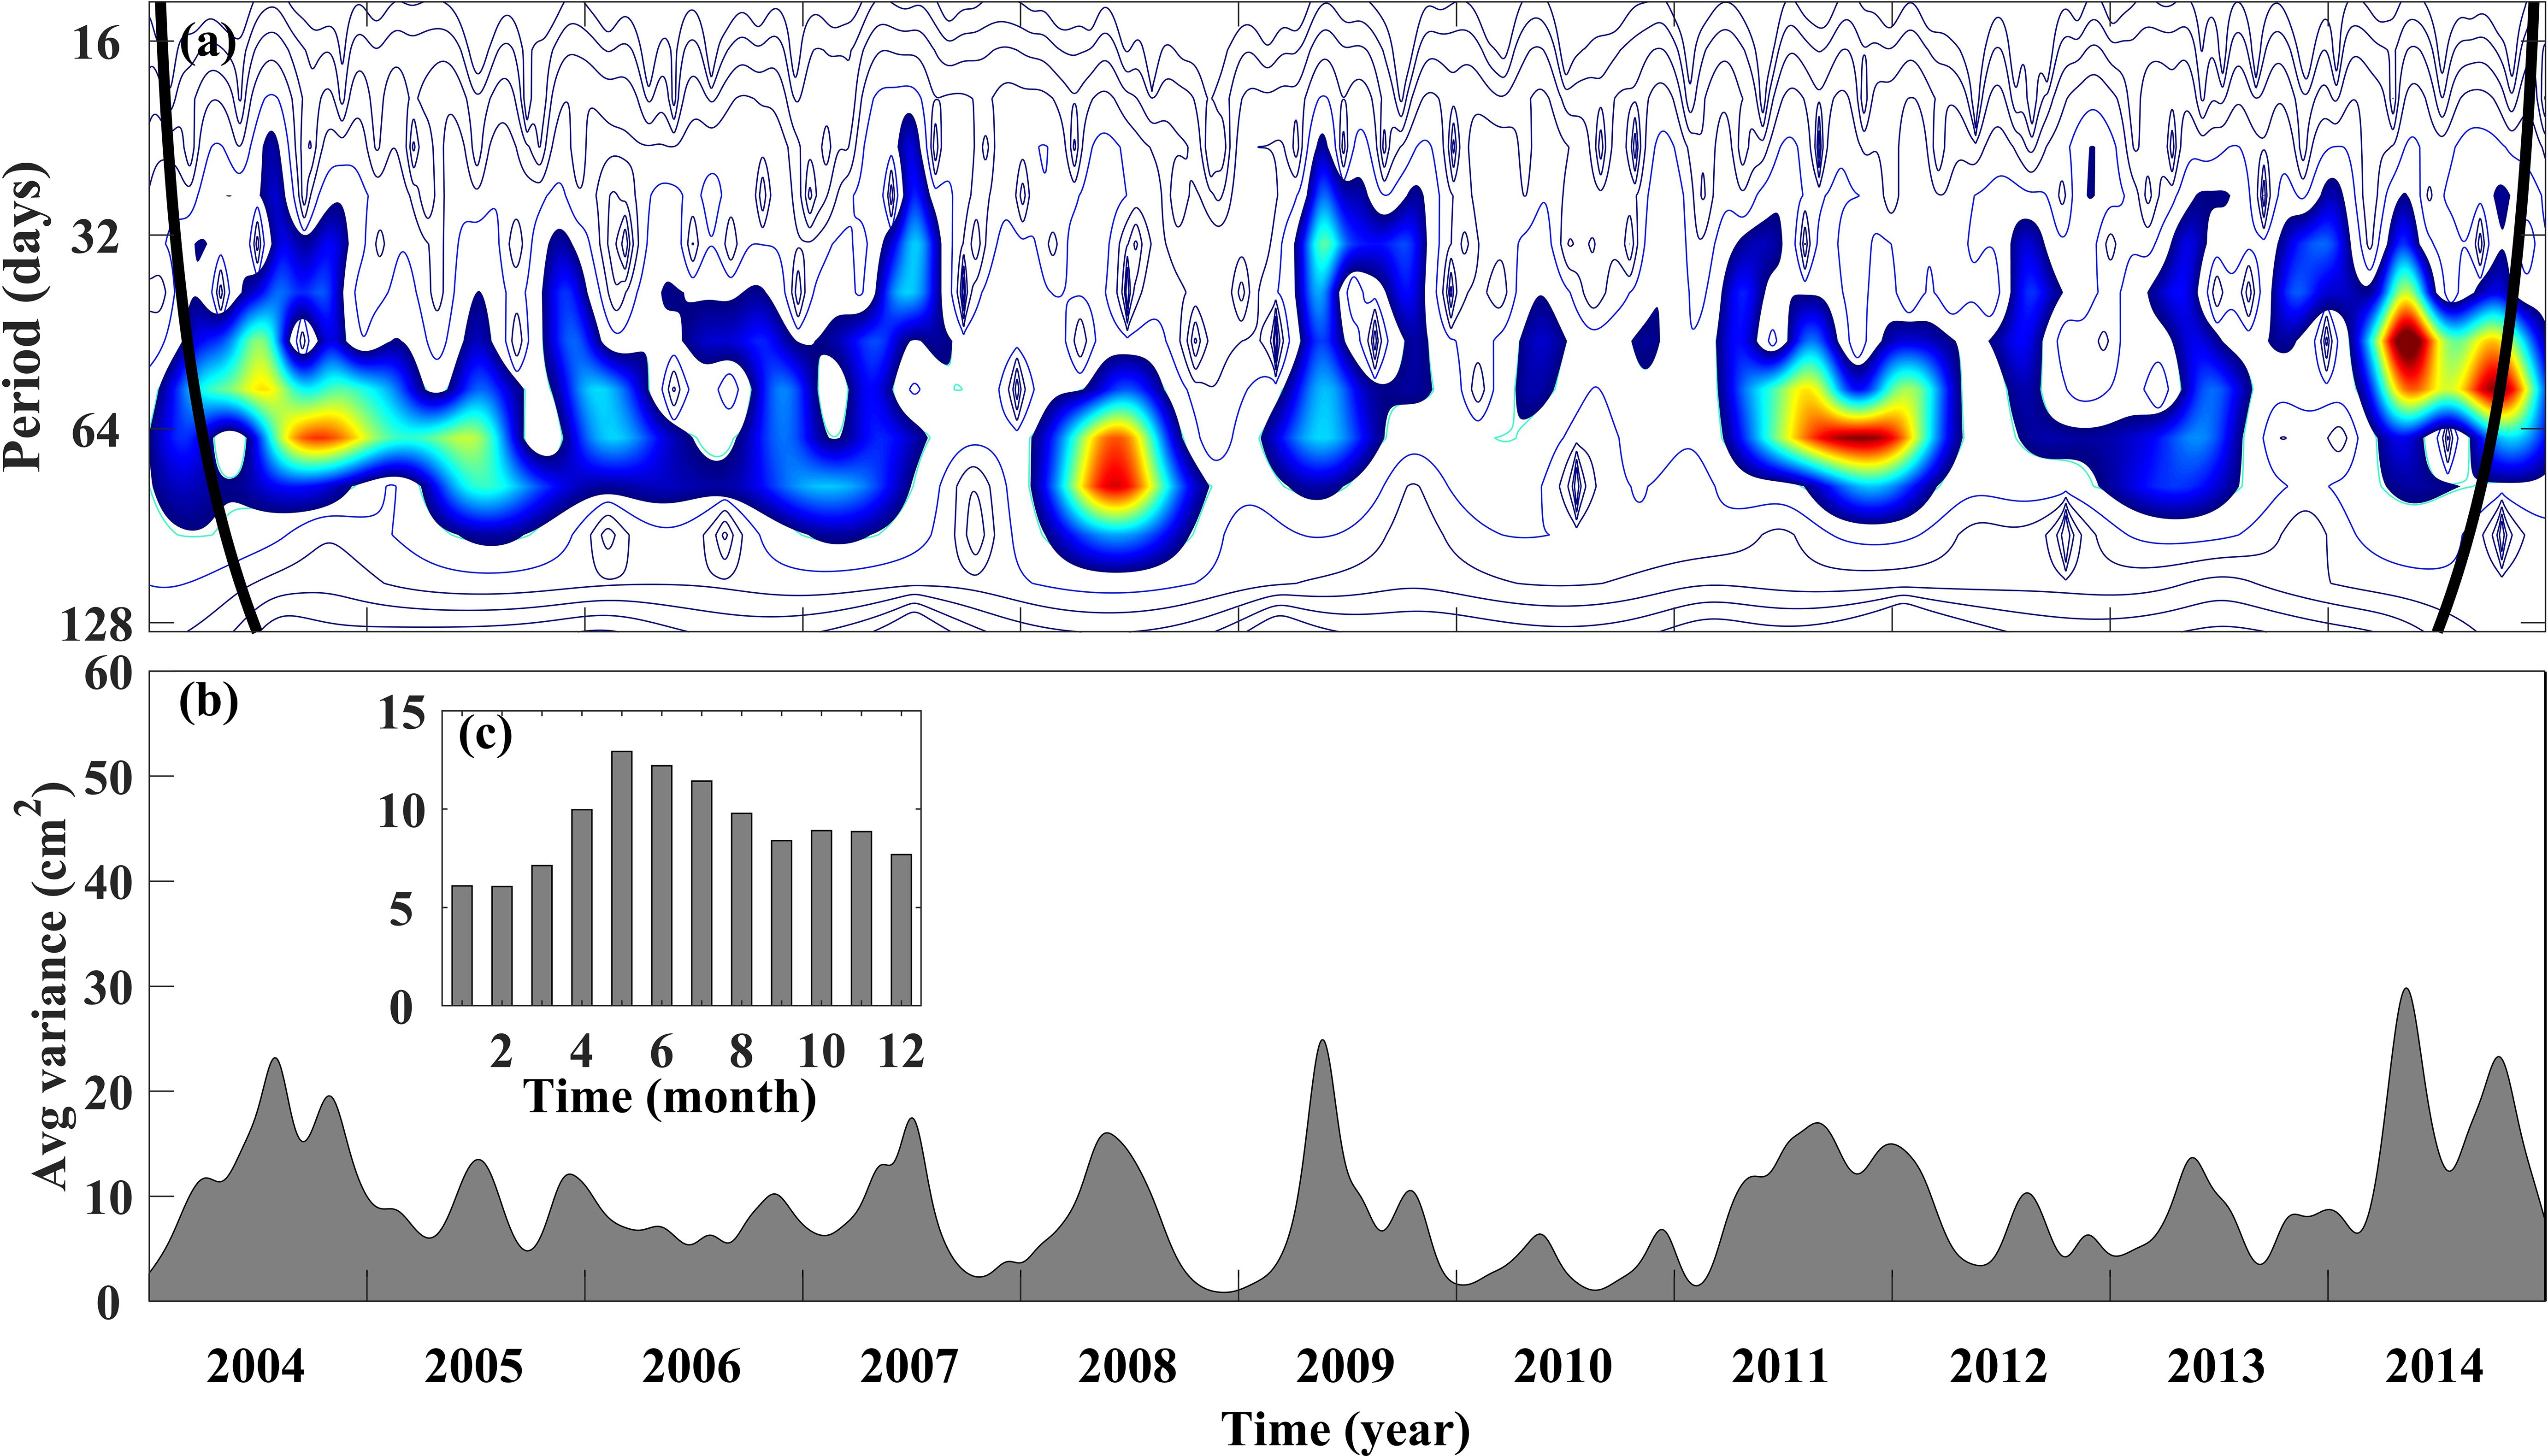
Figure 8. (A) Wavelet power spectrum of the domain‐averaged intraseasonal SLAs from AVISO; periods above the 95% confidence level are shaded; the thick lines indicate the maximum resolvable periods. (B) The 20–90‐day averaged variance of the wavelet power. (C) Monthly mean of averaged variance in (B).
The evolution map of the lead lag correlation coefficients between the intraseasonal sea surface zonal current over the entire tropical Indian Ocean and the intraseasonal SLAs along the southern coast of Sumatra-Java Island is shown in Figure 9. It is obvious that there is a significant correlation between the intraseasonal SLAs along the southern coast of the island chain and the intraseasonal sea surface zonal current within the EIO in both spring and fall. However, there are obvious seasonal differences in this correlation. Specifically, the intraseasonal sea surface zonal current which can affect the intraseasonal SLAs along the southern coast of Sumatra-Java Island, starts to move eastward about 15 days before the intraseasonal SLAs reach the positive peak in fall, and the starting position can be traced back to around 60°E (Figure 9F). While in spring, the intraseasonal signal of the sea surface zonal current starts to move eastward from the position near 75°E about 10 days before the positive peak of intraseasonal SLAs (Figure 9B). In addition, the coastal zonal current that begins to affect the intraseasonal SLAs along the southern coast of Sumatra-Java Island about 5 days before the positive peak of intraseasonal SLAs in spring is stronger than that in fall at the same time period (Figures 9C, D, H, I). From the evolution map of correlation coefficients, it can be seen that after the intraseasonal SLAs peak, the intraseasonal zonal current along the island chain rapidly declines to disappear within 5 days both in spring and fall (Figures 9E, J).
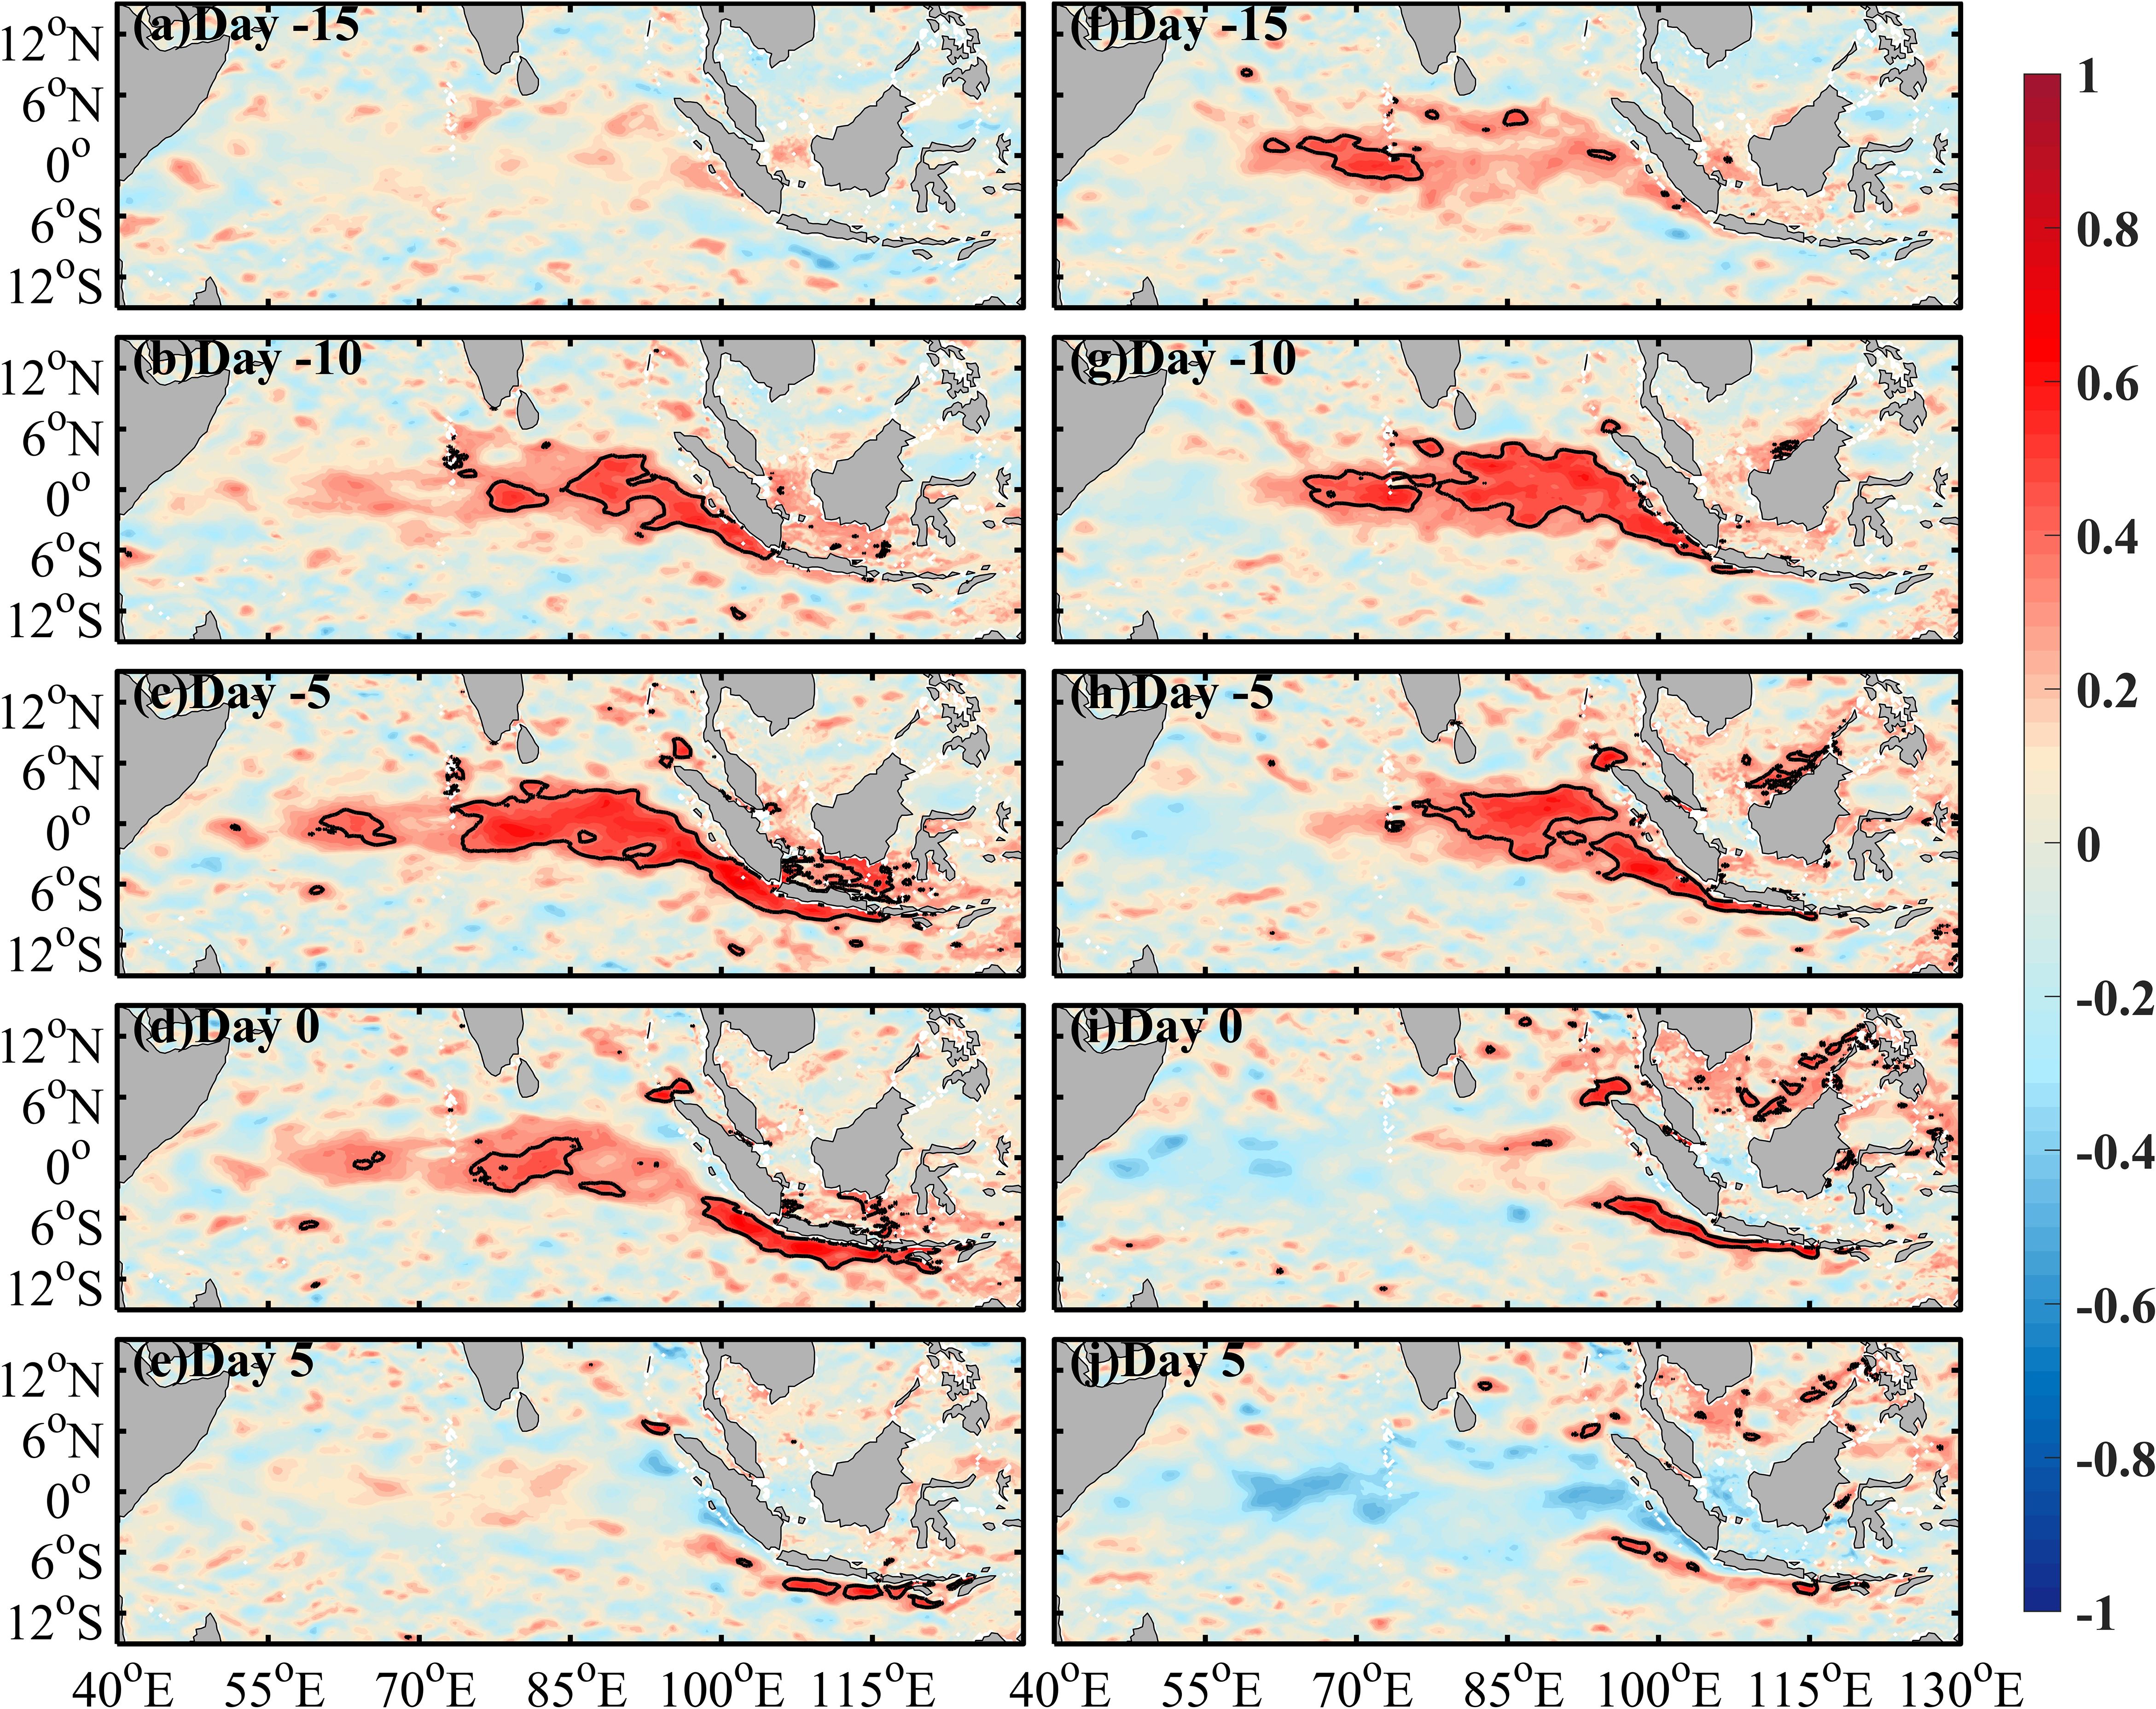
Figure 9. Correlation of intraseasonal SLAs averaged among the southern coast of Sumatra-Java Island (black box in Figure 7) with intraseasonal sea surface zonal current (0-30m-averaged zonal current) in the EIO and surrounding seas. (A–E) Represent the correlation coefficients when the intraseasonal current is 15 days ahead of the intraseasonal SLAs to 5 days behind in spring. (F–J) Same as (A–E), but for results in fall, black line indicates correlation above the 95% confidence level.
The current consensus is that the intraseasonal SLAs along the southern coast of the Sumatra-Java Island are influenced by both the remote wind forcing among the EIO and the local wind forcing along the coast of the island (Chen et al., 2016; Deshpande et al., 2017; Cao et al., 2018; Deng et al., 2021). To compare the differences of the intraseasonal SLAs in spring and fall as well as their relationship with surface wind forcing, this paper synthetically analyzed the propagation process of intraseasonal SLAs positive abnormal events along the waveguide of Kelvin waves (the white line in Figure 7) during spring and fall. The Hovmöller composite plots clearly show the propagation characteristics of intraseasonal signals from the equator to the southern coast of Sumatra-Java Island (Figure 10). Compared with intraseasonal signals in fall, the values of intraseasonal SLAs are relatively high in both the EIO and the coast of the island chain. The difference of these two seasons is 4-6 cm in the EIO and more than 8 cm along the southern coast of Sumatra-Java Island. Corresponding to the positive intraseasonal SLAs, both the EIO and the southern coast of the island chain show intraseasonal westerlies. The comparison of SZW anomalies shows that the westerlies among the eastern EIO in spring is slightly stronger than those in fall, with a difference of more than 0.5 m/s. In addition, the difference between these two seasons is larger along the coast of the island chain, especially along the southern coast of Java Island. The intraseasonal zonal wind along the southern coast of Java in spring is about 2 m/s stronger than that in fall, and these westerlies along the coast generate onshore Ekman transport, which leads to the accumulation of seawater near the shore, resulting in positive intraseasonal SLAs. To sum up, the westerlies among the EIO in spring are stronger than those in fall, and the intensity of the equatorial downwelling Kelvin waves generated by them are also stronger than those in fall. Therefore, when the Kelvin waves propagate to the southern coast of Sumatra-Java Island, the positive intraseasonal SLAs in spring are also stronger. In addition, the westerlies along the coast are also stronger in spring as well, and the stronger onshore Ekman transport caused by the local wind forcing leads to more significant positive intraseasonal SLAs due to the accumulation of seawater near the shore. The combined effects of equatorial and local processes make the intraseasonal SLAs along the southern coast of Sumatra-Java Island stronger in spring than in fall.
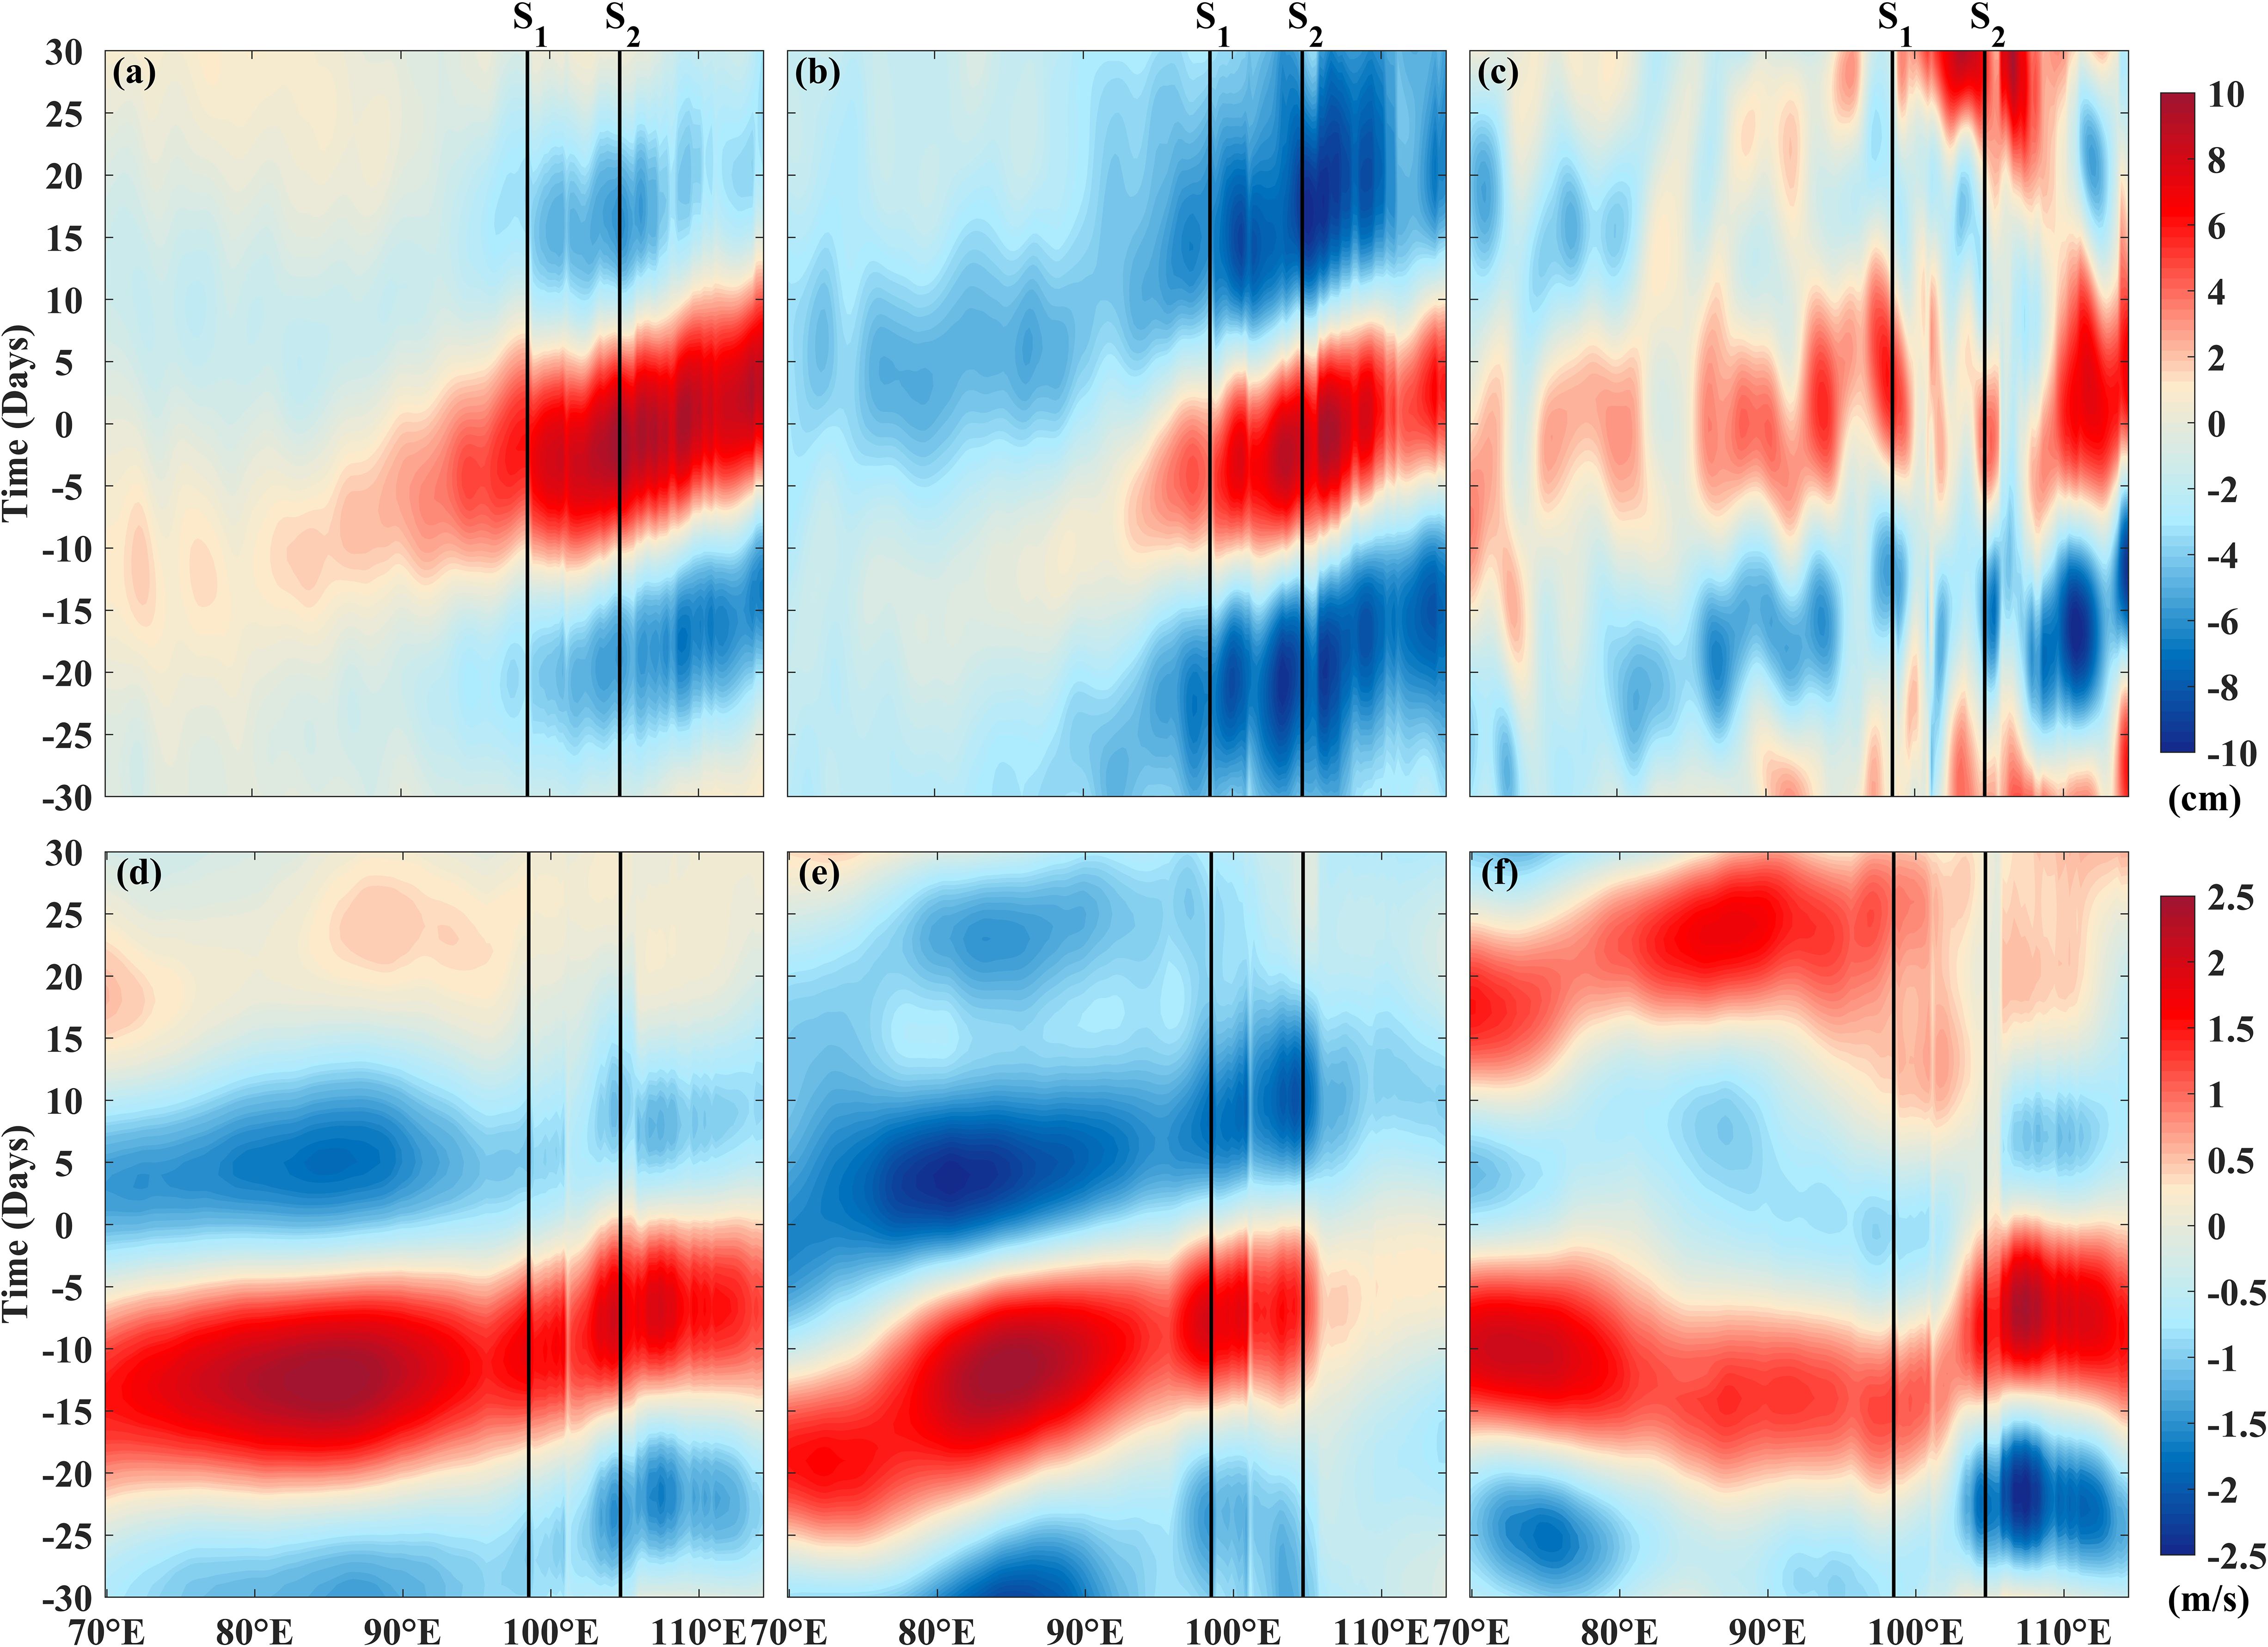
Figure 10. (A) Composite Hovmöller plot of the intraseasonal SLAs along the pathway of intraseasonal SLA signals marked in Figure 7 during boreal spring. (B) Same as (A), but for composite plot during fall. (C) Difference between spring and fall. (D–F) Same as (A–C), but for intraseasonal SZW. Day 0 indicates the positive ISV peaks of the SLAs along the Sumatra-Java southern coast. S1 and S2 indicate the location of the western coast of Sumatra on equator and the Sunda Strait along the pathway.
Based on the correlation analysis in Figure 9, it can be observed that the intraseasonal SLA signals along the southern coast of Sumatra-Java Island are closely related to the Wyrtki Jet ISVs. To further clarify the impact of the seasonal differences in the Wyrtki Jet ISVs on the intraseasonal SLAs along the coast of island chain, this paper also presents the Hovmöller plots of the intraseasonal sea surface zonal current (represented by the 0-30m-averaged zonal current) along the propagation pathway of the Kelvin wave during spring and fall (Figure 11). The composite analyses reflect the results similar to the evolution process reflected by the previous correlation analysis in Figure 9. In spring, the Wyrtki Jet ISVs appear about 10 days before the positive intraseasonal SLAs peak along the southern coast of Sumatra-Java Island, with the starting position of the jet near 75°E. After 10 days, the intraseasonal surface zonal current moves eastward, causing the accumulation of seawater along the island chain and generating the positive intraseasonal SLAs (Figure 11A). While in fall, the Wyrtki Jet ISVs initially appear about 15 days before the positive intraseasonal SLAs peak, with the starting position at 65°E, which is a little west relative to that in spring (Figure 11B). In terms of the surface zonal current’s intensity, in the eastern EIO of 80°E, the Wyrtki Jet ISVs in fall are about 0.2m/s weaker than those in the same period of spring. In addition, the intensity of intraseasonal sea surface zonal current along the island chain in fall is slightly weaker than that in spring, with a difference value about 0.1-0.2 m/s (Figure 11C).
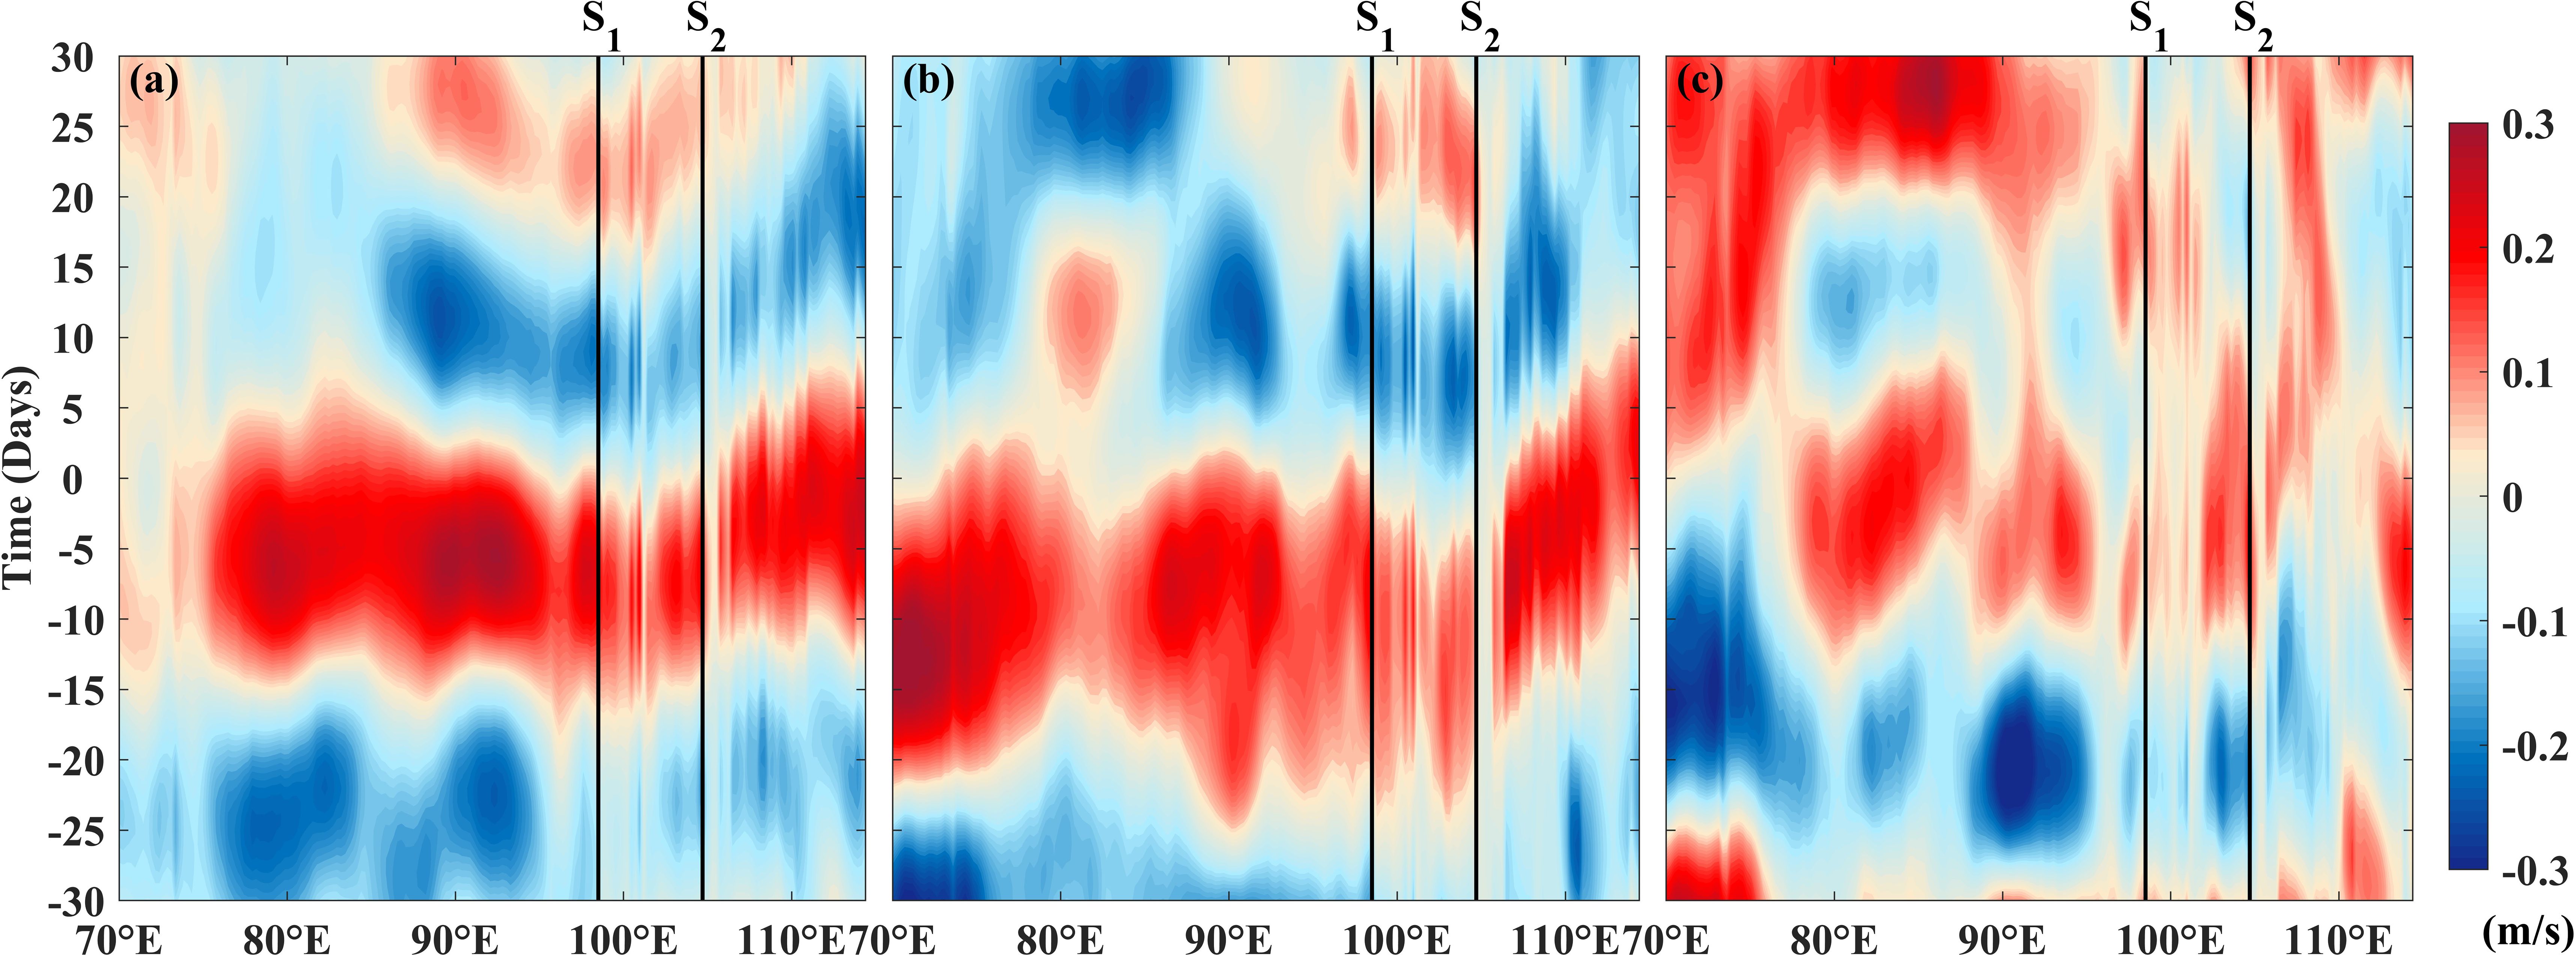
Figure 11. (A) Composite Hovmöller plot of the intraseasonal surface zonal current (0-30m-averaged) along the pathway of intraseasonal SLA signals marked in Figure 7 during boreal spring. (B) Same as (A), but for composite plot during boreal fall. (C) Difference between spring and fall. Day 0 indicates the positive ISV peaks of the SLAs along the Sumatra-Java southern coast. S1 and S2 indicate the location of the western coast of Sumatra on equator and the Sunda Strait along the pathway.
5 Summary
This paper shows strong evidence of seasonality in the Wyrtki Jet ISVs. The Wyrtki Jet ISVs in spring are markedly stronger than those in fall. The standard deviation of Wyrtki Jet ISVs can reach 0.25 m/s in spring, while in fall, the maximum value is only 0.2 m/s. There are also obvious differences in the horizontal distribution characteristics between the Wyrtki Jet ISVs in spring and fall. During spring, the region with significant ISVs is notably larger than that in fall, and these seasonal differences show a clear vertical change, being most pronounced in the upper 30m. The standard deviation of the intraseasonal zonal current above the upper 30m is generally between 0.2 m/s and 0.25 m/s in spring, while in fall, this value is generally lower than 0.2 m/s. The composite analyses of variables such as sea surface wind field, SLA as well as zonal current at various levels before and after the occurrence of Wyrtki Jet ISVs positive peaks show that the positive peaks of Wyrtki Jet ISVs are significantly correlated with the intraseasonal westerlies and positive SLA over the EIO. Moreover, the Wyrtki Jet ISVs are not only influenced by local wind forcing but also regulated by the propagation process of the equatorial Kelvin waves. On this basis, this paper further clarifies the impact of the seasonality in the Wyrtki Jet ISVs on the surrounding regions, using the intraseasonal SLA signal along the southern coast of the Sumatra-Java Island as a representative. The intraseasonal SLAs along the southern coast of the island chain show the same seasonal variability as the Wyrtki Jet ISVs, with stronger ISVs in spring than those in fall. Correlation analysis indicates that there is a significant correlation between the intraseasonal SLAs along the southern coast of the island chain and the intraseasonal signal of the Wyrtki Jet among the EIO. This correlation also shows a clear seasonal difference. Specifically, in spring, the intraseasonal sea surface zonal current begins to appear about 10 days before the positive peak of the intraseasonal SLAs and moves eastward, starting near 75°E on the equator. In contrast, the Wyrtki Jet ISVs initially appear about 15 days before the positive peak of the intraseasonal SLAs along the southern coast of the island chain in fall, with the starting position traceable as far back as around 60°E on the equator, which is somewhat further west relative to spring. The composite Wyrtki Jet ISVs in fall is about 0.2 m/s weaker than that in spring.
It is worth noting that both the intraseasonal SZW and the intraseasonal sea surface zonal current are stronger in spring than those in fall, whether in the EIO or along the coast of Sumatra-Java Island. Therefore, the seasonal differences of intraseasonal SLAs along the southern coast of the island chain must also be the conjoint effect of the intraseasonal SZW and the intraseasonal sea surface zonal current. To clarify the contributions of local and remote effects on the seasonal differences of coastal intraseasonal SLAs, this paper further conducted analyses of the zonal vertical circulation in spring and fall. The zonal vertical circulation in spring and fall show ascent branches of the Walker Circulation over the central-eastern tropical Indian Ocean, resulting in sea surface westerlies over the central-eastern tropical Indian Ocean (Figures 12A, B). In comparison, the ascent movements in fall are stronger than those in spring, resulting in stronger westerlies in the central-eastern equatorial Indian Ocean in spring than in fall (Figure 12C). In terms of the intensity of the westerlies, the wind field in the EIO west of 98.5°E, which is the junction of the equator and Sumatra Island, are greater than the local westerlies along the southern coast of the island chain. However, more numerical simulation researches are needed to carry out to quantify the specific contribution of the two factors to the seasonal differences of Wyrtki Jet ISVs, which will also be deeply analyzed in our subsequent papers.
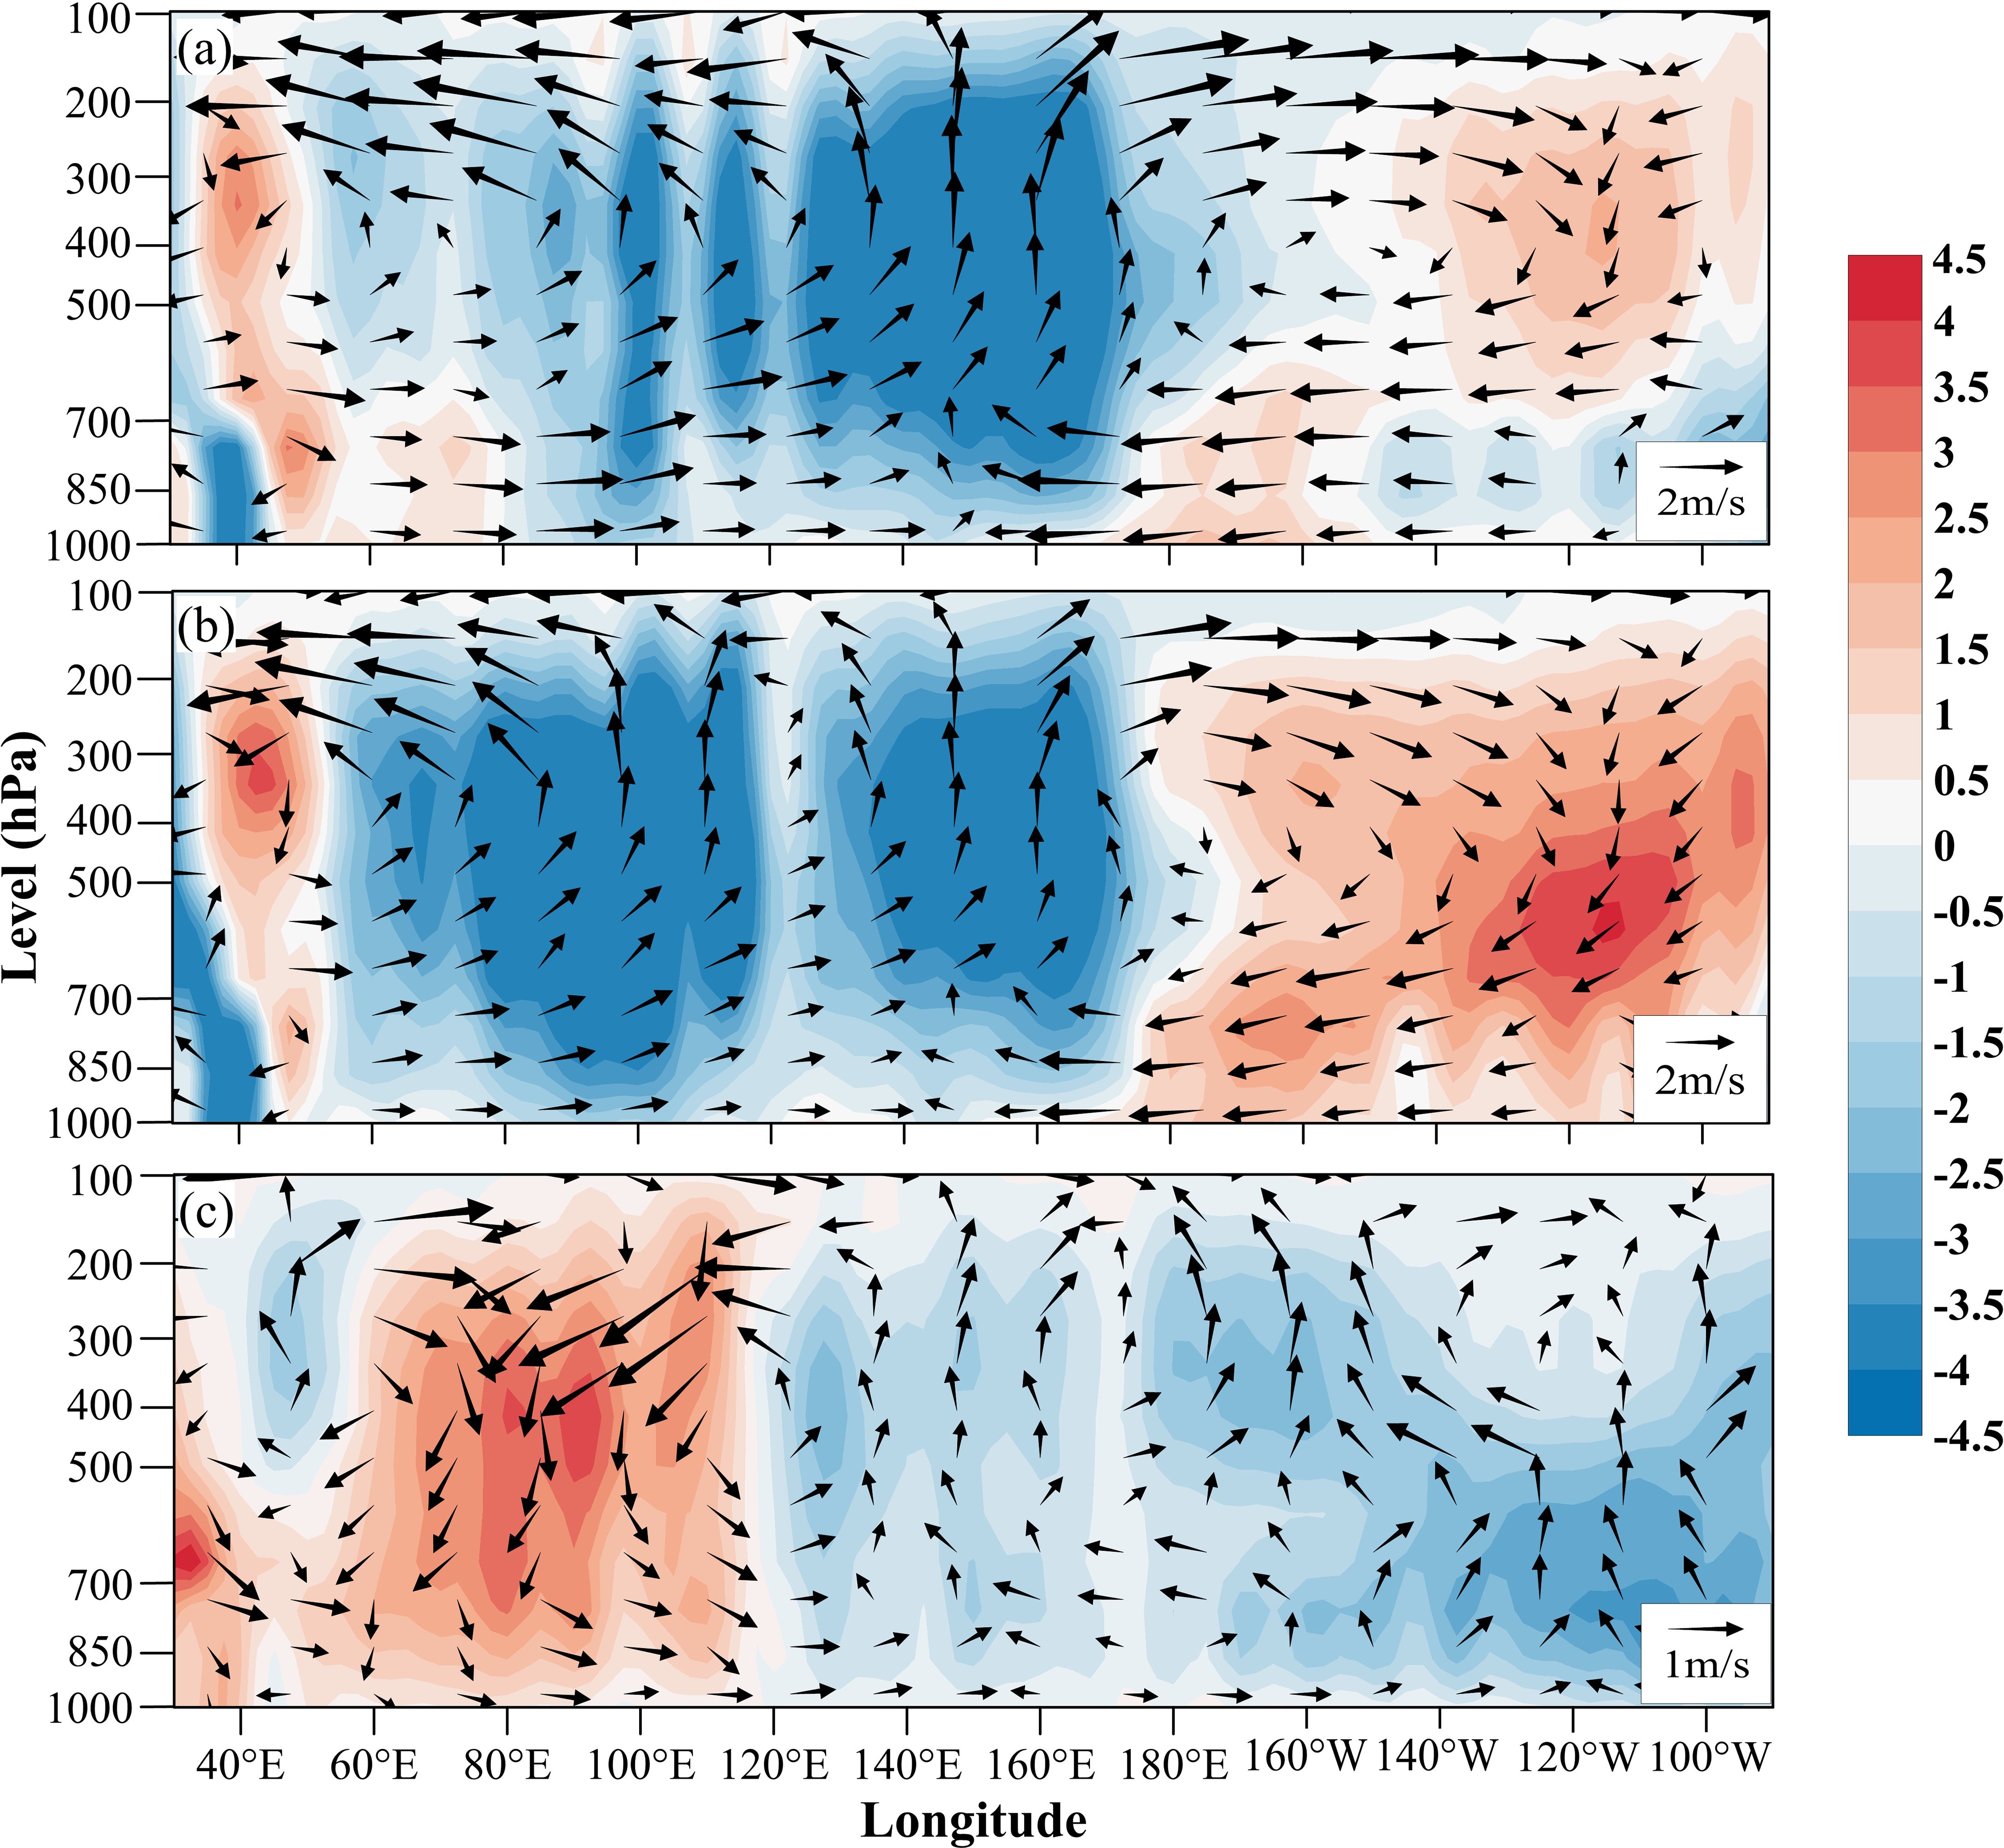
Figure 12. Zonal vertical circulation produced by averaging the zonal component of divergent wind and vertical velocity between 2°S and 2°N (A) in boreal spring (April–May) and (B) in boreal fall (October–November). (C) Zonal vertical circulation difference between spring and fall. Shading represents pressure vertical velocity scaled by 100; red (blue) shading indicates descent (ascent).
Data availability statement
The original contributions presented in the study are included in the article/supplementary material. Further inquiries can be directed to the corresponding author.
Author contributions
GC: Formal analysis, Investigation, Methodology, Project administration, Writing – original draft, Writing – review & editing. TX: Data curation, Project administration, Supervision, Validation, Writing – original draft, Writing – review & editing. ZW: Supervision, Validation, Writing – original draft, Writing – review & editing.
Funding
The author(s) declare financial support was received for the research, authorship, and/or publication of this article. This study is jointly supported by the Natural Science Foundation of the Jiangsu Higher Education Institutions of China (22KJB170009); Major Projects of Natural Science Foundation of the Jiangsu Higher Education Institutions of China (24KJA580002); 2024 Jiangsu Province ‘Qing Lan Project’ for Outstanding Young Core Teachers in Colleges and Universities; Jiangsu Maritime Institute Science and Technology Innovation Fund (Kjcx2020-1); Laoshan Laboratory (LSKJ202202700).
Conflict of interest
The authors declare that the research was conducted in the absence of any commercial or financial relationships that could be construed as a potential conflict of interest.
Generative AI statement
The author(s) declare that no Generative AI was used in the creation of this manuscript.
Publisher’s note
All claims expressed in this article are solely those of the authors and do not necessarily represent those of their affiliated organizations, or those of the publisher, the editors and the reviewers. Any product that may be evaluated in this article, or claim that may be made by its manufacturer, is not guaranteed or endorsed by the publisher.
References
Atlas R., Hoffman R. N., Ardizzone J., Leidner S. M., Jusem J. C., Smith D. K., et al. (2011). A cross-calibrated, multiplatform ocean surface wind velocity product for meteorological and oceanographic applications. Bull. Am. Meteorological Society. 92, 157–174. doi: 10.1175/2010BAMS2946.1
Cao G., He Y., Wei Z., Xu T. (2018). Interannual modulation of intraseasonal sea level variability along the southern coast of Java. Sci. China Earth Sci. 61, 1–12. doi: 10.1007/s11430-017-9106-0
Cao G., Xu T., He Y., Wang L., Wang D., Zhu Y. (2019). Seasonality in intraseasonal sea surface temperature variability along the Sumatra-Java southern coast. J. Geophysical Research: Oceans. 124, 5138–5157. doi: 10.1029/2018JC014853
Chatterjee A., Shankar D., McCreary J. P., Vinayachandran P. N. (2013). Yanai waves in the western equatorial Indian Ocean. J. Geophysical Research: Oceans. 118, 1556–1570. doi: 10.1002/jgrc.v118.3
Chen G., Han W., Li Y., Wang D. (2016a). Interannual variability of equatorial eastern Indian Ocean upwelling: Local versus remote forcing. J. Phys. Oceanography. 46, 789–807. doi: 10.1175/JPO-D-15-0117.1
Chen G., Han W., Li Y., Wang D., McPhaden M. J. (2015). Seasonal-to-interannual time-scale dynamics of the equatorial undercurrent in the Indian Ocean. J. Phys. Oceanography. 45, 1532–1553. doi: 10.1175/JPO-D-14-0225.1
Chen G., Han W., Li Y., Yao J., Wang D. (2019). Intraseasonal variability of the equatorial undercurrent in the Indian Ocean. J. Phys. Oceanography. 49, 85–101. doi: 10.1175/JPO-D-18-0151.1
Chen G., Han W., Shu Y., Li Y., Wang D., Xie Q. (2016b). The role of Equatorial Undercurrent in sustaining the Eastern Indian Ocean upwelling. Geophysical Res. Letters. 43, 6444–6451. doi: 10.1002/2016GL069433
Conkright M. E., Levitus S., Boyer T. P. (1994). World ocean atlas 1994 Volume 1: Nutrients, (Vol. 1) (Washington, D.C: NOAA, U. S Department of Commerce).
Deng K., Cheng X., Feng T., Ma T., Duan W., Chen J. (2021). Interannual variability of the spring Wyrtki Jet. J. Oceanology Limnology. 39, 26–44. doi: 10.1007/s00343-020-9330-3
Deshpande A., Gnanaseelan C., Chowdary J. S., Rahul S. (2017). Interannual spring Wyrtki jet variability and its regional impacts. Dynamics Atmospheres Oceans. 78, 26–37. doi: 10.1016/j.dynatmoce.2017.02.001
Du Y., Zhang Y. (2015). Satellite and Argo observed surface salinity variations in the tropical Indian Ocean and their association with the Indian Ocean dipole mode. J. Climate. 28, 695–713. doi: 10.1175/JCLI-D-14-00435.1
Du Y., Zhang Y., Shi J. (2019b). Relationship between sea surface salinity and ocean circulation and climate change. Sci. China Earth Sci. 62, 771–782. doi: 10.1007/s11430-018-9276-6
Du Y., Zhang L., Zhang Y. (2019a). Review of the tropical gyre in the Indian Ocean with its impact on heat and salt transport and regional climate modes. Adv. Earth Sci. 34, 243–254. doi: 10.11867/j.issn.1001-8166.2019.03.0243
DUACS/AVISO (2014). Data from: A new version of SSALTO/Duacs products available in April 2014, AVISO Technical Note Version1.1 (France: CNES).
Duan Y., Liu L., Han G., Liu H., Yu W., Yang G., et al. (2016). Anomalous behaviors of Wyrtki Jets in the equatorial Indian Ocean during 2013. Sci. Rep. 6, 29688. doi: 10.1038/srep29688
Ducet N., Le Traon P. Y., Reverdin G. (2000). Global high-resolution mapping of ocean circulation from TOPEX/Poseidon and ERS-1 and -2. J. Geophysical Res. 105, 19477–19498. doi: 10.1029/2000JC900063
Emery W. J., Thomson R. E. (2001). Data analysis methods in physical oceanography. 2nd ed (New York: Elsevier).
Gnanaseelan C., Deshpande A., McPhaden M. J. (2012). Impact of Indian Ocean Dipole and El Niño/southern oscillation wind-forcing on the Wyrtki jets. J. Geophysical Research: Oceans 117, 1–11. doi: 10.1029/2012JC007918
Gordon A. L., Sprintall J., Van Aken H. M. V., Susanto D., Wijffels S., Molcard R., et al. (2010). The Indonesian throughflow during 2004-2006 as observed by the INSTANT program. Dynamics Atmospheres Oceans. 50, 115–128. doi: 10.1016/j.dynatmoce.2009.12.002
Han G. Q., Liu L., Duan Y. L., Wang G. S., Wang H. W., Liu Y. L., et al. (2017). Anomlous behavior of spring wyrtki jet in equatorial Indian ocean during 2013. Adv. Mar. Sci. 35, 189–199. doi: 10.3969/j.issn.1671-6647.2017.02.004
Han W., McCreary J. P., Anderson D. L. T., Mariano A. J. (1999). Dynamics of the eastern surface jets in the equatorial Indian Ocean. J. Phys. Oceanography. 29, 2191–2209. doi: 10.1175/1520-0485(1999)029<2191:DOTESJ>2.0.CO;2
Holgate S. J., Matthews A., Woodworth P. L., Rickards L. J., Tamisiea M. E., Bradshaw E., et al. (2013). New data systems and products at the permanent service for mean sea level. J. Coast. Res. 288, 493–504.
Huang K., Wang D., Qiu Y., Wu Y., Liu K., Huang B, et al. (2023). Meridional-width variability of near-equatorial zonal currents along 80.5°E on seasonal to interannual timescales in the Indian Ocean. J. Geophys. Res.: Oceans 128, e2022JC019147.
Huang N. E., Shen Z., Long S. R., Wu M. C., Shih H. H., Zheng Q. A., et al. (1998). The empirical mode decomposition and the Hilbert spectrum for nonlinear and non-stationary time series analysis. Proc. R. Soc. A: Mathematical Phys. Eng. Sci. 454, 903–995. doi: 10.1098/rspa.1998.0193
Iskandar I., McPhaden M. J. (2011). Dynamics of wind-forced intraseasonal zonal current variations in the equatorial Indian Ocean. J. Geophysical Research: Oceans 116, 1–16. doi: 10.1029/2010JC006864
Le Traon P. Y., Nadal F., Ducet N. (1998). An improved mapping method of multisatellite altimeter data. J. Atmospheric Oceanic Technology. 15, 522–534. doi: 10.1175/1520-0426(1998)015<0522:AIMMOM>2.0.CO;2
Levitus S., Boyer T. P. (1994a). World ocean atlas 1994 Volume 2: Oxygen (Vol. 2) (Washington, D.C: NOAA, U. S Department of Commerce).
Levitus S., Boyer T. P. (1994b). World ocean atlas 1994 Volume 4: Temperature (Vol. 4) (Washington, D.C: NOAA, U. S Department of Commerce).
Levitus S., Burgett R., Boyer T. P. (1994). World ocean atlas 1994 Volume 3: Nutrients (Vol. 3) (Washington, D.C: NOAA, U. S Department of Commerce).
Li K., Feng L., Liu Y., Yang Y., Li Z., Yu W. (2018). The northward-propagating intraseasonal oscillations in the northern Indian Ocean during spring-early summer. J. Climate. 31, 7003–7017. doi: 10.1175/JCLI-D-17-0781.1
Li S., Wei Z., Susanto R. D., Zhu Y., Setiawan A., Xu T., et al. (2018). Observations of intraseasonal variability in the Sunda Strait throughflow. J. oceanography. 74, 541–547. doi: 10.1007/s10872-018-0476-y
Liu Y., Yang H. J. (2023). Characteristics of the northward propagation of summer intraseasonal oscillation over the tropical Indian ocean. Acta Scientiarum Naturalium Universitatis Pekinensis 59, 569–580. doi: 10.13209/j.0479–8023.2023.044
Madden R. A., Julian P. R. (1971). Detection of a 40–50 day oscillation in the zonal wind in the tropical Pacific. J. Atmospheric Sci. 28, 702–708. doi: 10.1175/1520-0469(1971)028<0702:DOADOI>2.0.CO;2
Madden R. A., Julian P. R. (1972). Description of global-scale circulation cells in the tropics with a 40-50 day period. J. Atmospheric Sci. 29, 1109–1123. doi: 10.1175/1520-0469(1972)029<1109:DOGSCC>2.0.CO;2
Madden R. A., Julian P. R. (1994). Observations of the 40–50-day tropical oscillation—A review. Monthly weather review. 122, 814–837. doi: 10.1175/1520-0493(1994)122<0814:OOTDTO>2.0.CO;2
Masumoto Y., Hase H., Kuroda Y., Matsuura H., Takeuchi K. (2005). Intraseasonal variability in the upper layer currents observed in the eastern equatorial Indian Ocean. Geophysical Res. Lett. 32, L02607. doi: 10.1029/2004GL021896
Mcphaden M. J., Meyers G., Ando K., Masumoto Y., Murty V. S. N., Ravichandran M., et al. (2009). RAMA: the research moored array for African-Asian-Australian monsoon analysis and prediction. Bull. Am. Meteorological Society. 90, 459–480. doi: 10.1175/2008BAMS2608.1
McPhaden M. J., Wang Y., Ravichandran M. (2015). Volume transports of the Wyrtki jets and their relationship to the Indian Ocean Dipole. J. Geophysical Research: Oceans. 120, 5302–5317. doi: 10.1002/2015JC010901
Moum J. N., de Szoeke S. P., Smyth W. D., Fairall C. (2014). Air-sea interactions from westerly wind bursts during the November 2011 MJO in the Indian Ocean. Bull. Am. Meteorological Society. 95, 1185–1199. doi: 10.1175/BAMS-D-12-00225.1
Nagura M., McPhaden M. J. (2008). The dynamics of zonal current variations in the central equatorial Indian Ocean. Geophysical Res. Lett. 35, L23603. doi: 10.1029/2008GL035961
Nagura M., McPhaden M. J. (2010). Dynamics of zonal current variations associated with the Indian Ocean dipole. J. Geophysical Research: Oceans 115, C11026. doi: 10.1029/2010jc006423
Nagura M., McPhaden M. J. (2012). The dynamics of wind-driven intraseasonal variability in the equatorial Indian Ocean. J. Geophysical Research: Oceans 117, 1–16. doi: 10.1029/2011JC007405
Nyadjro E. S., McPhaden M. J. (2014). Variability of zonal currents in the eastern equatorial Indian Ocean on seasonal to interannual time scales. J. Geophysical Research: Oceans. 119, 7969–7986. doi: 10.1002/2014JC010380
Prerna S., Chatterjee A., Mukherjee A., Ravichandran M., Shenoi S. S. C. (2019). Wyrtki Jets: Role of intraseasonal forcing. J. Earth System Science. 128, 21. doi: 10.1007/s12040-018-1042-0
Sengupta D., Senan R., Goswami B. N., Vialard J. (2007). Intraseasonal variability of equatorial Indian Ocean zonal currents. J. Climate. 20, 3036–3055. doi: 10.1175/JCLI4166.1
Torrence C., Compo G. P. (1998). A practical guide to wavelet analysis. Bull. Am. Meteorological Society. 79, 61–78. doi: 10.1175/1520-0477(1998)079<0061:APGTWA>2.0.CO;2
Wentz F. J., Scott J., Hoffman R., Leidner M., Atlas R., Ardizzone J. (2015). Remote sensing systems cross-calibrated multi-platform (CCMP) 6-hourly ocean vector wind analysis product on 0.25 deg grid, Version 2.0. (Santa Rosa, CA: Remote Sensing Systems). Available online at: www.remss.com/measurements/ccmp.
Wu Y., Liu L., Wang H. W., Li K. P., Yang Y. (2018). Impact of different type of el niño event on wyrtki jet in boreal fall. Adv. Mar. Sci. 36, 188–196. doi: 10.3969/j.issn.1671-6647.2018.02.04
Wyrtki K. (1973). An equatorial jet in the Indian Ocean. Science. 181, 262–264. doi: 10.1126/science.181.4096.262
Xie C., Ding R., Xuan J., Huang D. (2023). Interannual variations in salt flux at 80°E section of the equatorial Indian Ocean. Sci. China Earth Sci. 66, 2142–2161. doi: 10.1007/s11430-022-1140-x
Xu T., Li S., Hamzah F., Setiawan A., Susanto R. D., Cao G., et al. (2018). Intraseasonal flow and its impact on the chlorophyll-a concentration in the Sunda Strait and its vicinity. Deep Sea Res. Part I: Oceanographic Res. Papers. 136, 84–90. doi: 10.1016/j.dsr.2018.04.003
Zhang C. (2013). Madden-Julian oscillation: Bridging weather and climate. Bull. Am. Meteorological Society. 94, 1849–1870. doi: 10.1175/BAMS-D-12-00026.1
Zhang Y., Du Y., Zhang Y., Gao S. (2016). Asymmetry of upper ocean salinity response to the Indian Ocean dipole events as seen from ECCO simulation. Acta Oceanologica Sinica. 35, 42–49. doi: 10.1007/s13131-016-0904-z
Keywords: Wyrtki Jet, intraseasonal variability, sea level anomaly, equatorial Indian Ocean, Sumatra-Java Island
Citation: Cao G, Xu T and Wei Z (2024) Seasonal differences of Wyrtki Jet intraseasonal variabilities. Front. Mar. Sci. 11:1517779. doi: 10.3389/fmars.2024.1517779
Received: 27 October 2024; Accepted: 21 November 2024;
Published: 11 December 2024.
Edited by:
Yuanlong Li, Chinese Academy of Sciences (CAS), ChinaReviewed by:
Ke Huang, Chinese Academy of Sciences (CAS), ChinaFengchao Yao, Sun Yat-sen University, China
Copyright © 2024 Cao, Xu and Wei. This is an open-access article distributed under the terms of the Creative Commons Attribution License (CC BY). The use, distribution or reproduction in other forums is permitted, provided the original author(s) and the copyright owner(s) are credited and that the original publication in this journal is cited, in accordance with accepted academic practice. No use, distribution or reproduction is permitted which does not comply with these terms.
*Correspondence: Tengfei Xu, eHV0ZW5nZmVpQGZpby5vcmcuY24=
 Guojiao Cao
 Tengfei Xu
 Zexun Wei