 Yongchuang Shi
 Lei Yan2
 Shengmao Zhang
 Fenghua Tang
 Shenglong Yang
 Haibin Han
94% of researchers rate our articles as excellent or good
Learn more about the work of our research integrity team to safeguard the quality of each article we publish.
Find out more
ORIGINAL RESEARCH article
Front. Mar. Sci. , 13 January 2025
Sec. Marine Fisheries, Aquaculture and Living Resources
Volume 11 - 2024 | https://doi.org/10.3389/fmars.2024.1503292
The construction of accurate and interpretable predictive model for high abundance fishing ground is conducive to better sustainable fisheries production and carbon reduction. This article used refined statistical maps to visualize the spatial and temporal patterns of catch changes based on the 2014-2021 fishery statistics of the Japanese sardine Sardinops melanostictus fishery in the Northwest Pacific Ocean. Three models (XGBoost, LightGBM, and CatBoost) and two variable importance visualization methods (model built-in (split) and SHAP methods) were used for comparative analysis to determine the optimal modeling and visualization strategies. Results: 1) From 2014 to 2021, the annual catch showed an overall increasing trend and peaked at 220,009.063 tons in 2021; the total monthly catch increased and then decreased, with a peak of 76, 033.4944 tons (July), and the catch was mainly concentrated in the regions of 39.5°-43°N and 146.75°-155.75°E; 2) Catboost model predicted better than LightGBM and XGBoost models, with the highest values of accuracy and F1-score, 73.8% and 75.31%, respectively; 3) the overall importance ranking of the model’s built-in method differed significantly from that in the SHAP method, and the overall importance ranking of the spatial variables in the SHAP method increased. Compared to the built-in method, the SHAP method informs the magnitude and direction of the influence of each variable at the global and local levels. The results of the research help us to select the optimal model and the optimal visualization method to construct a prediction model for the Japanese sardine fishing grounds in the Northwest Pacific Ocean, which will provide a scientific basis for the Japanese sardine fishery to achieve environmental and economically sustainable fishery development.
Oceans, from regional to global scales, are essential sources of animal protein and provide significant economic and employment benefits (Li et al., 2024; Muñoz et al., 2023; Sun et al., 2023). Commercial fishing is vital for supplying fish protein to a growing population. However, it is highly fuel-intensive, with fuel costs accounting for up to 60% of total fishing expenses. This makes commercial fishing is one of the major sources of global carbon dioxide emissions (Basurko et al., 2013; Devi et al., 2021; Greer et al., 2019). In recent years, overexploitation of many target species has led to stagnating fish landings globally. Despite this, the energy demand and CO2 emissions from ocean fishing have continued to rise (Muñoz et al., 2023). Diesel fuel, a major source of greenhouse gas emissions in marine capture fisheries, highlights the urgent need to improve fuel efficiency to achieve sustainable development in both environmental and economic terms (Devi et al., 2021; Díaz-Secades, 2024; Sala et al., 2022).
The Northwest Pacific Ocean (NWPO) is one of the world’s most productive fishing grounds, where the Oyashio cold current from the north meets the Kuroshio warm current from the south. This convergence brings an abundance of zooplankton, creating vital spawning and feeding ground for many small pelagic fish (Yang et al., 2023a; Liang et al., 2024). Due to its significant economic value, the NWPO has attracted considerable attention from neighboring countries. Major fishing nations in this region include China, Japan, Russia, and South Korea, with key commercial catches being Chub mackerel (Scomber japonicus), Neon flying squid (Ommastrephes bartramii), Pacific saury (Cololabis saira), and Japanese sardine (Sardinops melanostictus) (Han et al., 2023b; Shi et al., 2022; Yang et al., 2023b). The Japanese sardine, a warm-temperate, short-lived (typically 6-7 years old) species with high aggregation and abundant resources, ranks among the most heavily caught pelagic species globally (Yang, 2023). Ecologically, it plays a crucial role in the NWPO by controlling zooplankton populations and supporting higher trophic levels (Ma et al., 2023). However, the stock biomass of the Japanese sardine has fluctuated significantly over time due to environmental changes and fishing pressures. After peaking in the 1980s and sharply declining in the 1990s, the biomass began to recover slowly after 2010, though it has not yet reached its previous peak (Watanabe et al., 2023; Yang et al., 2023a). Given its increasing ecological and economic importance, the Japanese sardine has been listed as a priority fish by the North Pacific Fisheries Commission (NPFC). The management and utilization of this resource have garnered widespread attention (Shi et al., 2023b), particularly as its annual catch in the NWPO surpassed that of the Chub mackerel in 2020 (Secretariat, 2024). While small-scale pelagic fisheries are often considered to have lower environmental impacts, and purse seine is regarded as one of the most energy-efficient fishing methods (Sandison et al., 2021), the recent increase in Japanese sardine catches on the high seas has not been matched by the development of accurate and reliable fishing ground prediction techniques. Without these tools, indiscriminate exploration of fishing grounds will raise production costs and carbon emissions, hindering progress toward carbon neutrality and sustainable fisheries development, while also contributing to other environmental impacts (Yang et al., 2023a; Sandison et al., 2021).
Fishing ground prediction is a crucial area of fishery research, leveraging historical fishing data, marine environmental variables, geographic locations, and time-related factors to forecast the status of fishery resources in specific areas and periods (Chen, 2022; Gong, 2021). Accurate predictions are vital for ensuring food security, optimizing protein supply, enhancing fuel efficiency, and reducing production costs, particularly in developing countries (Armas et al., 2022; Lamine et al., 2022; Yang et al., 2023b; Kakehi et al., 2020). Recently, the growing volume of fishery data has led to a shift from traditional models, such as generalized additive models, to machine learning approaches for fishing ground forecasts (Alfatinah et al., 2023; Han et al., 2023a; Qin et al., 2022; Shang et al., 2023; Yoshida et al., 2024). While machine learning models offer improved predictive performance, they have been criticized for their lack of interpretability, often being described as “black box” models (Li et al., 2023; Politikos et al., 2021; Yang et al., 2021). Given the importance of effective fishing practices for both economic and environmental goals, relying solely on these opaque models is problematic. Therefore, enhancing the transparency and understanding of these models’ decision-making processes is essential for increasing their credibility and usefulness.
In 2017, Lundberg and Lee introduced a Python package that computes SHAP values for various techniques, including Light Gradient Boosting Machine (LightGBM), Categorical Boosting Algorithm (CatBoost), Extreme Gradient Boosting (XGBoost), and Scikit-learn models. This package provides a robust metric for assessing the importance of variables within a model (Parsa et al., 2020). SHAP, which stands for SHapley Additive exPlanations, uses the Shapley value from game theory to combine optimal credit allocation with local interpretability (Wen et al., 2021). It has been effectively applied across several fields, including fishing effort prediction (Kawaguchi, 2024), aquaculture (Khan and Byun, 2023; Khiem et al., 2023), species distribution (Cha et al., 2021; Effrosynidis et al., 2020), river ecological quality prediction (Politikos et al., 2024), transportation safety (Parsa et al., 2020; Yang et al., 2021), and medicine (Datta et al., 2023). SHAP has successfully clarified the internal logic of prediction models in these areas, enhancing their credibility and transparency. Despite the widespread application of SHAP in various domains, it has not yet been used to elucidate the spatiotemporal and environmental variables that are critical to predicting Japanese sardine fisheries. There is no prior research combining SHAP with forecasting models for Japanese sardine fishing grounds. This study addresses this gap by using three prominent tree-based models known for their integration with SHAP: XGBoost, LightGBM, and CatBoost (Cakiroglu et al., 2024; Parsa et al., 2020; Politikos et al., 2021; Shi et al., 2024; Wang and Jiang, 2023; Wen et al., 2021; Xiao et al., 2023; Yang et al., 2021). These models are among the most popular gradient boosting libraries available today (So, 2024).
Due to the importance of fisheries management to the climate and fisheries economy, fisheries management should aim to minimize fuel use (Bastardie et al., 2022). To better understand the patterns of Japanese sardine catch changes in the Northwest Pacific Ocean (NWPO) and to develop a highly accurate forecast model for high-abundance fishing grounds with explanatory power, this study aims to: (1) Analyze the spatio-temporal patterns of Japanese sardine catch in the NWPO from 2014 to 2021. (2) Compare and validate the forecasting performance of LightGBM, CatBoost, and XGBoost models to identify the most effective high-abundance fishing grounds forecast model. (3) Integrate the SHAP algorithm with the selected forecasting model to quantify the specific contributions of each spatio-temporal and environmental variable, and to interpret the machine learning model results both globally and locally, enhancing the model’s credibility and transparency. The findings will provide technical support for efficient production and scientific management of the Pacific sardine fishery in the NWPO.
The data for this study on the Japanese sardine fishery were obtained from the fishing logbooks of Chinese commercial lighting purse seine vessels, covering the period from April to December, 2014-2021. The research focused on the high seas of the Northwest Pacific Ocean (NWPO), within the coordinates 30°-45°N and 144°-166°E, as illustrated in Figure 1. Figure 2 shows the annual fishing effort during these years. The dataset consists of 3, 346 records of fishing vessel operations, with a temporal resolution by month and a spatial resolution of 0.25° × 0.25°. Each record includes the date, time, and geographic coordinates of the start and end of operations, the number of nets used, as well as the species composition and quantity of the catch.
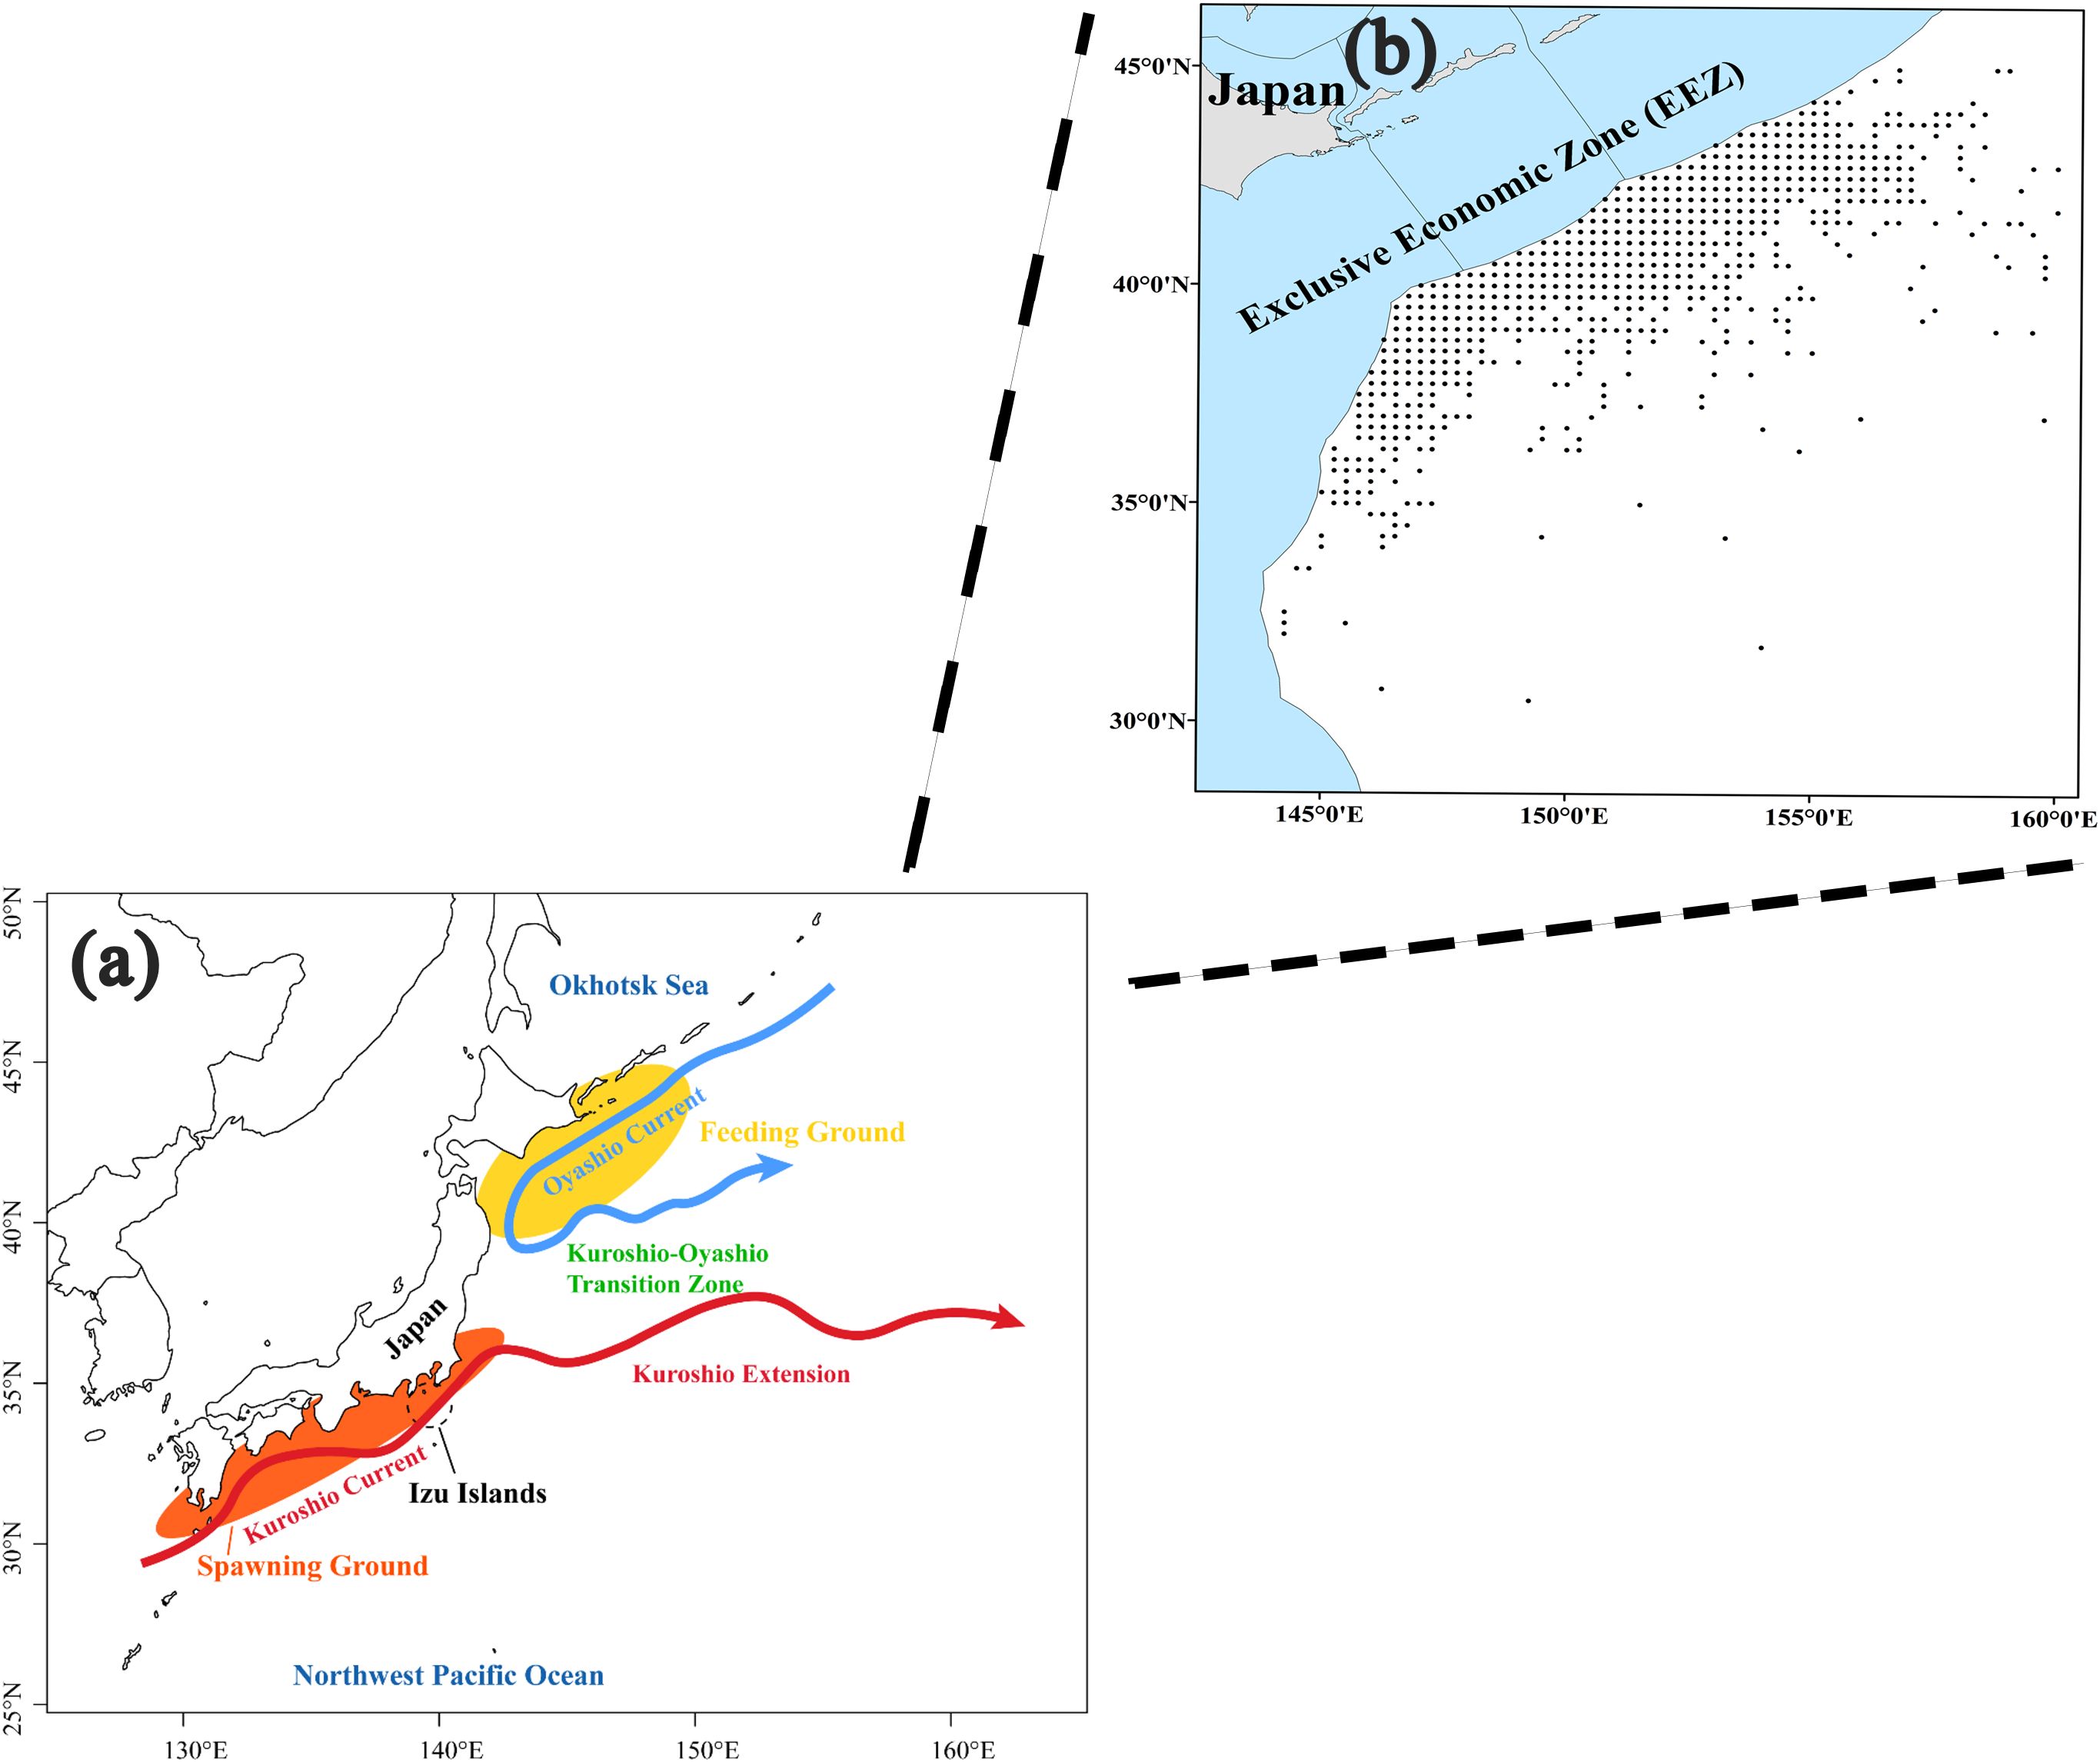
Figure 1. Spawning and feeding grounds of the Japanese sardine in the NWPO (A) (Bai et al., 2022) and the distribution of Japanese sardine fisheries in the study area (B).
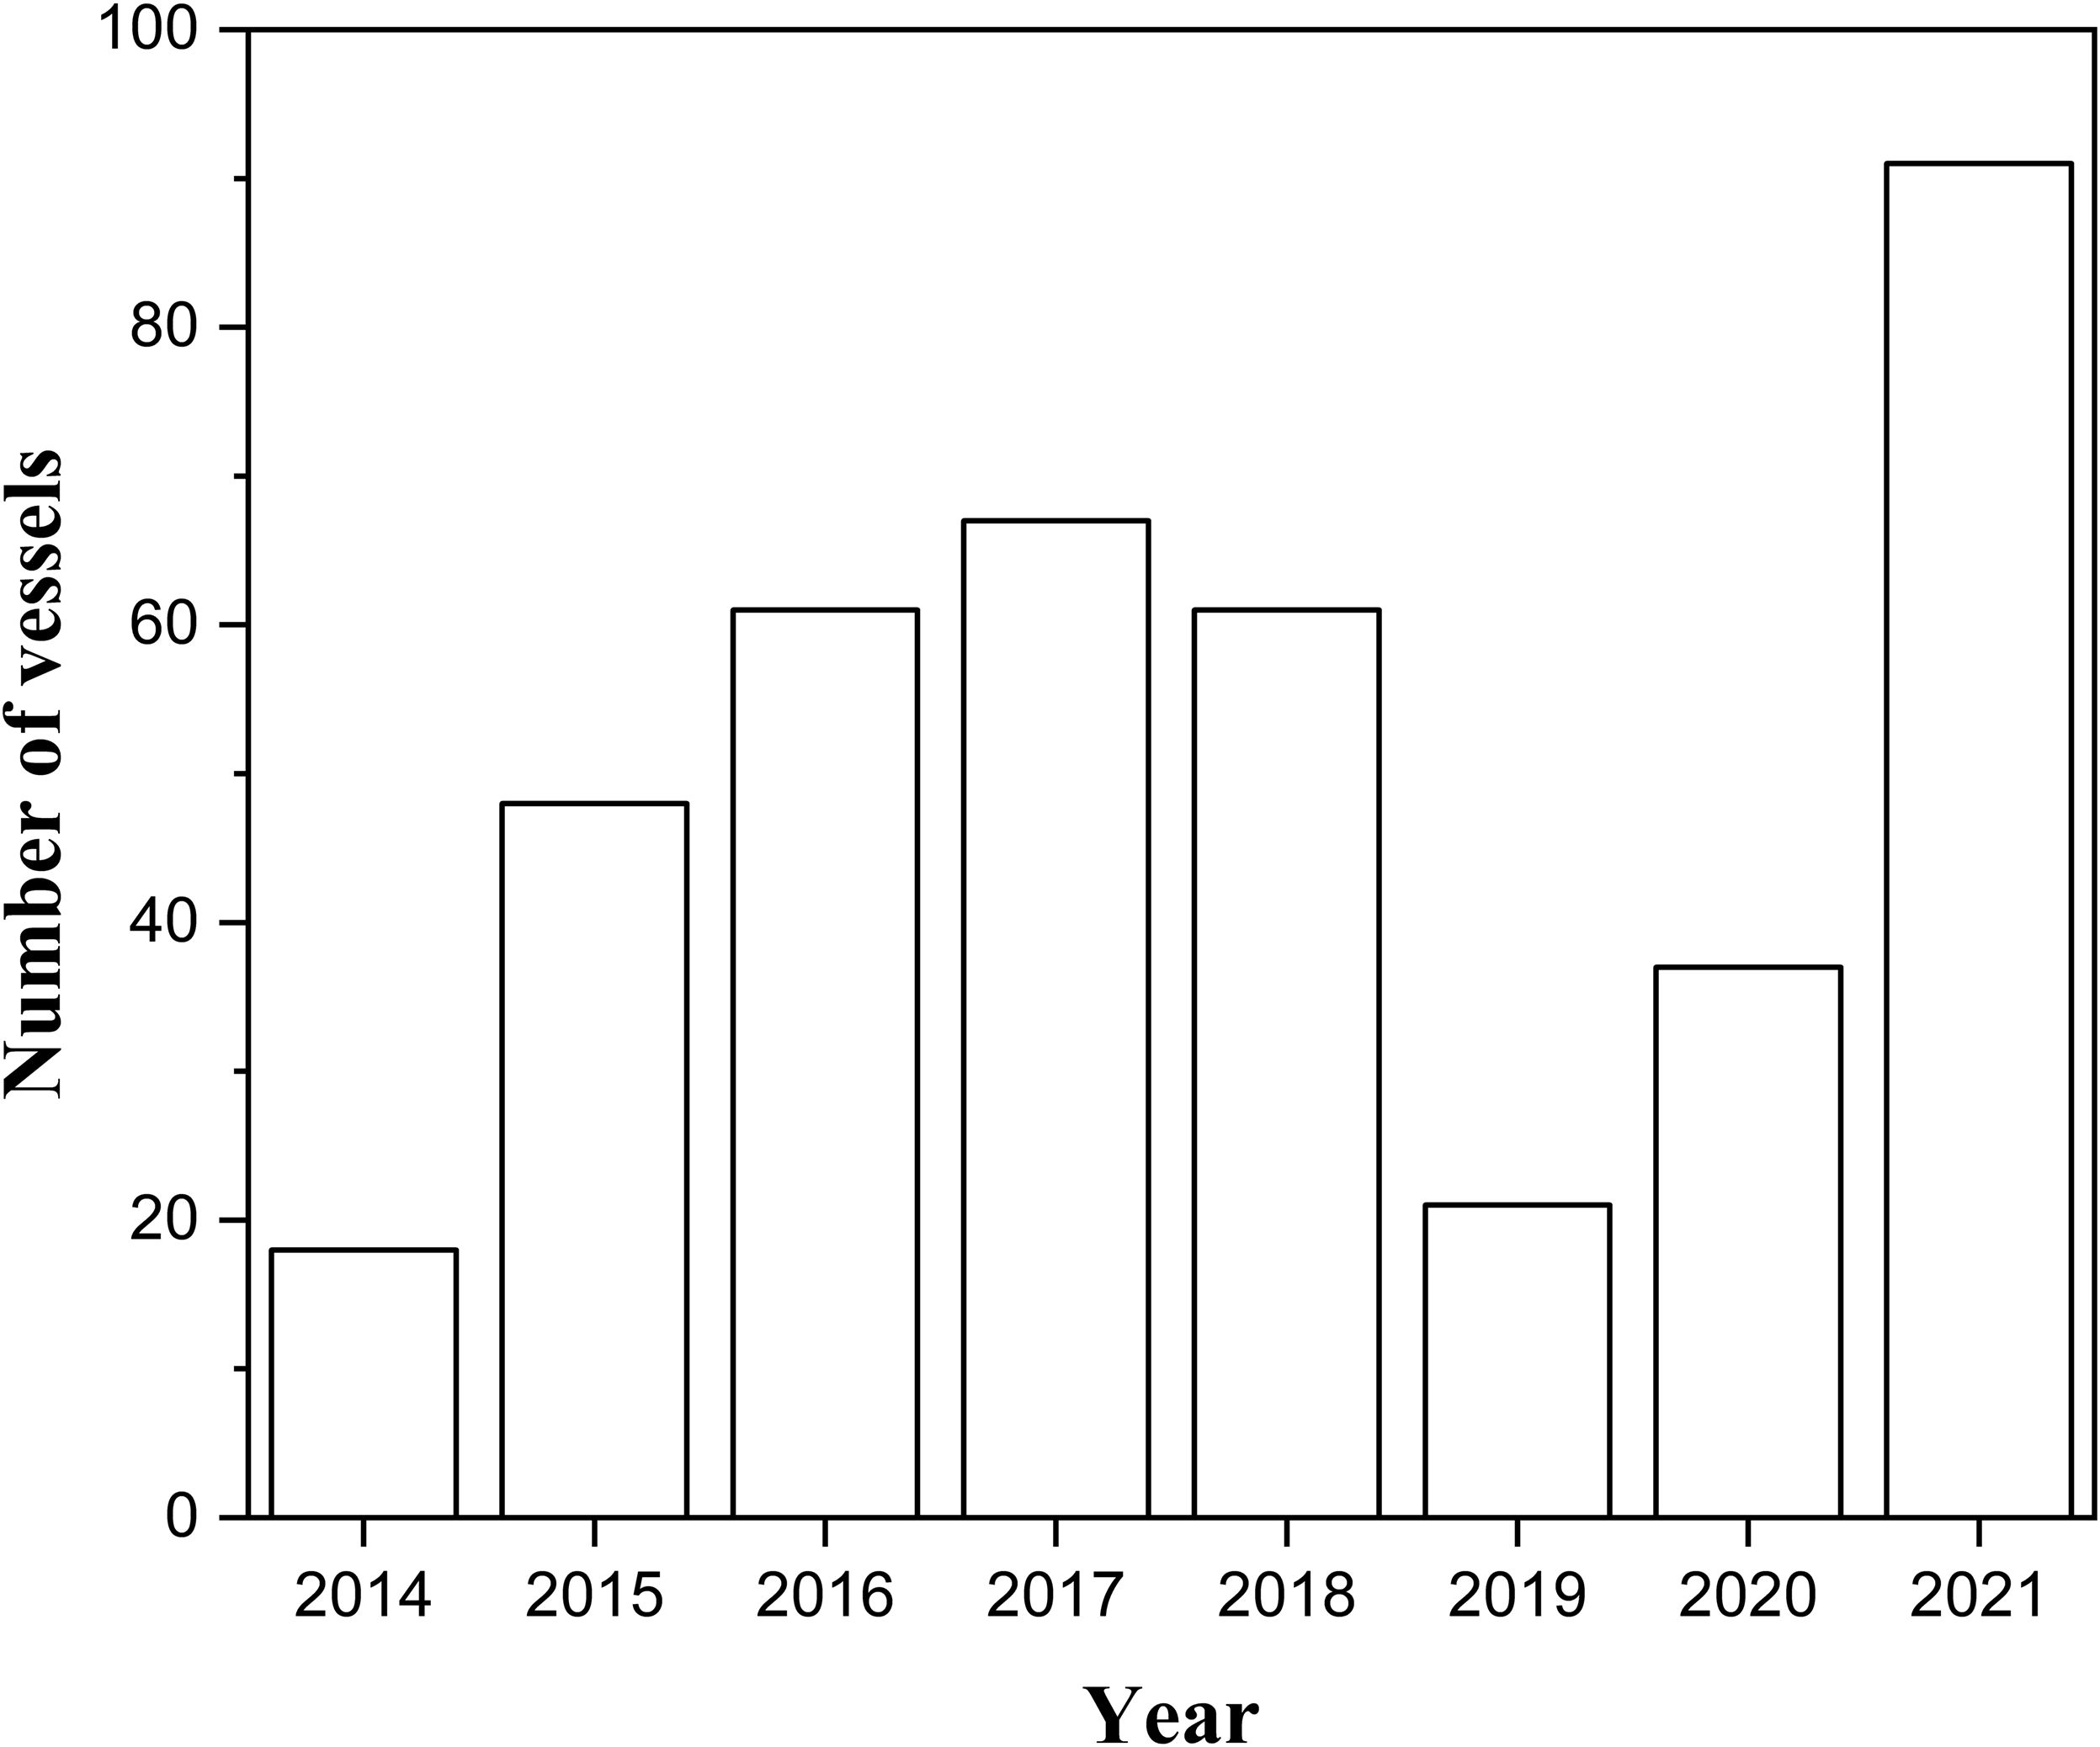
Figure 2. Number of lighting purse seine vessels in the NWPO from 2014 to 2021.
High-seas fisheries often face limitations due to the high economic costs of fishery resource surveys, making it challenging to cover entire fishing seasons and areas comprehensively. As a result, catch, effort, and catch per unit effort (CPUE) are commonly used as indices of resource abundance in fishery production (Xie et al., 2023). When captains search for fishing grounds before production, they rely on marine environmental maps (e.g., sea surface temperature) and scientific echo sounders to exclude a significant number of non-productive areas (Han et al., 2023b). Consequently, this study focuses on analyzing the spatio-temporal distribution of low- and high-abundance fishing grounds, using the highest recorded catches as the primary criterion for distinguishing between them.
The classification method used in this study takes into account the significant fluctuations in annual Japanese sardine resources (Han et al., 2023b) and the changes in fishing strategies: (i) the increased fishing activity due to the decline in chub mackerel resources (Cai et al., 2023; Hong and Kim, 2021), and (ii) the notable variations in fishing effort (Figure 2). For each year analyzed, the study conducted a binary classification, defining fishing grounds with annual abundance equal to or greater than the median (with a temporal resolution of months and spatial resolution of 0.25° × 0.25°) as high-abundance fishing grounds, while the remaining areas were classified as low-abundance fishing grounds.
Temporal, spatial, and environmental factors are key predictor variables for developing fishing grounds forecasting models (Gong et al., 2021; Luan et al., 2020; Shang et al., 2023). Considering the highly dynamic variation in the catch of the Japanese sardine at different temporal and spatial scales (Cui et al., 2022; Yang et al., 2023a), we selected year, month, longitude, and latitude as the spatio-temporal predictor variables for our analysis.
The Japanese sardine is highly sensitive to changes in the marine environment, making it crucial to quantify and assess the environmental factors that influence its distribution for effective management and sustainable exploitation of its fisheries (Bai et al., 2022). Previous studies have demonstrated that sea surface temperature (SST), sea surface salinity (SSS), chlorophyll a (Chla), sea surface height (SSH), current velocity (CV), dissolved oxygen (DO), and mixed layer depth (MLD) significantly impact the abundance and spatial-temporal distribution of Japanese sardine resources (Liu et al., 2023a; b; Okunishi et al., 2009; Sarr et al., 2021; Shi et al., 2023a; Sogawa et al., 2019). Although SST, SSS, Chla, and SSH are the primary environmental variables typically used in studies on Japanese sardine, CV, DO, and MLD have received less attention. However, the distribution of fishing grounds is notably influenced by CV, with Japanese sardines more likely to aggregate in water layers with high DO and fast flow rates, and the MLD plays a key role in affecting bait availability (Gong et al., 2021; Zhao et al., 2022; Sogawa et al., 2019). Therefore, to comprehensively understand the environmental drivers of spatial and temporal variability in Japanese sardine fishing grounds, this study incorporates SST, SSS, Chla, sea level anomaly (SLA), CV, DO, and MLD in constructing the fishing grounds prediction model.
The marine environmental data used in this study were obtained from the Copernicus Marine Service (https://resources.marine.copernicus.eu/products). These data were aligned in temporal and spatial resolution with the fisheries data. The dataset includes variables such as SST (°C), Chla (mg/m³), SLA (m), SSS (‰), DO (mmol/m³), surface geostrophic northward sea water velocity (Vgos, m/s), surface geostrophic eastward sea water velocity (Ugos, m/s), and MLD (m).
Among them, Vgos and Ugos were used to calculate the environmentally derived variable CV with the following formula (Han et al., 2023a):
The average monthly range values for each environmental variable matched to fishery data in this study were as follows: SST (1.62~27.46°C), Chla (0~2.99 mg/m3), MLD (10.77~116.05m), DO (206.21~331.80 mmol/m3), SSS (32.34~34.86‰), SLA (-0.28~1.04m), CV (0.002~0.945 m/s).
In 2016, Chen and Guestrin introduced the XGBoost model, an enhancement of the gradient boosting tree algorithm (Chen and Guestrin, 2016). This model increases the accuracy of residual estimation by employing a second-order Taylor expansion of the objective function and incorporating a regularization term to prevent overfitting. These improvements make the algorithm both precise and computationally efficient (Deng et al., 2024; Xu et al., 2024). XGBoost reduces prediction error by iteratively generating new regression trees, which progressively narrow the gap between actual and predicted values, thereby enhancing model accuracy (Li et al., 2023). The fundamental approach involves assembling multiple weak prediction models to create a more accurate overall model, a technique that has been widely adopted in fishery abundance prediction research (Effrosynidis et al., 2020; Liu et al., 2023a; Xu et al., 2024; Zhang et al., 2023a).
LightGBM and CatBoost are advanced variants of gradient boosting algorithms that have become increasingly popular in recent years, particularly in the field of fisheries research, where they are used to construct models for forecasting fishing grounds (Gong, 2021; Xu et al., 2024). The LightGBM model, introduced by Microsoft in 2017, utilizes gradient-based one-side sampling (GOSS), parallel learning, and exclusive feature bundling (EFB) within an integrated learning framework. This approach effectively manages large-scale data and high-dimensional variables by combining multiple weak learners into a single strong predictor (Cakiroglu et al., 2024; Wang and Jiang, 2023; Wen et al., 2021). While LightGBM offers significant improvements in computational speed and prediction accuracy, its complex internal structure poses challenges for interpretability. Although it can assess variable importance through the frequency of variable splits or gains from splits, its local interpretability remains limited, making it difficult for researchers to fully understand how specific variables influence prediction outcomes (Wang and Jiang, 2023). CatBoost, developed by Yandex in 2018, is another machine learning algorithm based on the boosting strategy. It integrates weak learners by minimizing the loss function to create an optimal model (Xiao et al., 2023). CatBoost is recognized for its strong performance, particularly in handling categorical variables and missing data, and features a simplified parameter set (Joo et al., 2023). It addresses overfitting through ordered boosting and target encoding while resolving issues of gradient and prediction bias, thereby enhancing both accuracy and generalization capabilities (Cakiroglu et al., 2024; Lin et al., 2023; Shi et al., 2024; Xiao et al., 2023).
The effectiveness of classification using models like LightGBM, XGBoost, and CatBoost can be significantly influenced by the choice of hyperparameters (Shakeel et al., 2023; Altaf and Kaul, 2024; Joo et al., 2023). Proper hyperparameter tuning enhances model robustness, reduces complexity, and prevents overfitting. However, the vast number of possible hyperparameter combinations makes manual selection both time-consuming and inefficient, often failing to guarantee optimal results. To address this, we utilized the GridSearchCV function from Scikit-learn in this study to optimize and evaluate the tree model parameters, aiming to prevent overfitting and improve predictive accuracy (Mishra et al., 2024; Sun et al., 2024).
GridSearchCV is a widely used hyperparameter search method that systematically determines the optimal hyperparameter values by exploring various combinations and comparing the resulting error values, akin to a manual trial-and-error process (Hidayat et al., 2024). The technique combines grid search for parameter combinations with cross-validation (CV) to reduce the likelihood of random error. In this study, we used 5-fold cross-validation, with the specific hyperparameters for each model detailed in Table 1.
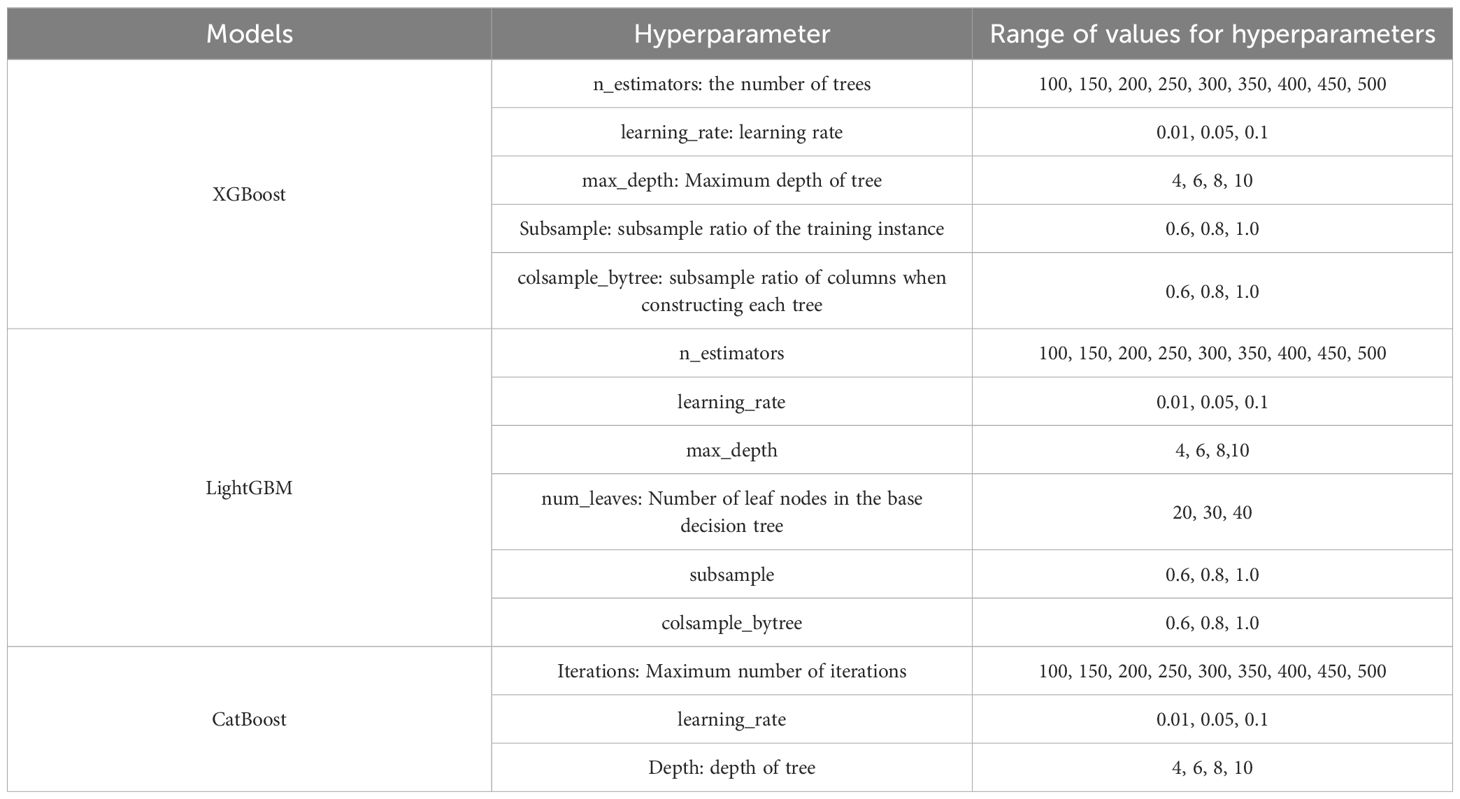
Table 1. Hyperparameter settings for XGBoost, LightGBM and CatBoost models.
SHAP (Shapley Additive exPlanations), introduced by Lundberg and Lee (2017), is a method for interpreting machine learning models using principles from game theory. In SHAP, each explanatory variable is assigned a value, known as the Shapley value, that reflects its contribution to the model’s output in terms of both magnitude and direction (positive or negative). This approach balances accuracy with interpretability, offering clear and meaningful explanations for the decisions made by machine learning models. The core concept of SHAP involves breaking down the importance of each variable into a weighted sum of Shapley values, which represent the contribution of different variable values. By approximating complex machine learning models with multiple linear models, SHAP calculates the contribution of each variable during the prediction process. The calculation of Shapley values follows the equation provided by Khiem et al. (2023) and Li et al. (2023).
denotes the contribution of the ith variable; N denotes the set of all variables; S denotes the subset of the given predicted variables; and and stand for the model results that include or exclude the ith variable, respectively. SHAP approximates the complex model by the superposition of multiple linear models, and is defined for the output model with M variables, as a linear sum of input variables (Cha et al., 2021; Li et al., 2023; Zhang et al., 2023b):
where is the value of the model, is a constant that explains the model (i.e., the predicted mean of all training samples), and is the interpolated value of each variable (Shapley value); denotes that it is equal to 1 when the ith variable is selected, and it is equal to 0 otherwise.
The SHAP interpretation method is locally accurate, handles missing data, and maintains consistency, making it effective for interpreting machine learning model outputs through both global and local analyses. It precisely quantifies the extent and direction in which each sample’s metrics influence the model’s predictions (Jovanovic et al., 2023; Kim and Kim, 2022). SHAP offers various visualization tools, including variable importance plots, individual force plots, SHAP summary plots, and SHAP heatmaps (Politikos et al., 2021).
Variable selection is an important step in machine learning, as it helps to reduce training time, simplify the model, and enhance prediction performance (Hu et al., 2021a). When variables have a high correlation, close to 1 or -1, it indicates redundancy, making some variables less useful for model training (Caponi et al., 2023; Li and Misra, 2021). In this study, the Pearson correlation coefficients for all fitted variables were below 0.9, so all variables were retained (Figure 3).
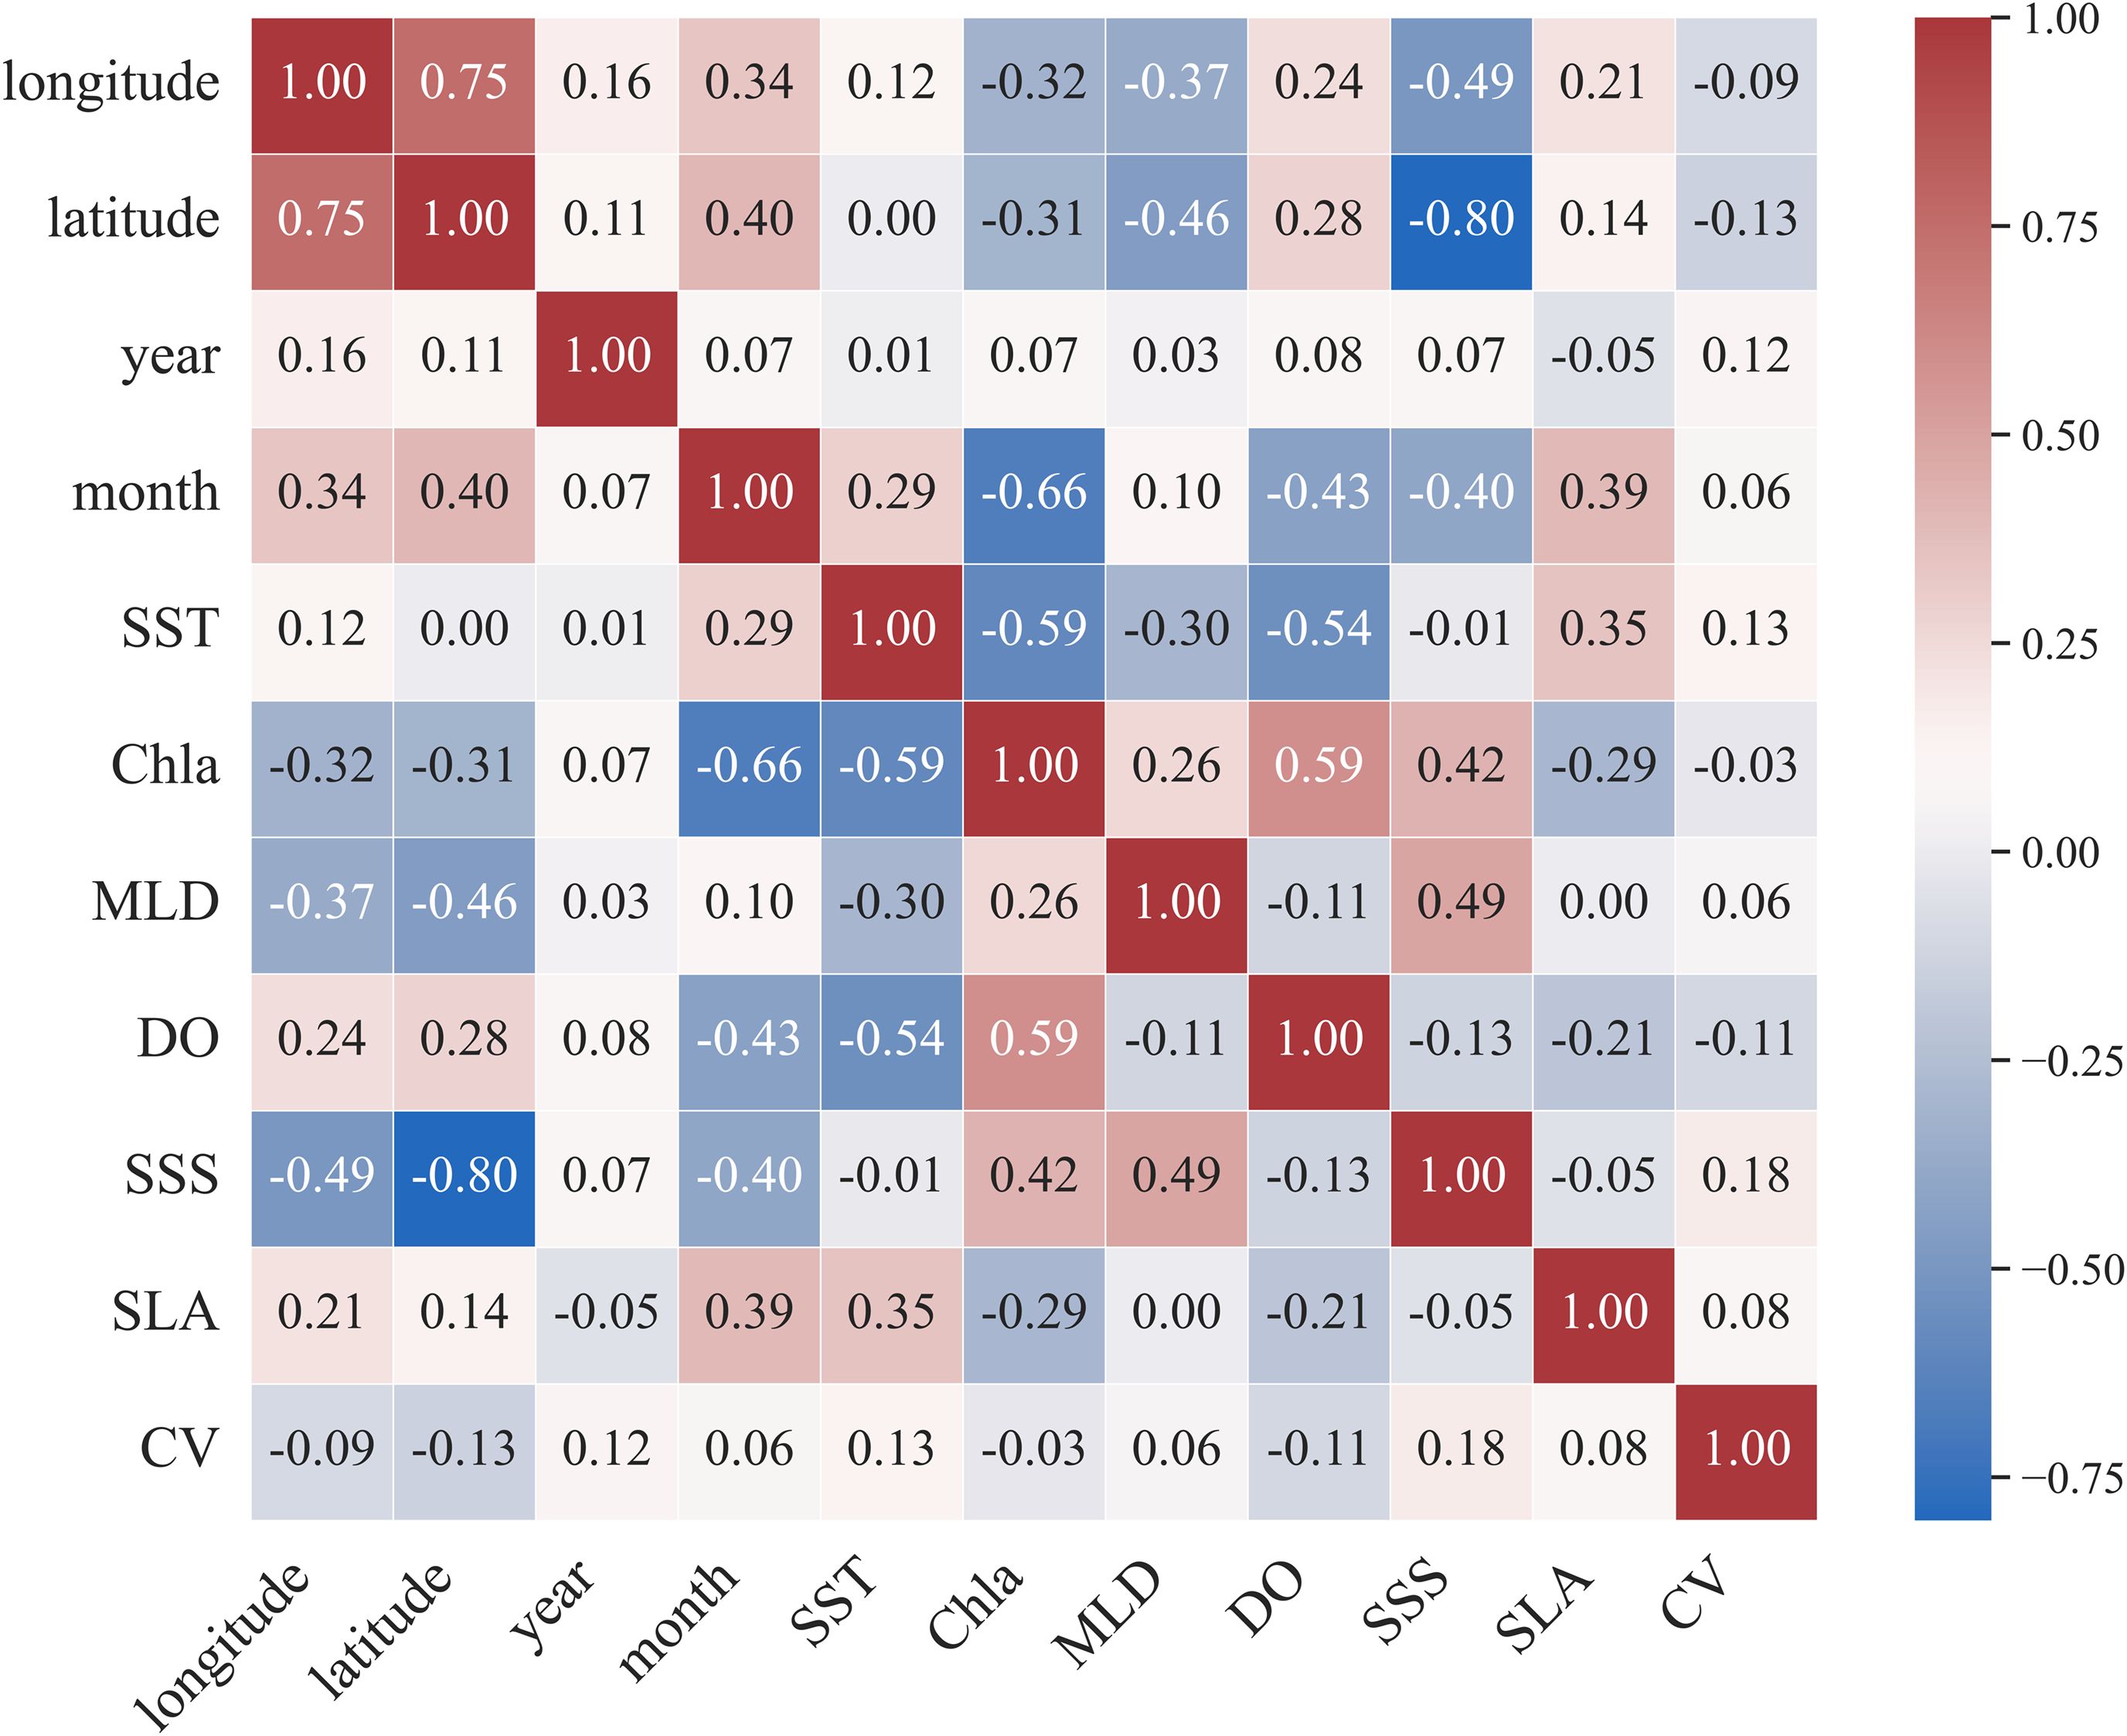
Figure 3. Pearson correlation coefficient test plot between different variables.
To quantitatively assess the model’s performance, the data in this study were randomly split into a training dataset (70%) for model development and a test dataset (30%) for performance evaluation. The confusion matrix is a key metric for accurately assessing the model’s classification efficiency and can be used for monitoring (Krishnamoorthy and Lakshmanan, 2024). In this study, true positive (TP), false positive (FP), true negative (TN), and false negative (FN) values were utilized to calculate accuracy, precision, recall, and F1-score. The formulas for these metrics are provided below (Chen et al., 2023).
Where TP refers to cases where the actual value is positive, and the prediction is also positive. TN indicates that both the actual and predicted values are negative. FP occurs when the actual value is negative, but the prediction is positive. FN arises when the actual value is positive, but the prediction is incorrect and negative.
Given the inherent trade-off between precision and recall, the F1-score is often used to balance these two metrics (Abdalla et al., 2023; Chen et al., 2023; Krishnamoorthy and Lakshmanan, 2024). Therefore, this study utilizes accuracy and F1-score as the primary evaluation metrics to assess the model’s predictive performance.
In terms of inter-annual variation (Figure 4A), the annual catch of Japanese sardine in the NWPO from 2014 to 2021 showed an overall increasing trend, and reached a peak of 220,009 tons in 2021. Regarding inter-monthly variation (Figure 4B), the total monthly catch from April to December showed a “peak” distribution trend, with the catch increasing and then decreasing, reaching a maximum of 76,033 tons in July.
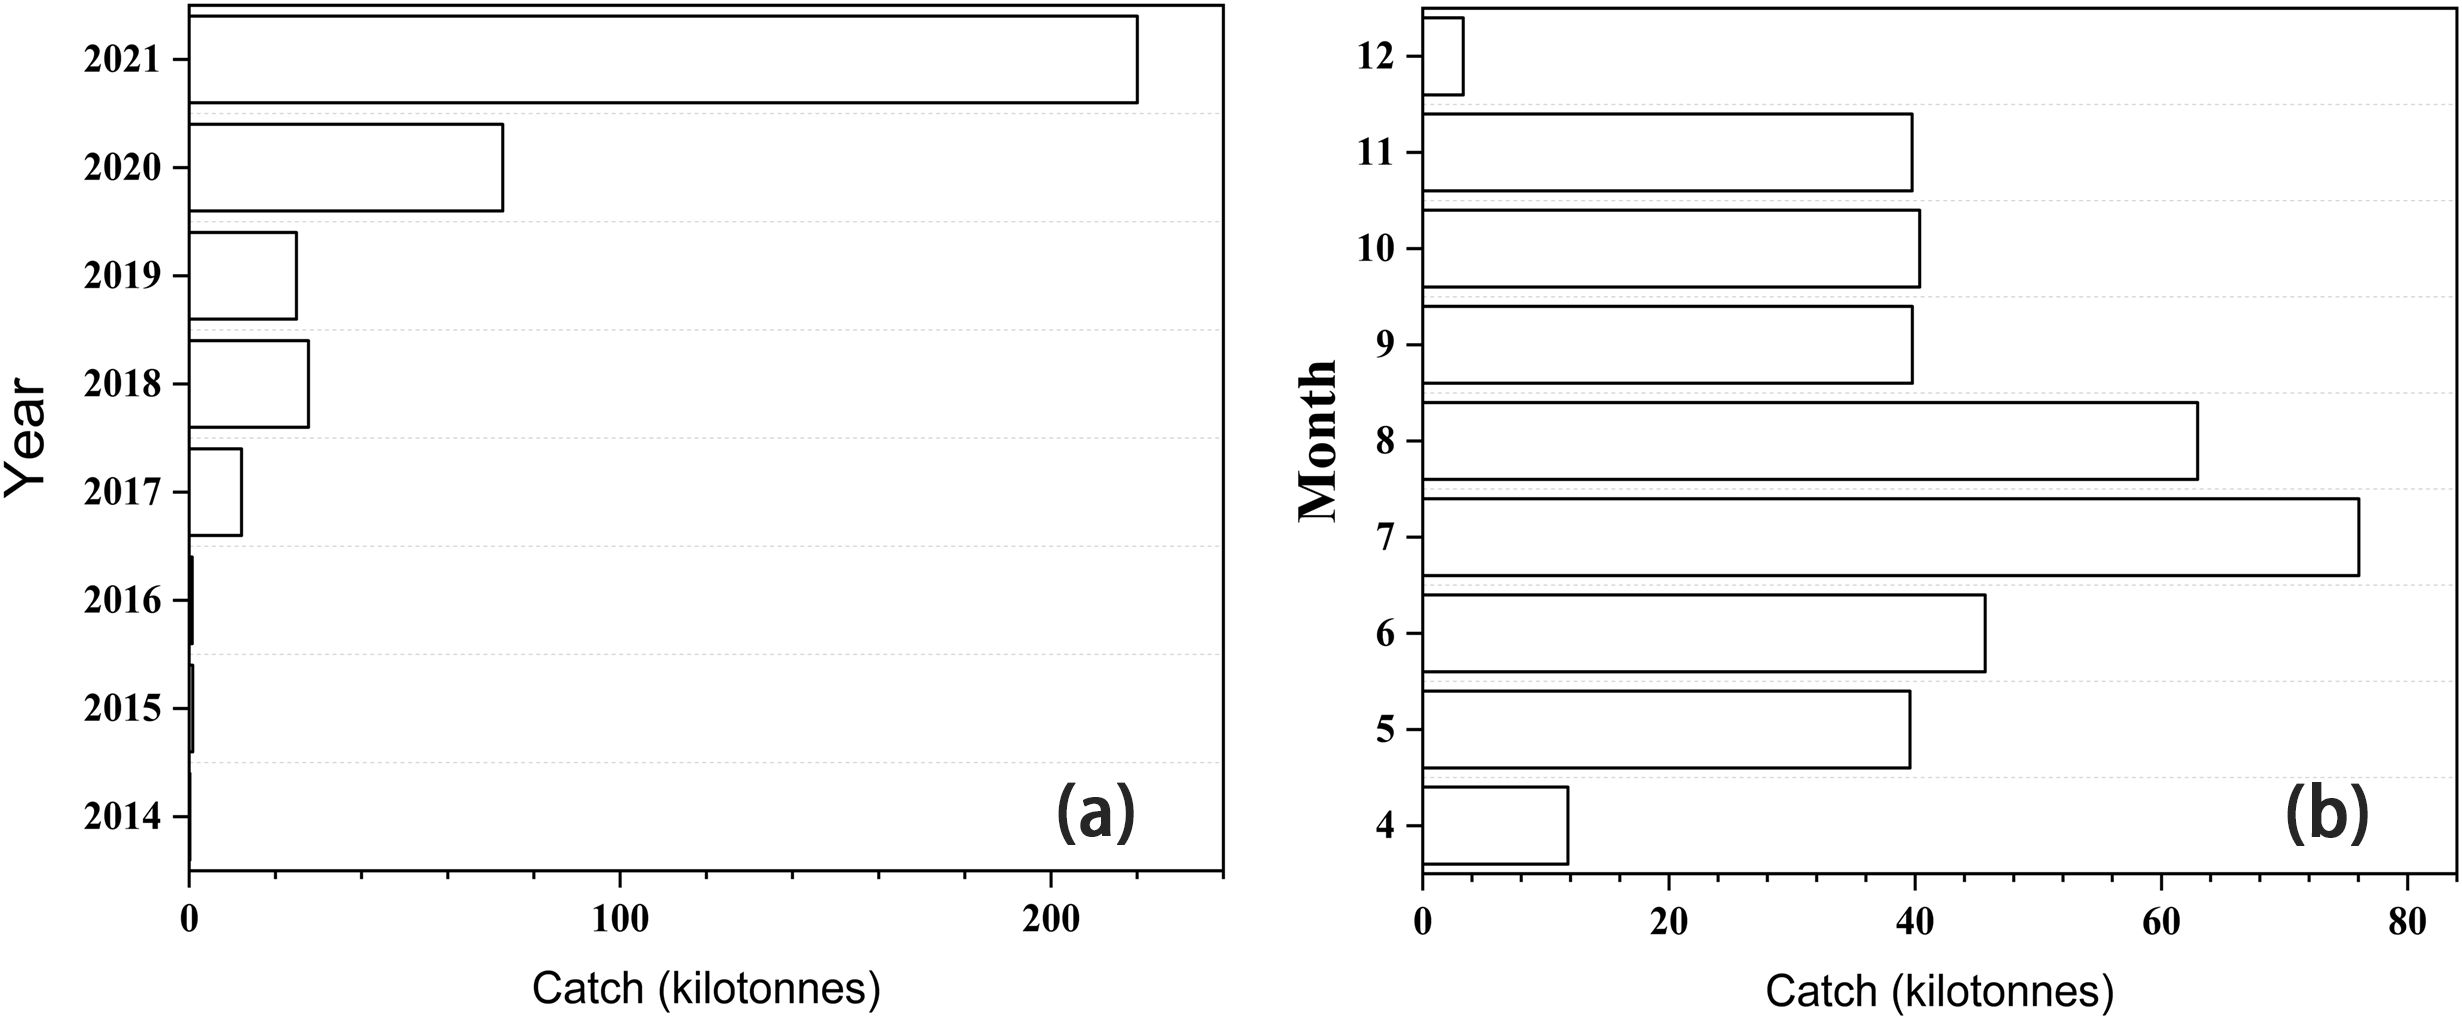
Figure 4. Changes in total inter-annual (A) and (B) inter-monthly catch of the Japanese sardine from 2014 to 2021.
The distribution of catches by latitude and longitude showed that the total catches from 2014 to 2021 were concentrated in the 39.5°N -43°N and 146.75°E -155.75°E regions (Figure 5).
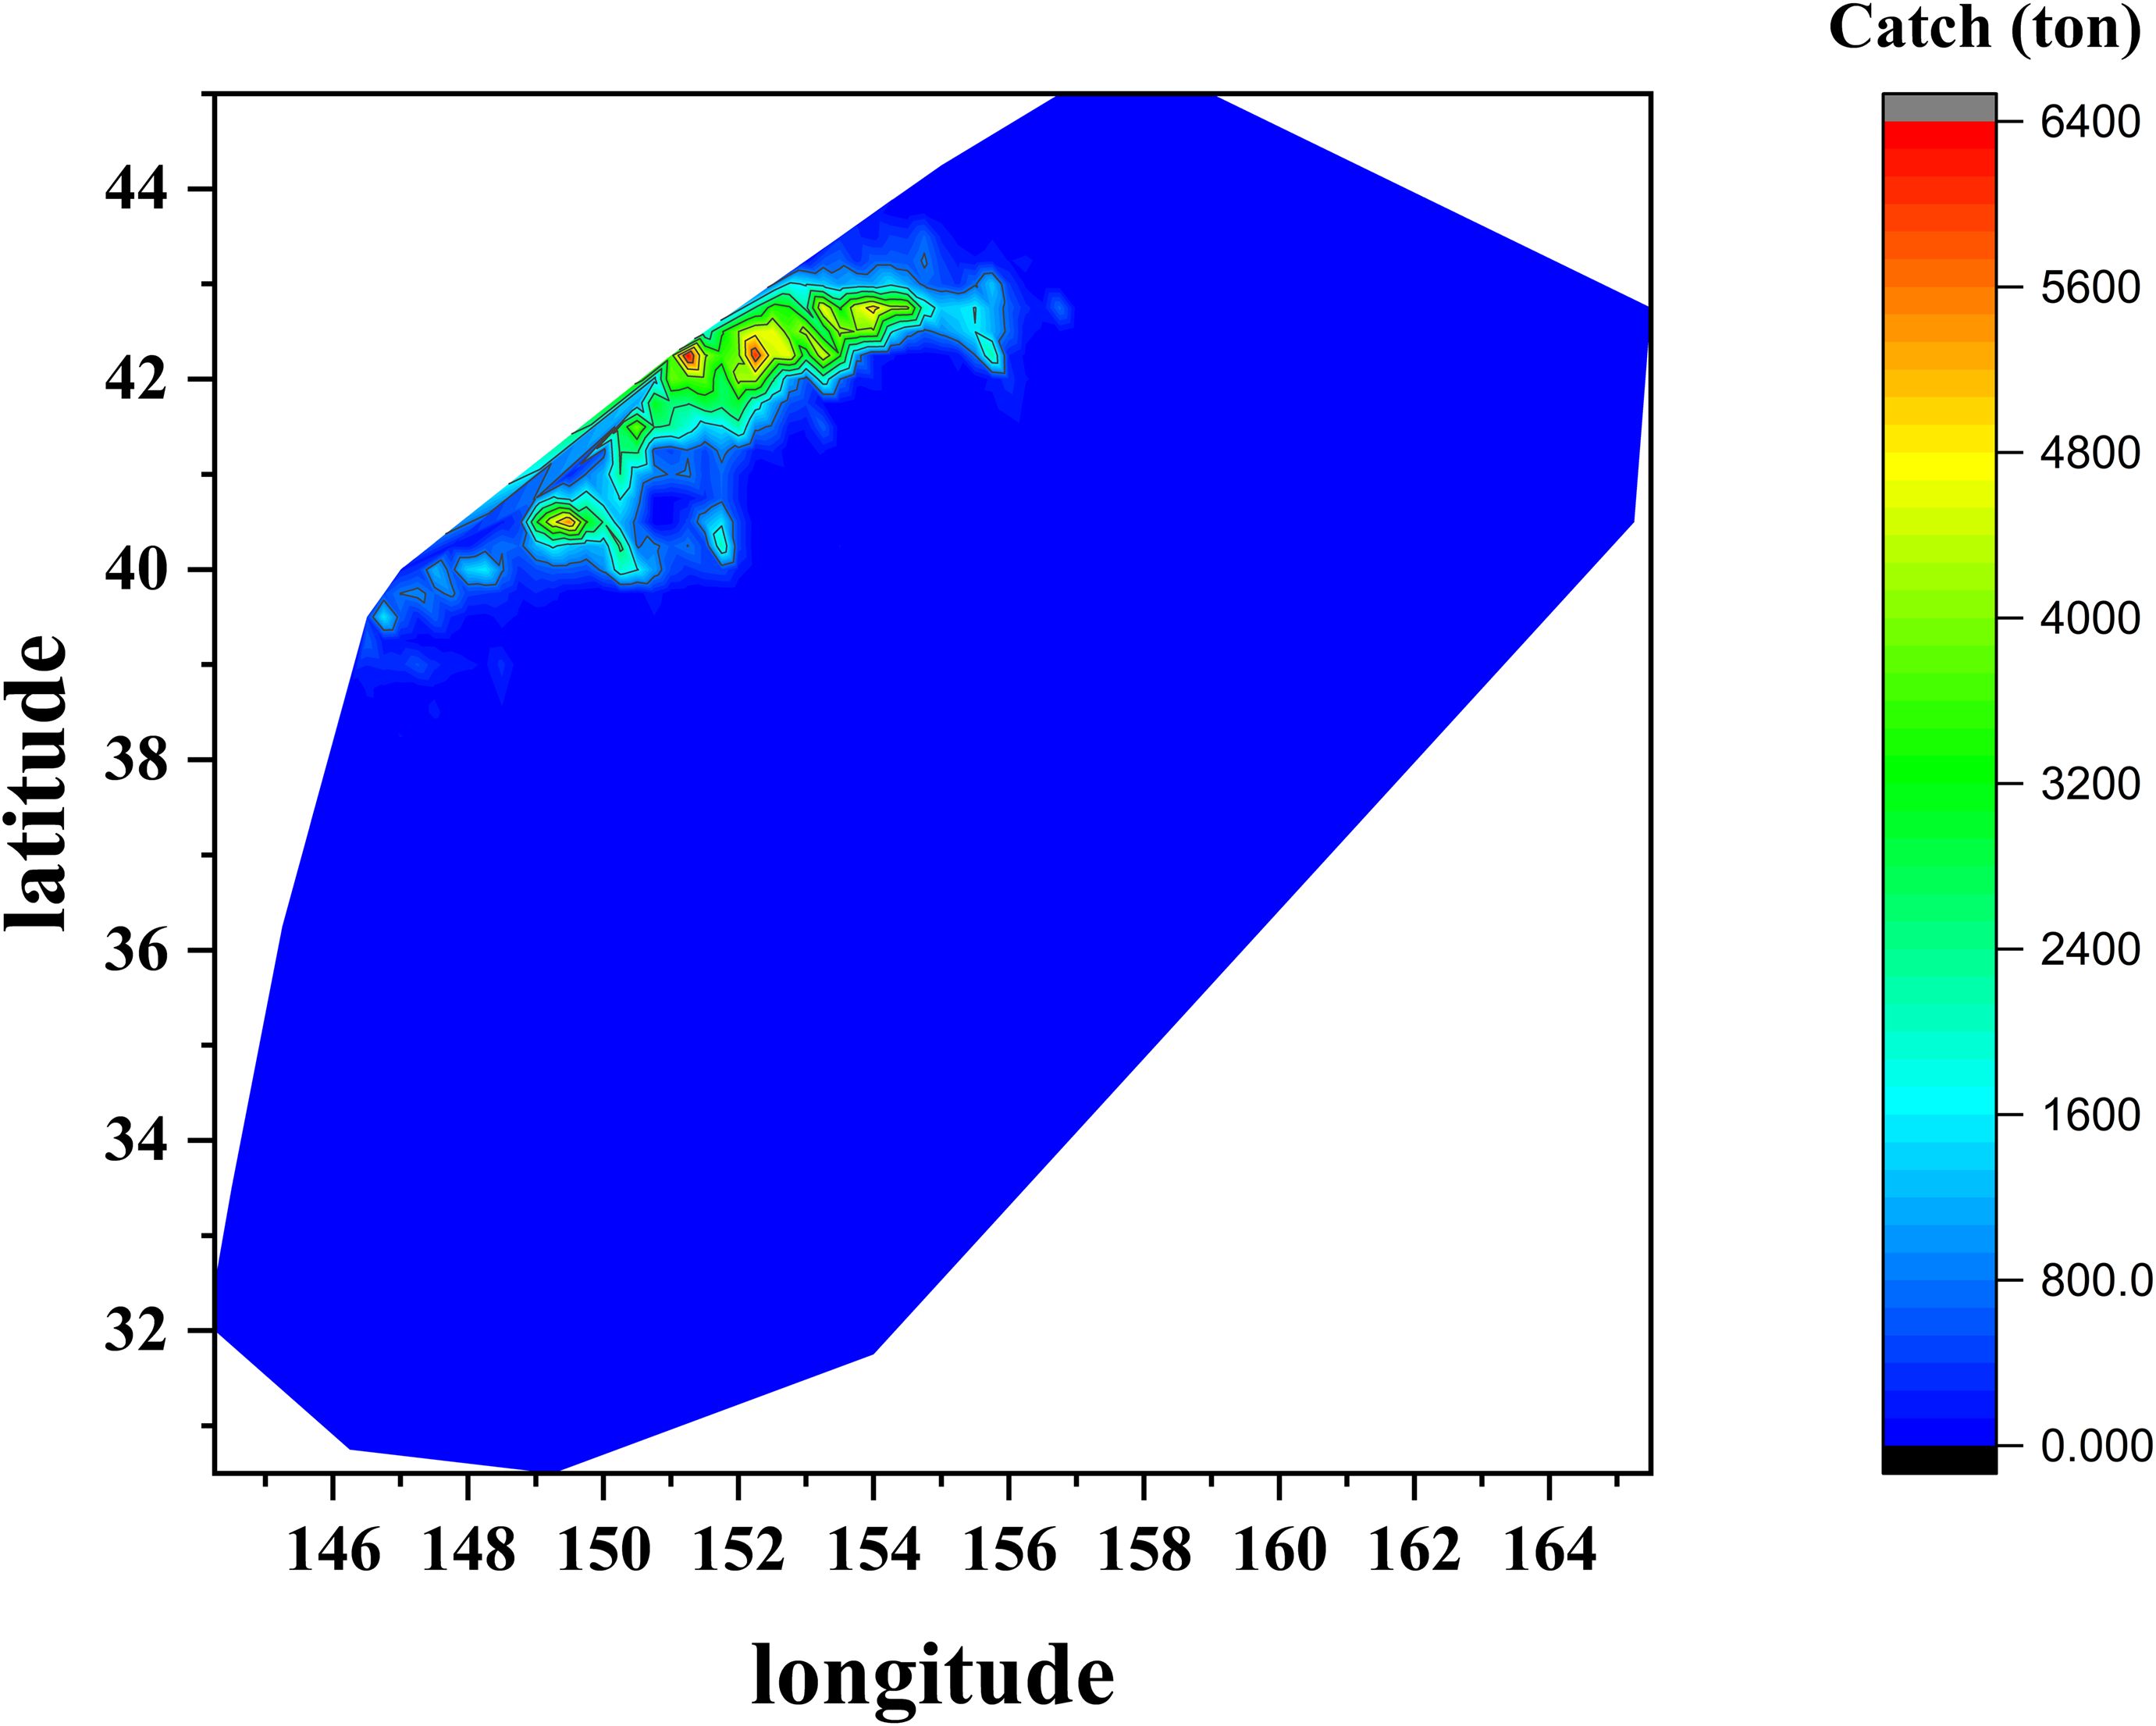
Figure 5. Changes in the distribution of total catch of Japanese sardine by longitude and latitude from 2014 to 2021.
More accurate models can typically predict high and low abundance fishing grounds better, and in this article, XGBoost, LightGBM and Catboost models were constructed for comparative analysis. As shown in Figure 6, the Catboost model outperformed the LightGBM and XGBoost models in terms of prediction, achieving the highest values of Accuracy and F1-score at 73.8% and 75.31%, respectively. What’s more, LightGBM model (Accuracy=73.21%, F1-score=74.01%) outperformed XGBoost model (Accuracy=72.31%, F1-score=73.17%) in terms of prediction performance.
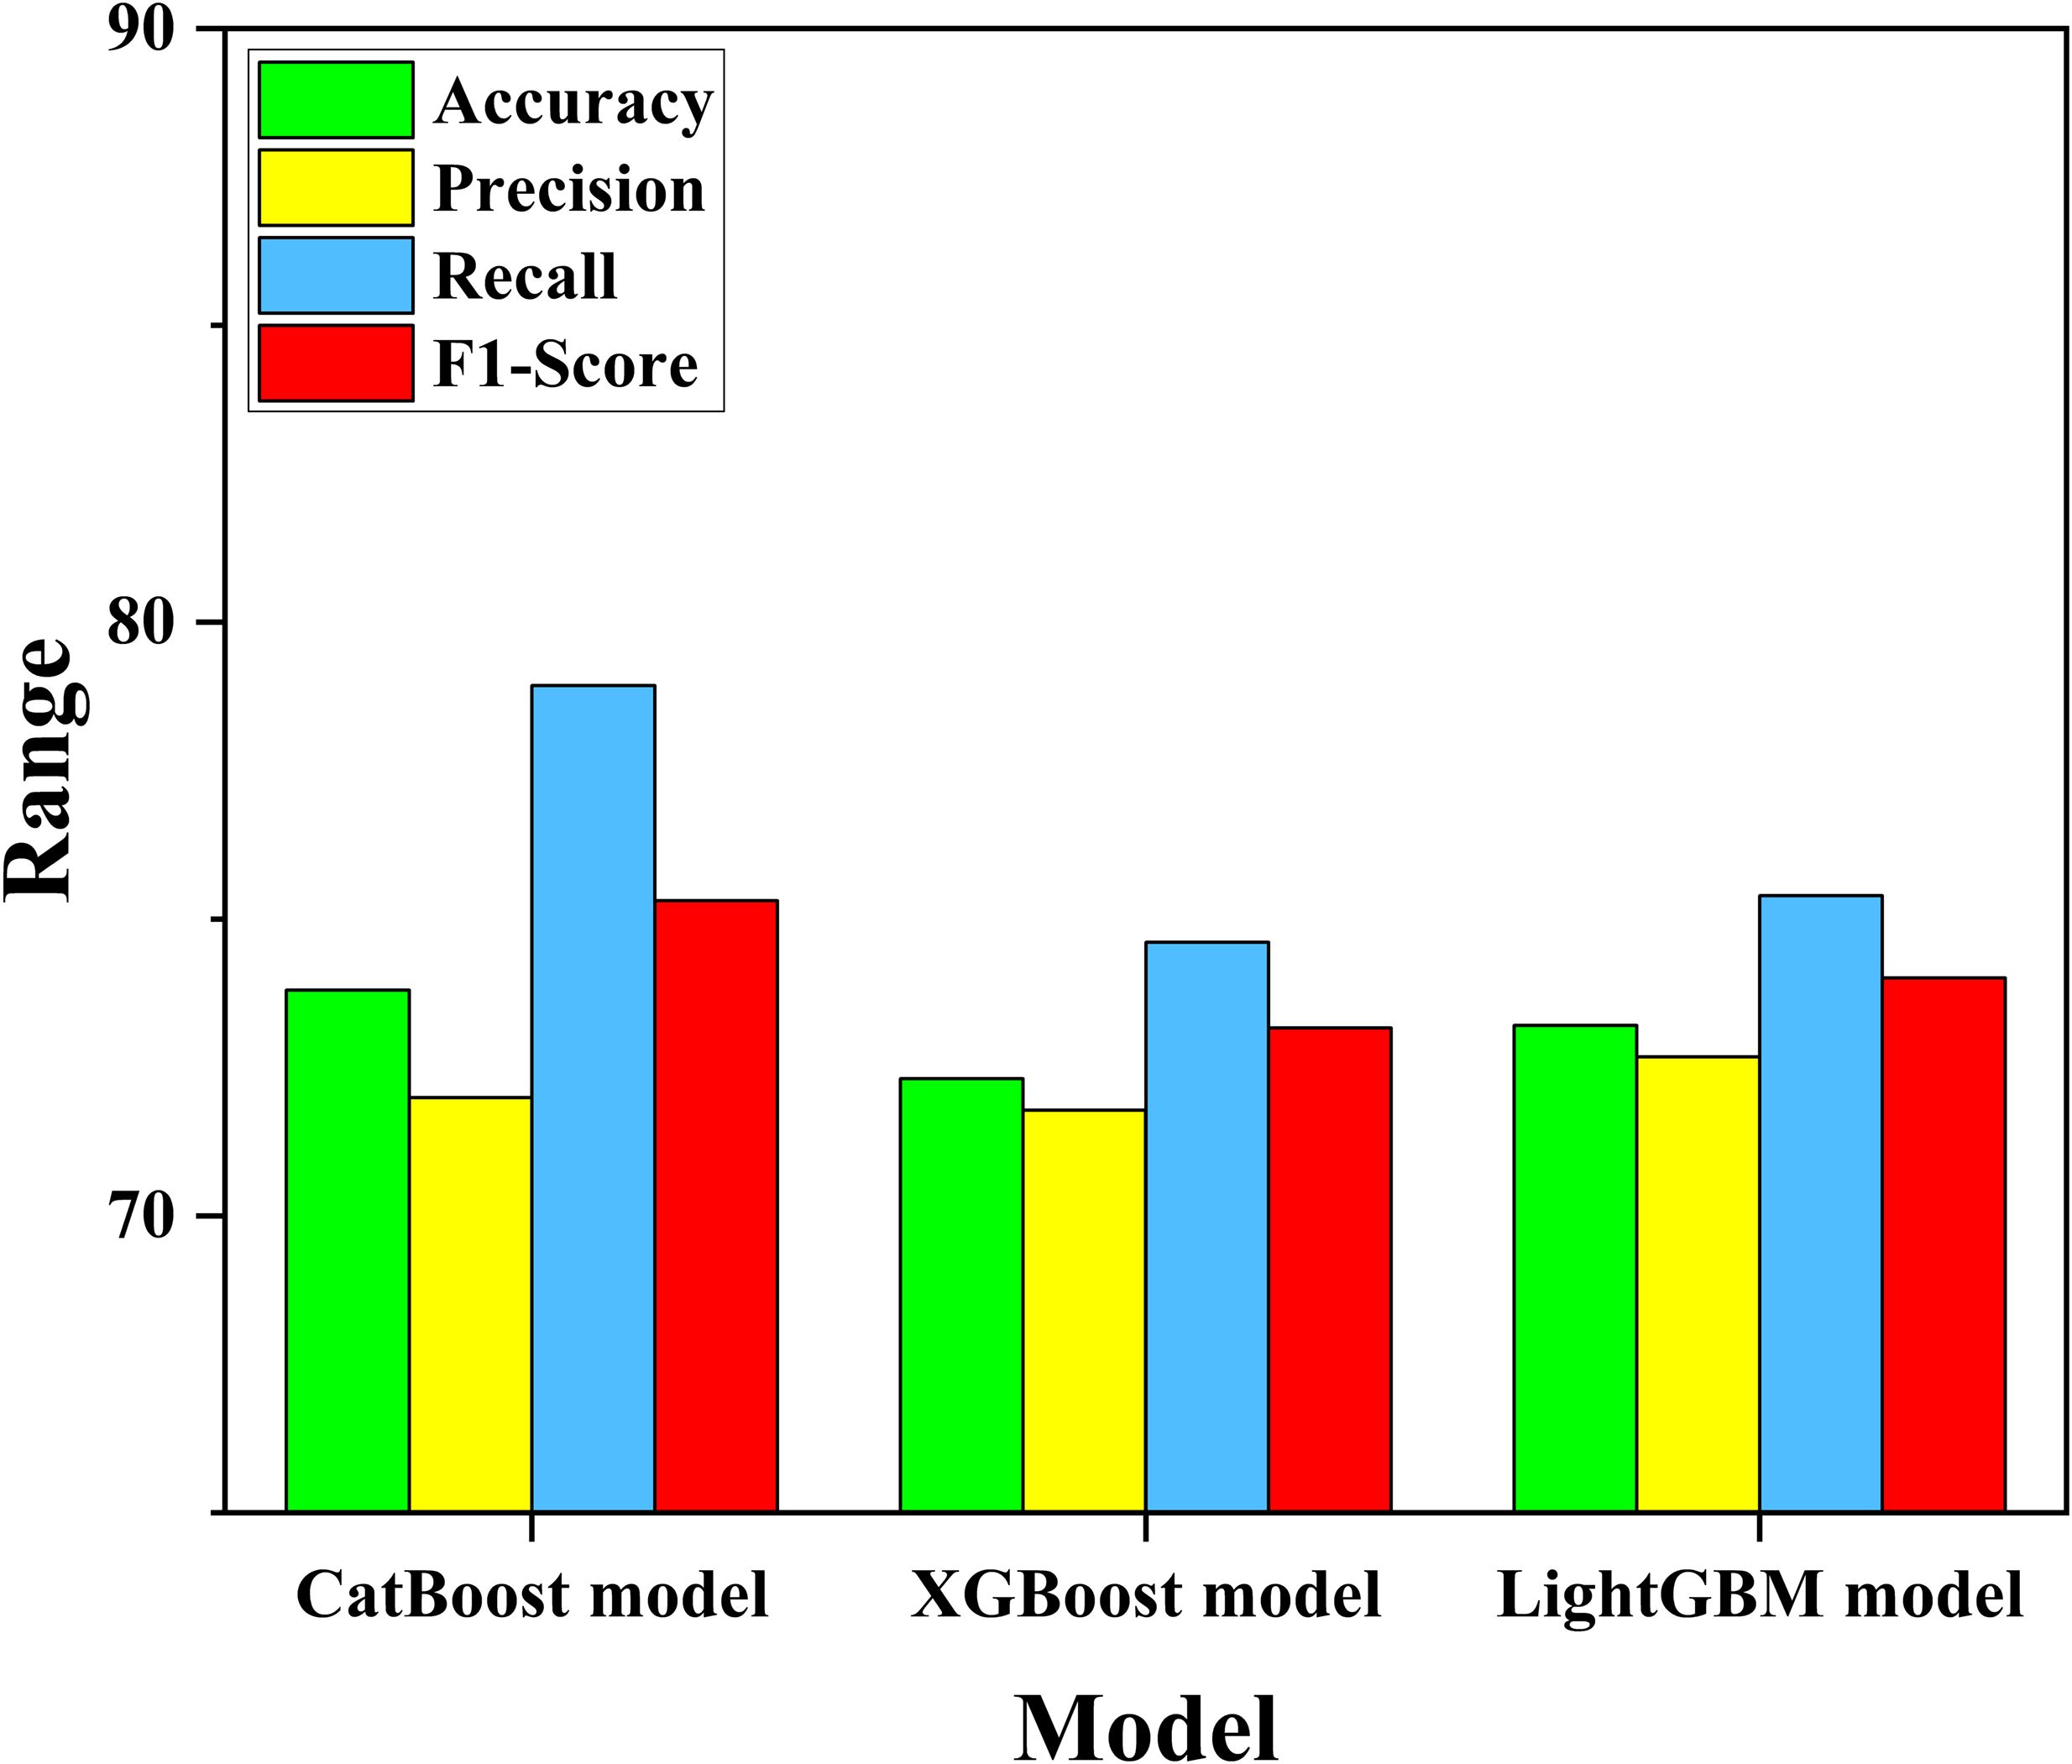
Figure 6. Comparison chart of four evaluation indicators for three models (%).
In this study, we employed two methods to assess the importance of each variable: the model’s built-in (split) method and the SHAP summary plot method. The importance rankings derived from these methods are presented in Figure 7. The overall rankings of variable importance differed significantly between the two methods (Figure 7). According to the built-in method, the variables were ranked in the following order: CV, SLA, SST, year, SSS, MLD, longitude, DO, latitude, Chla, and month. In contrast, the SHAP method ranked the variables as follows: longitude, SSS, latitude, SLA, SST, CV, year, MLD, DO, Chla, and month. Compared to the built-in method, the SHAP method assigned greater importance to spatial variables, while temporal (year) and environmental variables were ranked lower. However, when examining the rankings from the perspectives of temporal, spatial, and environment separately, the differences between the two methods were only apparent in the environmental variables. Compared to the built-in method, the SHAP method assigned greater importance to spatial variables, while temporal (year) and environmental variables were ranked lower.
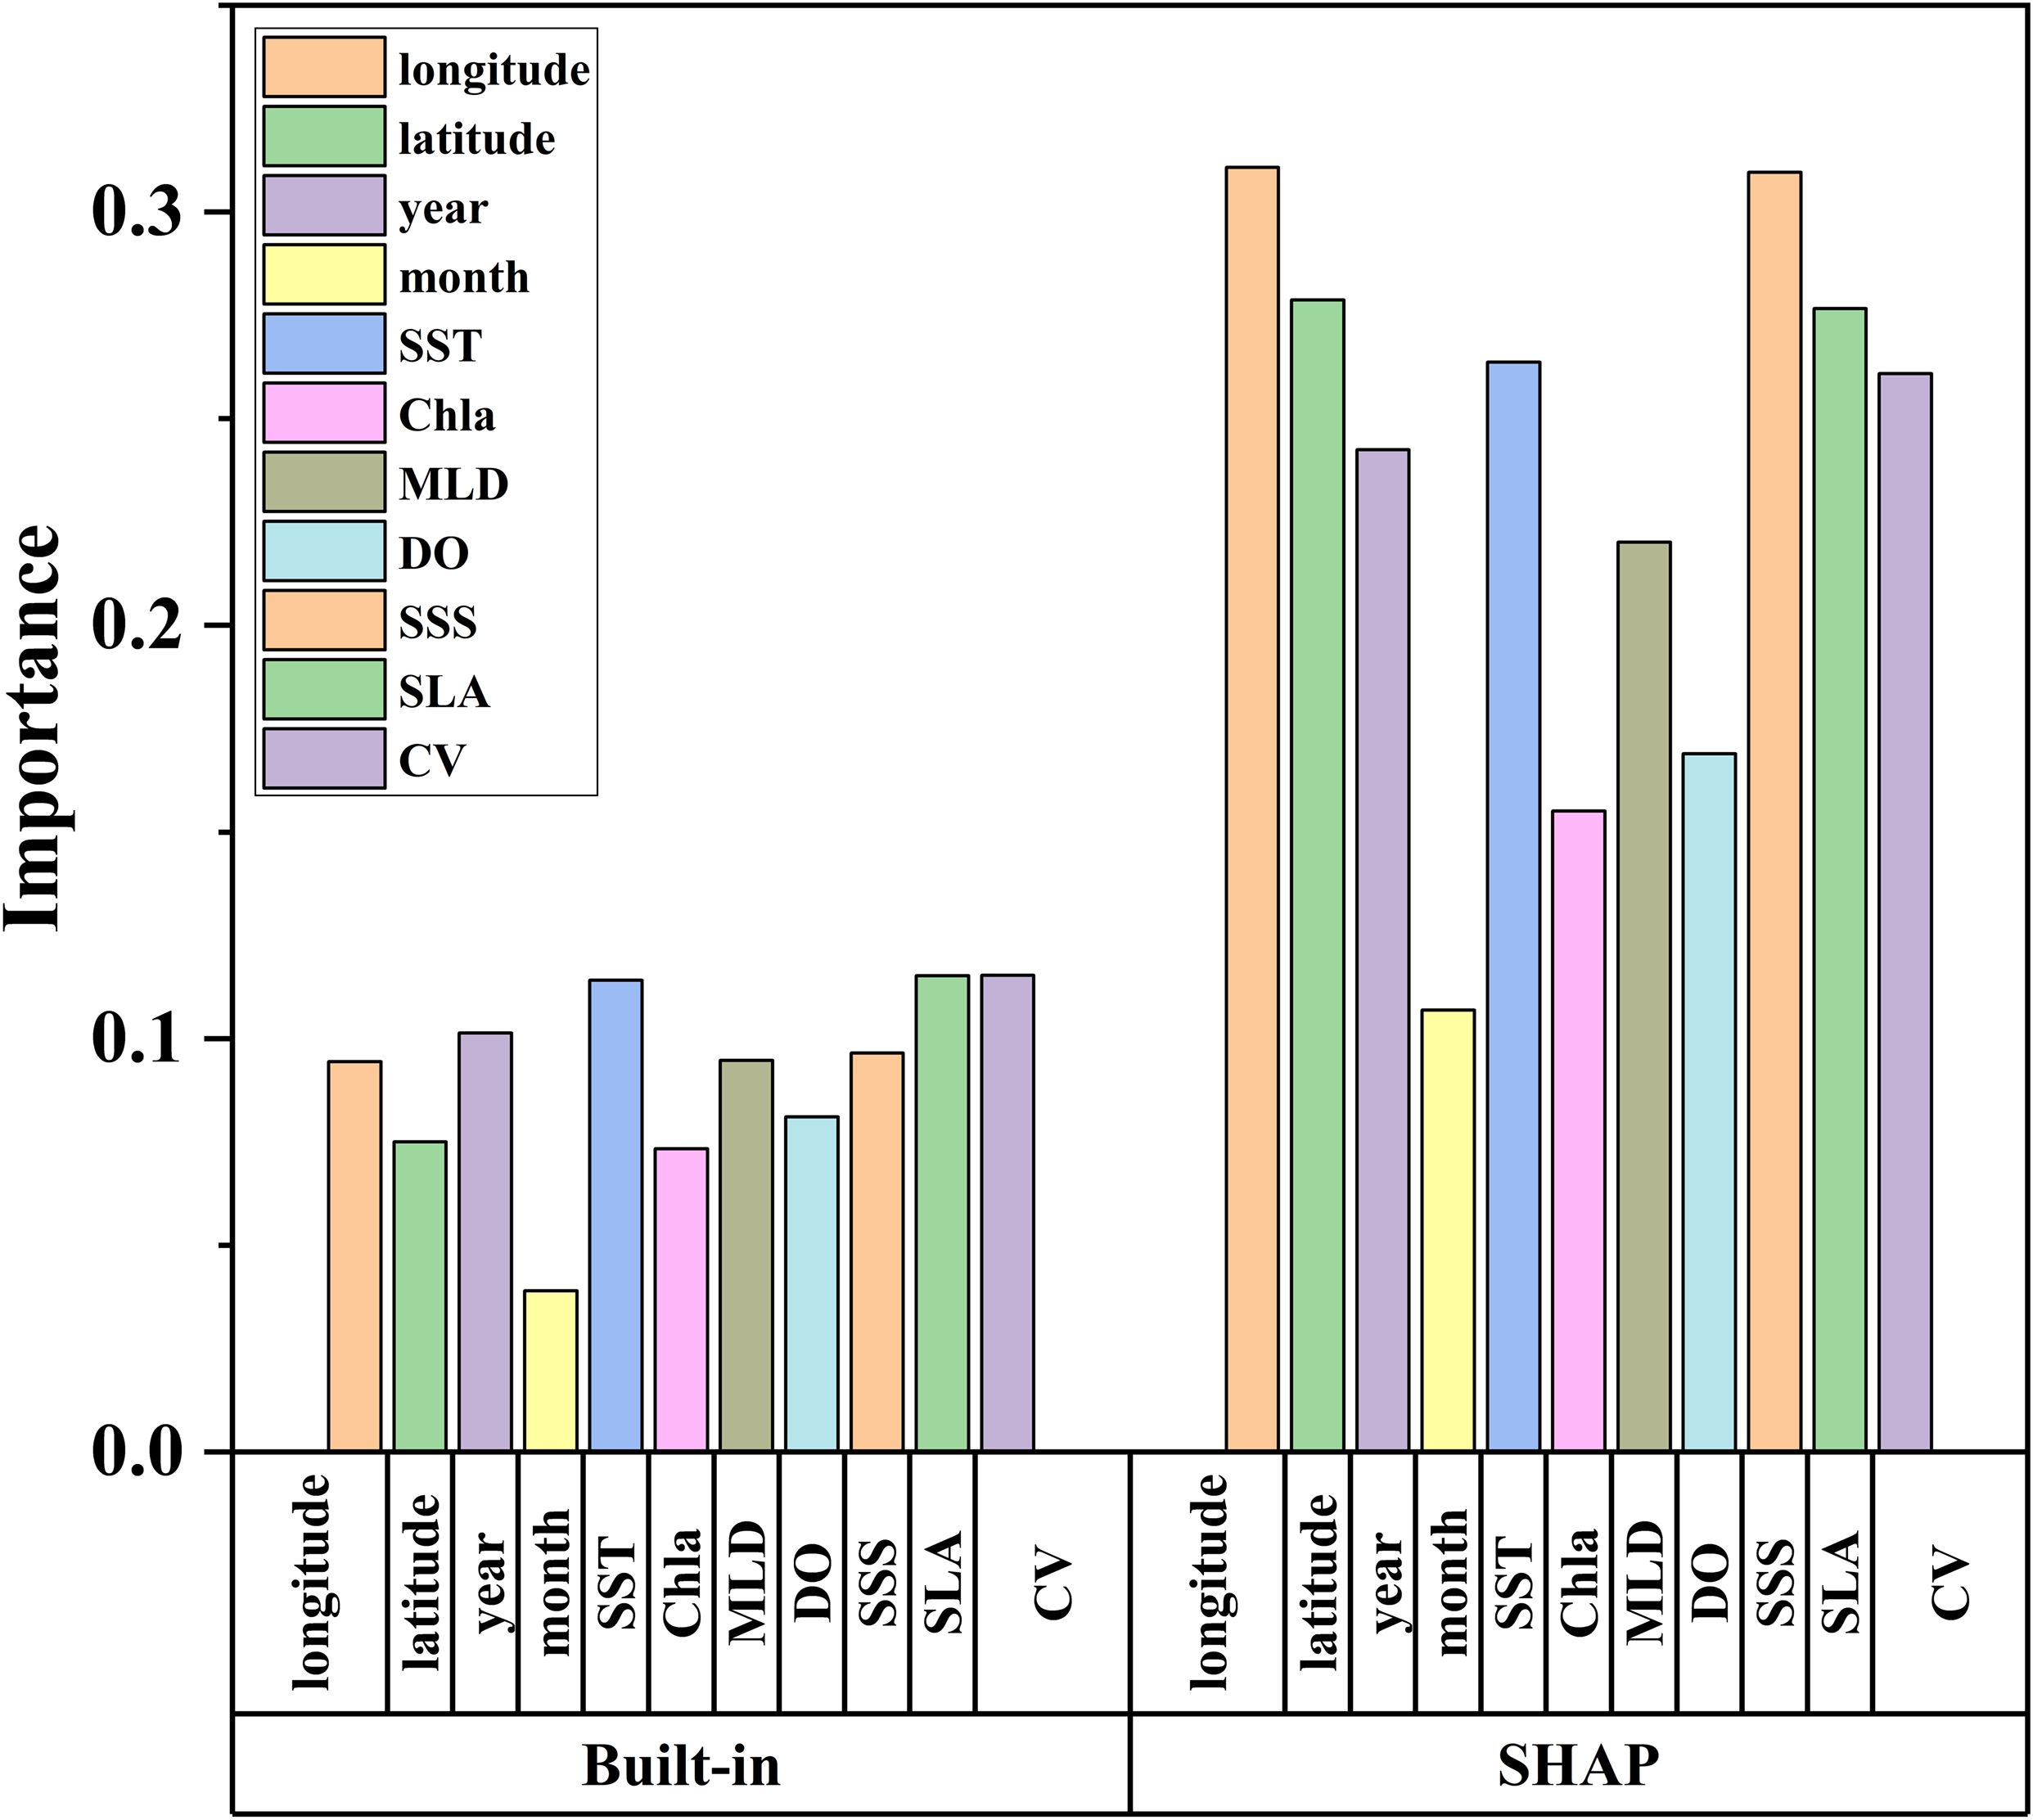
Figure 7. Plot of differences in ranking the importance of different variables based on the model built-in and the SHAP approach.
In contrast to the model’s built-in importance approach, the SHAP method offers a more detailed visualization of model decisions, providing both global and local interpretability. Figure 8 highlights global interpretability, where variables like longitude, SSS, latitude, SLA, and SST emerge as the most influential. In Figure 8, red sample points indicate higher SHAP values for a given indicator, while blue points signify lower SHAP values. Indicators with a positive contribution appear as blue on the left, purple in the middle, and red on the right. Conversely, those with a negative contribution are shown as red on the left, purple in the middle, and blue on the right. Among the five most important variables, longitude, SSS, and SLA have significant negative contributions, while latitude and SST contribute positively. This indicates that higher values of longitude, SSS, and SLA negatively impact the prediction of central fishing grounds, whereas lower values of latitude and SST also play a negative role. While Figure 8 provides an overall view of each variable’s contribution to the prediction, a more comprehensive understanding of how variables influence each sample is needed. To achieve this, we used the SHAP heatmap plot (Figure 9), which offers a composite view of all test samples, illustrating the extent to which each variable is utilized in the model’s prediction process.
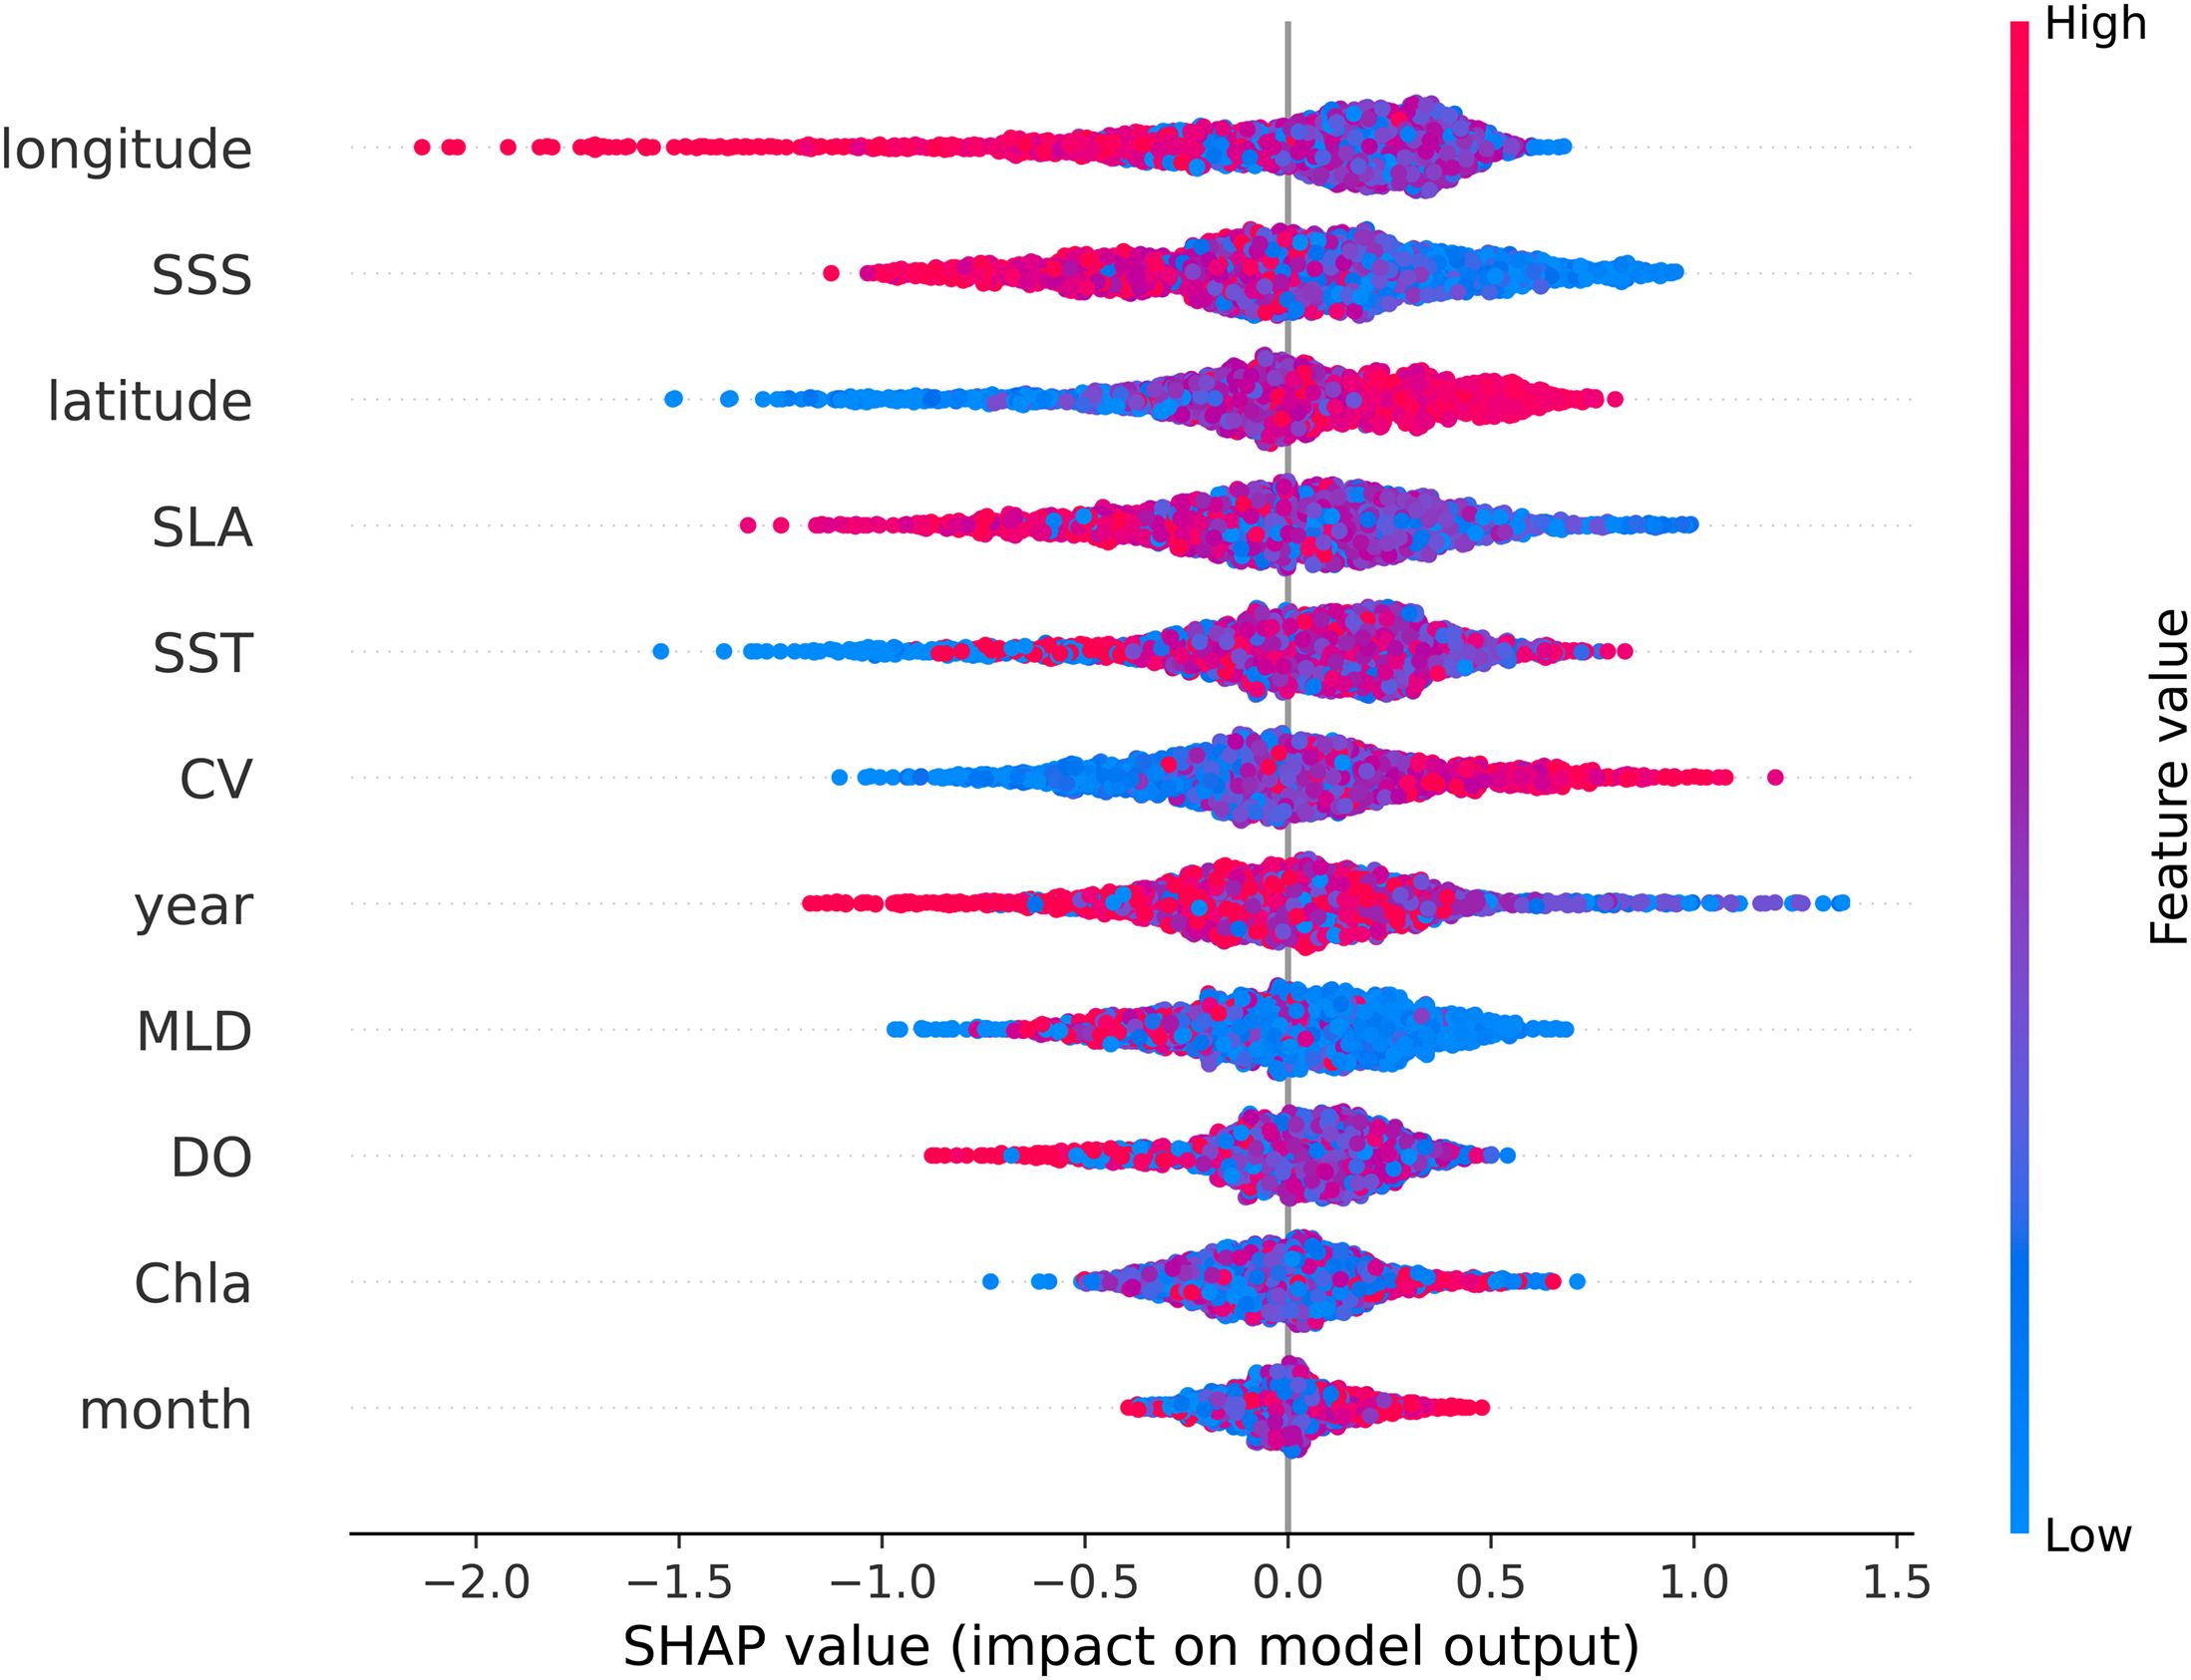
Figure 8. SHAP summary plot for predicting the Japanese sardine high abundance fishing grounds in the CatBoost model.
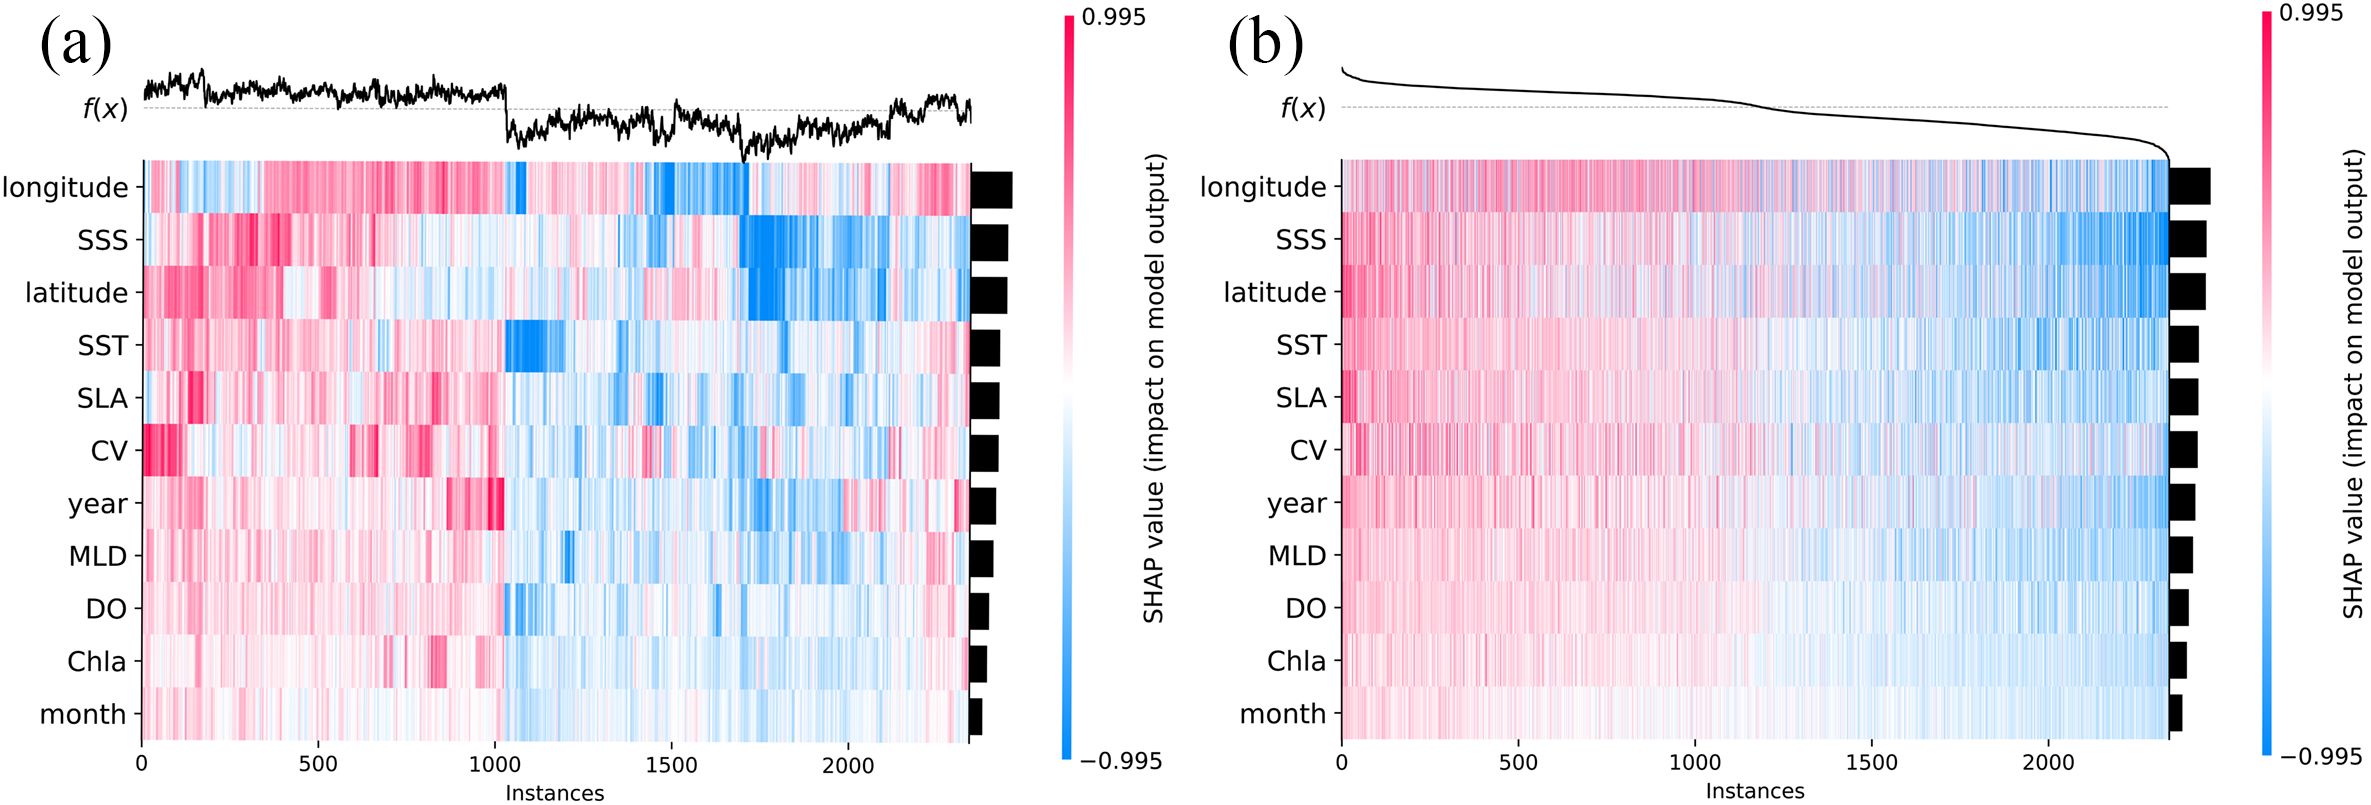
Figure 9. SHAP Heatmaps from the CatBoost model are used to predict the high abundance of fishing grounds for Japanese Sardines. [(B) groups samples with similar explanations based on (A)].
Figure 10 presents two random examples of localized explanations generated by the SHAP force plot, which highlight the specific contributions and relationships influencing the model’s outputs. In these figures, red areas indicate variables that positively contributed to predicting the Japanese sardine center fishing grounds, while blue areas show variables that had a negative impact. In Figure 10A, most variables fall within the red area, indicating a positive contribution to the prediction. The model’s output, f(x), was 1.16, higher than the base value, with the largest positive contributions coming from latitude (latitude = 40.25) and SSS (SSS = 33.68‰). The largest negative contribution was from longitude (longitude = 149.25). In contrast, Figure 10B shows a different pattern, where most variables are in the blue region. The most significant negative contributions were from DO (DO = 255.09 mmol/m³) and SST (SST = 14.23°C), while the largest positive contributions came from SLA (SLA = 0.04m) and longitude (longitude = 149.5).
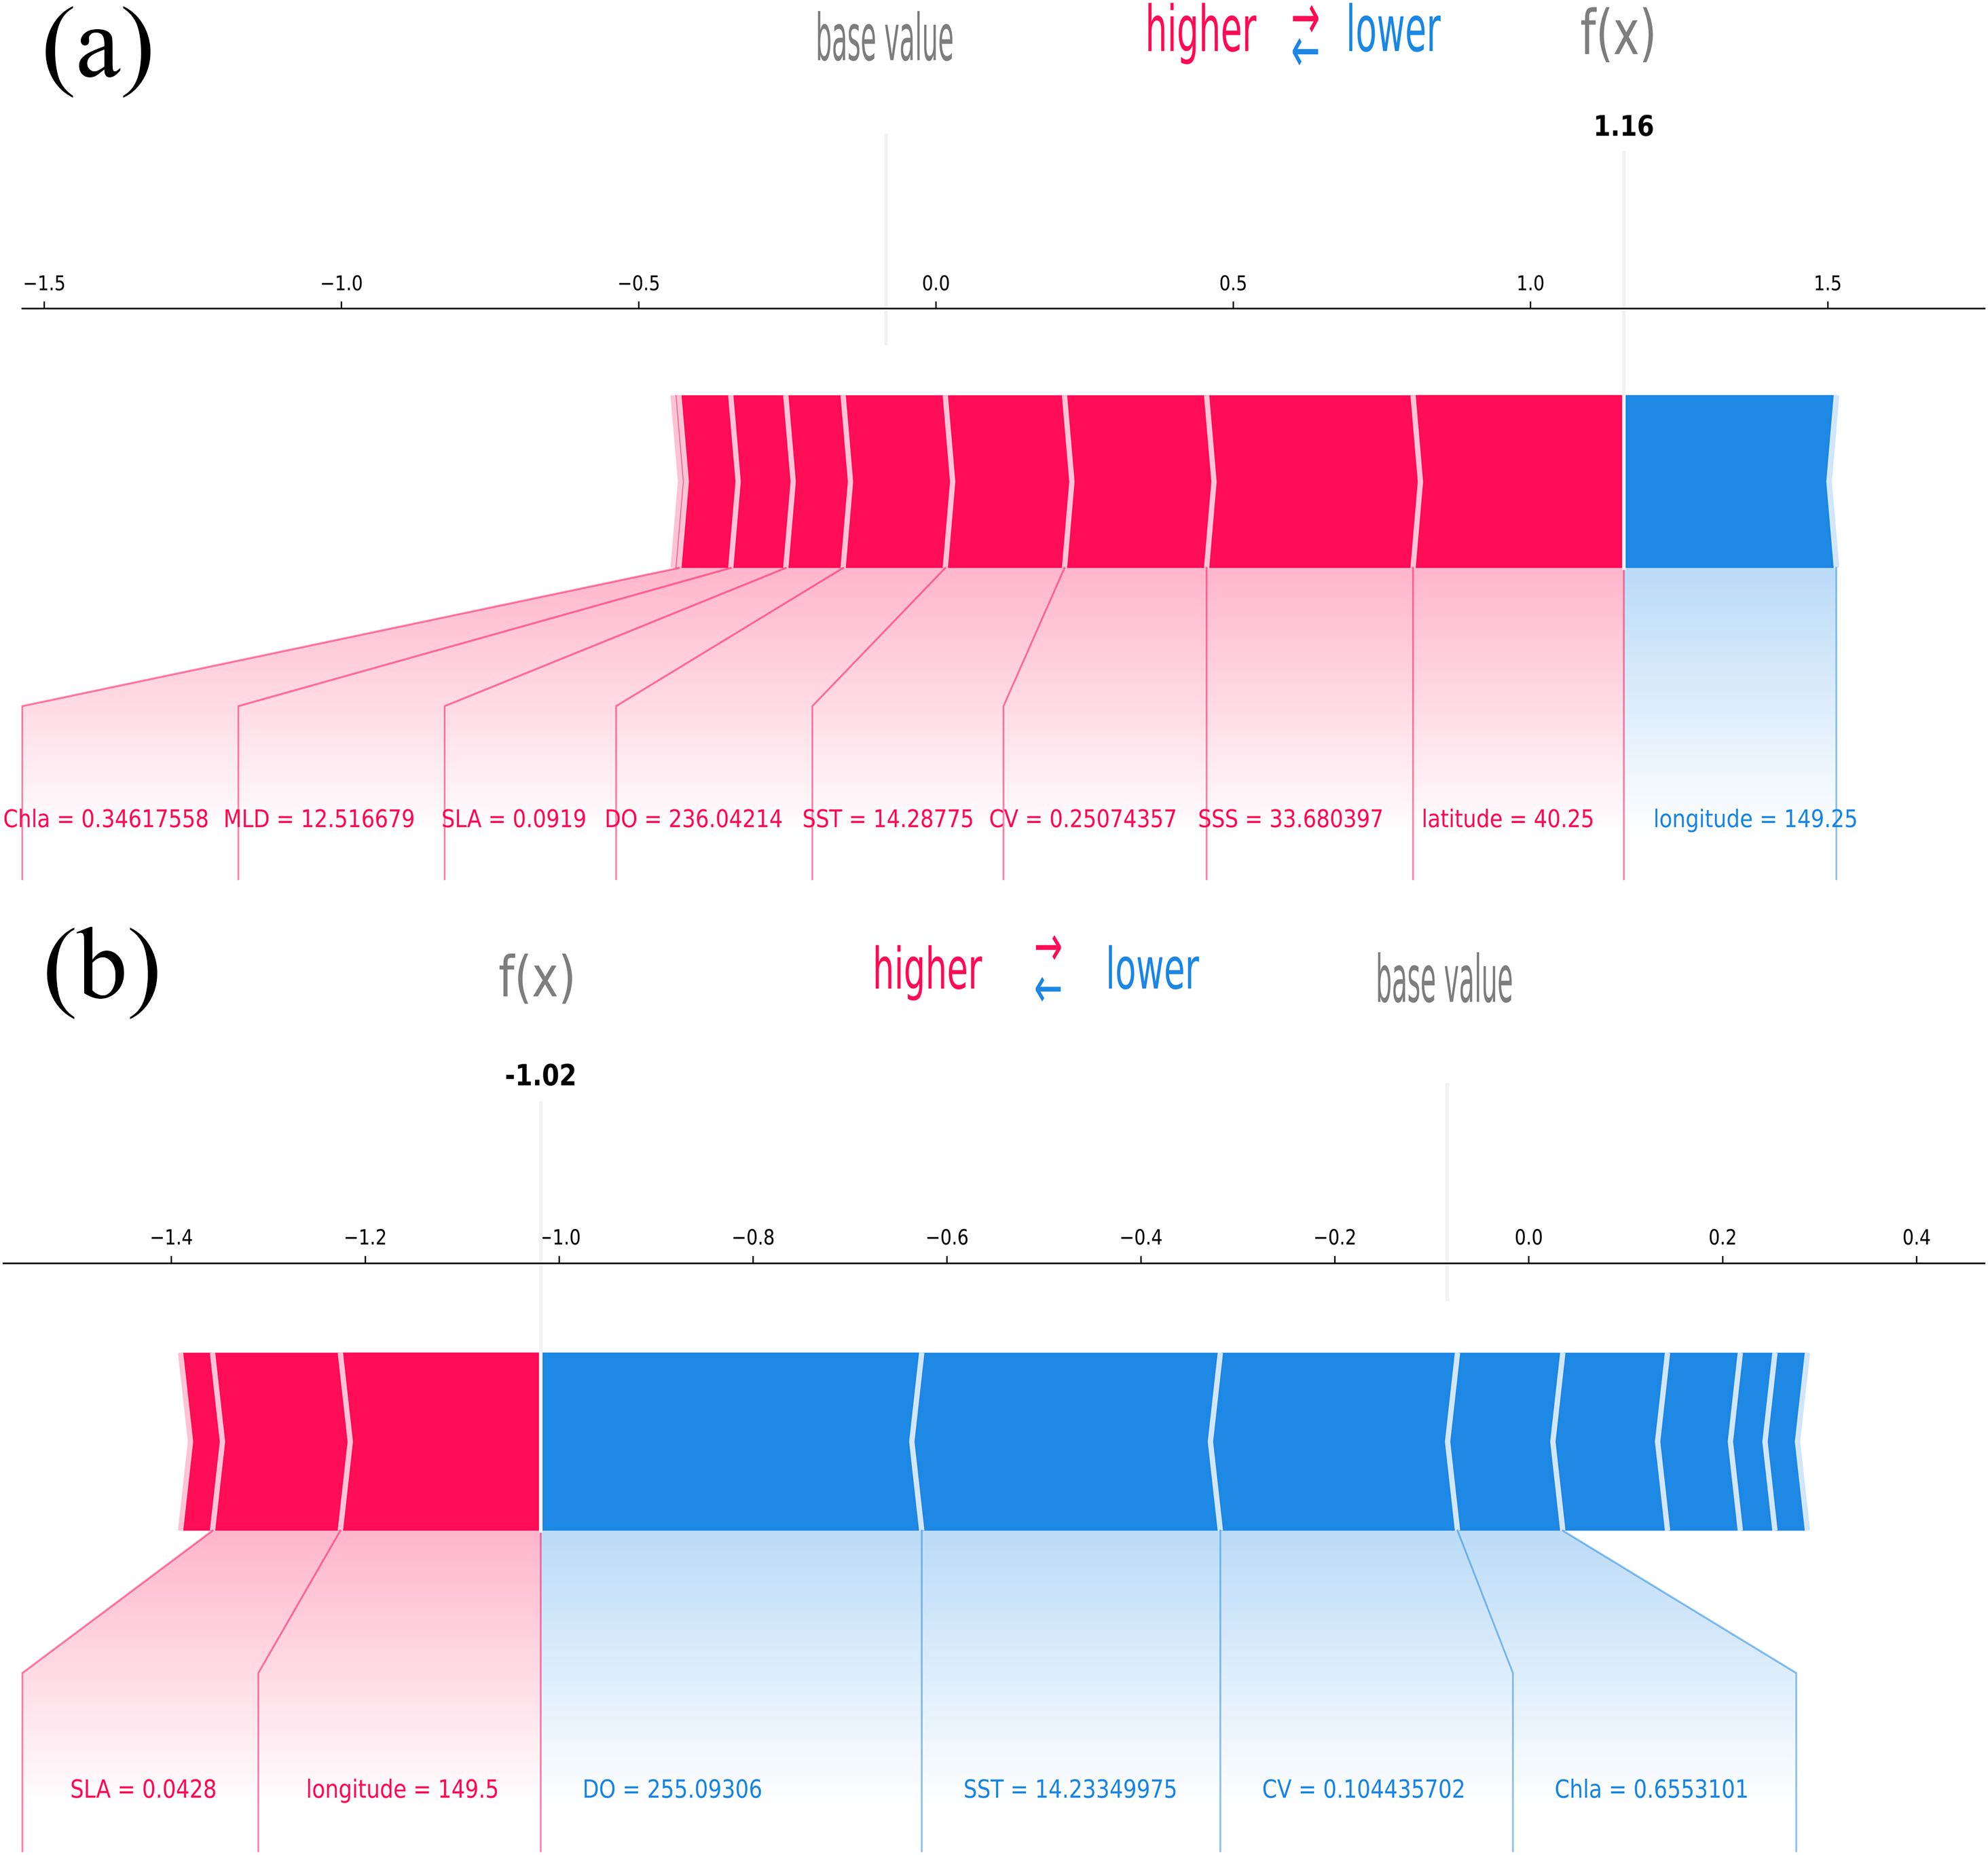
Figure 10. SHAP force plots from the CatBoost model predicting high-abundance fishing grounds for Japanese sardines. The plots display two random samples: (A) a positive sample and (B) a negative sample. The model output, shown as a probability, represents the average prediction across the training set. The bold black value, f(x), indicates the model’s prediction for each specific instance, considering the combined influence of key variables.
The annual catch of the Japanese sardine showed an increasing trend from 2014 to 2021, with only a slight decrease in 2019. In particular, the most pronounced rise was in 2020 and 2021, with increases of 192.58% (2020) and 202.39% (2021), respectively (Figure 4). This was mainly due to the fact that: (1) the resources of the Japanese sardine have been in a recovery phase in recent years (Han et al., 2023b; Yang et al., 2023a). It is worth noting, however, that although the Japanese sardine stock has recovered, it has not yet recovered to its peak (1980) (Watanabe et al., 2023; Yang et al., 2023b). Ma et al. (2023) pointed out that high fishing pressure during periods of low abundance can severely limit the recovery of the Japanese sardine stock, and thus scientifically sound fishing strategies must be developed. (2) Compared to 2014, fishing effort has risen significantly in recent years. In contrast, the decline in catch in 2019 was mainly influenced by the decline in fishing effort (Figure 2). (3) In recent years, affected by the decline of Chub mackerel resources and catch (Cai et al., 2023; Han et al., 2023b; Hong and Kim, 2021), the Japanese sardine has gradually risen in status and is becoming one of the major species fished by the lighting purse seine vessels (Liu et al., 2023b). This further highlights the significance of research on Japanese sardine fishing ground forecasting.
The monthly catch of the Japanese sardine in 2014-2021 was mainly concentrated in July-August, which is mainly due to: (1) The substantial clustering of Japanese sardines during July and August reduces the time required for fishing vessels to locate the fish, thereby enhancing fishing efficiency. (2) The variation in catch from September to November, besides being influenced by the number of fishing days, may be attributed to differences in the operational sea areas each month, the less pronounced clustering of Japanese sardines, and variations in resource abundance. 3) Japanese sardines exhibit slower growth in the spring compared to the fall, with the fish reaching their peak plumpness in the fall. In addition, on the one hand, the fishing days in summer and fall was longer than that in spring. On the other hand, the primary spawning period for the Pacific Group Japanese sardine spans from mid-March to early June, during which new cohorts continuously join the population, leading to a higher replenishment of Japanese sardine resources in the summer and fall compared to the spring (Cui et al., 2022).
Based on the information from the light falling net survey conducted in the NWPO from August 23 to September 26, 2018, Cui et al. (2022) pointed out that the Japanese sardine was mainly distributed in the 43°N region during the fall of 2018, which was in agreement with the results of this study. Based on the 2019-2020 North Pacific lighting purse seine net fishery data, Yang et al. (2023b) identified that the operational fishing grounds of Japanese sardine were mainly concentrated in 149°-153°E, 40°N-42°N. These findings, derived from a short-term dataset, align with the results of the current study, which also suggests that the high-abundance areas in the NWPO exhibit greater stability.
Given the vastness of the ocean and the uneven distribution of fish populations, the location of fishing grounds plays a crucial role in fishery activities (Wang et al., 2023). Since there is no universally optimal model for all datasets (Han et al., 2023a), fishery researchers often compare the prediction accuracy and performance of different models on specific datasets to identify the optimal forecasting model in order to ensure the accuracy and reliability of fishery production guidance and management (Abdul Azeez et al., 2021; Han et al., 2023a). The XGBoost, LightGBM, and Catboost models have demonstrated robust predictive performance for a variety of complex models that show strong prediction performance for high-dimensional data, with high accuracy and fast learning speed, and can be better adapted to various classification tasks (Ahn et al., 2023). However, existing studies indicate that the performance of these three models may vary depending on the specific dataset and problem (Cakiroglu et al., 2024; Ge et al., 2024; Harumy et al., 2024; Jaiswal and Gupta, 2022; Saber et al., 2022; Wang et al., 2024; Xu et al., 2024), and no model has shown overwhelming advantages across all datasets.
The above situation also exists in fishery research, unlike in this study, where the CatBoost model was the optimal prediction model for constructing the Japanese sardine high abundance fishing grounds. Xu et al. (2024) predicted the spatial and temporal distribution of yellowfin tuna (Thunnus obesus) abundance based on Random Forest (RF), XGBoost, LightGBM, and Catboost models. They found that: (1) LightGBM and Catboost models exhibited higher accuracy and shorter fitting time than XGBoost and RF. (2) LightGBM model achieved the optimal prediction performance, and its results were closer to the observed CPUEs. Consequently, it is essential to select the most appropriate machine learning model based on the specific fish species.
In previous studies, the prediction accuracy of high abundance fishing grounds for small pelagic fishes in the NWPO were around 70-80% accuracy (Han et al., 2023b; Yoshida et al., 2024). The performance of the optimal CatBoost model in the present study aligns with these findings, indicating that the fishing grounds prediction model developed here can effectively meet the production needs for Japanese sardines. However, it is worth noting that although the CatBoost model can avoid overfitting by adding an algorithm to compute leaf nodes when choosing the tree structure (Luo et al., 2021) and can take less training time and produce higher accuracy (Zahid et al., 2024), it is more sensitive to hyperparameters (Hancock and Khoshgoftaar, 2020; Lin et al., 2023). Therefore, careful tuning of hyperparameters and the selection of optimal hyperparameter search algorithms are crucial when constructing the model.
With the increasing availability of environmental data and the trend towards big data, identifying valid environmental data is becoming increasingly important. Xu et al. (2024) used the Recursive Feature Elimination with Cross-Validation (RFECV) method for feature visualization. Although a tree model based on the optimal explanatory variables selected by the RFECV method effectively predicted the spatial and temporal distribution of yellowfin tuna and identified the most influential variables, it did not adequately visualize how the model made decisions both globally and locally. It is noteworthy that although the method by Xu et al. (2024) visualized the contribution of each predictor variable to the study, similar to the built-in model method in this study, it only provided bar charts indicating the importance of global variables. This approach does not sufficiently explain how different variables affect the prediction success rate or visualize their impacts. However, the SHAP approach can provide insights into the magnitude and direction of each variable’s influence at both the global and local levels, thereby enhancing and broadening the understanding of the model’s decision-making behavior (Cha et al., 2021; Hu et al., 2021b).
In this study, there was a significant difference in the overall importance ranking between the model built-in method and the SHAP method, which is mainly due to the fact that, unlike the model built-in splitting method, the SHAP algorithm considers the predicted value of the model as a result of the cooperation of the input features. Thus the contribution of each feature to the prediction result can be obtained based on the SHAP value of each feature in each sample (Deng et al., 2024). Although the overall importance rankings of the two methods differed significantly, there were notable similarities when considering temporal, spatial, and environmental perspectives. The differences in importance between the built-in and SHAP methods were primarily in the ranking of environmental variables. It is noteworthy that the four most important environmental variables identified by both methods were SSS, SLA, SST, and CV.
Xu et al. (2020), using the 2016-2017 North Pacific high seas lighting purse seine fishery data and Generalized Additive Models (GAM), discovered that latitude and SST had a highly significant effect on the distribution of Japanese sardine. In contrast, longitude and Chla did not have significant effects. Yang et al. (2023b) found that SST and Chla were more important than SSH for the CPUE of the Japanese sardine, and latitude had a more significant effect on the distribution of the central fishing grounds than longitude. Similarly, Cui et al. (2022) concluded that the fishery dynamics of Japanese sardine were mainly affected by SST, and Chla was not the most important cause of fishing grounds formation. In constructing a potential habitat model, Shi et al. (2023b) identified SSH and SST as more influential than Chla and SSS, deeming them important environmental variables affecting the distribution of Japanese sardine habitats. Liu et al. (2023b) analyzed the habitat changes of Japanese sardines using 2017-2021 NWPO fishery data, integrating variables such as SST, SSS, SSH, Chla, EKE, and various water layer temperatures. They found that key factors influencing suitable habitat changes in June and August-October were SSH, SST, and Chla. Specifically, the key variables were SSH, EKE, and SST in May; SSH, SST, and Chla in July; and EKE, SST, and Chla in November. Compared to previous studies, this article provided a more comprehensive analysis of variables such as MLD and DO, and the results were similar to previous results with high confidence in the outcomes. Since this study employed categorical prediction, the results differ slightly from prior regression studies, but the overall similarity is high, and the findings are credible. Meanwhile, comparing the previous studies reveals that the importance ranking built into the model was more similar to the previous results, and SHAP provided a fresh perspective.
In this study, Figures 8–10 provided a clearer visualization of how the model makes decisions. Specifically, (1) The spatio-temporal variables enable us to better understand Figures 4, 5. Spatially, larger longitude values and smaller latitude values negatively affect the prediction of high abundance fishing grounds. Temporally, the month variable was more pronounced compared to the year variable, which is mainly due to the fact that the production of the Japanese sardine is mainly concentrated after July (Cui et al., 2022; Yang et al., 2023b), so the early months can have a negative impact. (2) Identifying which environmental variables drive species occurrence and distribution is crucial for ecological studies (Cha et al., 2021). In terms of SST, CV, SSS and SLA, which were the most important variables in this study. Japanese sardine is warm-temperate fish, and previous studies have suggested that its optimum water temperature ranges from 11 to 19.3 °C, SSH from 0.2 to 0.7 m, current flow rate from 0.3 to 1.2 m/s (where the flow rate is fast) and SSS from 26 to 40 (Cui et al., 2022; Liu et al., 2023c; Xu et al., 2020; Yang et al., 2023b). When viewed in conjunction with the range of environmental variables in this study, it further highlights the plausibility of the SHAP visualization results, such as the fact that lower values of both SST and CV adversely affect the high abundance fishing grounds prediction.
It is worth noting that although this study better visualizes the degree of contribution of each predictor variable of the model to the study object, and improves and broadens the understanding of the decision-making behavior of the model, only small-scale environmental variables are considered in this study. The study of large-scale marine environmental variables such as El Niño and La Niña (Liu et al., 2023b) should be strengthened at a later stage.
To effectively manage the Japanese sardine fishery in China, it is essential to consider resource recovery, fishing intensity, environmental changes, and socio-economic factors, ensuring the sustainable development of the fishery and the stability of the ecosystem. The following are specific management recommendations: Firstly, the regional and seasonal management of fishing activities should be strengthened. Given the spatio-temporal distribution characteristics of Japanese sardine resources, it is necessary to further refine fishing ground management by designating key habitats and protecting areas with high Japanese sardine abundance. Particularly during the resource recovery and spawning periods, fishing activities in these areas should be restricted. Moreover, based on the dynamic changes in fishing grounds, seasonal fishing plans should be formulated to avoid excessive fishing during periods when resources are vulnerable. Secondly, the management authorities should promote the use of environmentally friendly fishing gear and techniques to minimize the negative impact on the marine ecosystem. For instance, selective fishing gear should be encouraged to reduce bycatch rates of non-target species. Additionally, fishing vessels should be guided to optimize operation times and methods to reduce fuel consumption and carbon emissions, thereby mitigating the environmental pressure caused by fishing activities. Thirdly, data collection and analysis of fishing activities should be enhanced to improve data-driven management capabilities. By incorporating modern monitoring technologies and predictive models, the changes in Japanese sardine resources can be tracked in real time. Big data analytics should be employed to optimize fishing ground forecasts and fishing plans, thus increasing production efficiency. Furthermore, a comprehensive data-sharing platform should be established to facilitate information exchange between research institutions, government agencies, and fishers, ensuring the scientific basis and transparency of decision-making. In addition, international cooperation and exchange should be strengthened. The NWPO is a region with shared fishery resources among multiple countries. Establishing communication mechanisms with neighboring countries and jointly implementing consistent management measures can prevent adverse impacts on Japanese sardine resources due to transboundary fishing activities. Moreover, active participation in relevant international organizations and cooperative projects can allow China to learn from the successful experiences and technologies of other countries, thereby enhancing its international influence in Japanese sardine resource management. Finally, managers should pay attention to the long-term impacts of climate change on Japanese sardine resources, particularly large-scale marine environmental variables such as El Niño and La Niña phenomena. Through long-term monitoring and scientific research, the effects of these environmental factors on the distribution and abundance of Japanese sardine should be assessed, and management strategies should be adjusted accordingly. This will ensure that fishing activities are aligned with environmental changes, providing a scientific foundation for the sustainable management of Japanese sardine.
Our study comprehensively visualized the spatial and temporal changes in the catch of the Japanese sardine in the NWPO from 2014-2021: (1) the annual catch showed an overall increasing trend, peaking at 220,009.063 tons in 2021; (2) the total monthly catch increased and then declined, mainly concentrated in July-November, peaking at 76, 033.4944 tons (in July); and (3) the catch was mainly concentrated in the areas of 39.5°-43°N and 146.75°-155.75°E. With high accuracy and fewer ground parameters, Catboost was better adapted to the task of the Japanese sardine high abundance fishing grounds prediction than the XGBoost and LightGBM models. However, it is worth noting that although it has fewer parameters, it is more sensitive to hyperparameters. Hence, we need to carefully set the hyperparameters and choose the optimal hyperparameter search algorithm when constructing the model. Instead of traditional model-built importance visualization methods, the SHAP visualization tool provides a better global and local visualization of how the model makes decisions, informing the magnitude and direction of each variable’s influence at the global and local levels, improving and broadening the understanding of the model’s decision-making behavior. However, only spatio-temporal small-scale environmental variables were considered in this study, and the study of large-scale marine environmental variables such as El Niño and La Niña should be strengthened at a later stage. Meanwhile, future research could enhance the integration of the SHAP method with machine learning models with a view to improving the interpretability of predictive models for high abundance fishing grounds.
The raw data supporting the conclusions of this article will be made available by the authors, without undue reservation.
YS: Conceptualization, Data curation, Funding acquisition, Methodology, Software, Visualization, Writing – original draft. LY: Data curation, Writing – original draft. SZ: Methodology, Software, Validation, Writing – original draft. FT: Methodology, Writing – review & editing. SY: Methodology, Validation, Writing – original draft. WF: Conceptualization, Writing – original draft. HH: Methodology, Validation, Writing – review & editing. YD: Funding acquisition, Writing – review & editing.
The author(s) declare that financial support was received for the research, authorship, and/or publication of this article. This work was supported by grants from the National Key R&D Program of China (2023YFD2401305); Shanghai Sailing Program (22YF1459900); Fund of Key Laboratory for Sustainable Utilization of Open-sea Fishery, Ministry of Agriculture and Rural Affairs, P. R. China.
The authors declare that the research was conducted in the absence of any commercial or financial relationships that could be construed as a potential conflict of interest.
The author(s) declare that no Generative AI was used in the creation of this manuscript.
All claims expressed in this article are solely those of the authors and do not necessarily represent those of their affiliated organizations, or those of the publisher, the editors and the reviewers. Any product that may be evaluated in this article, or claim that may be made by its manufacturer, is not guaranteed or endorsed by the publisher.
Abdalla Y., Elbadawi M., Ji M. X., Alkahtani M., Awad A., Orlu M., et al. (2023). Machine learning using multi-modal data predicts the production of selective laser sintered 3D printed drug products. Int. J. Pharm. 633, 122628. doi: 10.1016/j.ijpharm.2023.122628
Ahn J. M., Kim J., Kim K. (2023). Ensemble machine learning of gradient boosting (XGBoost, lightGBM, catBoost) and attention-based CNN-LSTM for harmful algal blooms forecasting. Toxins 15 (10), 608. doi: 10.3390/toxins15100608
Alfatinah A., Chu H. J., Tatas, Patra S. R. (2023). Fishing area prediction using scene-based ensemble models. J. Mar. Sci. Eng. 11 (7), 1398. doi: 10.3390/jmse11071398
Altaf I., Kaul A. (2024). Classifying collisions in road accidents using XGBOOST, CATBOOST and SALP SWARM based optimization algorithms. Multimed. Tools Appl. 83, 38387–38410. doi: 10.1007/s11042-023-16969-4
Armas E., Arancibia H., Neira S. (2022). Identification and forecast of potential fishing grounds for anchovy (Engraulis ringens) in northern Chile using neural networks modeling. Fishes 7 (4), 204. doi: 10.3390/fishes7040204
Azeez P. A., Raman M., Rohit P., Shenoy L., Jaiswar A. K., Koya K. M., et al. (2021). Predicting potential fishing grounds of ribbonfish (Trichiurus lepturus) in the north-eastern Arabian Sea, using remote sensing data. Int. J. Remote Sens. 42, 322–342. doi: 10.1080/01431161.2020.1809025
Bai X., Gao L., Choi S. (2022). Exploring the response of the japanese sardine (sardinops melanostictus) stock-recruitment relationship to environmental changes under different structural models. Fishes 7 (5), 276. doi: 10.3390/fishes7050276
Bastardie F., Hornborg S., Ziegler F., Gislason H., Eigaard O. R. (2022). Reducing the fuel use intensity of fisheries: through efficient fishing techniques and recovered fish stocks. Front. Mar. Sci. 9. doi: 10.3389/fmars.2022.817335
Basurko O. C., Gabiña G., Uriondo Z. (2013). Energy performance of fishing vessels and potential savings. J. Clean. Prod. 54, 30–40. doi: 10.1016/j.jclepro.2013.05.024
Cai K., Kindong R., Ma Q. Y., Tian S. Q. (2023). Stock assessment of chub mackerel (Scomber japonicus) in the northwest pacific using a multi-model approach. Fishes 8 (2), 80. doi: 10.3390/fishes8020080
Cakiroglu C., Demir S., Ozdemir M. H., Aylak B. L., Sariisik G., Abualigah L. (2024). Data-driven interpretable ensemble learning methods for the prediction of wind turbine power incorporating SHAP analysis. Expert Syst. Appl. 237, 121464. doi: 10.1016/j.eswa.2023.121464
Caponi M., Cox A., Misra S. (2023). Viscosity prediction using image processing and supervised learning. Fuel 339, 127320. doi: 10.1016/j.fuel.2022.127320
Cha Y., Shin J., Go B., Lee D. S., Kim Y., Kim T., et al. (2021). An interpretable machine learning method for supporting ecosystem management: Application to species distribution models of freshwater macroinvertebrates. J. Environ. Manage. 291, 112719. doi: 10.1016/j.jenvman.2021.112719
Chen X. J. (2022). Theory and method of fisheries forecasting. Singapore: Springer. doi: 10.1007/978-981-19-2956-4
Chen T., Guestrin C. (2016). “XGBoost: A scalable tree boosting system,” In Proc. 22nd ACM SIGKDD International conference on knowledge discovery and data mining 785–794 (ACM, 2016). doi: 10.1145/2939672.2939785
Chen H., Wang N., Du X. P., Mei K. H., Zhou Y., Cai G. X. (2023). Classification prediction of breast cancer based on machine learning. Comput. Intell. Neurosci. 2023, 6530719. doi: 10.1155/2023/6530719
Cui G., Wenbin Z., Dai Q., Zhu H., Liu W., Yuan F., et al. (2022). Temporal and spatial distribution of Sardinops sagax fishing ground in the Northwest Pacific and its relationship with environmental factors. Trans. Oceanol. Limnol. 44, 110–116. doi: 10.13984/j.cnki.cn37-1141.2022.05.016
Datta D., Dalmida S. G., Martinez L., Newman D., Hashemi J., Khoshgoftaar T. M., et al. (2023). Using machine learning to identify patient characteristics to predict mortality of in-patients with COVID-19 in South Florida. Front. Digit. Health 5, 1193467. doi: 10.3389/fdgth.2023.1193467
Deng M., Zhang T., Chen J. (2024). Study on influencing factors of residents’ willingness to pay for eco-compensation based on XGBoost-SHAP in Taihu Basin. J. Econ. Water Resour. 42, 44–50. doi: 10.3880/j.issn.10039511.2024.02.007
Devi M. S., Xavier K. A. M., Singh A. S., Edwin L., Singh V. V., Shenoy L. (2021). Environmental pressure of active fishing method: A study on carbon emission by trawlers from north-west Indian coast. Mar. Policy 127, 104453. doi: 10.1016/j.marpol.2021.104453
Díaz-Secades L. A. (2024). Enhancement of Maritime Sector Decarbonization through the Integration of Fishing Vessels into IMO Energy Efficiency Measures. J. Mar. Sci. Eng. 12 (4), 663. doi: 10.3390/jmse12040663
Effrosynidis D., Tsikliras A., Arampatzis A., Sylaios G. (2020). Species distribution modelling via feature engineering and machine learning for pelagic fishes in the mediterranean sea. Appl. Sci. 10 (24), 8900. doi: 10.3390/app10248900
Ge Z. W., Feng S., Ma C. C., Wei K., Hu K., Zhang W. J., et al. (2024). Quantifying and comparing the effects of key chemical descriptors on metal–organic frameworks water stability with CatBoost and SHAP. Microchem. J. 196, 109625. doi: 10.1016/j.microc.2023.109625
Gong P. (2021). Fishing ground forecast model of albacore tuna based on lightGBM in the south pacific. Master’s thesis of Shanghai Ocean University, China. doi: 10.27314/d.cnki.gsscu.2021.000586
Gong P., Wang D., Yuan H., Chen G., Wu R. (2021). Fishing ground forecast model of albacore tuna based on lightGBM in the south pacific ocean. Fish. Sci. 40, 762–767. doi: 10.16378/j.cnki.1003-1111.19292
Greer K., Zeller D., Woroniak J., Coulter A., Winchester M., Palomares M. L. D., et al. (2019). Global trends in carbon dioxide (CO2) emissions from fuel combustion in marine fisheries from 1950 to 2016. Mar. Policy 107, 103382. doi: 10.1016/j.marpol.2018.12.001
Han H. B., Jiang B. H., Shi Y. C., Jiang P. W., Zhang H., Shang C., et al. (2023a). Response of the Northwest Indian Ocean purpleback flying squid (Sthenoteuthis oualaniensis) fishing grounds to marine environmental changes and its prediction model construction based on multi-models and multi-spatial and temporal scales. Ecol. Indic. 154, 110809. doi: 10.1016/j.ecolind.2023.110809
Han H. B., Yang C., Jiang B. H., Shang C., Sun Y. Y., Zhao X. Y., et al. (2023b). Construction of chub mackerel (Scomber japonicus) fishing ground prediction model in the northwestern Pacific Ocean based on deep learning and marine environmental variables. Mar. pollut. Bull. 193, 115158. doi: 10.1016/j.marpolbul.2023.115158
Hancock J. T., Khoshgoftaar T. M. (2020). CatBoost for big data: an interdisciplinary review. J. Big. Data 7, 94. doi: 10.1186/s40537-020-00369-8
Harumy H. F., Hardi S. M., Banna M. F. A. (2024). “EarlyStage diabetes risk detection using Comparison of xgboost, lightgbm, and catboost algorithms.” in Advanced Information Networking and Applications, (Switzerland: Springer Nature), 12–24. doi: 10.1007/978-3-031-57931-8_2
Hidayat T., Manongga D., Hendry, Nataliani Y., Wijono S., Prasetyo S. Y., et al. (2024). “Performance prediction using cross validation (GridSearchCV) for stunting prevalence,” in Paper presented at the 2024 IEEE International Conference on Artificial Intelligence and Mechatronics Systems (AIMS). doi: 10.1109/AIMS61812.2024.10512657
Hong J. B., Kim D. H. (2021). A study on stock assessment of chub mackerel (Scomber japonicus) in South Korea using CMSY and BSS models. J. Fish. Mar. Sci. Educ. 33, 1272–1283. doi: 10.13000/JFMSE.2021.10.33.5.1272
Hu X., Che Y., Lin X., Onori S. (2021a). Battery health prediction using fusion-based feature selection and machine learning. IEEE Trans. Transp. Electrific. 7, 382–398. doi: 10.1109/TTE.2020.3017090
Hu Y., Chen R., Gao H., Lin H., Wang J., Wang X., et al. (2021b). Explainable machine learning model for predicting spontaneous bacterial peritonitis in cirrhotic patients with ascites. Sci. Rep. 11, 21639. doi: 10.1038/s41598-021-00218-5
Jaiswal S., Gupta P. (2022). “Ensemble approach: XGBoost, CATBoost, and lightGBM for diabetes mellitus risk prediction,” in Paper presented at the 2022 Second International Conference on Computer Science, Engineering and Applications (ICCSEA). doi: 10.1109/ICCSEA54677.2022.9936130
Joo C., Park H., Lim J., Cho H., Kim J. (2023). Machine learning-based heat deflection temperature prediction and effect analysis in polypropylene composites using Catboost and Shapley additive explanations. Eng. Appl. Artif. Intell. 126, 106873. doi: 10.1016/j.engappai.2023.106873
Jovanovic L., Jovanovic G., Perisic M., Alimpic F., Stanisic S., Bacanin N., et al. (2023). The explainable potential of coupling metaheuristics-optimized-XGBoost and SHAP in revealing VOCs’ Environmental fate. Atmosphere 14 (1), 109. doi: 10.3390/atmos14010109
Kakehi S., Abo J. I., Miyamoto H., Fuji T., Watanabe K., Yamashita H., et al. (2020). Forecasting Pacific saury (Cololabis saira) fishing grounds off Japan using a migration model driven by an ocean circulation model. Ecol. Model. 431, 109150. doi: 10.1016/j.ecolmodel.2020.109150
Kawaguchi O. (2024). Machine-learning and thresholding algorithms to automatically predict fishing effort of small-scale trawl fishery. Fish. Sci. 90, 123–137. doi: 10.1007/s12562-023-01734-1
Khan P. W., Byun Y. C. (2023). Optimized dissolved oxygen prediction using genetic algorithm and bagging ensemble learning for smart fish farm. IEEE Sens. J. 23, 15153–15164. doi: 10.1109/JSEN.2023.3278719
Khiem N. M., Takahashi Y., Masumura T., Kotake G., Yasuma H., Kimura N. (2023). A machine learning ensemble approach for predicting growth of abalone reared in land-based aquaculture in Hokkaido, Japan. Aquac. Eng. 103, 102372. doi: 10.1016/j.aquaeng.2023.102372
Kim Y., Kim Y. (2022). Explainable heat-related mortality with random forest and SHapley Additive exPlanations (SHAP) models. Sustain. Cities. Soc 79, 103677. doi: 10.1016/j.scs.2022.103677
Krishnamoorthy L., Lakshmanan V. R. (2024). Groundwater quality assessment using machine learning models: a comprehensive study on the industrial corridor of a semi-arid region. Environ. Sci. pollut. Res. doi: 10.1007/s11356-024-34119-7
Lamine E. B., Schickele A., Goberville E., Beaugrand G., Allemand D., Raybaud V. (2022). Expected contraction in the distribution ranges of demersal fish of high economic value in the Mediterranean and European Seas. Sci. Rep. 12, 10150. doi: 10.1038/s41598-022-14151-8
Li H., Misra S. (2021). Robust machine-learning workflow for subsurface geomechanical characterization and comparison against popular empirical correlations. Expert Syst. Appl. 177, 114942. doi: 10.1016/j.eswa.2021.114942
Li J., Xing Q., Li X., Arif M., Li J. (2024). Monitoring off-shore fishing in the northern Indian ocean based on satellite automatic identification system and remote sensing data. Sensors 24 (3), 781. doi: 10.3390/s24030781
Li J., Zhang X., Ma T., Zeng P., Yin X., Han B., et al. (2023). An interpretable landslide displacement prediction model based on XGBoost and SHAP. J. Eng. Geol., 1–16. doi: 10.13544/j.cnki.jeg.2022-0856
Liang X., Wang C., Liu Y., Yu Y., Song C. (2024). Fish diversity analysis of the Kuroshio-Oyashio confluence region in summer based on environmental DNA technology. J. Shanghai. Ocean. Univ. 33, 911–926. doi: 10.12024/jsou.20230904320
Lin C., Xu Q., Huang Y. (2023). Quantifying and comparing the effects of human and organizational factors in electric maloperation accidents with HFACS–CatBoost and SHAP. Hum. Factors. Ergon. Manuf. Serv. Ind. 33, 164–183. doi: 10.1002/hfm.20975
Liu Q., Chen Y., Wang J., Miao H., Wang Y. (2023a). An example of fishery yield predictions from VMS-based navigational characteristics applied to double trawlers in China. Fish. Res. 261, 106614. doi: 10.1016/j.fishres.2023.106614
Liu S., Zhang H., Yang C., Fang Z. (2023b). Differences in habitat distribution of Sardinops melanostictus and Scomber japonicus in the northwest Pacific based on a maximum entropy model. J. Shanghai. Ocean. Univ. 32, 806–817. doi: 10.12024/jsou.20230204072
Liu S., Zhang H., Yang C., Fang Z. (2023c). Relationship between stock dynamics and environmental variability for Japanese sardine (Sardinops sagax) and chub mackerel (Scomber japonicus) in the Northwest Pacific Ocean: a review. J. Dalian. Ocean. Univ. 38, 357–368. doi: 10.16535/j.cnki.dlhyxb.2022-180
Luan J., Zhang C., Xu B., Xue Y., Ren Y. (2020). The predictive performances of random forest models with limited sample size and different species traits. Fish. Res. 227, 105534. doi: 10.1016/j.fishres.2020.105534
Lundberg S. M., Lee S. I. (2017). “A unified approach to interpreting model predictions,” In Proc. 31st Int. Conf. Neural Information Processing Systems (Long Beach, California, USA), 4768–4777. doi: 10.5555/3295222.3295230
Luo M., Wang Y., Xie Y., Zhou L., Qiao J., Qiu S., et al. (2021). Combination of feature selection and catBoost for prediction: the first application to the estimation of aboveground biomass. Forests 12 (2), 216. doi: 10.3390/f12020216
Ma S. Y., Fu C. H., Li J. C., Sun P., Liu Y., Ye Z. J., et al. (2023). Non-stationary effects of multiple drivers on the dynamics of Japanese sardine (Sardinops melanostictus, Clupeidae). Fish. Fish. 24, 40–55. doi: 10.1111/faf.12708
Mishra D. P., Gupta H. K., Saajith G., Bag R. (2024). “Optimizing heart disease prediction model with gridsearchCV for hyperparameter tuning,” in Paper presented at the 2024 1st International Conference on Cognitive, Green and Ubiquitous Computing (IC-CGU). doi: 10.1109/IC-CGU58078.2024.10530772
Muñoz M., Reul A., Guijarro B., Hidalgo M. (2023). Carbon footprint, economic benefits and sustainable fishing: Lessons for the future from the Western Mediterranean. Sci. Total. Environ. 865, 160783. doi: 10.1016/j.scitotenv.2022.160783
Okunishi T., Yamanaka Y., Ito S. I. (2009). A simulation model for Japanese sardine (Sardinops melanostictus) migrations in the western North Pacific. Ecol. Model. 220, 462–479. doi: 10.1016/j.ecolmodel.2008.10.020
Parsa A. B., Movahedi A., Taghipour H., Derrible S., Mohammadian A. (2020). Toward safer highways, application of XGBoost and SHAP for real-time accident detection and feature analysis. Accid. Anal. Prev. 136, 105405. doi: 10.1016/j.aap.2019.105405
Politikos D. V., Petasis G., Katselis G. (2021). Interpretable machine learning to forecast hypoxia in a lagoon. Ecol. Inform. 66, 101480. doi: 10.1016/j.ecoinf.2021.101480
Politikos D., Stefanidis K., Varlas G., Papadopoulos A., Dimitriou E. (2024). Predicting the ecological quality of rivers: A machine learning approach and a what-if scenarios tool. Environ. Model. Assess. 29, 1059–1077. doi: 10.1007/s10666-024-09980-y
Qin Y., Zhou Z., Liu Y., Tian Y., Cheng J., Liu X., et al. (2022). Fishery abundance index of Scomberomorus niphonius in the Yellow Sea, Bohai Sea, and East China Sea based on automatic machine learning. J. Fish. Sci. China 29, 1375–1387. doi: 10-12264/JFSC2022-0089
Saber M., Boulmaiz T., Guermoui M., Abdrabo K. I., Kantoush S. A., Sumi T., et al. (2022). Examining LightGBM and CatBoost models for wadi flash flood susceptibility prediction. Geocarto. Int. 37, 7462–7487. doi: 10.1080/10106049.2021.1974959
Sala A., Damalas D., Labanchi L., Martinsohn J., Moro F., Sabatella R., et al. (2022). Energy audit and carbon footprint in trawl fisheries. Sci. Data 9, 428. doi: 10.1038/s41597-022-01478-0
Sandison F., Hillier J., Hastings A., Macdonald P., Mouat B., Marshall C. T. (2021). The environmental impacts of pelagic fish caught by Scottish vessels. Fish. Res. 236, 105850. doi: 10.1016/j.fishres.2020.105850
Sarr O., Kindong R., Tian S. Q. (2021). Knowledge on the biological and fisheries aspects of the Japanese sardine, Sardinops melanostictus (Schlegel 1846). J. Mar. Sci. Eng. 9 (12), 1403. doi: 10.3390/jmse9121403
Secretariat N. (2024). Summary Footprint of Chub Mackerel Fisheries and Japanese Sardine Fisheries. Available online at: https://www.npfc.int/summary-footprint-chub-mackerel-fisheries (Accessed September 1, 2024).
Shakeel A., Chong D., Wang J. (2023). District heating load forecasting with a hybrid model based on LightGBM and FB-prophet. J. Clean. Prod. 409, 137130. doi: 10.1016/j.jclepro.2023.137130
Shang C., Han H., Chen J., Tang F., Fan W., Zhang H., et al. (2023). Relationship between resource distribution and vertical structure of water temperature of purpleback flying squid (Sthenoteuthis oualaniensis) in the northwest Indian ocean based on GAM and GBT models. J. Mar. Sci. Eng. 11 (9), 1800. doi: 10.3390/jmse11091800
Shi Y., Cai Y., Lou S., Chen Y. (2024). Explainable prediction of deposited film thickness in IC fabrication with CatBoost and SHapley Additive exPlanations (SHAP) models. Appl. Intell. 54, 246–263. doi: 10.1007/s10489-023-05121-2
Shi Y., Han H., Tang F., Zhang S., Fan W., Zhang H., et al. (2023a). Evaluation performance of three standardization models to estimate catch-per-unit-effort: A case study on pacific sardine (Sardinops sagax) in the northwest pacific ocean. Fishes 8 (12), 606. doi: 10.3390/fishes8120606
Shi Y., Kang B., Fan W., Xu L., Zhang S., Cui X., et al. (2023b). Spatio-temporal variations in the potential habitat distribution of pacific sardine (Sardinops sagax) in the northwest pacific ocean. Fishes 8 (2), 86. doi: 10.3390/fishes8020086
Shi Y., Zhang X., He Y., Fan W., Tang F. (2022). Stock assessment using length-based bayesian evaluation method for three small pelagic species in the northwest pacific ocean. Front. Mar. Sci. 9, 775180. doi: 10.3389/fmars.2022.775180
So B. (2024). Enhanced gradient boosting for zero-inflated insurance claims and comparative analysis of CatBoost, XGBoost, and LightGBM. Scand. Actuar. J., 1–23. doi: 10.1080/03461238.2024.2365390
Sogawa S., Hidaka K., Kamimura Y., Takahashi M., Saito H., Okazaki Y., et al. (2019). Environmental characteristics of spawning and nursery grounds of Japanese sardine and mackerels in the Kuroshio and Kuroshio Extension area. Fish. Oceanogr. 28, 454–467. doi: 10.1111/fog.12423
Sun Y., Lian F., Yang Z. (2023). Analysis of the activities of high sea fishing vessels from China, Japan, and Korea via AIS data mining. Ocean. Coast. Manage. 242, 106690. doi: 10.1016/j.ocecoaman.2023.106690
Sun Y. T., Wang J. W., Wang T., Li J. S., Wei Z. P., Fan A. B., et al. (2024). Post-fracture production prediction with production segmentation and well logging: harnessing pipelines and hyperparameter tuning with gridSearchCV. Appl. Sci. 14 (10), 3954. doi: 10.3390/app14103954
Wang Q., Jiang Y. (2023). Leisure time prediction and influencing factors analysis based on lightGBM and SHAP. Mathematics 11 (10), 2371. doi: 10.3390/math11102371
Wang Y., Li Y., Wang N. (2023). A GIS-based maritime supply chain network design of distant-water fisheries. Comput. Electron. Agric. 214, 108321. doi: 10.1016/j.compag.2023.108321
Wang H., Liang Q., Hancock J. T., Khoshgoftaar T. M. (2024). Feature selection strategies: a comparative analysis of SHAP-value and importance-based methods. J. Big. Data 11, 44. doi: 10.1186/s40537-024-00905-w
Watanabe A., Hara Y., Matsuda H. (2023). Combining output control and fishing pressure limitations improves the management of the Japanese sardine Sardinops melanostictus. Fish. Res. 266, 106787. doi: 10.1016/j.fishres.2023.106787
Wen X., Xie Y., Wu L., Jiang L. (2021). Quantifying and comparing the effects of key risk factors on various types of roadway segment crashes with LightGBM and SHAP. Accid. Anal. Prev. 159, 106261. doi: 10.1016/j.aap.2021.106261
Xiao W., Wang C., Liu J., Gao M., Wu J. (2023). Optimizing faulting prediction for rigid pavements using a hybrid SHAP-TPE-catBoost model. Appl. Sci. 13 (23), 12862. doi: 10.3390/app132312862
Xie M., Liu B., Chen X. (2023). Prediction on fishing ground of Ommastrephes bartramii in Northwest Pacific based on deep learning. J. Fish. China 48 (11), 61–72. doi: 10.11964/jfc.20220413451
Xu S., Wang J., Chen X., Zhu J. (2024). Identifying optimal variables for machine-learning-based fish distribution modeling. Can. J. Fish. Aquat. 81, 687–698. doi: 10.1139/cjfas-2023-0197
Xu B., Zhang H., Tang F., Sui X., Zhang Y., Hou G. (2020). Relationship between center of gravity and environmental factors of main catches of purse seine fisheries in North Pacific high seas based on GAM. South China Fish. Sci. 16, 60–70. doi: 10.12131/20200006
Yang C. (2023). Biological Characteristics and Resource Assessment of Sardinops melanostictus in the Northwest Pacific Ocean. Master’s thesis of Shanghai Ocean University, China. doi: 10.27314/d.cnki.gsscu.2023.000838
Yang C., Chen M., Yuan Q. (2021). The application of XGBoost and SHAP to examining the factors in freight truck-related crashes: An exploratory analysis. Accid. Anal. Prev. 158, 106153. doi: 10.1016/j.aap.2021.106153
Yang C., Han H., Zhang H., Shi Y., Su B., Jiang P., et al. (2023a). Assessment and management recommendations for the status of Japanese sardine Sardinops melanostictus population in the Northwest Pacific. Ecol. Indic. 148, 110111. doi: 10.1016/j.ecolind.2023.110111
Yang C., Zhang H., Han H., Zhao G., Shi Y., Xu B., et al. (2023b). Spatio-temporal distribution of Sardinops sagax in the north pacific: optimal environmental characteristics. Prog. Fish. Sci. 44, 99–110. doi: 10.19663/j.issn2095-9869.20220321001
Yoshida T., Sugino K., Nishikawa H. (2024). Classification of set-net fish catch volumes in Iwate Prefecture, Japan using machine learning with water temperature and current distribution images at migration depth. Reg. Stud. Mar. Sci. 73, 103480. doi: 10.1016/j.rsma.2024.103480
Zahid M., Habib M. F., Ijaz M., Ameer I., Ullah I., Ahmed T., et al. (2024). Factors affecting injury severity in motorcycle crashes: Different age groups analysis using Catboost and SHAP techniques. Traffic. Inj. Prev. 25, 472–481. doi: 10.1080/15389588.2023.2297168
Zhang J., Fan D., He H., Xiao B., Xiong Y., Shi J. (2023a). Forecasting albacore (Thunnus alalunga) fishing grounds in the south pacific based on machine learning algorithms and ensemble learning model. Appl. Sci. 13 (9), 5485. doi: 10.3390/app13095485
Zhang J., Ma X., Zhang J., Sun D., Zhou X., Mi C., et al. (2023b). Insights into geospatial heterogeneity of landslide susceptibility based on the SHAP-XGBoost model. J. Environ. Manage. 332, 117357. doi: 10.1016/j.jenvman.2023.117357
Keywords: Sardinops melanostictus, model prediction performance, SHAP visualization, fishery management, Northwest Pacific Ocean
Citation: Shi Y, Yan L, Zhang S, Tang F, Yang S, Fan W, Han H and Dai Y (2025) Revealing the effects of environmental and spatio-temporal variables on changes in Japanese sardine (Sardinops melanostictus) high abundance fishing grounds based on interpretable machine learning approach. Front. Mar. Sci. 11:1503292. doi: 10.3389/fmars.2024.1503292
Received: 28 September 2024; Accepted: 12 December 2024;
Published: 13 January 2025.
Edited by:
Gualtiero Basilone, National Research Council (CNR), ItalyReviewed by:
Luis A. Cubillos, University of Concepcion, ChileCopyright © 2025 Shi, Yan, Zhang, Tang, Yang, Fan, Han and Dai. This is an open-access article distributed under the terms of the Creative Commons Attribution License (CC BY). The use, distribution or reproduction in other forums is permitted, provided the original author(s) and the copyright owner(s) are credited and that the original publication in this journal is cited, in accordance with accepted academic practice. No use, distribution or reproduction is permitted which does not comply with these terms.
*Correspondence: Haibin Han, aGhiZmlzaGVyeUAxNjMuY29t; Yang Dai, MTMxNjI3ODc4NTJAMTYzLmNvbQ==
Disclaimer: All claims expressed in this article are solely those of the authors and do not necessarily represent those of their affiliated organizations, or those of the publisher, the editors and the reviewers. Any product that may be evaluated in this article or claim that may be made by its manufacturer is not guaranteed or endorsed by the publisher.
Research integrity at Frontiers
Learn more about the work of our research integrity team to safeguard the quality of each article we publish.