 Ke Pang
 Yang Feng
 Youchang Zheng
 Chao Fang
 Xiangrong Xu
94% of researchers rate our articles as excellent or good
Learn more about the work of our research integrity team to safeguard the quality of each article we publish.
Find out more
ORIGINAL RESEARCH article
Front. Mar. Sci. , 28 January 2025
Sec. Marine Pollution
Volume 11 - 2024 | https://doi.org/10.3389/fmars.2024.1494809
The Pearl River delivers a large amount of plastic waste to the Pearl River Estuary (PRE) and adjacent Northern South China Sea (NSCS) region each year. However, the transport of floating litter after release is difficult to predict due to the complex hydrodynamic conditions caused by the climate variability. A regional ocean circulation model coupled with a Lagrangian particle tracking model is utilized in this study to simulate the distribution and fate of floating litter particles in the Pearl River Estuary (PRE) and Northern South China Sea (NSCS) under the influence of El Niño - Southern Oscillation (ENSO) event. Simulations are conducted during all four seasons (spring, summer, fall, and winter) in typical El Niño, La Niña, and ENSO-neutral year. The model reveals that most floating litter remains within Lingding Bay before being transported westward by the counterclockwise circulation over the NSCS and arriving at the Qiongzhou Strait. After crossing the Strait, the debris is carried by the counterclockwise circulation of the Beibu Gulf, and eventually arriving at the coasts of Vietnam and Laos. The ENSO warm (El Niño) and cold (La Niña) phases disrupt circulation patterns and modulate the amount of Pearl River runoff, thereby altering the transport pathways and grounding probabilities of floating litter. During La Niña years, floating litter particles spread over a wider area, travel longer distances, and have lower beaching probabilities. Conversely, during El Niño year, floating litter particles tend to remain within Lingding Bay for longer durations, with some debris entrained towards the Hong Kong region. This study underscores the impact of climate mode of variability in influencing the litter sources, fate and transport and accumulation at estuarine-coastal oceans, which will provide critical scientific insights for plastic pollution management in the PRE - NSCS region, which is a newly identified hotspot for floating litter and microplastic pollution in global oceans.
The widespread use of plastic products has led to a significant increase in marine litter pollution. According to the global data and business intelligence platform Statista (https://www.statista.com/markets/410/topic/960/plastic-rubber/#overview), the worldwide production of plastic reached over 400 million metric tons (mt) in 2022. A significant portion was dumped in the rivers and ultimately reached the oceans. So far, it is estimated that there are approximately 250 metric kilotons (mkt) of plastic pollution floating in the global oceans, with an additional new input about 800 - 2,400 kt per year from the rivers (Meijer et al., 2021; Kaandorp et al., 2023). When positively buoyant plastic litter enters the marine environment, it is transported by oceanic currents, dragged by winds, and eventually accumulates in open or coastal oceans (Martinez et al., 2009; Kako et al., 2010; Law et al., 2014; Suaria and Aliani, 2014; Cózar et al., 2015; Ryan, 2015; Meng et al., 2020). This marine litter has been well-documented to pose threats and ecological risks to marine ecosystem and indirectly affect human health (Barnes et al., 2009).
Both the sophisticated global and regional ocean circulation models linked to particle - tracking models have been widely used to investigate the source, fate, transport and accumulation of plastic waste in the ocean, thereby compensating insufficient ocean observations (National Oceanic and Atmospheric Administration, 2016). A global dynamic study of floating debris identified five accumulation zones in subtropical latitudes of major ocean basins: the Indian Gyre, North Atlantic Gyre, North Pacific Gyre, South Atlantic Gyre, South Pacific Gyre (Lebreton et al., 2012). The study conducted in the Adriatic Sea demonstrated that the distribution of floating debris corresponds to the spatial distributions of plastic debris inputs from rivers, cities, and shipping lanes, exhibiting clear seasonal patterns associated with the basin scale circulations (Liubartseva et al., 2016). Furthermore, a study in the Aegean Sea (Greece) found recurrent high concentrations of floating litter particles in the North Aegean plateau, Saronikos Gulf, and around the islands of Evia and Crete (Politikos et al., 2017). The study in Mediterranean Sea has found that relative to ocean circulation, the fates of plastic debris are also sensitive to its density and sinking speed (Baudena et al., 2023).
China is one of the largest plastic producers in the world. In 2022, its plastic production accounted for 32 percent of global output. In recent years, understanding the concentration, distribution, and transport of plastic litter in China Seas has emerged as a significant environmental concern for scientists, government officials, and stakeholders. Quantitative simulations have been widely employed to explore the distribution patterns of floating debris, as well as micro- and mesoplastics in various coastal waters of China (Li et al., 2018; Ding et al., 2019; Zhang and Choi, 2021; Yin et al., 2022; Jiang et al., 2024). These studies have revealed that the heavily polluted areas during the summer are primarily located in the South and East China Seas, with the Yangtze River identified as a major contributor (Sun et al., 2022; Liu et al., 2023). In the autumn and winter, the majority of the microplastics were found stranded along the south-central coast of China (Liu et al., 2023). Furthermore, increasing the vertical velocity of the plastics in numerical models extends the time required for plastic reach the open ocean (Shen et al., 2022). Nevertheless, these studies have revealed the seasonal transport and distribution patterns of floating litter, these remains a knowledge gap regarding how inter-annual circulation variability, associated with large scale climate events, can impact the fate and distribution of plastic debris. Previous studies have shown that the transport of plastic litter in the marine environment takes a considerable amount of time due to its high persistency in the environment (Lebreton et al., 2019; Kaandorp et al., 2023). Therefore, understanding the inter-annual variability of distribution pattern, particularly in relation to large-scale climate variability, is crucial for understanding and predicting long-term environmental and ecological trends (Howell et al., 2012). This will help inform adaptive management strategies and mitigate the impacts of climate variability on ecosystems.
The Pearl River is the second largest river in China. It is considered a significant conduit for plastic waste transport due to heavy anthropogenic activities in recent years. After the plastic debris are released from the Pearl River, they would pass through the Pearl River Estuary (PRE) and finally enters the Northern South China Sea (NSCS) shelf, where it encounters various intricate shelf circulations and monsoons. This complex hydrodynamic condition makes it difficult to predict the transport pathway of floating debris into the ocean (Gan et al., 2009; Shu et al., 2018a). The NSCS exhibits inter-annual variability in circulation and hydrological properties, which has been found to be associated with the large scale climate variabilities, the El Nino - Southern Oscillation (ENSO) (Qian et al., 2018; Lui et al., 2020; Deng et al., 2022; Cui et al., 2024b). Consequently, this region serves as an ideal location to investigate how climate variability influences the transport patterns of floating litter. The main objectives of this study is to: (1) investigate the fate and distribution of floating litter particles in the NSCS after they release from the PRE; (2) explore the potential impact of ENSO on the transport of floating litter particles released during different seasons; (3) predict the probable fate and distribution of litter in shoreline areas during El Niño, La Niña and ENSO-neutral years.
The Pearl River Basin spans more than 796,300 km2 across eight provinces in China, with a total population of nearly 60 million. It encompasses three subestuaries: Lingding Bay, Modaomen and Huangmaohai. Among these, Lingding Bay receives about 50 - 55% of the total freshwater discharge from the Pearl River. The extensive catchment area of the PRE includes nine densely populated cities in Guangdong Province, which are characterized by intensive aquaculture (fisheries) and industrial activities (Xu et al., 2019; Lam et al., 2020; Zhang et al., 2021). Consequently, these activities lead to significant waste discharges into the Pearl River. So far, about 2.5 × 10⁶ tons of plastic waste are emitted into the ocean each year, ranking as the seventh highest source among the world’s rivers (Fok and Cheung, 2015; Lebreton et al., 2017; Mai et al., 2019; Weiss et al., 2021).
After the floating debris are released, they enter the PRE - NSCS Shelf, where they will be transported by the shelf currents. The complex dynamics of the circulation and water movement on the NSCS shelf are influenced by various factors, including winds, tides, Kuroshio intrusions, and freshwater discharges from the PRE (Shu et al., 2018b). These processes are further shaped by the local topography of the region (Shu et al., 2018a; Li et al., 2021). Throughout the year, the SCS experiences a predominantly anticlockwise cyclonic circulation, which weakens in summer and strengthens in winter. In the Beibu Gulf, an unclosed anticlockwise circulation persists year - round. Near the coastal region of Guangdong Province, the coastal jet is southwesterly in summer and northeasterly in winter. Further offshore, the northeasterly South China Sea warm current prevails throughout the year. In the vicinity of Shantou and Dongshan Island, a strong upwelling region occurs due to seasonal variable winds. The NSCS is characterized by several prominent circulation features that define its typical characteristics, including the NSCS slope current, the SCS warm current, the Guangdong coastal current, summer upwelling in the NSCS, and winter downwelling (Figure 1). Together, these components form the fundamental circulation patterns observed within the NSCS (Shu et al., 2018b).

Figure 1. The topography (m) and diagrammatic sketch of circulation in the NSCS. The solid blue arrow denotes the summer current, while the dashed blue area represents the wind current flowing over the shelf.
The hydrodynamic model here we use is the Regional Ocean Modelling System (ROMS; Shchepetkin and McWilliams, 2009). For short, the simulation domain spans the region from 104.98° - 120.55°E, 16.54° - 25.96°N with an average spatial resolution of about 4 km (Figure 2). The model has 30 terrain following vertical layers. The physical model is configured to use the recursive MPDATA 3D advection scheme for tracers, fourth - order horizontal advection of tracers, third - order upwind advection of momentum, and the Mellor and Yamada (1982) turbulent closure scheme for vertical mixing. The viscosity/diffusion coefficient for second - harmonic horizontal mixing is set to 10 -5 m 2s -1. The numerical integration is performed with an internal modal time step of 900 s and an external modal time step of 60 s, according to the Courant - Friedrichs - Lewy criterion. More details on the model configuration could refer to Feng et al. (2022) and Luo et al. (2023).
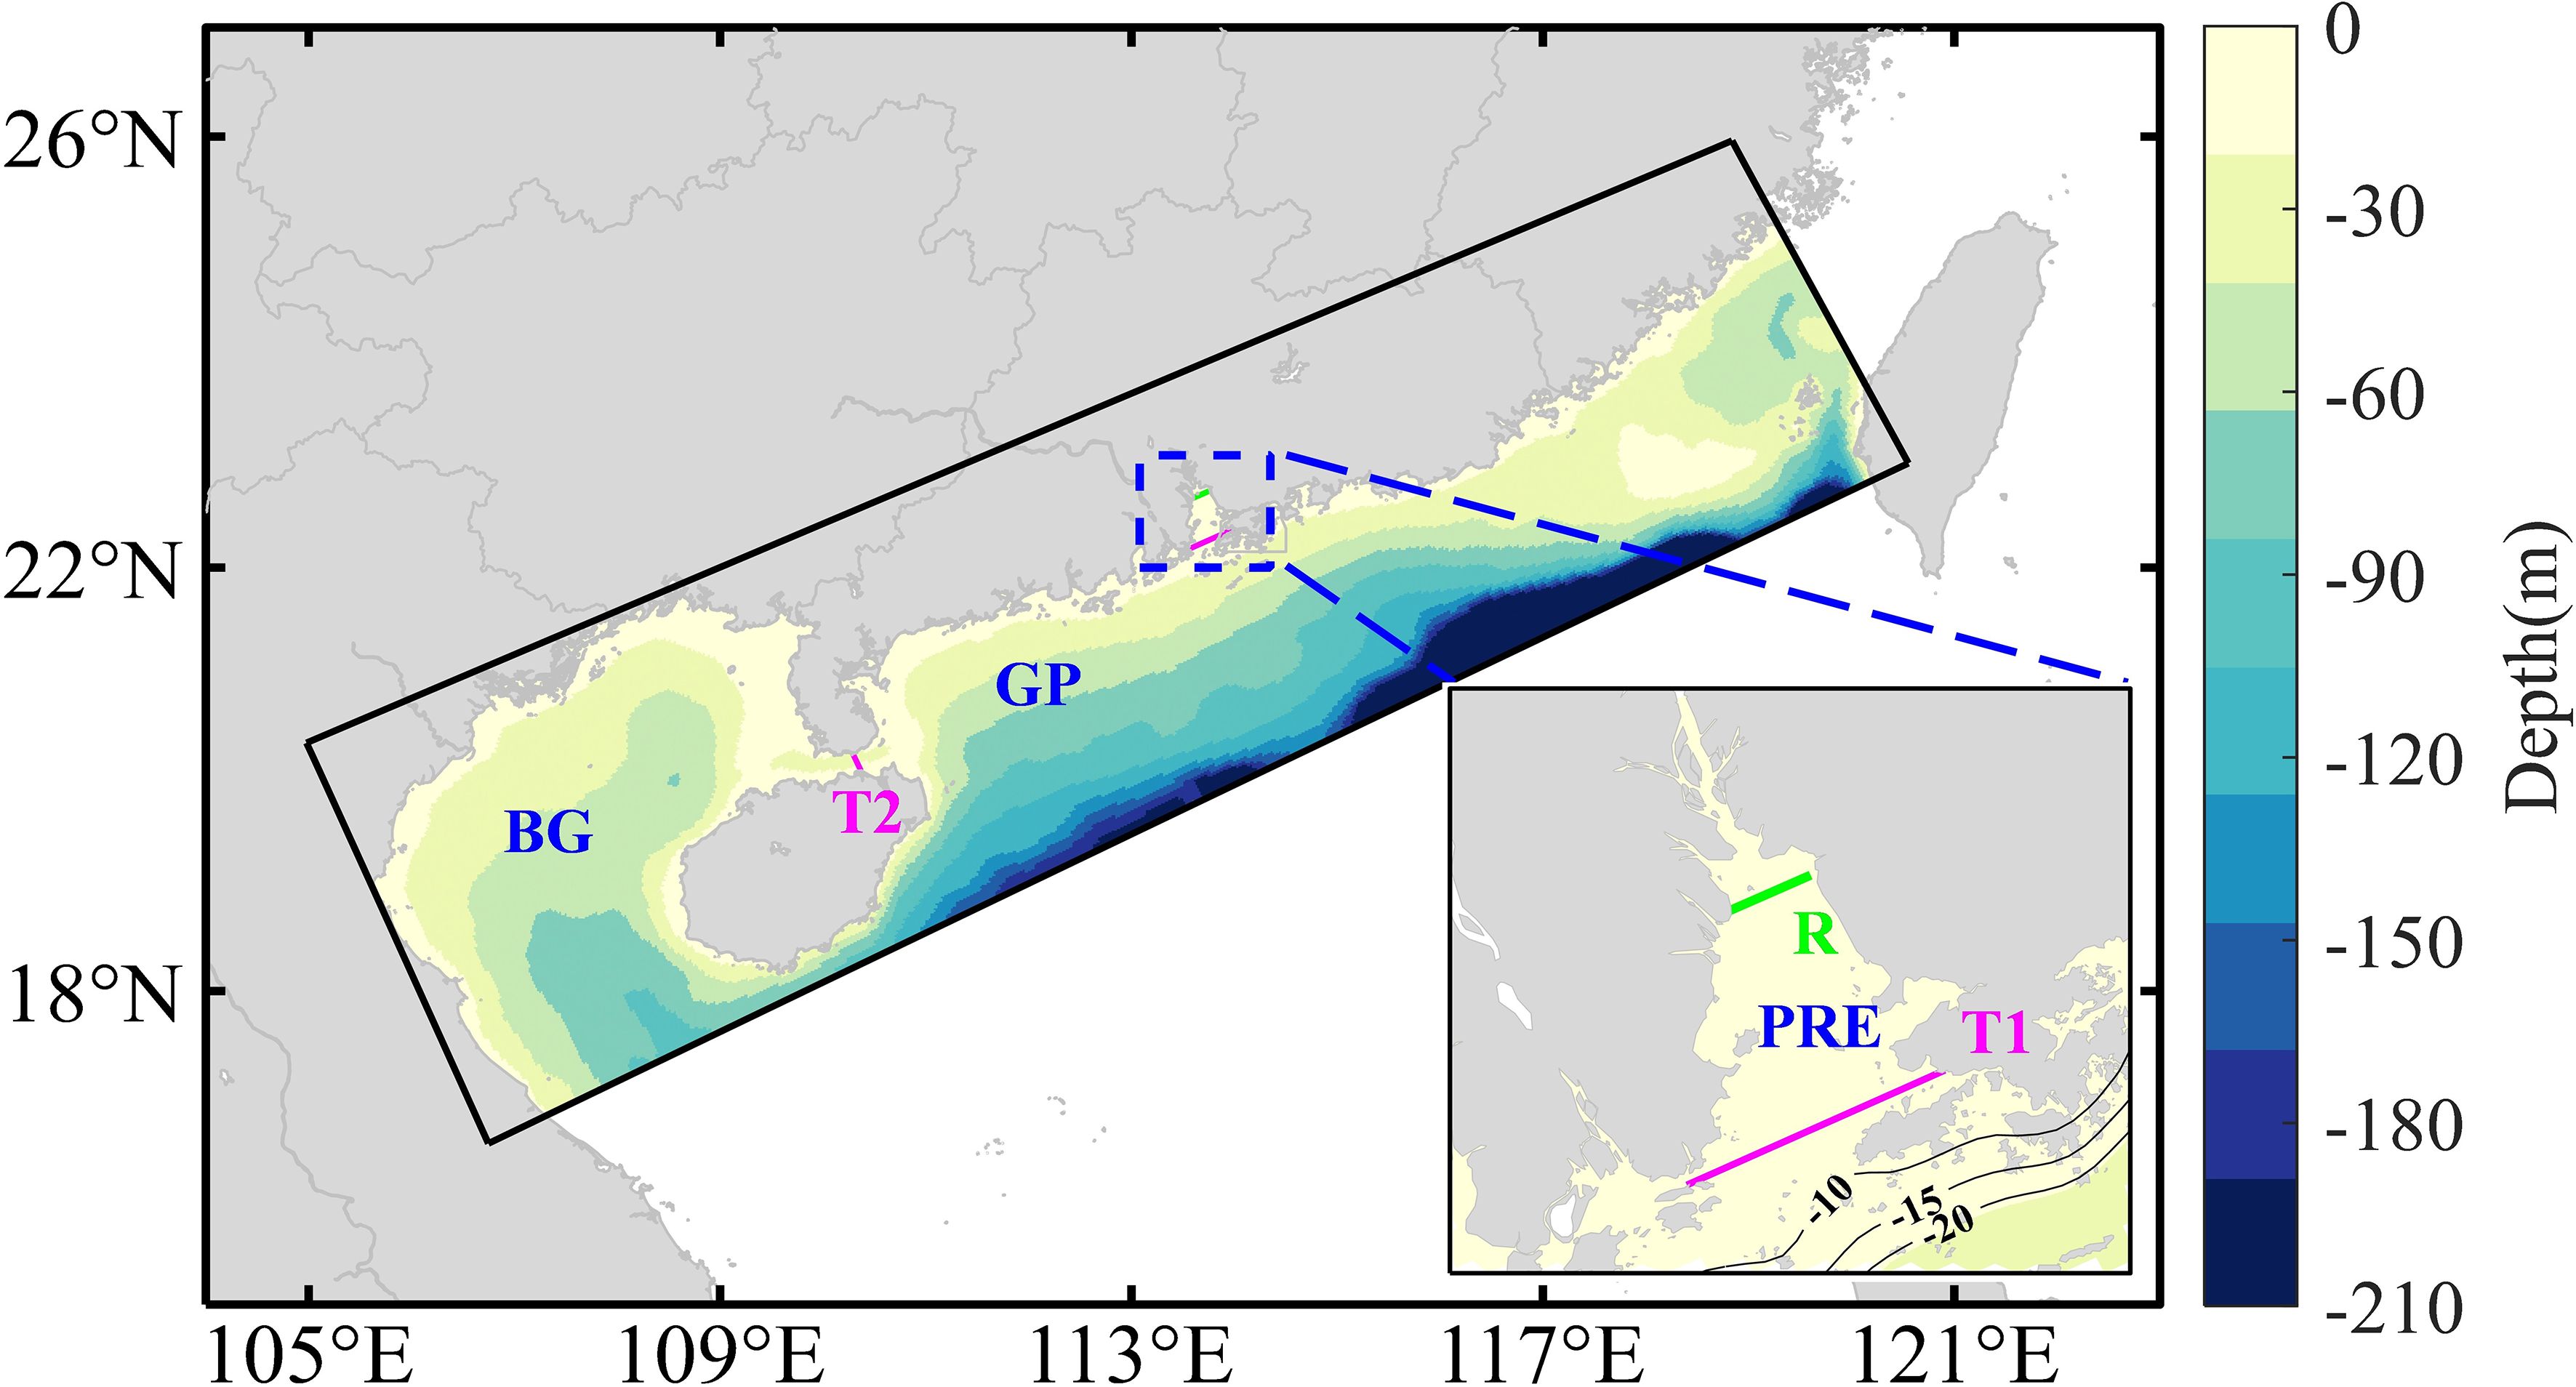
Figure 2. The ~ 4 km ROMS model domain (the black box). The green line in the figure represents the cross-section of the PRE in where particles were released (113.59°E, 22.65°N - 113.75°E, 22.72°N). Two transects, T1 and T2 are marked as magenta lines to calculate the exchange of floating litter. T1 measures the exchange between the PRE and the coastal areas of Guangdong Province (GP), while T2 quantifies the exchange between the coastal areas of Guangdong Province (B) and the Beibu Gulf (BG), respectively (see Table 1; Figure 3).
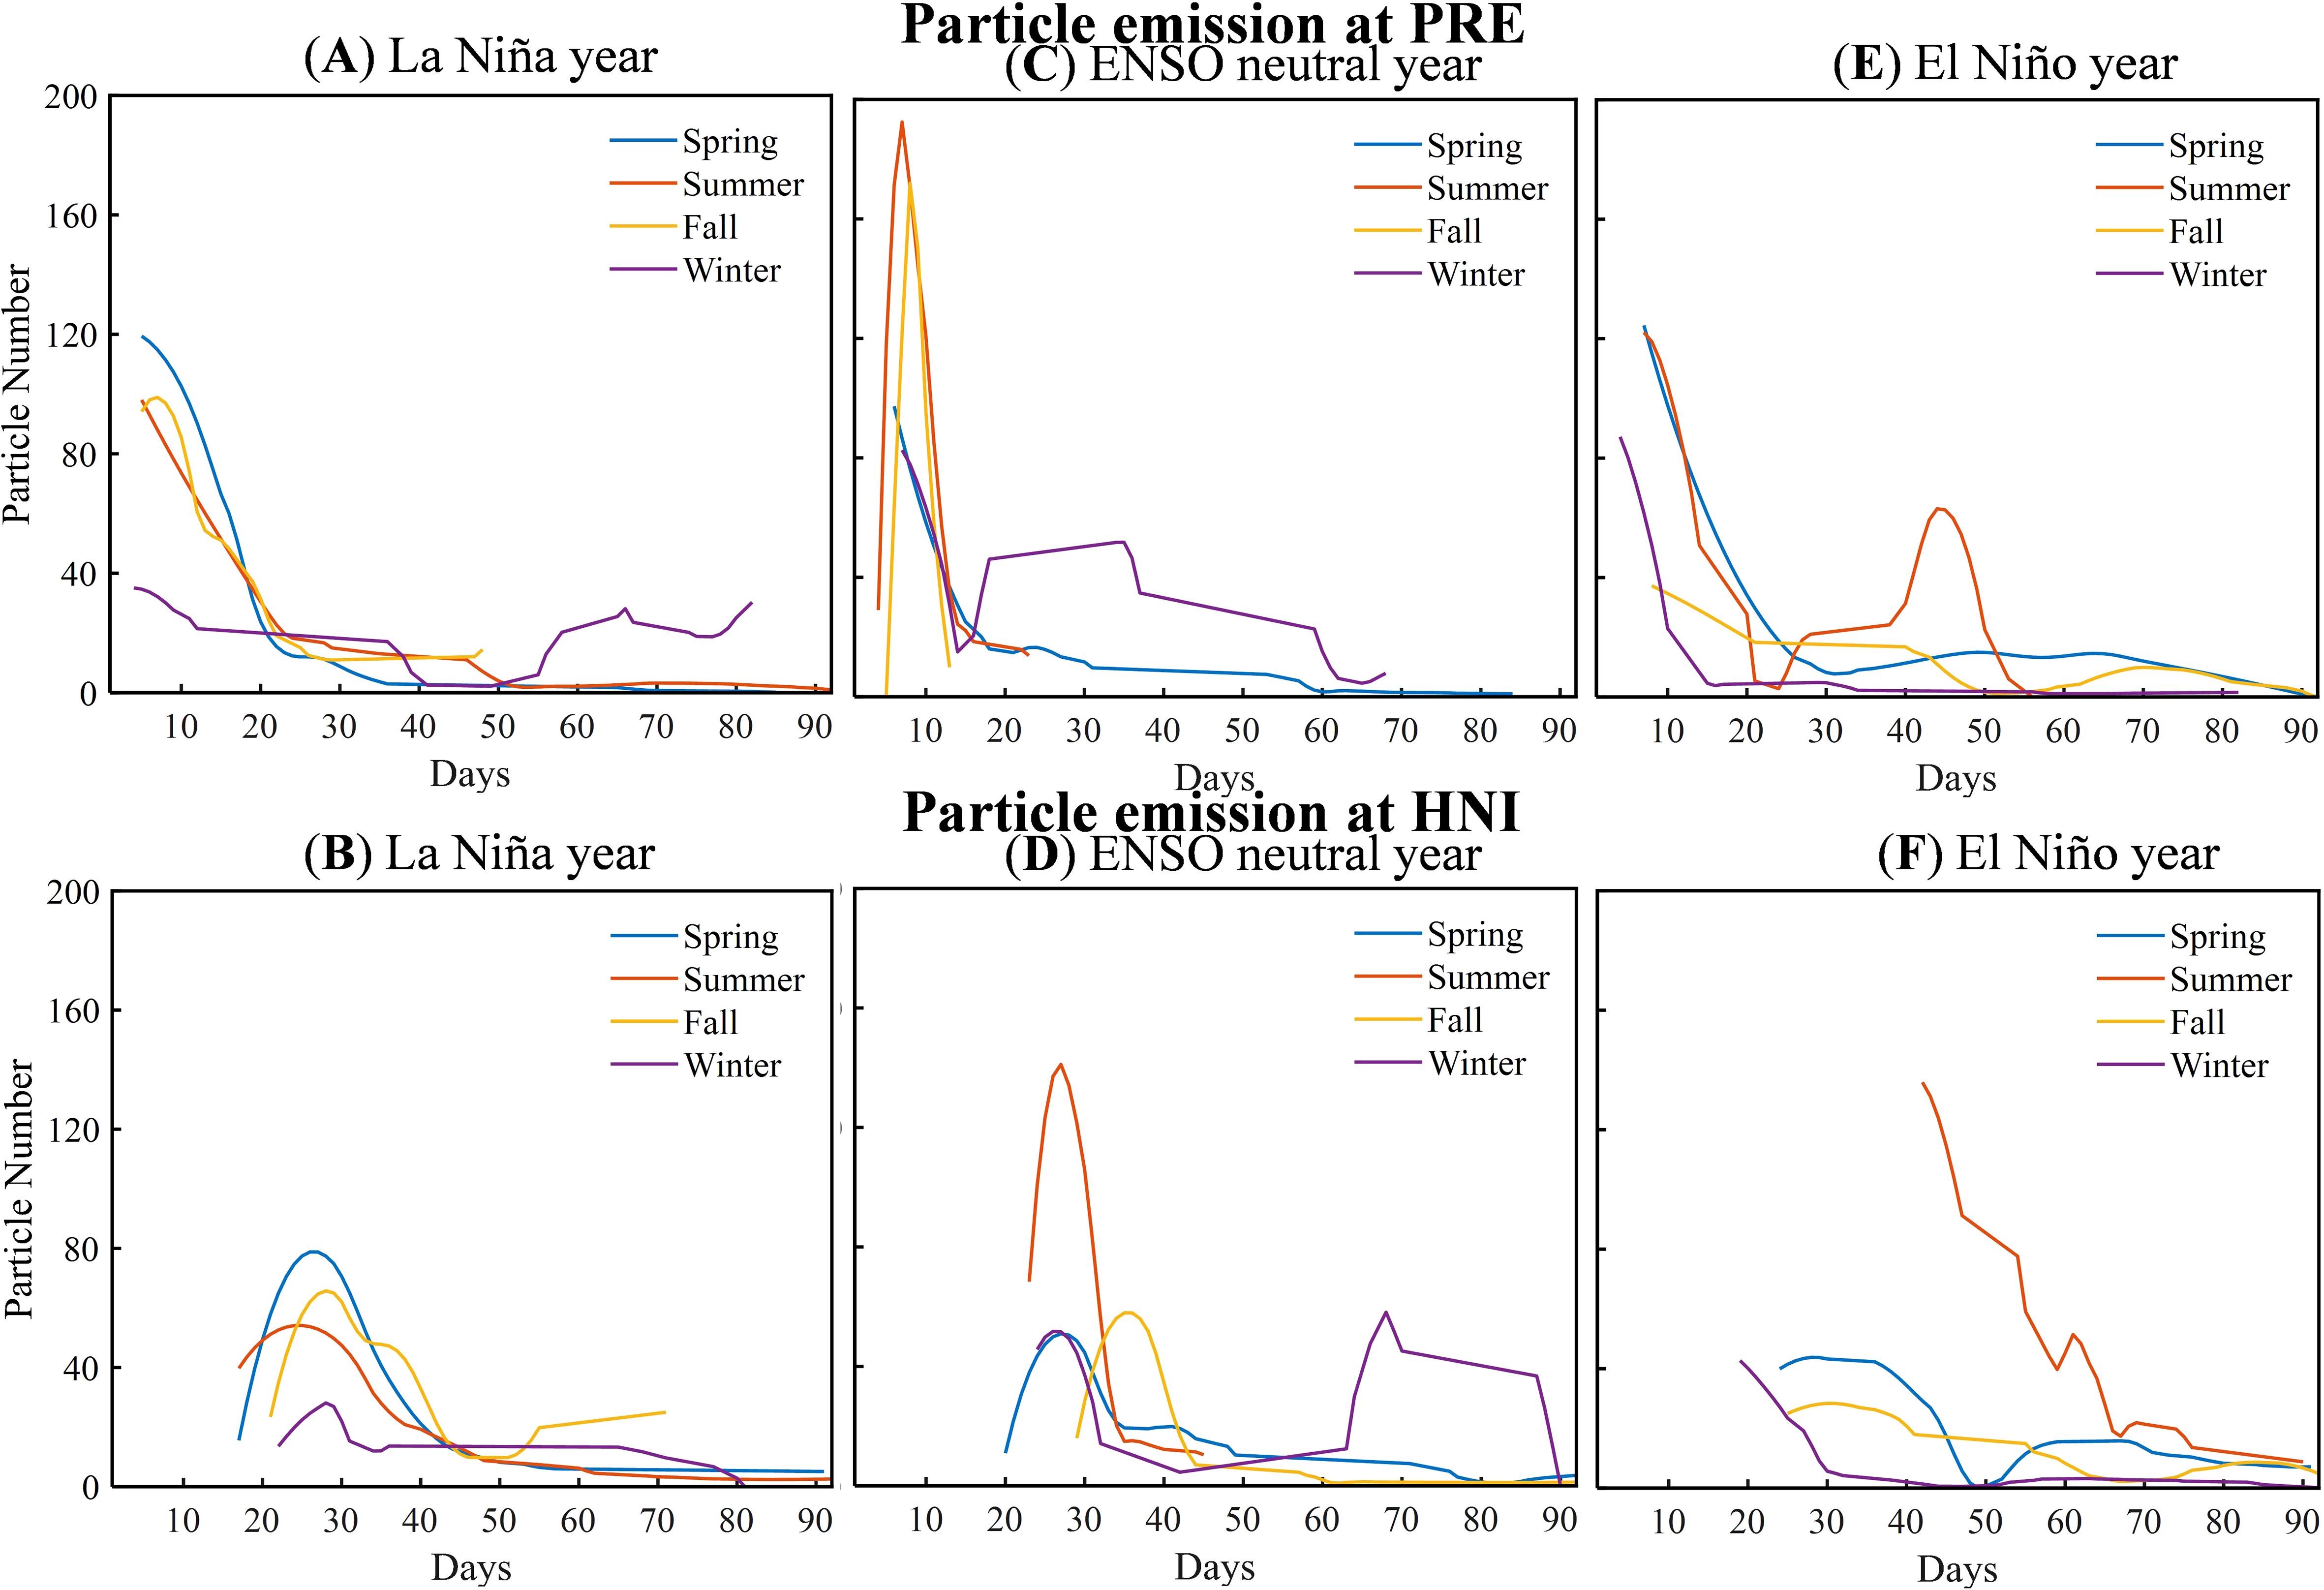
Figure 3. Daily emission of particles across transects T1 in (A) 2011; (C) 2012; (E) 2015; and T2 in (B) 2011; (D) 2012; (F) 2015.
Simulations were conducted using the Lagrangian tracking model TRACMASS (https://www.tracmass.org/index.html). The model is based on the Eulerian velocity field to diagnose the forward and backward transport paths of the water column, written in Fortran by Döös (1995) (Döös et al., 2017), and is one of the offline tracking models widely used by oceanographers and atmospheric scientists at present. The grid of TRACMASS is consistent with the C - grid, which is universally applicable to a wide range of ocean models (e.g. ROMS, HYCOM, POM, etc.) output formats (Döös et al., 2008).
In this study, we treated floating litter particles as passive drifters, only influenced by surface currents and diffusion. We did not account for additional properties, such as sedimentation, degradation, or density, since our focus was on floating litter rather than microplastics. These assumptions were also adopted by Politikos et al. (2017) in their study, which simulated the fate and distribution of floating litter particles in the Aegean Sea. Therefore, the horizontal movement of a particle is determined by the surface current velocities obtained from ROMS. We also took into consideration random displacement coordinates (xd, yd) based on the time step (dt), and the horizontal diffusivity value (Ah). The position of a particle is calculated using the following equation:
where Ah represents horizontal diffusion constant (Ah was set to 10 -5 m2 s-1 in this experiment); qn represents random numbers defined between zero and one.
To identify ENSO events from 2008 to 2021, we utilized the Oceanic Nino Index (ONI) provided by the National Oceanic and Atmospheric Administration (NOAA) Climate Prediction Centre. Specifically, years with annual mean ONI values above (+ 0.5°C) or below (- 0.5°C) were categorized as El Niño or La Niña) years, respectively. In the designated period, we observed three El Niño events (2009 - 2010; 2015 - 2016; 2019 - 2020), with the strongest occurring during 2015 - 2016. Furthermore, three La Niña years (2008 - 2009; 2011 - 2012; 2021 - 2022) were identified, with the most pronounced one observed in 2011 - 2012 (Fang et al., 2006a, b). During the El Niño years, precipitation in South China increased greatly due to intensified land-ocean interaction (Wang et al., 2018), resulting in significantly enhanced river runoff (Figure 4B). In contrast, the lowest annual mean ONI value in 2011 indicates a more robust La Niña phenomenon characterized by cooler temperatures and reduced precipitation.
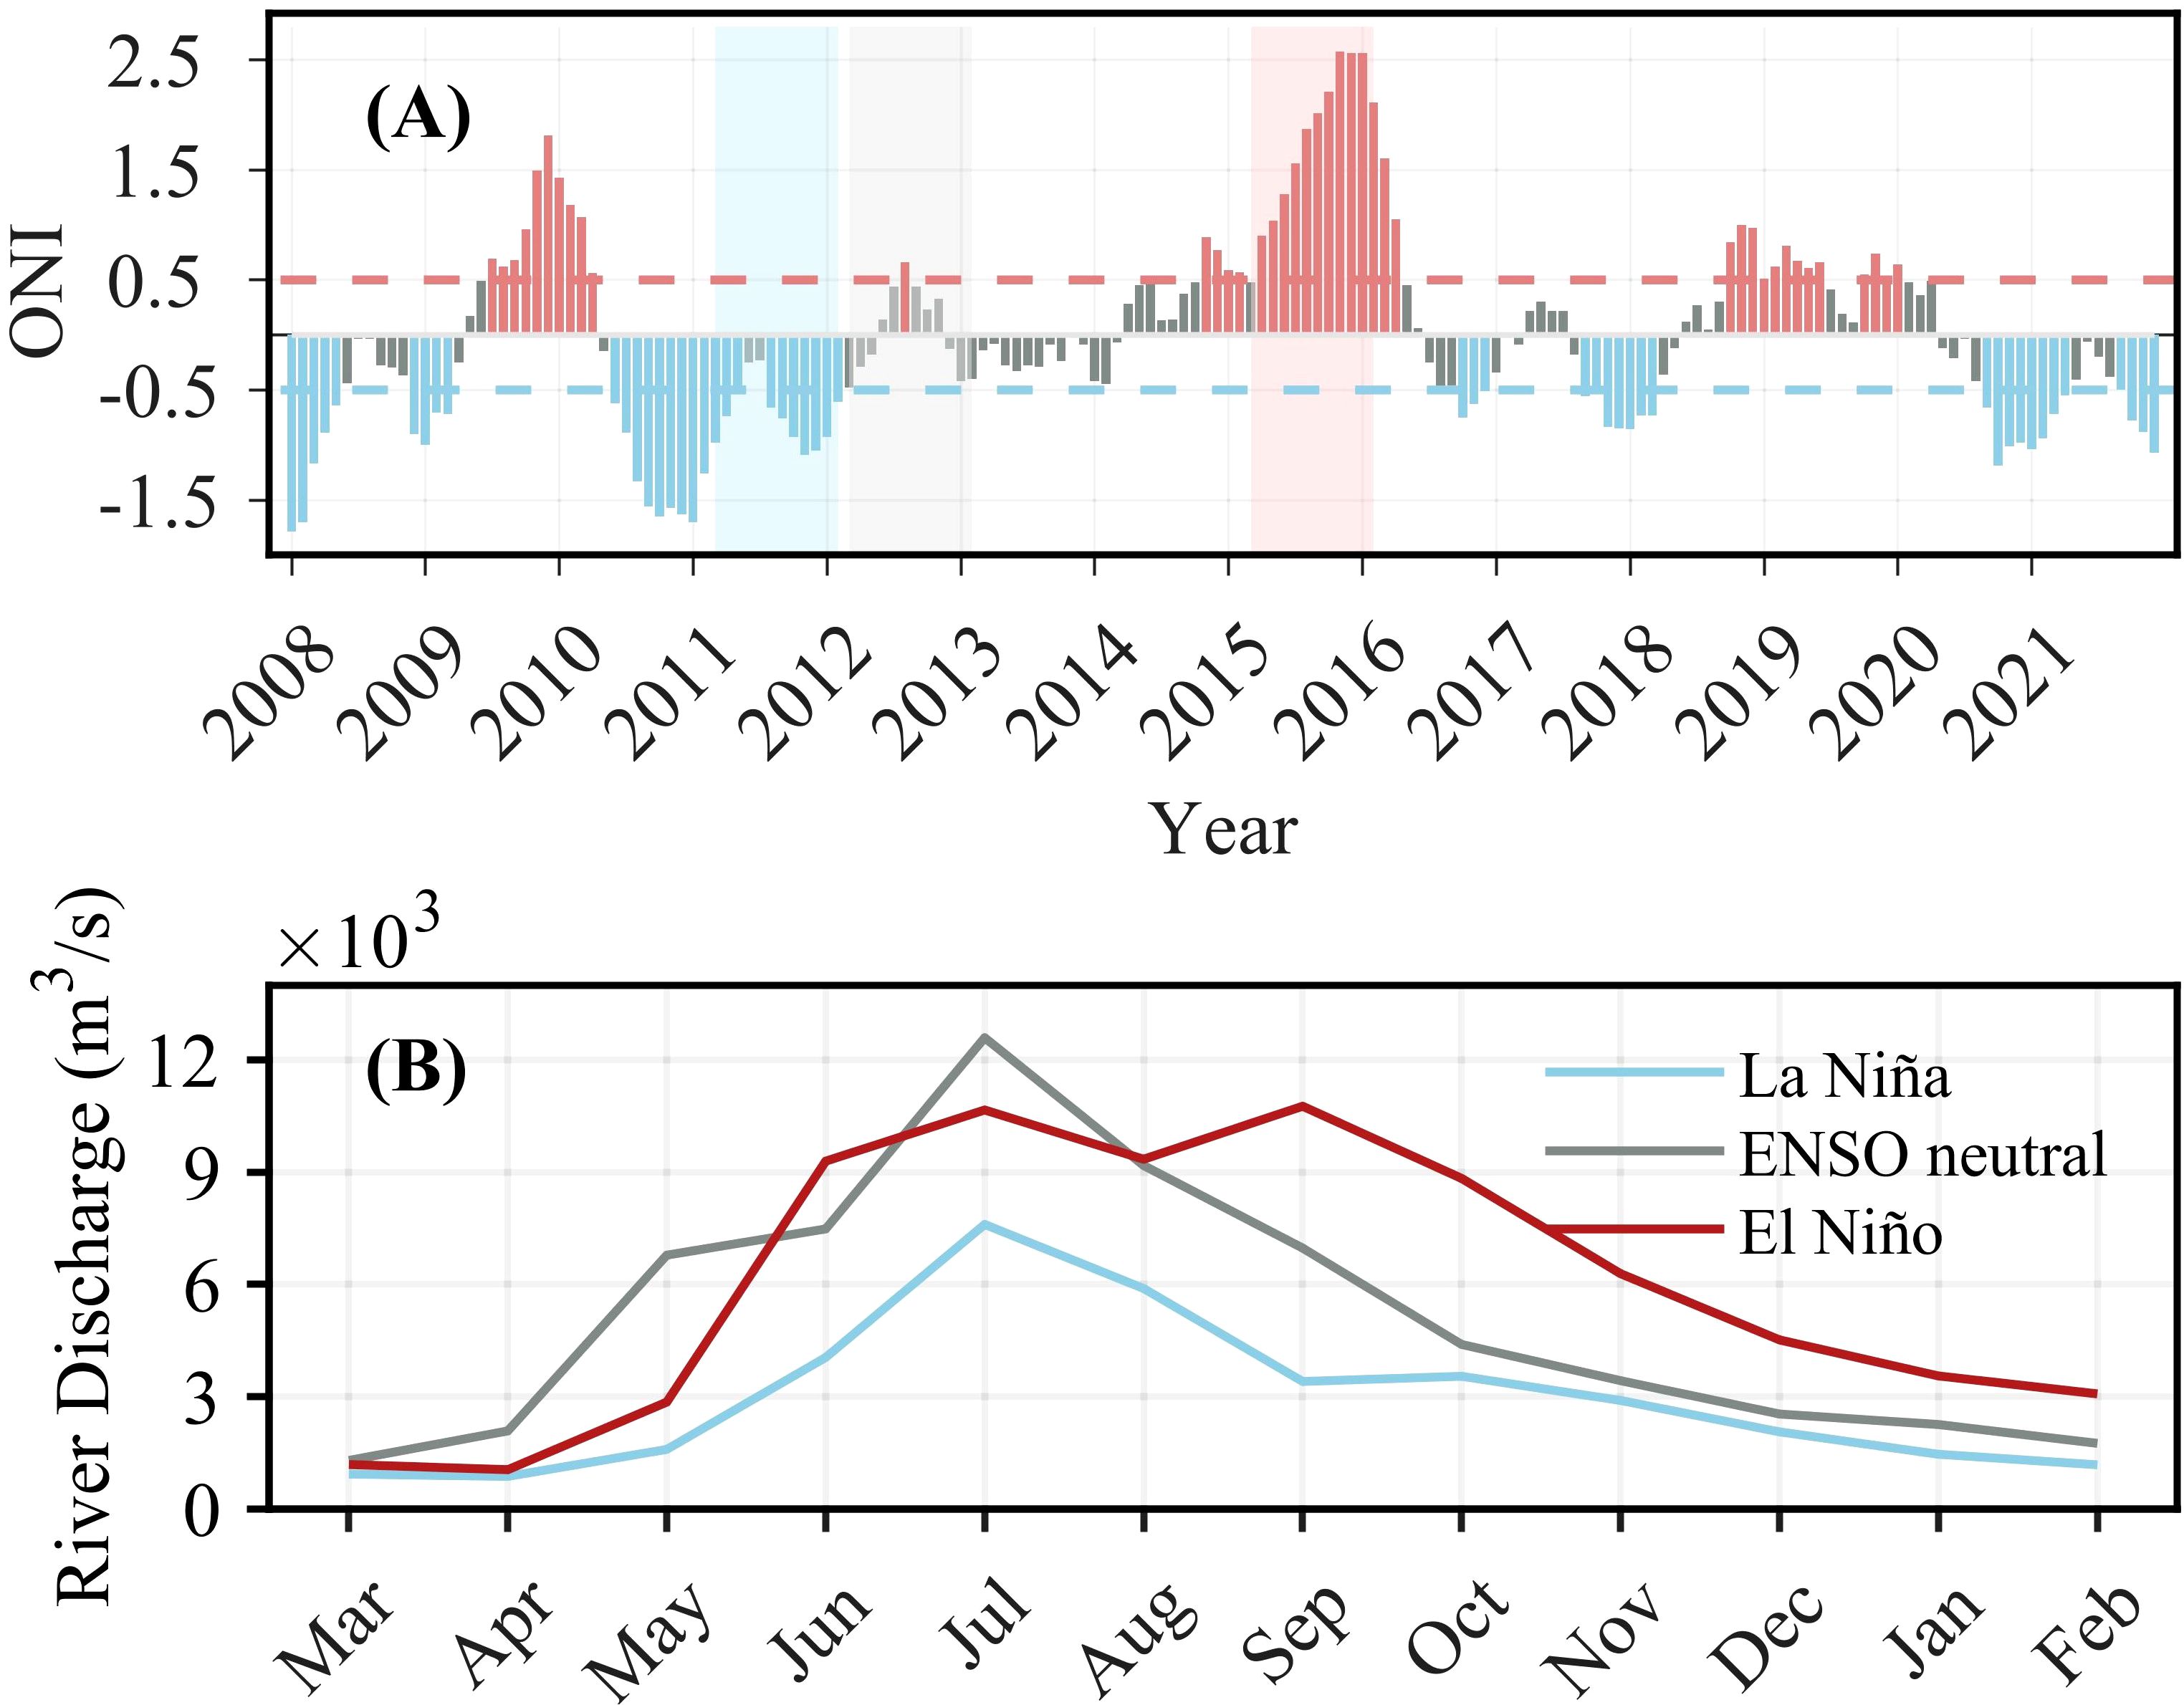
Figure 4. (A) The monthly averaged Oceanic Niño Index (ONI). The bars are color-coded (red: El Niño events; blue: La Niña events). The shaded areas in red and blue indicate typical El Niño (Mar. 2011 - Feb. 2012), ENSO neutral (Mar. 2012 - Feb. 2013), and La Niña (Mar. 2015 - Feb. 2016) conditions, respectively. (B) Monthly averaged river discharge of Pearl River for the selected La Niña; ENSO neutral; and the El Niño year.
To investigate the impact of floating litter, we selected the strongest El Niño year in 2015 and the most intense La Niña year in 2011, as well as an ENSO-neutral year in 2012 for comparison. The averaged Pearl River discharge can be reached as high as 744 m3 s -1 in 2015, but only 370 m3 s -1 in 2011.
To investigate the impact of ENSO events on the fate and distribution of floating litter particles in the PRE, we conducted three sets of experiments. In each set, particles were released on the first day of the spring (Mar - May), summer (Jun-Aug), autumn (Sep - Nov), and winter (Dec - Feb) at the typical ENSO-neutral (2012), El Niño (2015), and La Niña (2011) years, respectively. Each set was run for 3 months.
Marine litter usually enters the ocean from land-based sources; therefore, we released particles from the mouth of the Pearl River (R at the Figure 2) every hour. The emission rate was estimated by multiplying the river’s discharge (m3/s) by the plastic concentration (items/m³) (Liu et al., 2023). Based on the volume of the Pearl River’s discharge and the measurements from Mai et al. (2019), we estimated that approximately 150 particles are released per hour, resulting in a total of 3,600 particles.
The fate and distribution of floating litter are described quantitatively by daily appearance, beaching, transport distance, and time for particles to pass through the PRE and the Qiongzhou Strait.
Stranding of particles is not included in the established modules of the TRACMASS model, so when particles appear on the land grid, they were bounced back into the ocean and still drift with the offshore surface currents. A particle is marked as “beached” if it drifted in cells adjacent to land. The distribution of floating litter along the coastline are calculated by counting the number of beached litter particles (Lebreton et al., 2017; Politikos et al., 2017).
We also calculated the exchange of particles between PRE and NSCS continental shelf (marked as T1); and between the coastal areas of Guangdong Province (GP) and Beibu Gulf (GB) (marked as T2). We tracked the particles grid position after releasing from the river mouth. The time when the particle crosses a section we mark it as the crossing time.
The transport distance of the floating litter particles in each experiment was calculated by tracking the movement of each individual particle from the initial to the final grid, summing up the moving distance at every step, and then taking the average of all released particles.
To understand the impact of ENSO-induced hydrodynamic variability on floating litter, we next first examined the seasonal mean flow on the NSCS shelf during an ENSO-neutral year (2012). Subsequently, we compared the hydrodynamic patterns during El Niño (2015) and La Niña (2011) years against the ENSO-neutral year (Figures 5–7). These comparative analyses provide insights into the driving mechanisms for inter-seasonal and inter-annual variability of floating litter distributions.
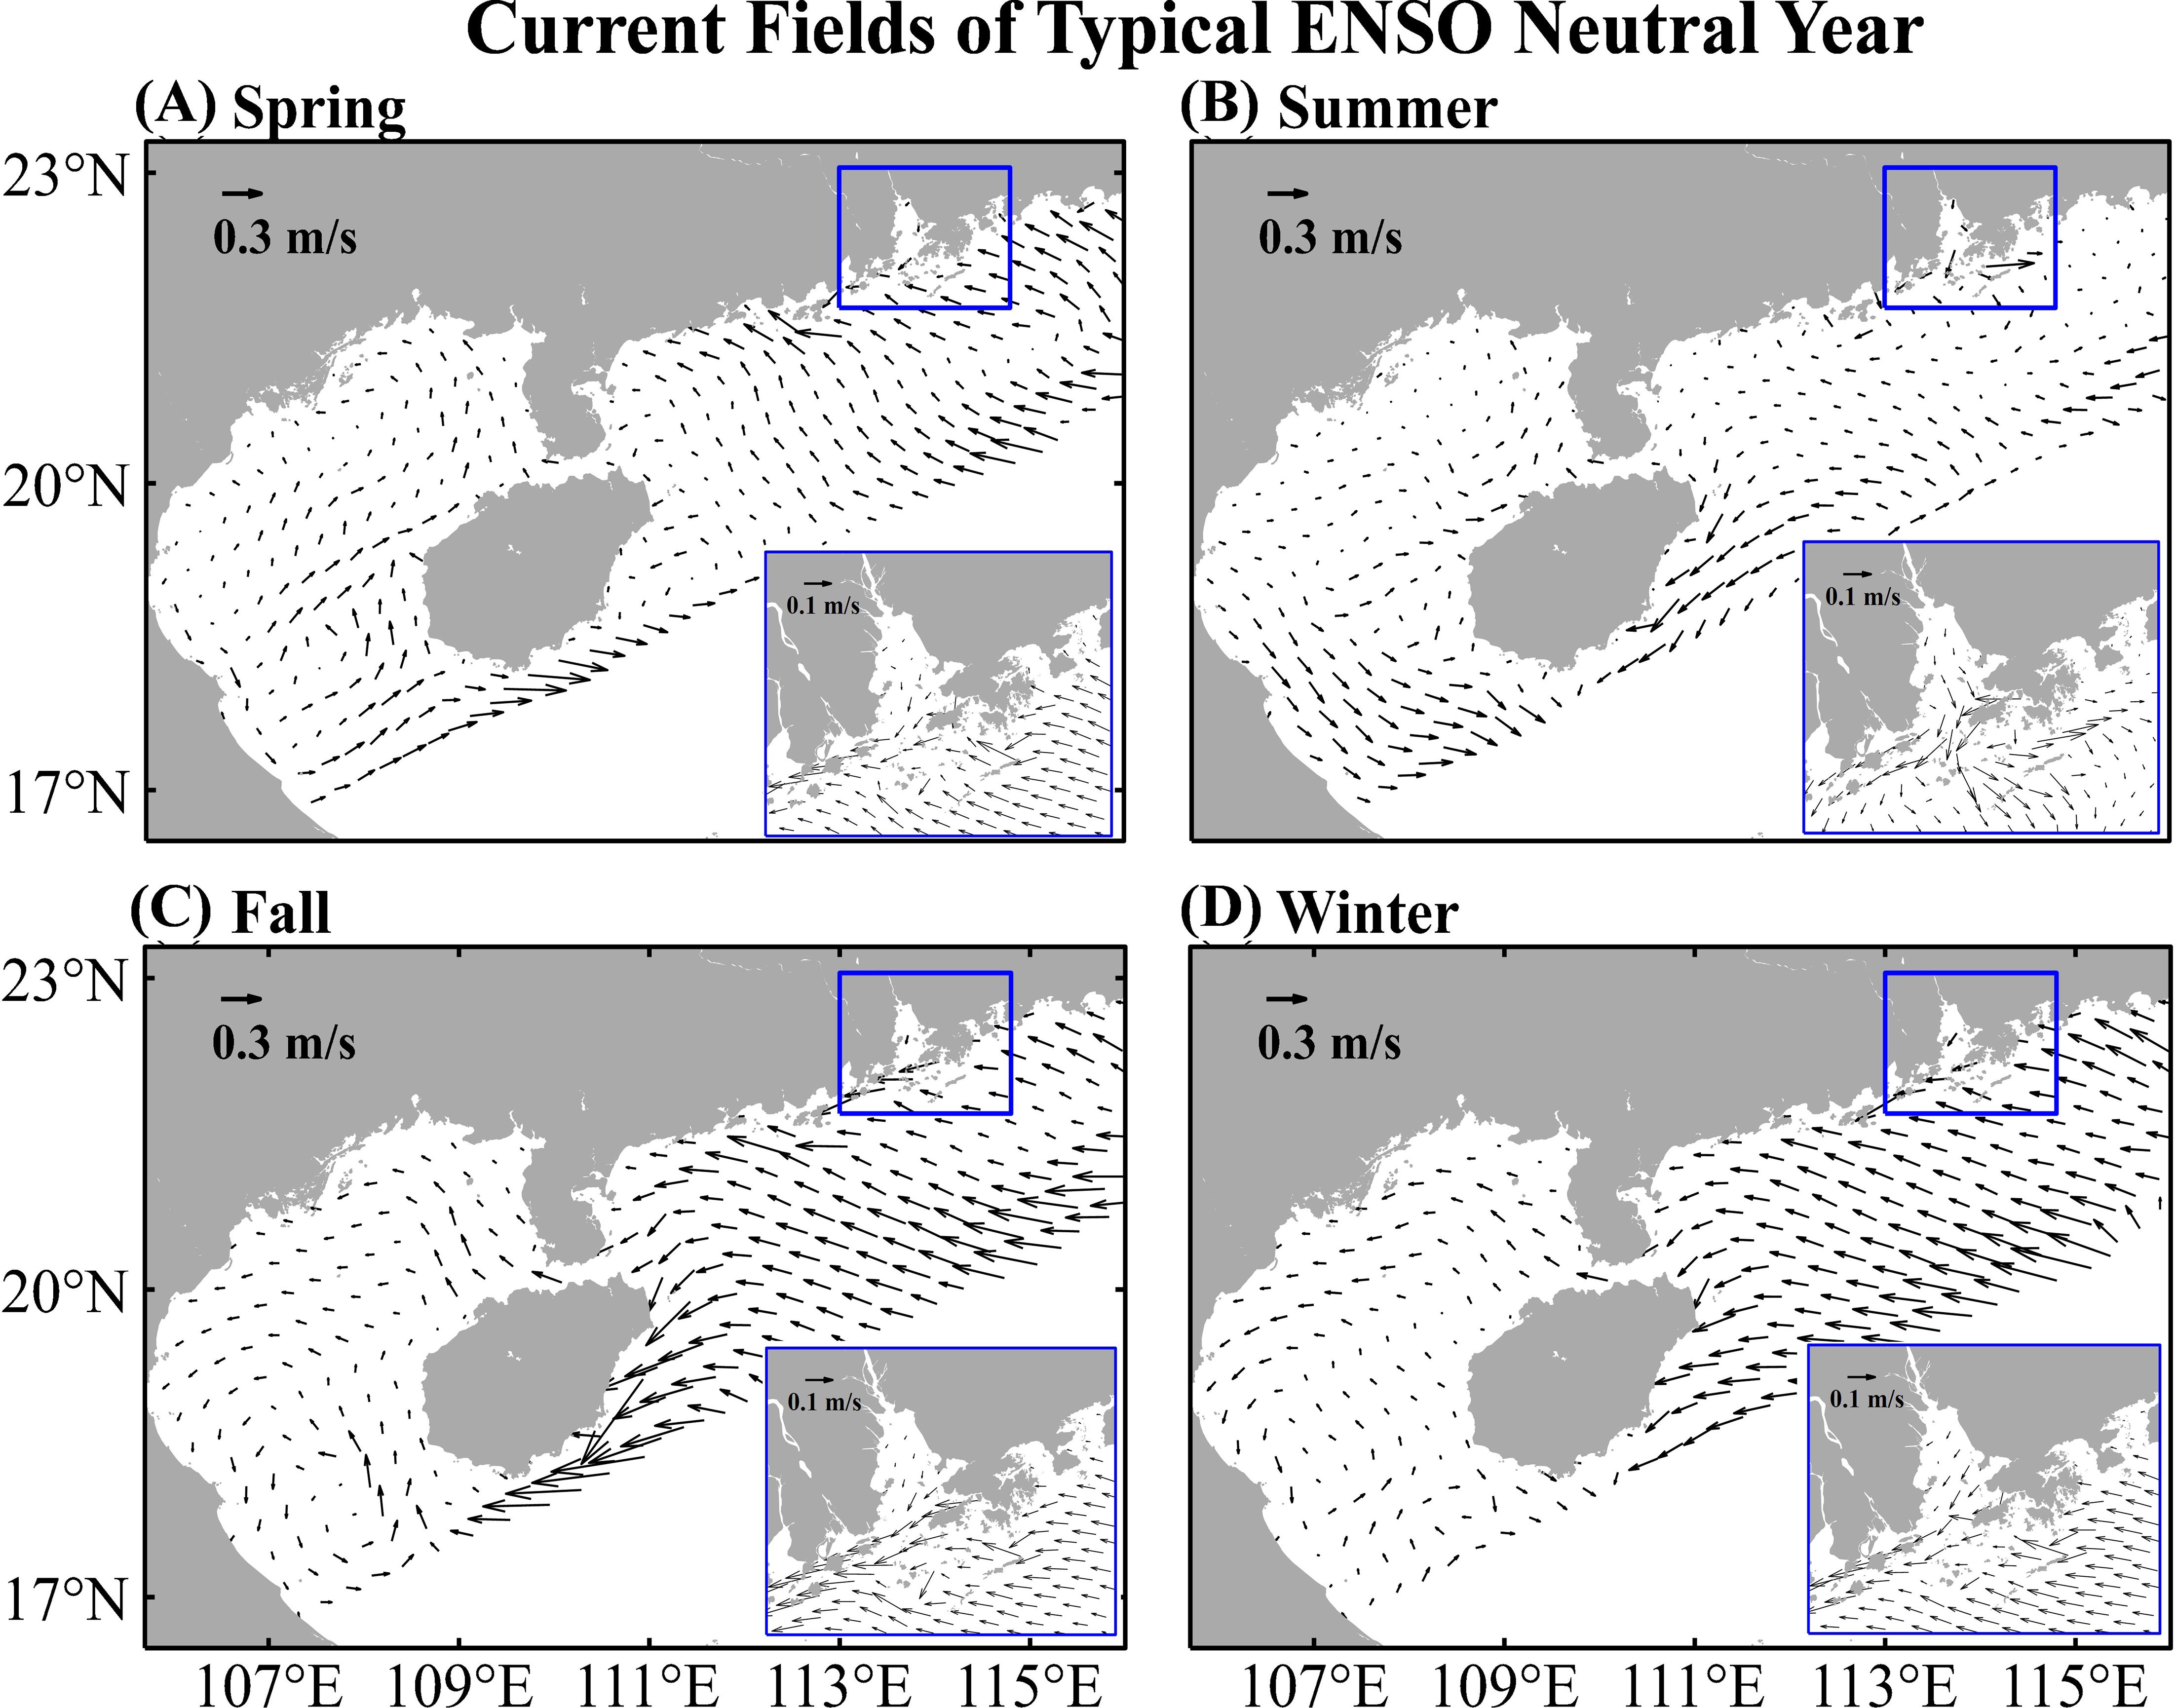
Figure 5. Mean seasonal averaged current field during the typical ENSO-neutral year (Mar. 2012 - Feb. 2013). (A) Spring (Mar. 2012 - May. 2012); (B) Summer (Jun. 2012 - Aug. 2012); (C) Fall (Sep. 2012 - Nov. 2012); (D) Winter (Dec. 2012 - Feb. 2013). Surface currents in the Pearl River water were enlarged.
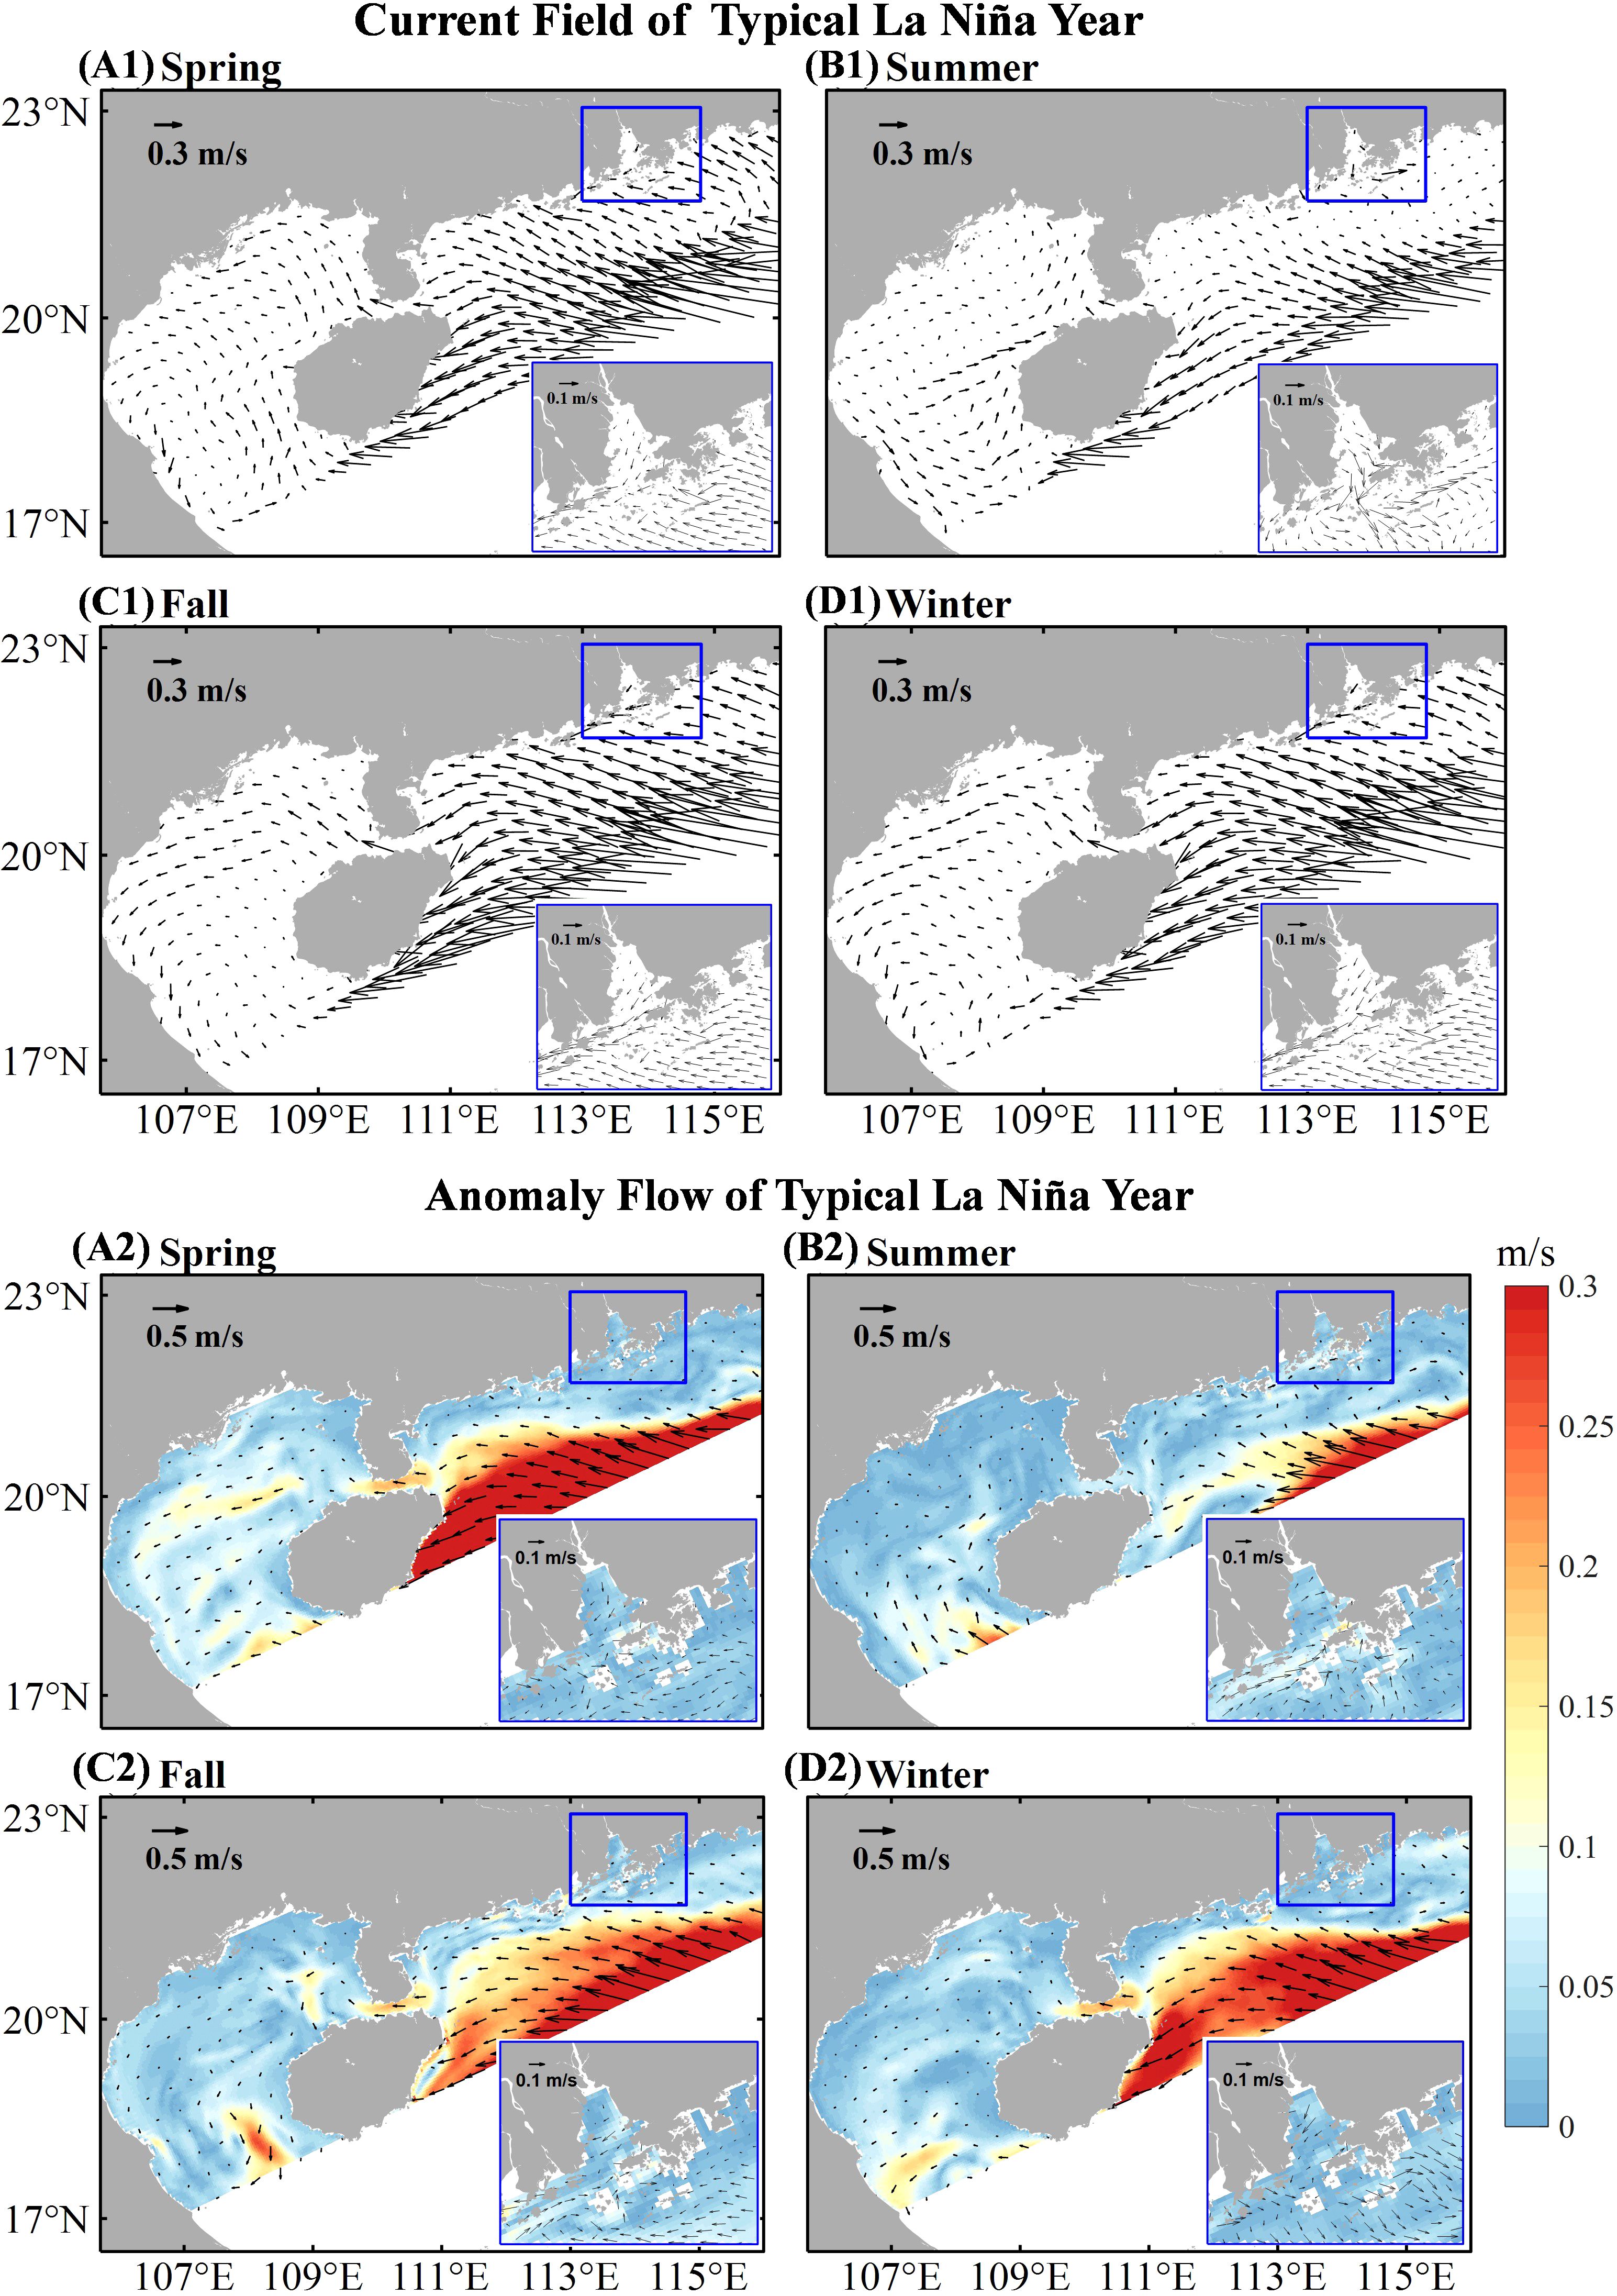
Figure 6. Mean seasonal averaged current field during the typical La Niña year and the anomaly with the ENSO-neutral year (Mar. 2012 - Feb. 2013). (A1-D1) the normal current fields; (A2-D2) the anomaly current fields. Surface currents in the Pearl River water were enlarged. The separation of four seasons was the same as that in Figure 5.
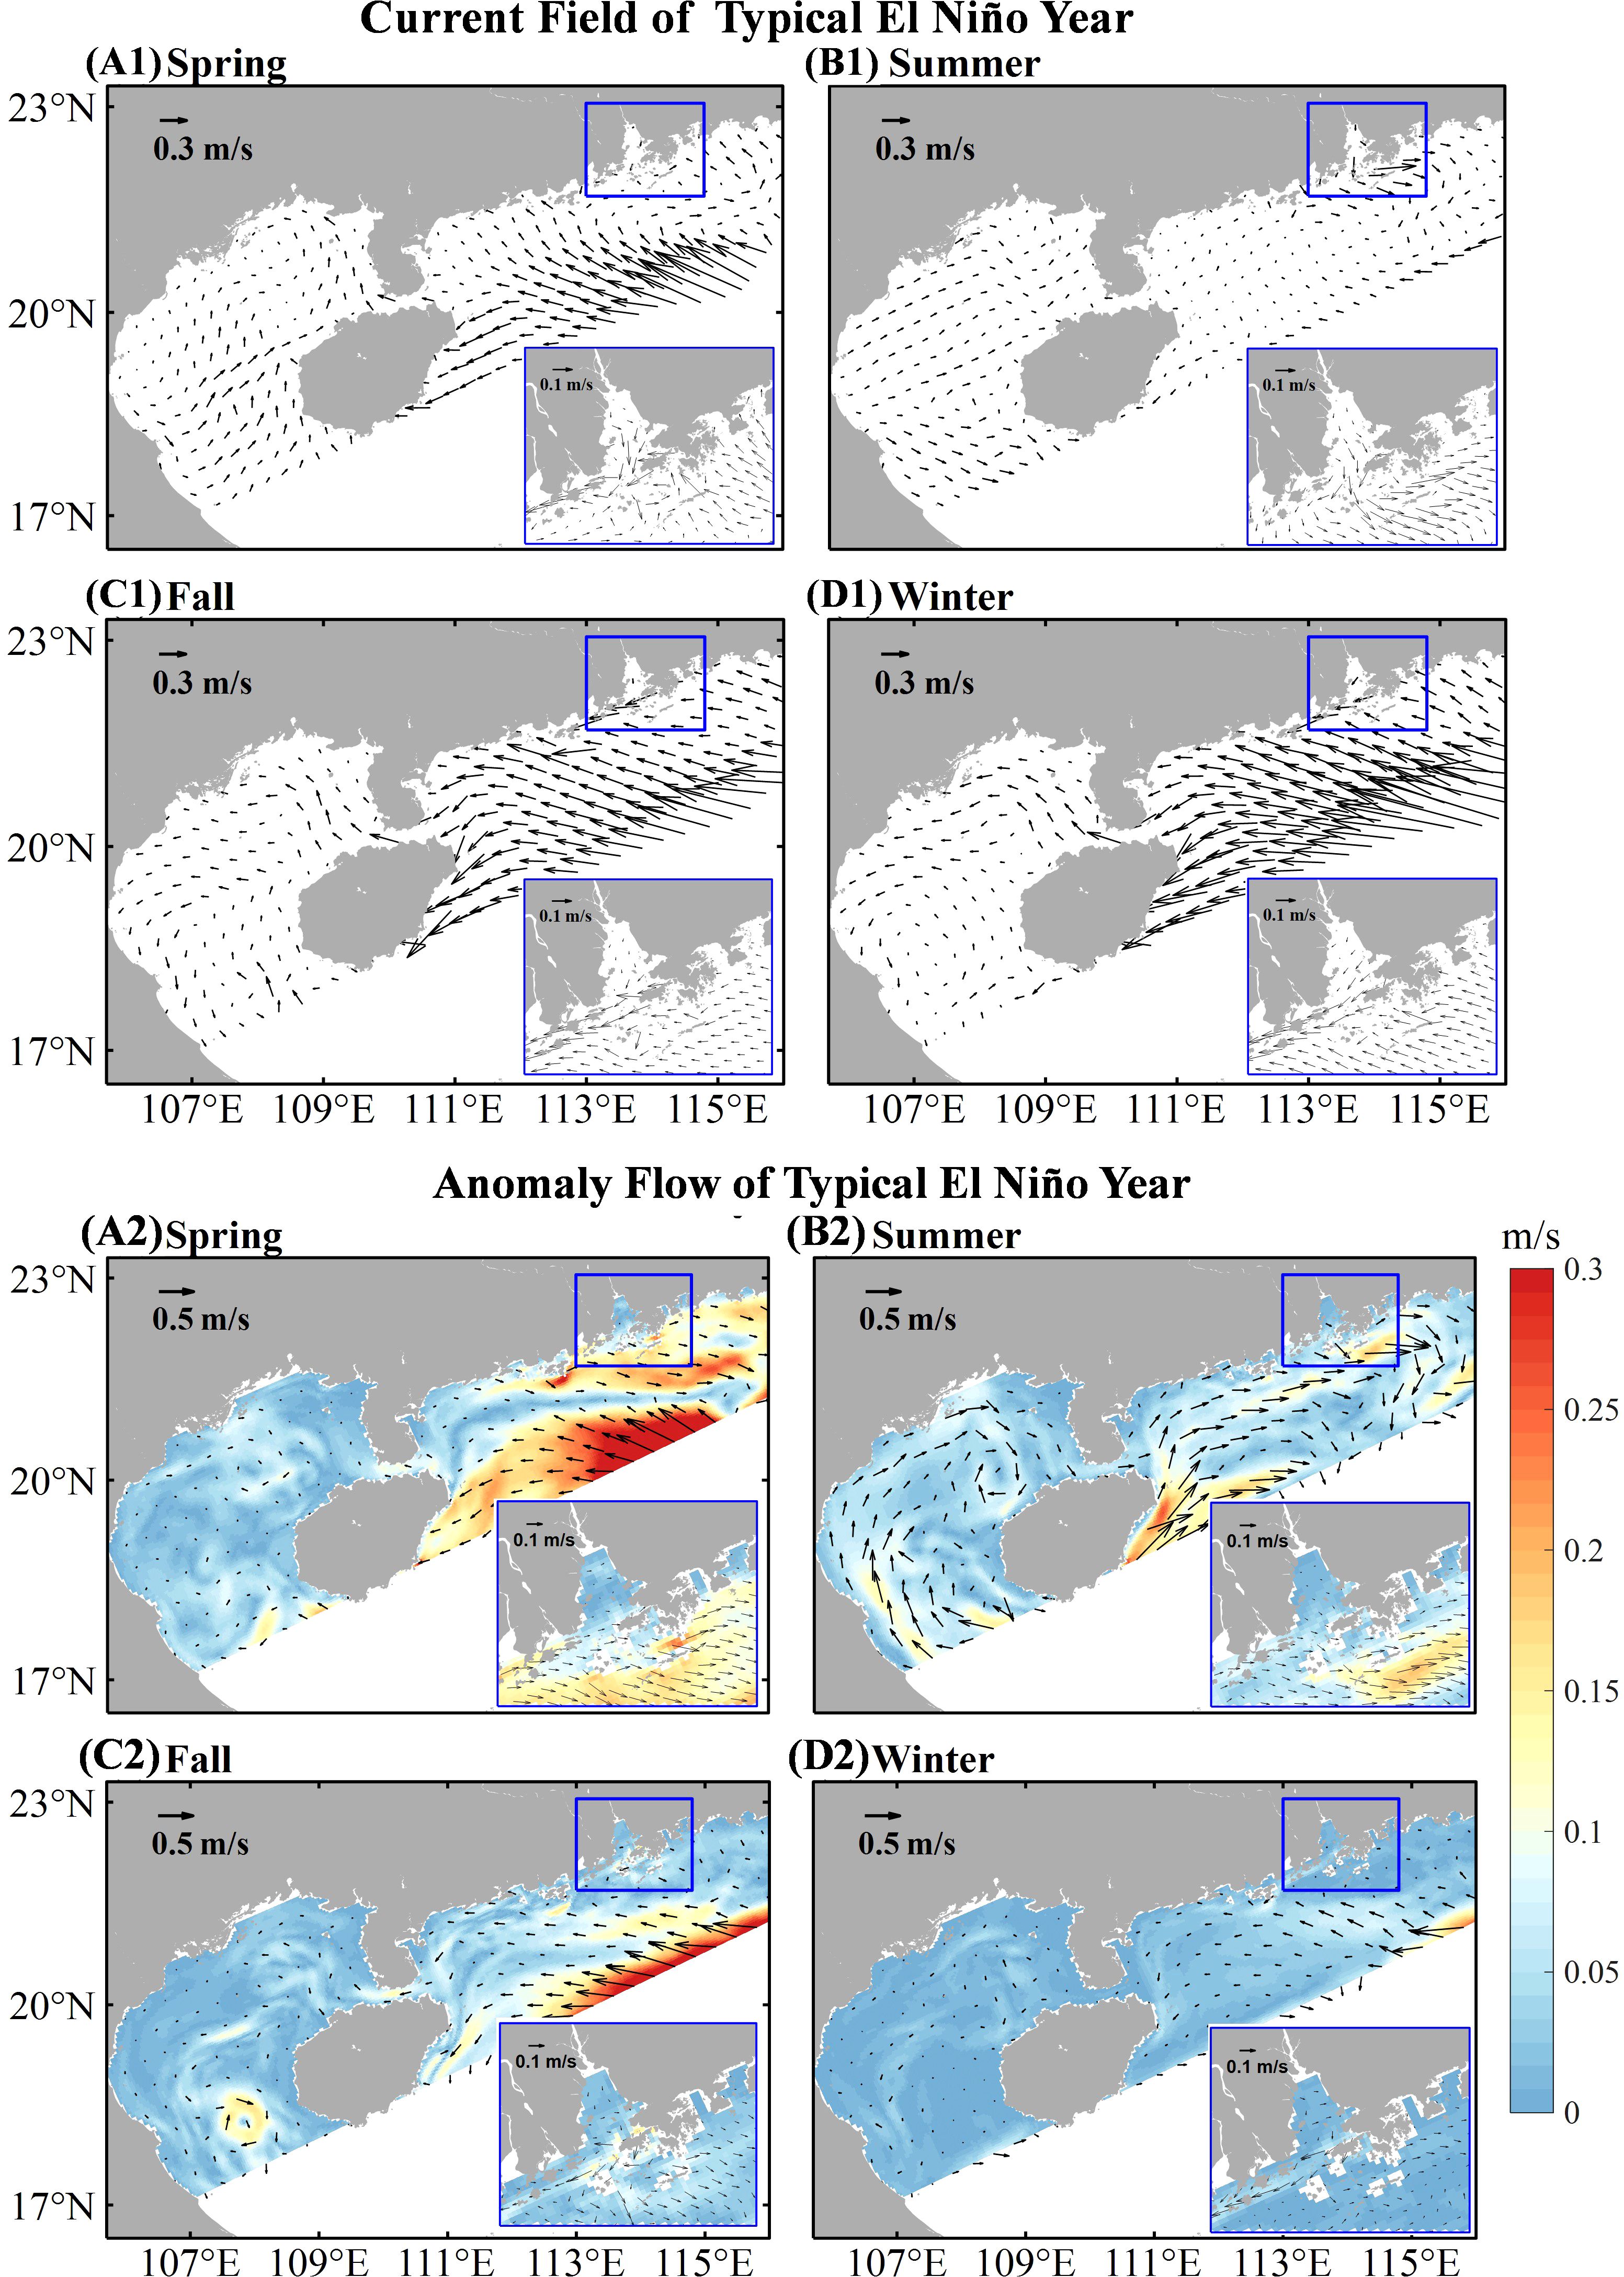
Figure 7. Same as Figure 6, but for the typical El Niño year (Mar. 2015 - Feb. 2016).
The circulation patterns on the NSCS shelf exhibit strong seasonal variability (Wang et al., 2009; Shu et al., 2018b), especially during the ENSO-neutral year (Figure 5). Within the PRE, the surface current field consistently flows seaward throughout the year due to gravitational circulation. Remarkably, the western component of the current during autumn and winter exceeds that of spring and summer. Along the west coastal area of Guangdong (Yuexi coastal zone), a westward current persists all year-round. The current became stronger and narrower in winter-autumn than spring-summer. On the continental shelf spanning the area from the east of Qiongzhou Strait to the west of PRE, a strong northwestward flow prevails during autumn and winter, weakening during spring and summer. In the Beibu Gulf, our ROMS simulation reveals a distinct Gulf-scale cyclonic circulation, which is consistent with Cheng et al. (2017) and Gao et al. (2017). During autumn and winter, an extensive an extensive anticlockwise circulation dominates the central region of the Beibu Gulf. In contrast, during spring and summer, the circulation becomes separated, with a clockwise pattern in the upper part and anticlockwise pattern in the lower part.
Additionally, we compared sea surface salinity data with the National Aeronautics and Space Administration (NASA) Soil Moisture Active Passive (SMAP) missions (https://data.remss.com/smap/SSS/V04.0/FINAL/L3/8day_running/). Both model simulations and satellite observations indicated that low salinity water accumulates along the west coast after exiting the Pearl River Estuary (PRE). The area of low salinity water was relatively small in spring and winter but increased during summer and fall. Furthermore, in summer, low salinity water spread in a southeasterly direction, with the extent of this spreading being greater during ENSO normal years, followed by La Niña and El Niño years.
Figure 6 illustrates the seasonal circulation patterns on the NSCS shelf during the selected La Niña year, as well as the anomaly in comparison to an ENSO-neutral year. Within the PRE, the western component of the gravitational circulation intensifies during the non-summer seasons while weakening in summer. Moreover, there is a pronounced weakening of the Yuexi coastal current, especially during the non-summer season. On the shelf between Qiongzhou Strait and Lingding Bay, a significant northwesterly current anomaly is pronounced, especially during the non-summer seasons. This anomaly can be attributed to the changes in atmospheric forcing, which considerably influence the expansion of the buoyant plume from the PRE, as well as the land - slope currents associated with the intrusion of the Kuroshio in the Luzon Strait (Deng et al., 2022).
In comparison to ENSO-neutral years, El Niño years display greater gravitational circulation within the PRE, characterized by a prominent eastward anomaly (Figure 7). During summer, the Yuexi coastal flow experiences weakening, whereas in winter and autumn, it strengthens (Figures 7A2-D2). The pattern is influenced by the inter-annual variability of atmospheric forcing and the South China Sea Warm Current (Liu et al., 2020). Furthermore, in contrast to ENSO-neutral years, the counterclockwise circulation observed in the Beibu Gulf region weakens during spring and strengthens during winter, ultimately assuming a counterclockwise pattern during summer.
The transport of floating litter is primarily influenced by the seasonal currents. After entering the PRE, the majority of the floating litter aggregates on the western side of the estuary, which may be attributed to the Coriolis force and the trapping effect of the semi-enclosed topography (Li et al., 2018). After entering the PRE, the majority of litter aggregates on the estuary’s western side due to the Coriolis force. Subsequently, as it passes through Modaomen, floating litter tends to distribute along the 30 m isobath. During summer, when the Pearl River runoff increases and the PRE gravity circulation strengthens, the transport velocity of floating litter is significantly higher compared to the non-summer seasons. Particles leave the Lingding Bay as early as day 5, approximately 5 days earlier than during non-summer seasons. Similarly, the propagation time for floating litter from Yuedong to Qiongzhou Strait is relatively short in summer compared to other seasons. After crossing the Qiongzhou Strait, floating litter propagates along the 25 - 50 m isobath in the Beibu Gulf during spring and summer. Notably, in summer, the dispersal area is considerably smaller compared to spring, possibly due to the weakening of cyclonic circulation in the northern part of the Beibu Gulf. In autumn and winter, the Beibu Gulf is predominantly affected by a single anticlockwise cyclone, causing particles to flow directly westward rather than along the 20 - 50 m isobath around the Beibu Gulf. The spreading area of floating debris is widest during winter, which may be attributed to the strong water exchange during this period (Cui et al., 2024a). These findings align with those of consistent Gu et al. (2024), who observed that surface floats in the PRE and its surrounding waters predominantly drifted in a southwesterly direction during the fall and winter. Overall, in the ENSO-neutral year, the spread of marine floating litter during spring and summer covered approximately 290 km, significantly higher than in autumn - winter (180 - 220 km, Table 2), with a mean distance of about 247 km. The relatively longer travel distances of marine floating litters are consistent with the findings of Liu et al. (2023), who simulated the seasonal transport of microplastic by releasing particles from all major river systems along the Chinese coastal ocean. They found that the travel distance in summer was greater than in winter for the Pearl River Estuarine and Coastal Oceans. Additionally, the proportion of floating litter in the PRE during summer accounted for around 65%, significantly lower than during non-summer seasons (78% - 97%) (Table 1).
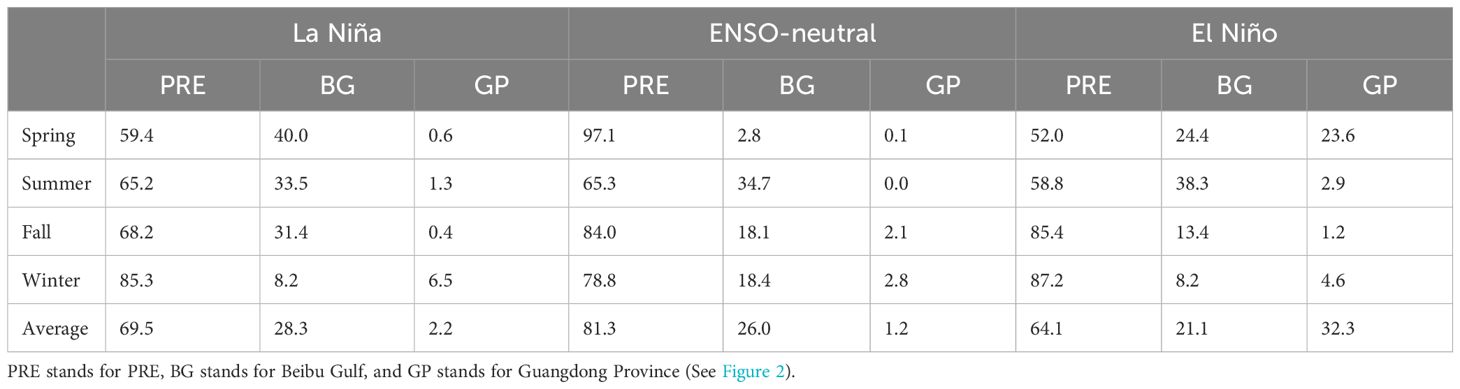
Table 1. Comparisons on Floating litter content ratio (%) at the subregions of NSCS.
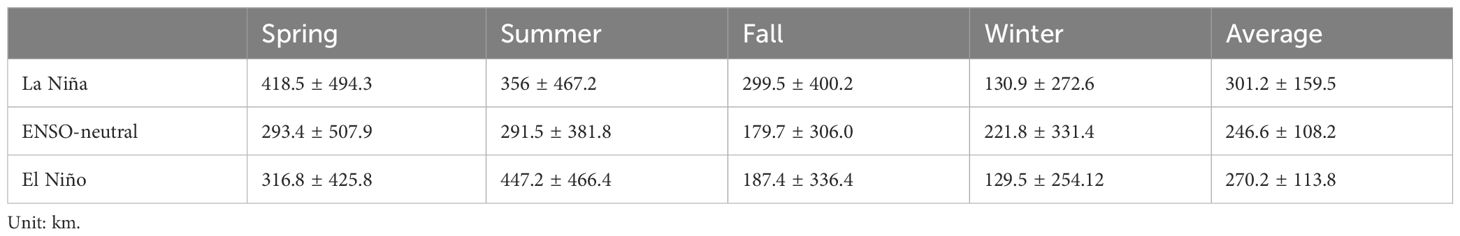
Table 2. The seasonal transport distance of floating litter after releasing from PRE during the typical ENSO-neutral, La Niña, and El Niño.
During the La Niña years, the general trajectory pattern of floating litter was similar to that of the ENSO-neutral years. After being released from the PRE, the floating litter follows the western coast of Guangdong along the 50 m isobath towards the Qiongzhou Strait. Subsequently, it moves in conjunction with the counterclockwise circulation of the Beibu Gulf until it exits the modeling domain through the Beibu Gulf (Figure 8). During the La Niña years, the reduced river runoff in summer results in a weakening of gravitational circulation in the PRE (Figures 2, 6). Consequently, the time taken for particles to leave the PRE is significantly longer (~ 5 days) compared to normal years. The occurrence of a westward current anomaly during non-summer months considerably shortens the transport time of floating litter to the Beibu Gulf. Additionally, compared to ENSO-neutral years, the spreading area and transport distance of particles increases significantly after entering the Beibu Gulf from the Qiongzhou Strait in La Niña years. In the four seasons of the 2011 La Niña year, the transport distances range from 130 - 420 km, with an average of 301 km (Table 2). In comparison, during the four seasons of the 2012 ENSO-neutral year, the transport distance increases to 179 - 294 km, with an average of 246 km, as shown in Table 2. Moreover, floating debris can reach the west coast of Laos within 3 months (Figure 9).
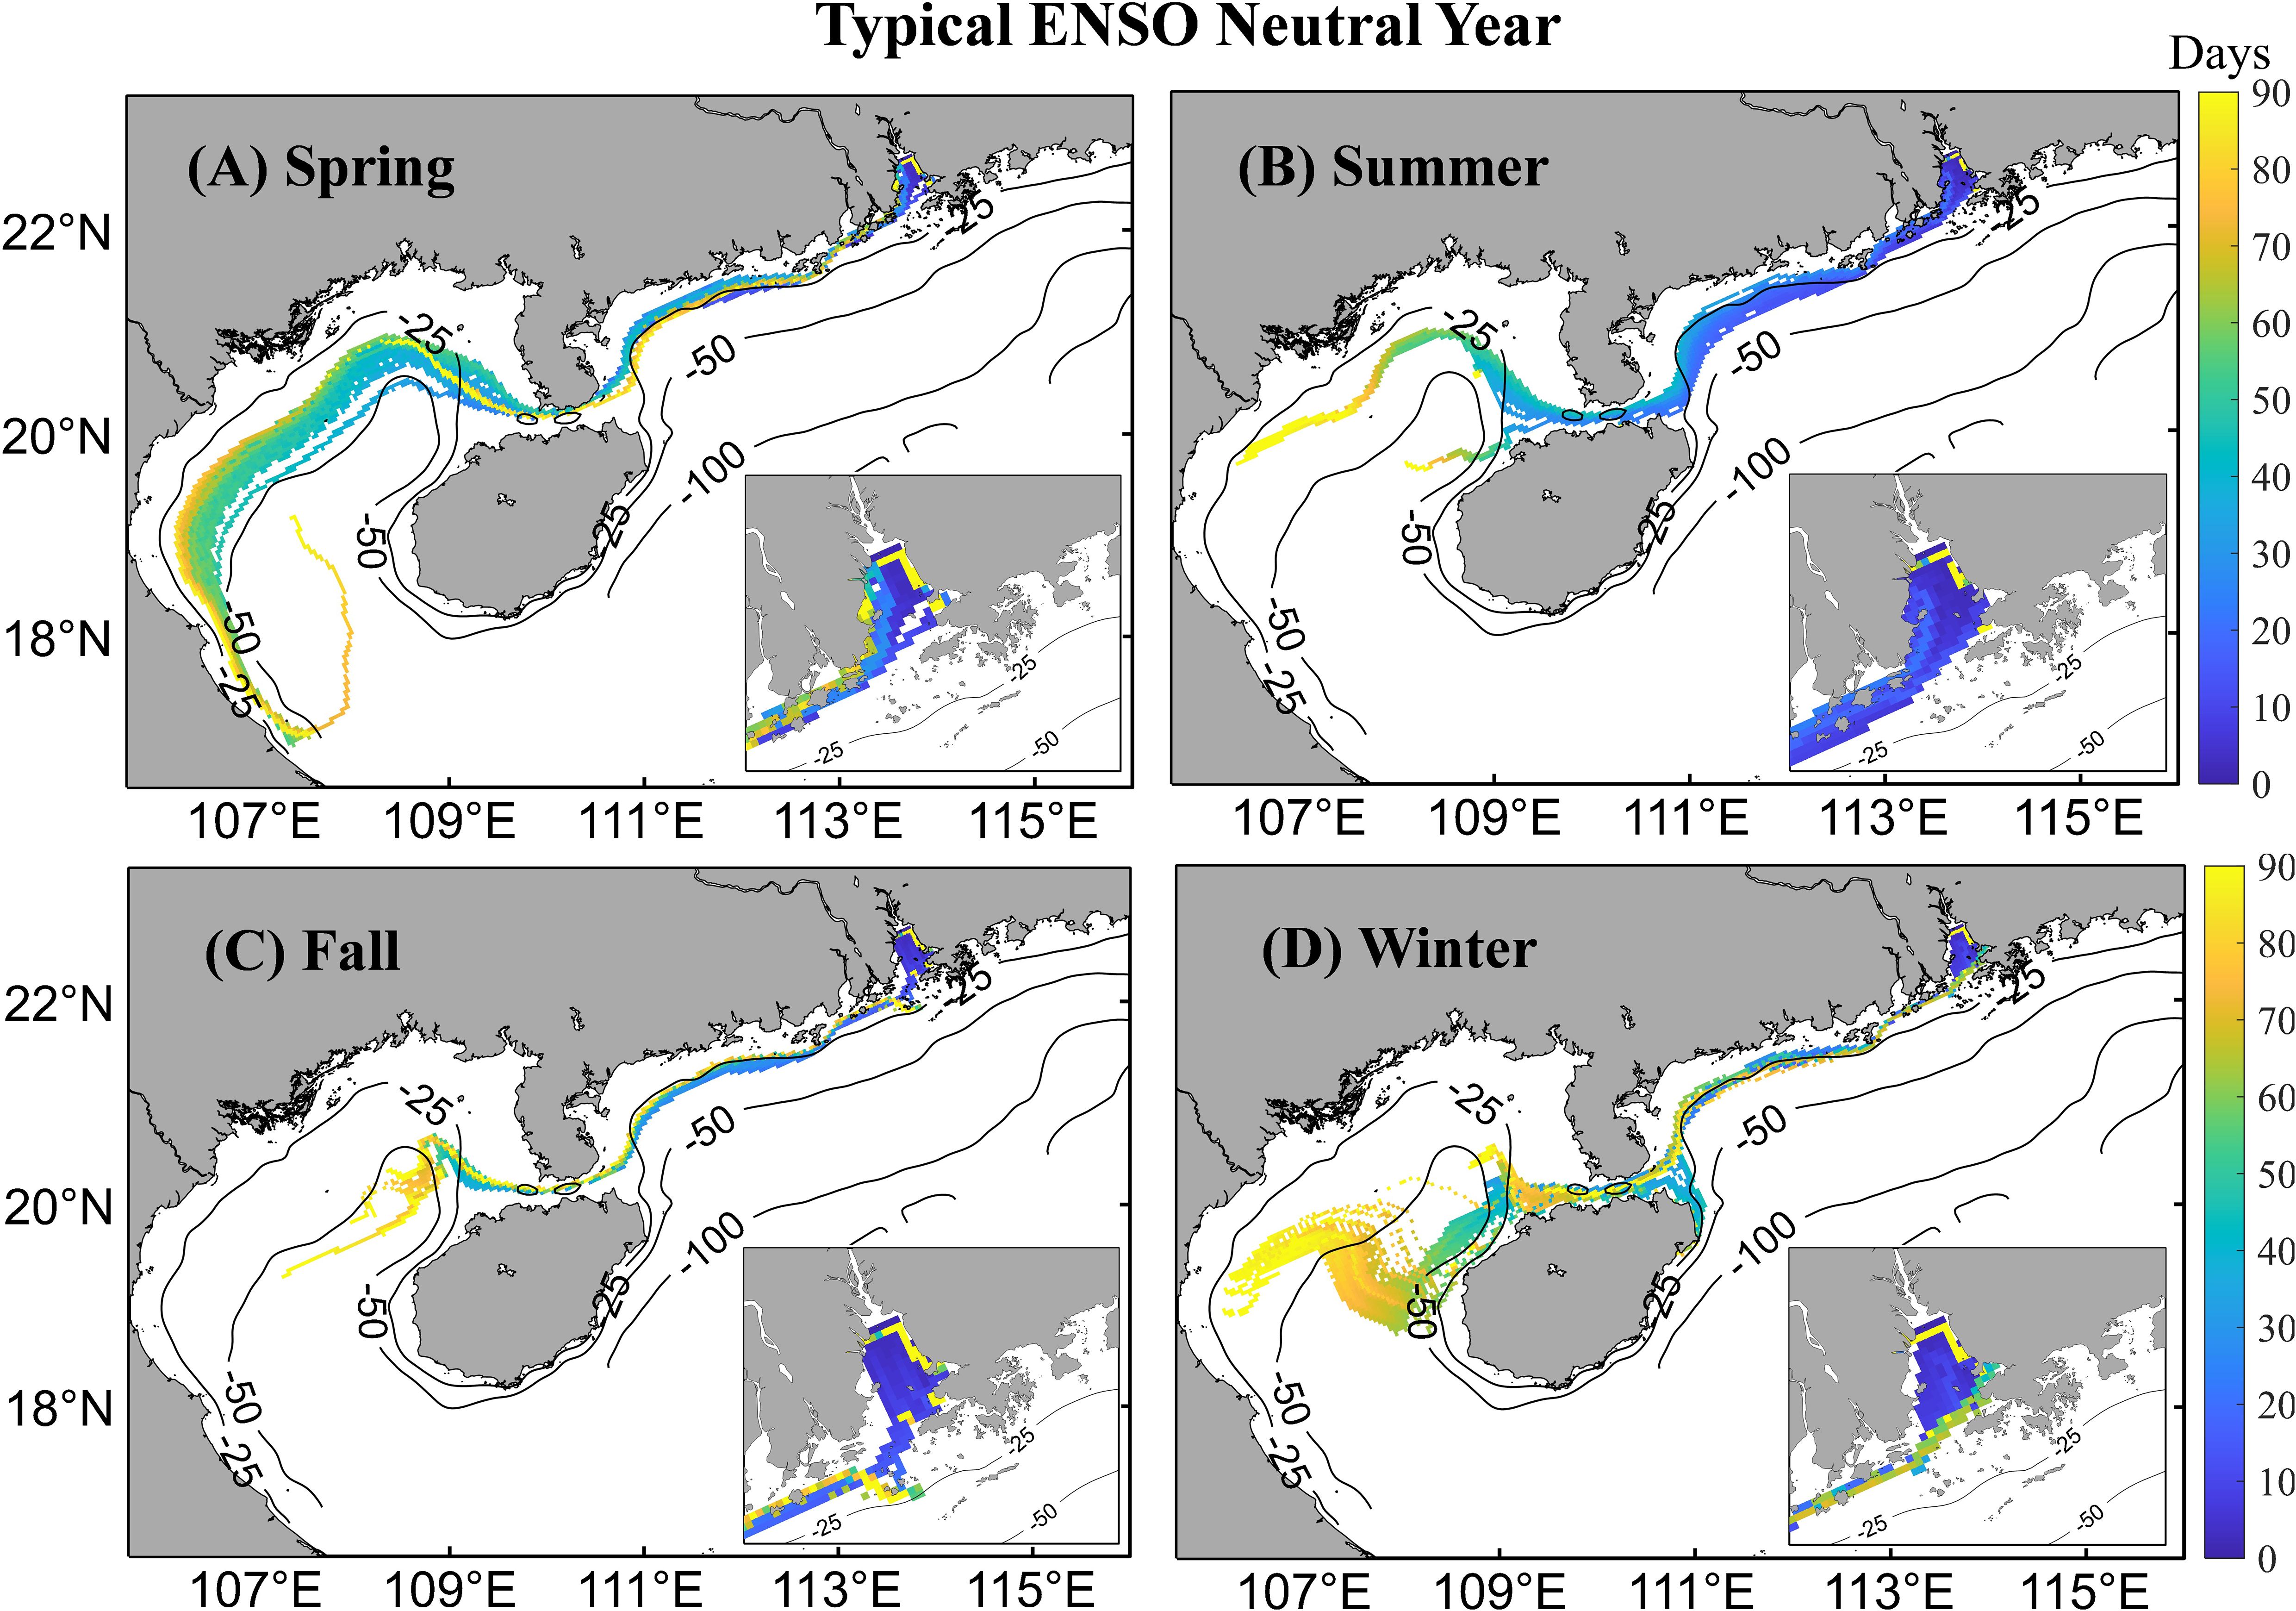
Figure 8. Changes in the location of floating litter plastics during the ENSO-neutral year (Mar. 2012 - Feb. 2013): (A) Spring (Mar. 2012 - May. 2012); (B) Summer (Jun. 2012 - Aug. 2012); (C) Fall (Sep. 2012 - Nov. 2012); (D) Winter (Dec. 2012 - Feb. 2013).
During El Niño years, the Yuexi coastal current experiences weakening in both spring and summer (Figures 7A2, B2), which consequently delays the arrival of floating litter at the Qiongzhou Strait by about 20 - 30 days compared to ENSO-neutral years (Figure 10). Additionally, there is a notable reduction in the dispersal area. However, in winter, the strengthening of the westward current significantly shortens the transport time for particle to reach the Qiongzhou Strait (Figure 10D). In summer, as the circulation in the Beibu Gulf switched from anticlockwise to clockwise (Figure 7), the particle trajectory within the Gulf shifts further southward compared to the ENSO-neutral years (Figure 8). Nevertheless, both the transport distance and diffusion area increase, ultimately reaching the west coast of Laos (Figure 10B). In contrast, the transport distance of particles after entering the Beibu Gulf from the Qiongzhou Strait is considerably lower during non-summer seasons compared to the La Niña years (Figure 9). Overall, the transport distance of seafloating litter during El Niño years is roughly 270 km, which is higher than that of the ENSO-neutral years by about 246 km, but significantly lower than that of the La Niña years by about 301 km (Table 2). It is worth noting that the proportion of floating litter that remains in the coastal area of Guangdong Province was 32%, which is higher than in ENSO-neutral and La Niña years (2%, Table 1). this aligns with the reduction of western coastal flow in spring and summer (Deng et al., 2022; Figure 7).
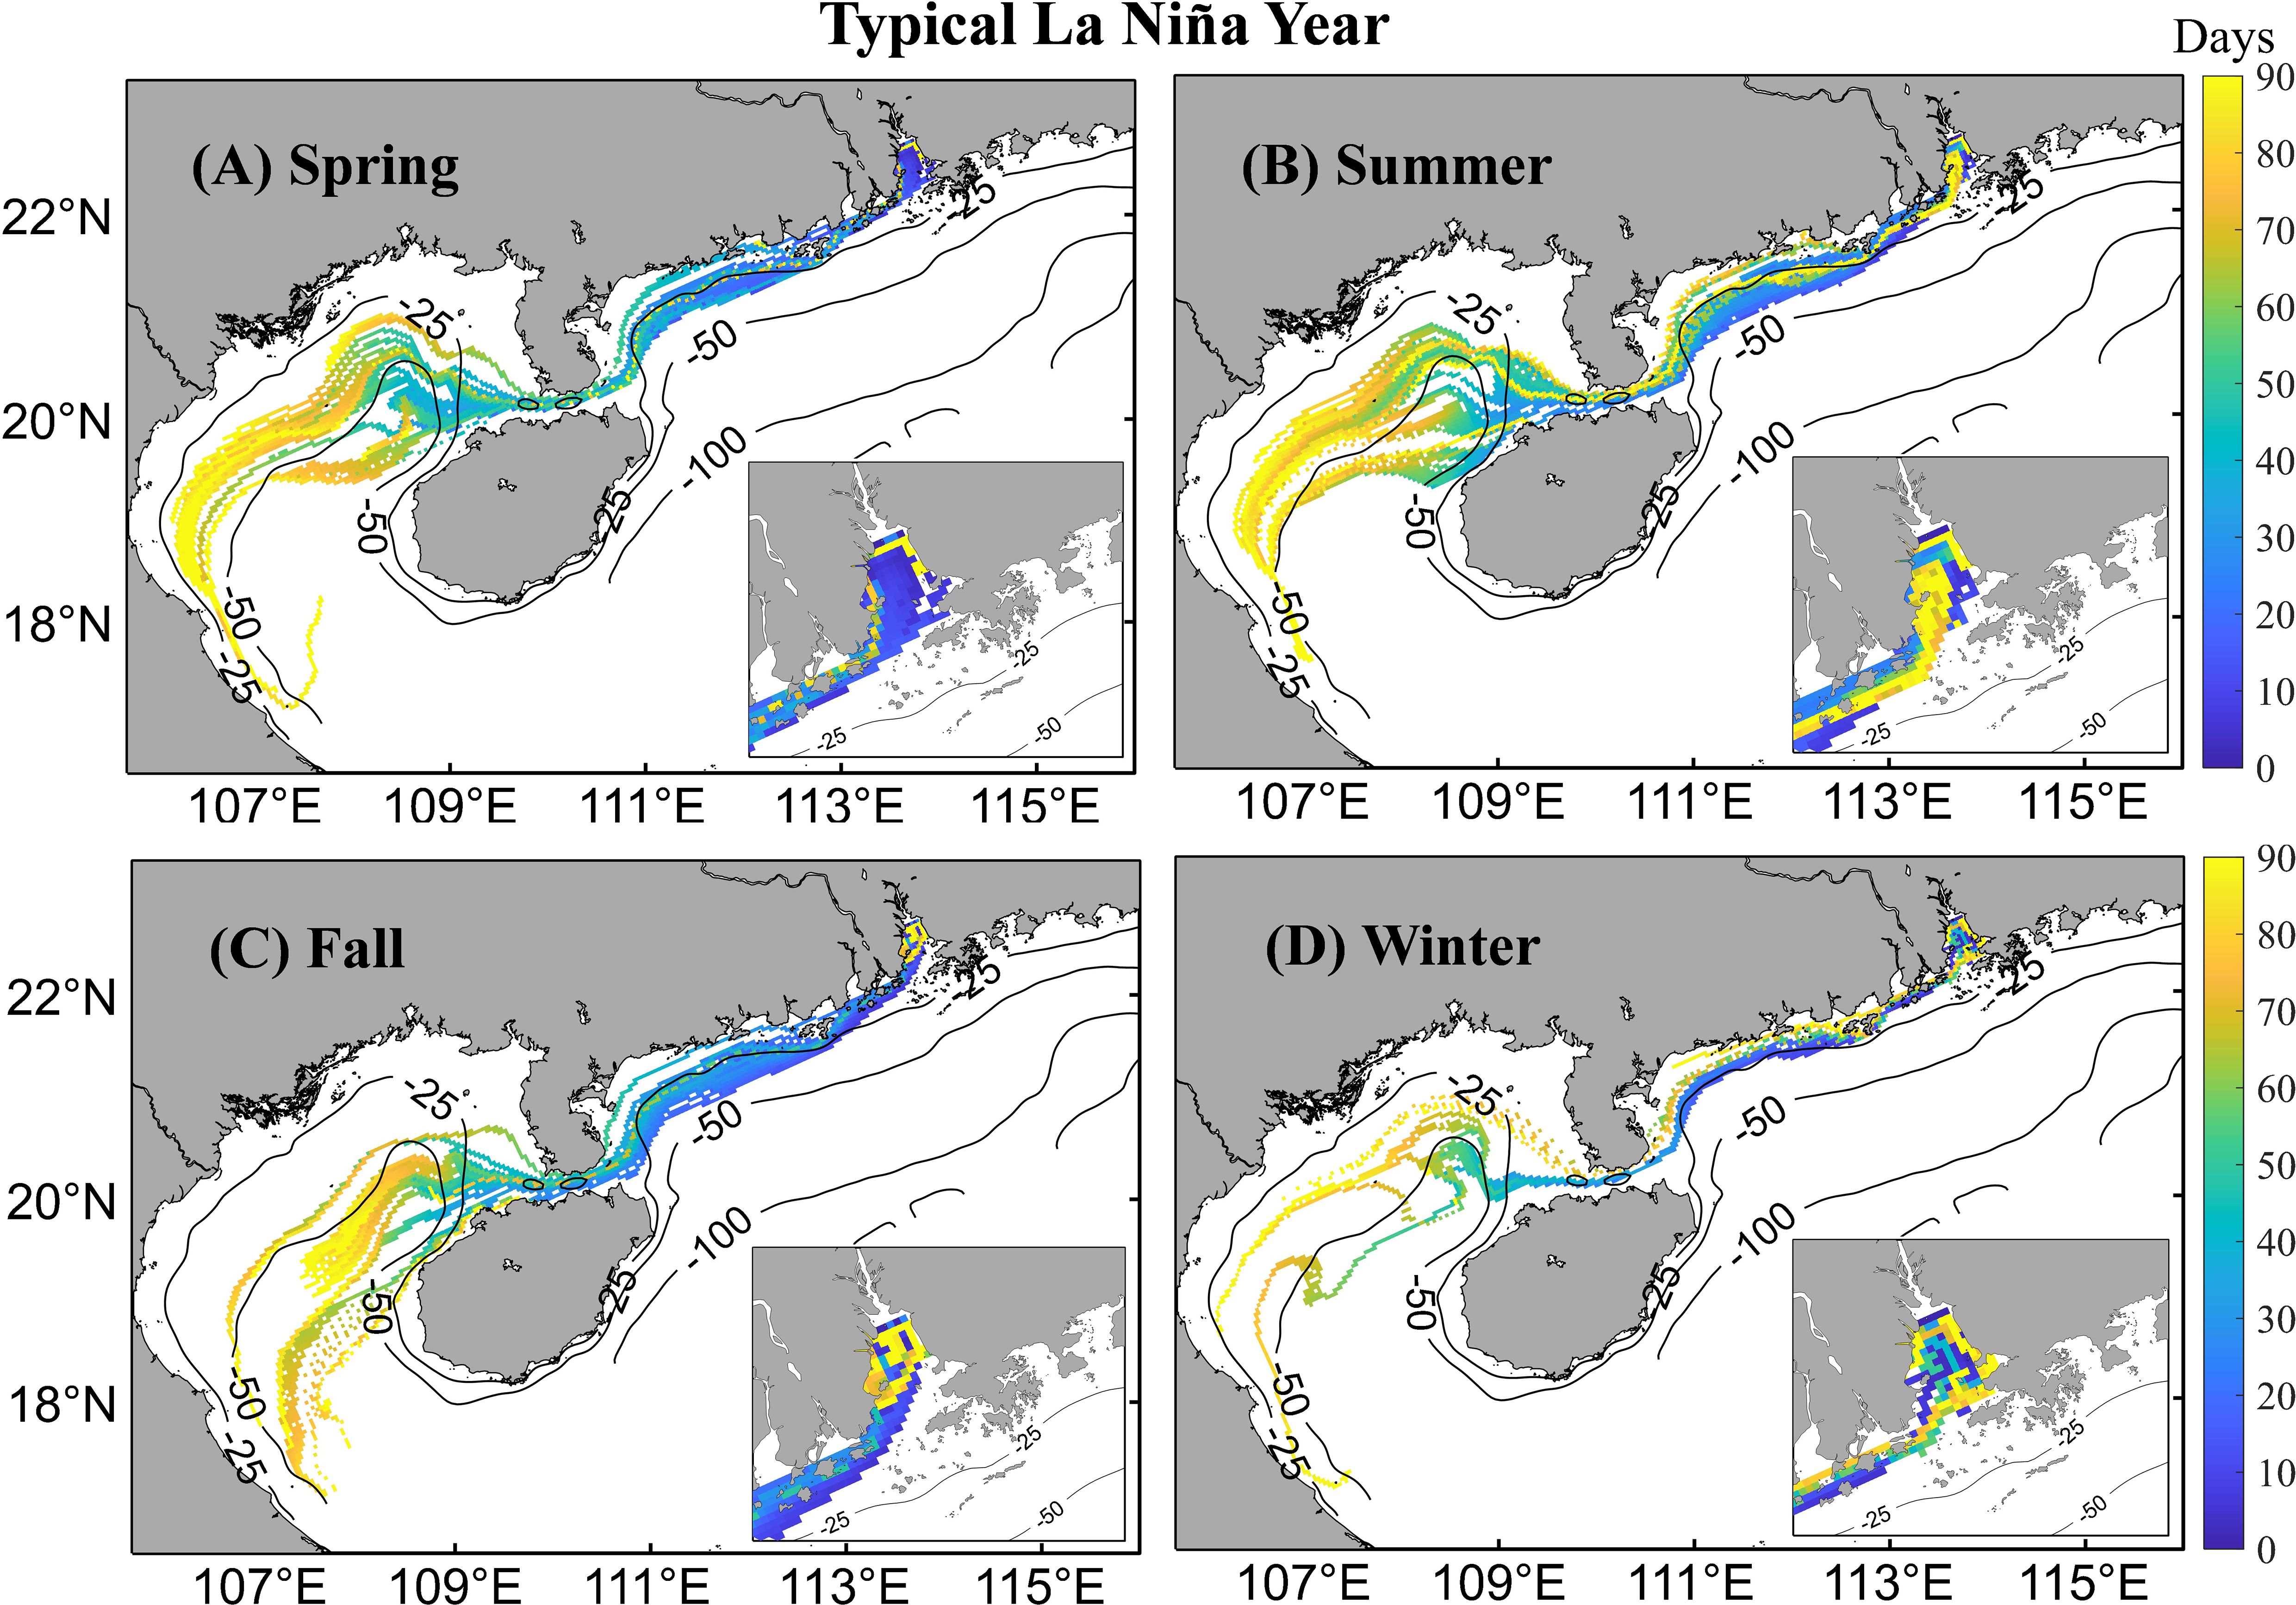
Figure 9. Same as Figure 8, but for the La Niña year (Mar. 2011 - Feb. 2012).
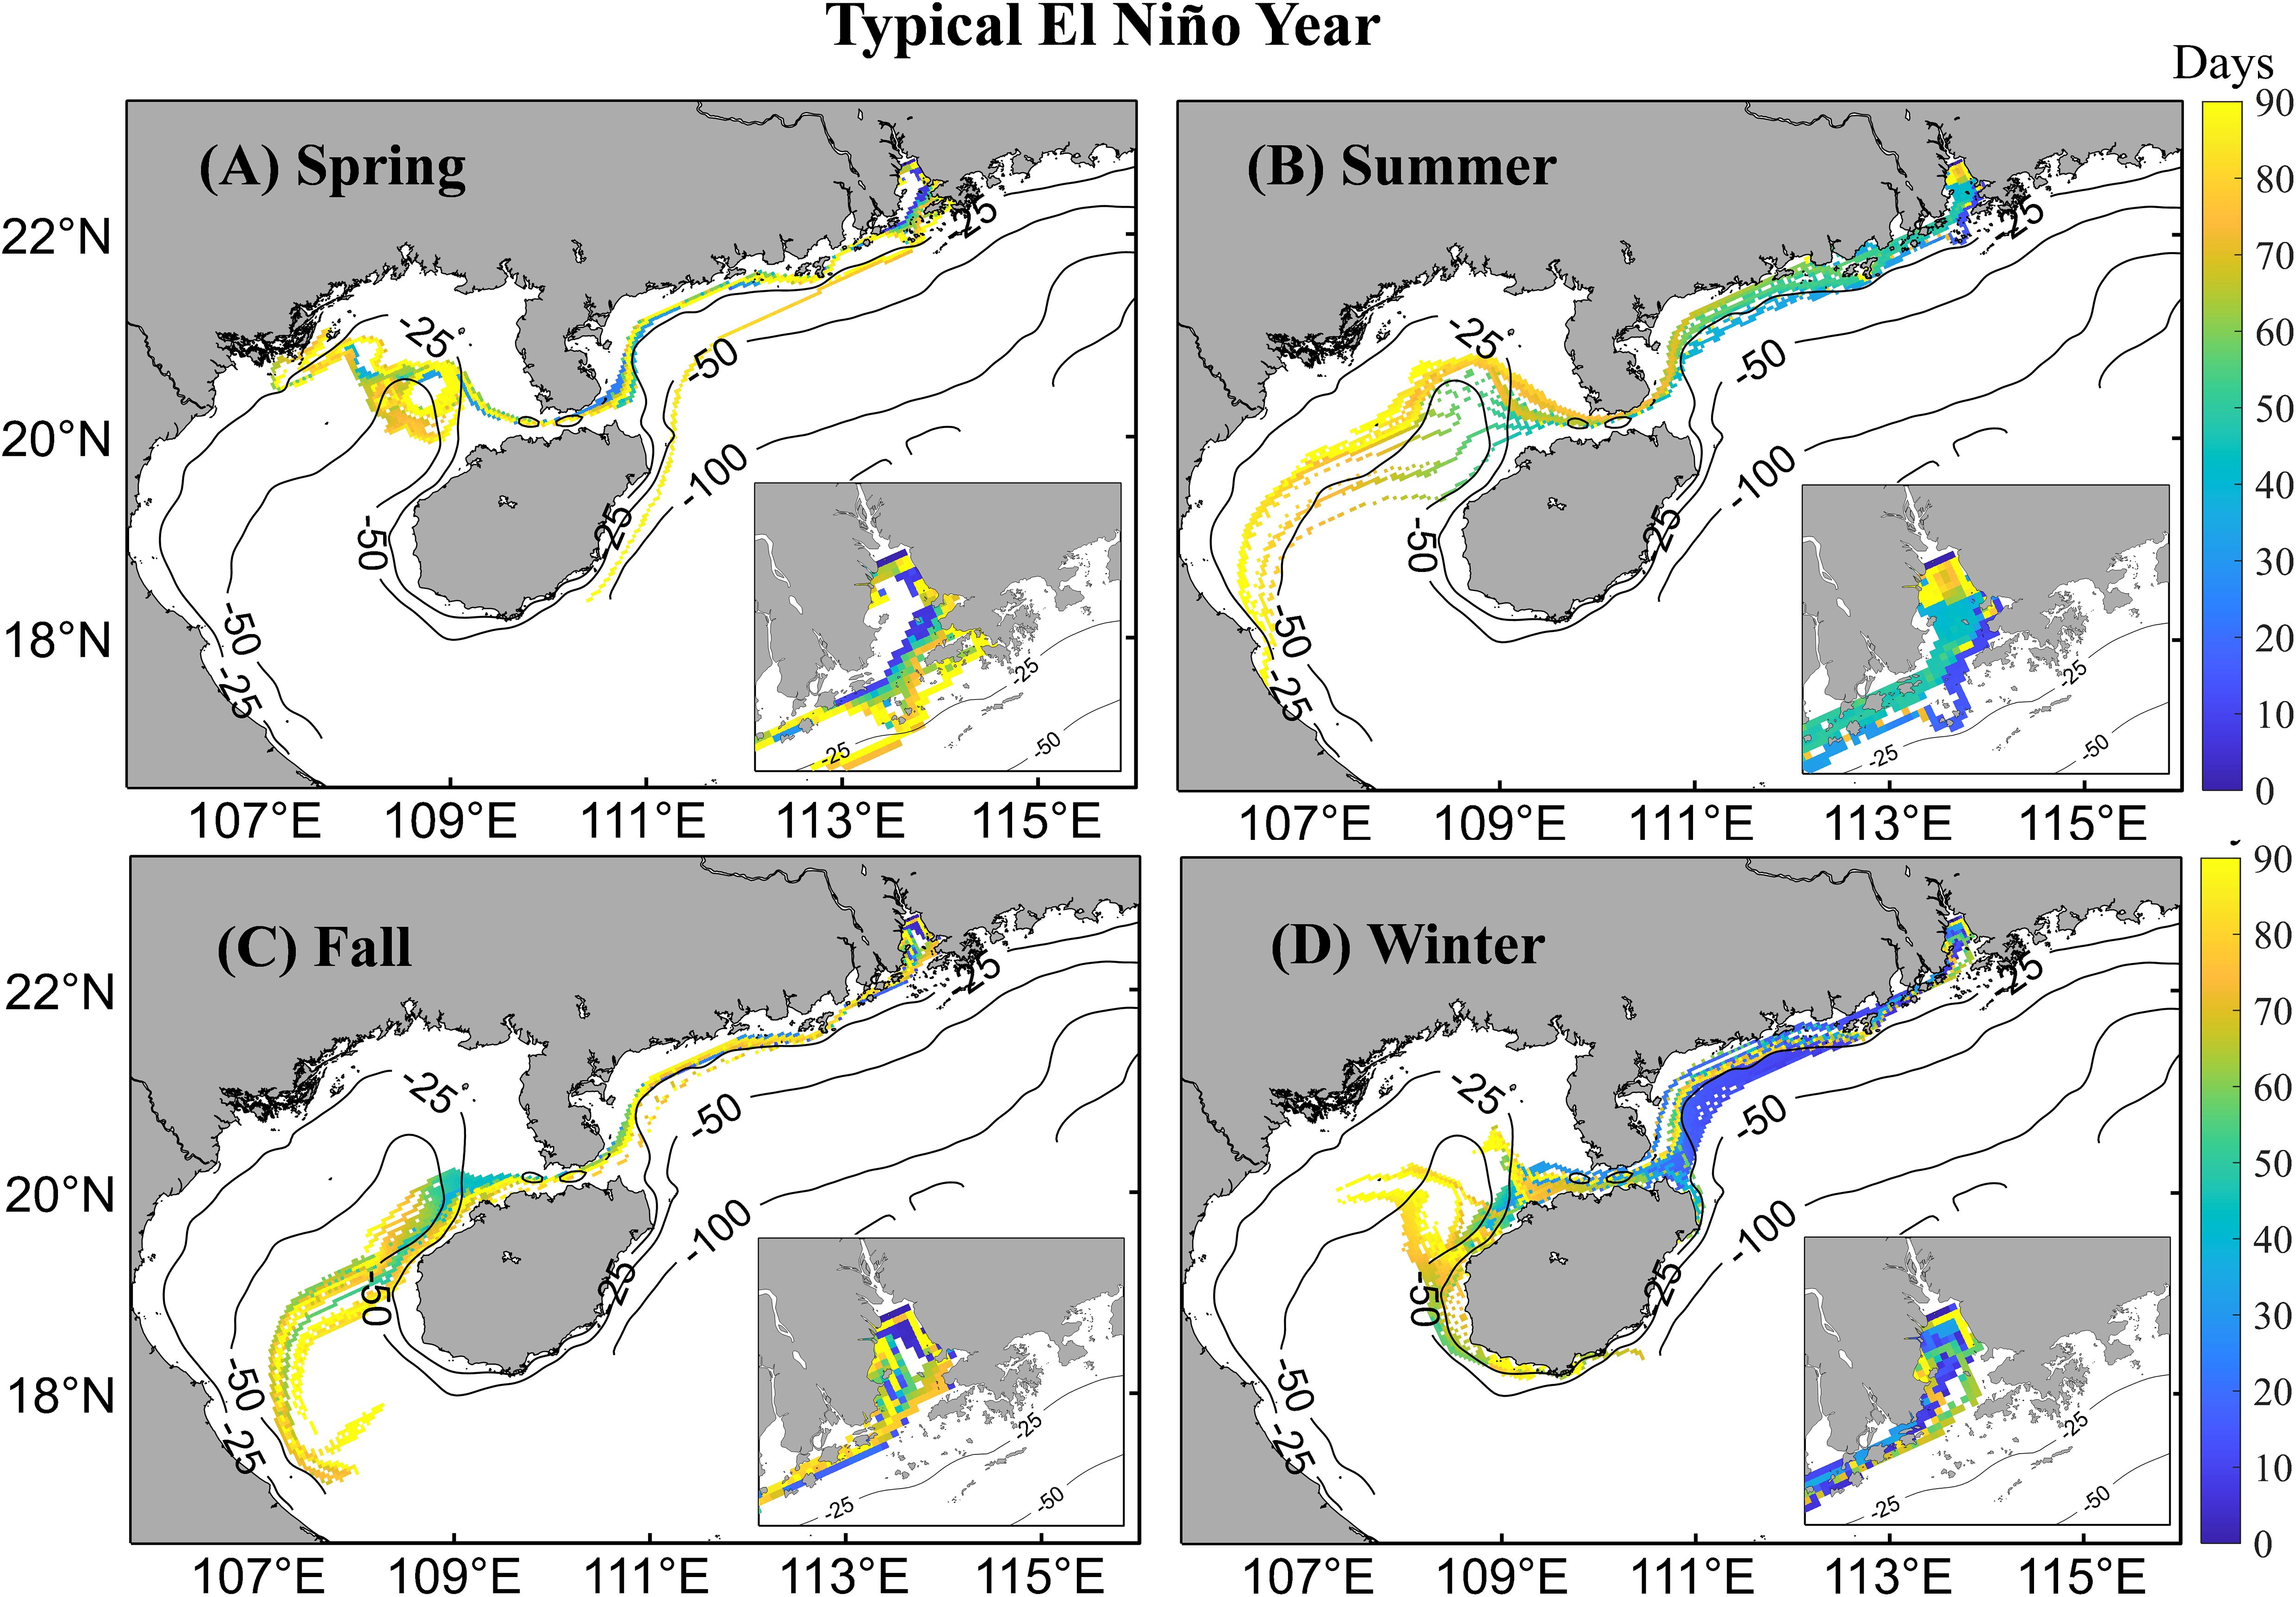
Figure 10. Same as Figure 8, but for the El Niño year (Mar. 2015 - Feb. 2016).
Several studies have shown shorelines may be a major sink for plastics in coastal waters (Thornton and Jackson, 1998; Thiel et al., 2013). we therefore next described the distribution of floating litter particles that accumulated in shoreline units, referred to as “strandings” (Figures 11–13). Our simulated results (Figures 11–13) indicate that a substantial amount of floating litter is likely to strand on the left side of Lingding Bay and to the east of Hainan Island, which is consistent with the findings of Cai et al. (2022).
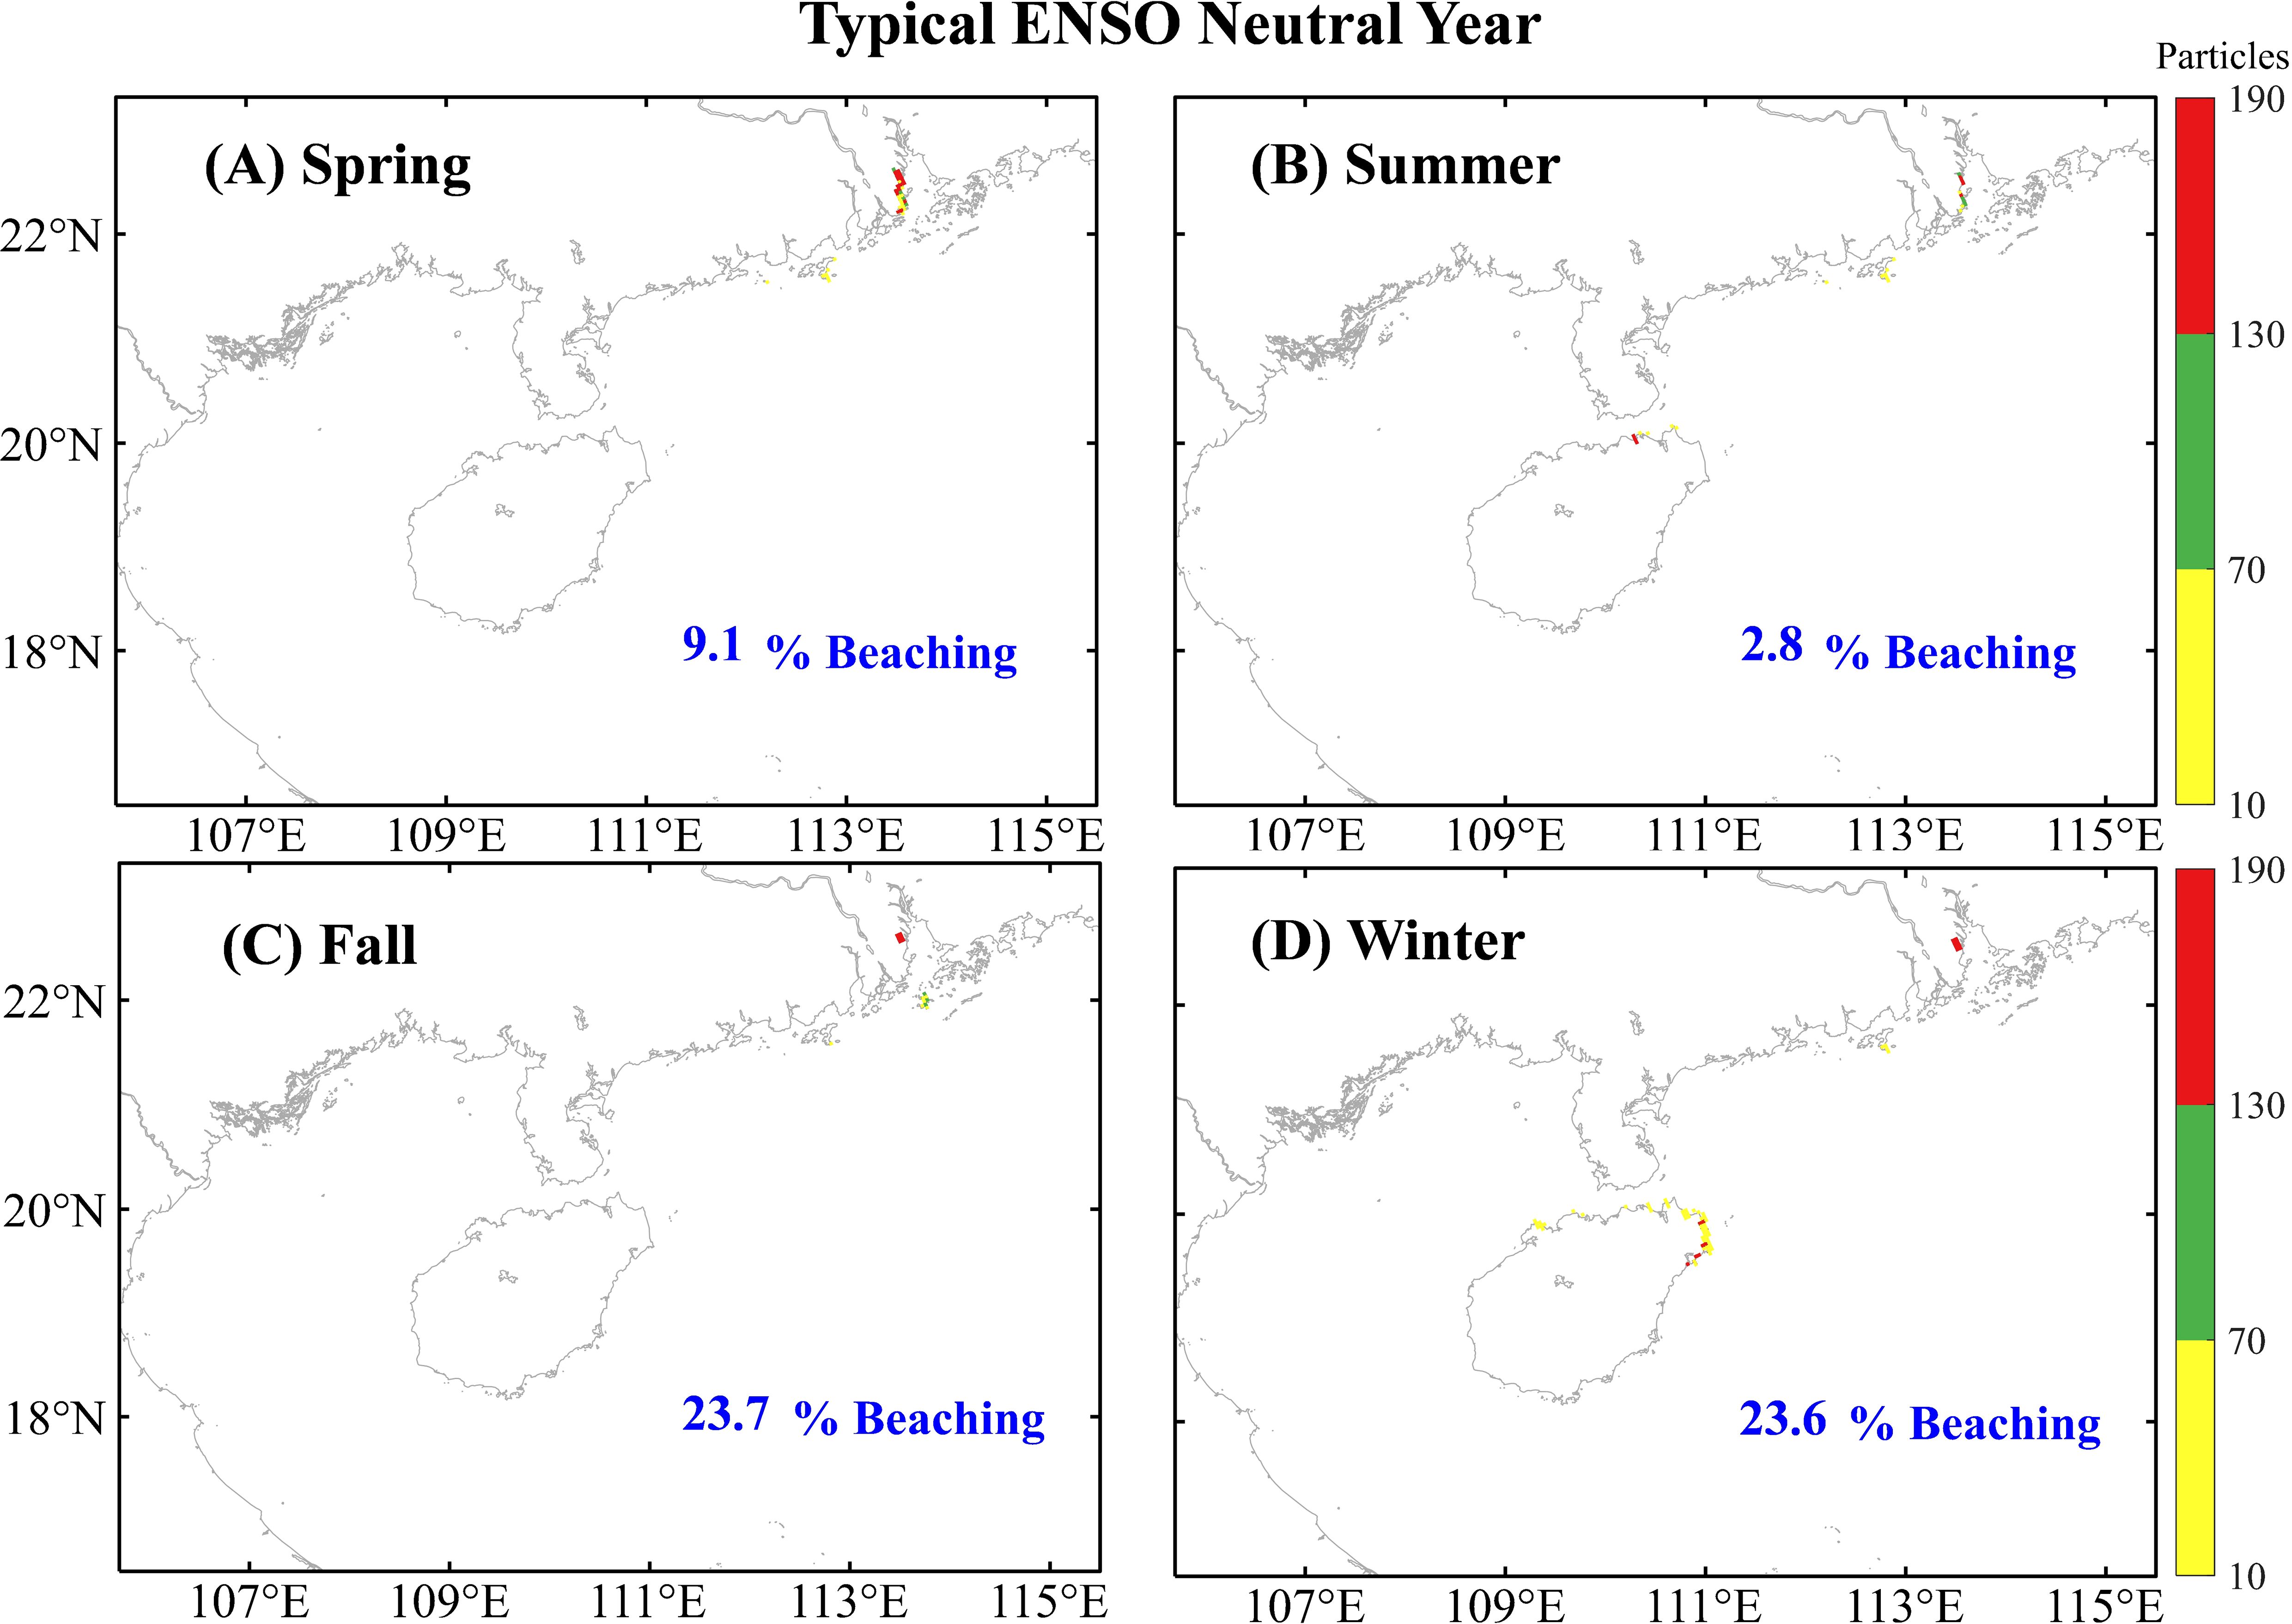
Figure 11. Number of beached floating litter particles (count) in the (A) Spring (Mar-May); (B) Summer (Jun-Aug); (C) Fall (Sep - Nov); (D) Winter (Dec-Feb) during the ENSO-neutral year (Mar. 2012 - Feb. 2013).
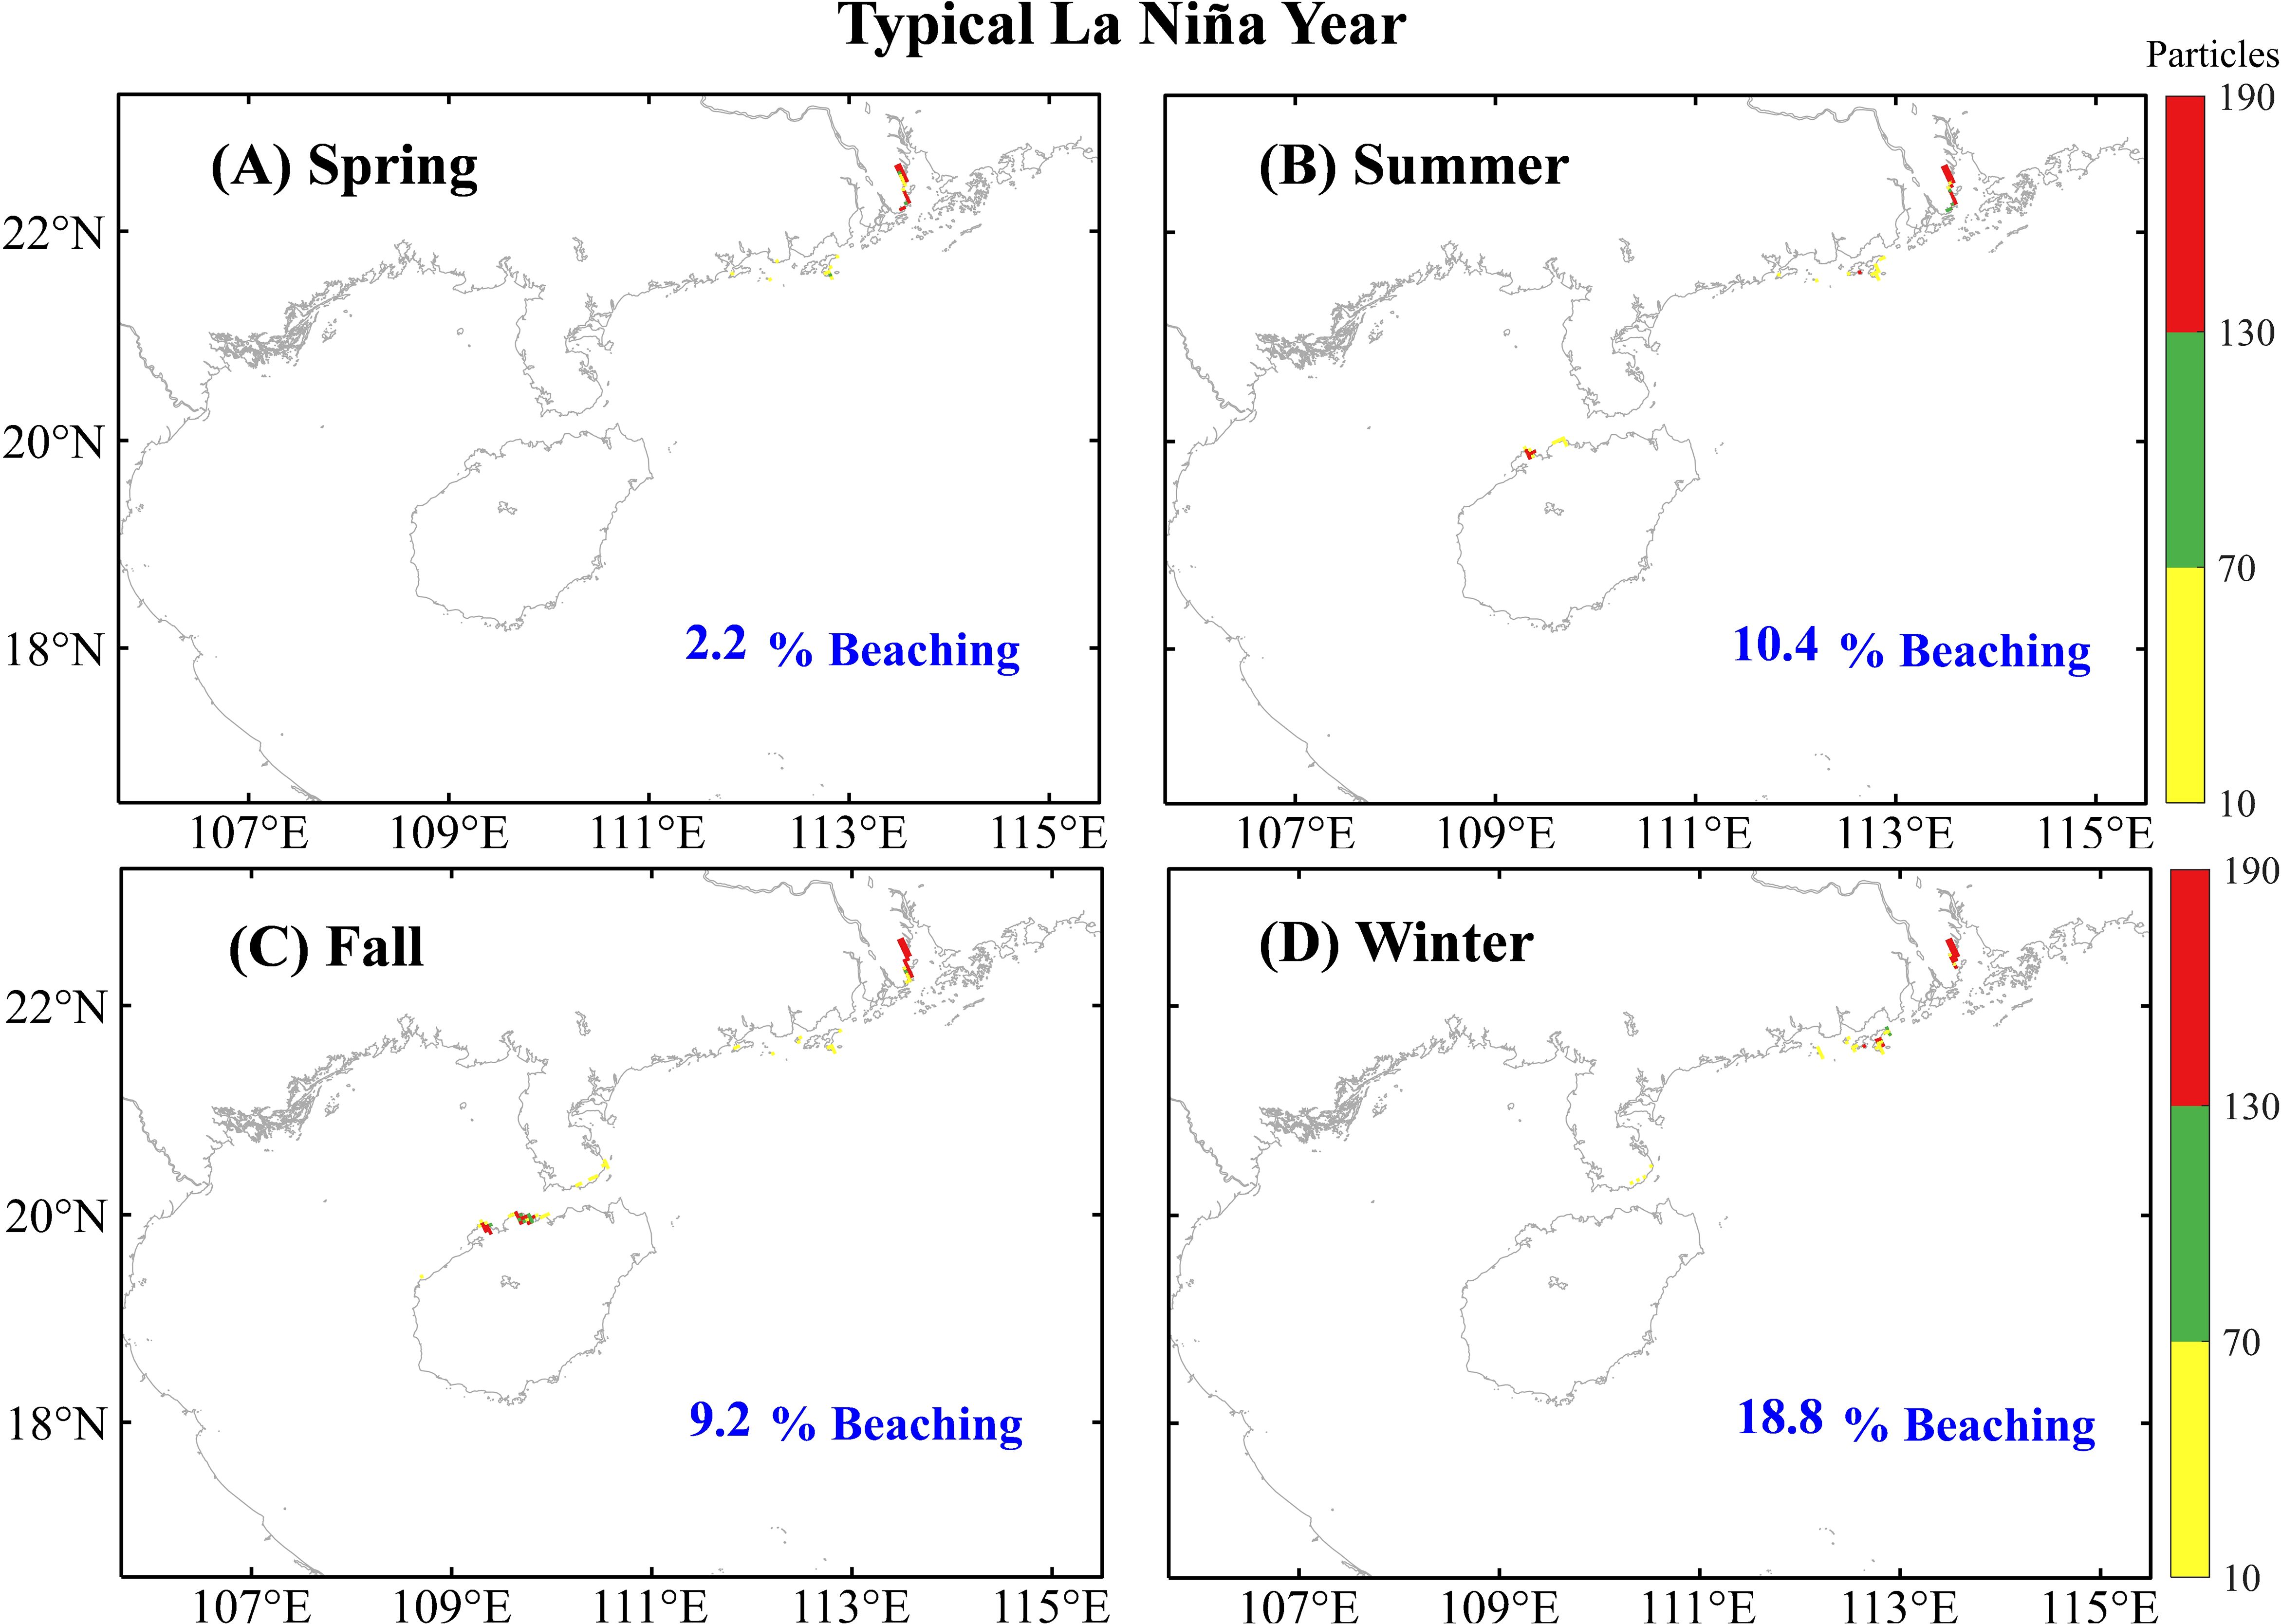
Figure 12. Same as Figure 11 but for the La Niña year (Mar. 2011 - Feb. 2012).

Figure 13. Same as Figure 12, but for the El Niño year (Mar. 2015 - Feb. 2016).
During the ENSO-neutral years, the majority of floating litter tends to strand in Zhongshan and Zhuhai City, located in Guangdong Province (Figure 11). This occurrence can be attributed to the movement of the Pearl River Plume, which under the influence of Coriolis force, takes the litter towards the right bank after exiting the river mouth. During the summer months, the increased runoff (Figure 4) from the Pearl River results in most of the floating litter being flushed out of the Estuary (Figure 11B). Consequently, the stranding rate during summer is substantially lower, at approximately ~ 3%, compared to autumn and winter, which experience rates exceeding 23%. In winter, the northeast wind field prompts the Ekman effect, causing onshore transport of surface currents and the accumulation and sinking of the upper layer of seawater along the coastline (Figure 11D). This creates a downwelling effect along the east coast of Hainan Island and Guangdong Province, leading to a higher stranding rate for floating debris in winter (Wang et al., 2011; Shu et al., 2018b). This phenomenon is consistent with the findings of Gu et al. (2024), who reported that over 50% of surface floating objects released from the PRE during the autumn and winter months became stranded on Hainan Island.
During La Niña years, the strengthening of abnormal westerly currents results in a decrease in the proportion of floating debris. The average stranding rate for the four seasons in 2011 was 10.2%, which is 4.6% lower than in 2012. The most significant decrease in stranding rates occurred during autumn, experiencing a decline of 14.5%, which can be attributed to the strong westerly anomaly observed during the La Niña year (Figure 6). Interestingly, in the summer, the stranding rate of floating debris did not decrease but instead increased by 7.52% compared to the ENSO-neutral year. Most of the debris stranded in the western coastal areas of Lingding Bay and Qiongzhou Strait (Figure 12B). This increase can be attributed to the notable reduction in Pearl River runoff during the summer of La Niña (Figure 4), resulting in fewer amount of floating litter being carried by the river plume during this period.
The stranding rate of floating debris during a typical El Niño year averaged at 15.8%, which is comparable to the rate observed during ENSO-neutral year. In spring, the floating litter primarily ends up on the west coast of the PRE in the El Niño scenario (Figure 13A). However, due to the easterly current anomaly, a large part of the floating litter is carried to Hong Kong, ultimately resulting in its accumulation along the west coast of Hong Kong (Fok and Cheung, 2015; Zhang et al., 2024). This observation aligns with the increased susceptibility of the Hong Kong region to microplastics from the Pearl River during periods of high rainfall (Cheung et al., 2018; Zhang et al., 2024). During the fall, as the westerly current anomaly strengthens, a considerable amounts of floating litter crosses the Qiongzhou Strait, with minimal stranding occurring on the western continental shelf of PRE (Figure 13C).
Next, we conducted calculations to determine the daily volume of particles passing through two key sections: T1 in the PRE and T2 in the Qiongzhou Strait. These calculations allow us to better understand the role of circulation in facilitating the transport of floating litter between different regions, specifically PRE, the coast of Guangdong Province, and Beibu Gulf (Figure 3).
During the ENSO-neutral years, the release of particles from PRE to the NSCS shelf begins on the 8th day of spring. There is an exponential decline in the number of particles released thereafter, with the rate of decline slowing down after 20 days. By day 60, there were almost no particles being released (Figure 3C). In summer and autumn, the release of floating debris from the PRE gradually increases starting from the 4th day, reaching its peak on the 10th day, and then gradually decreases. By the 15th to 20th day, no more particles are being released from Lingding Bay (Figure 3C). In winter, the timing of particle release from the PRE is the same as spring. However, there is a subsequent decline in the number of particles released, followed by an increase 20 - 30 days. It takes approximately 30 to 60 days for all particles to leave the Lingding Bay. The maximum number of particles crossing the Qiongzhou Strait during summer is significantly higher than the non-summer seasons. Similarly, in winter, the number of particles crossing the Qiongzhou Strait within 60 - 90 days increases with the discharge of particles from the PRE (Figure 3D).
During La Niña years, there was a significant increase in the overall transport velocity of floating litter, leading to more uniform seasonal characteristics (Figures 3A, B). The flow of floating litter from the PRE to the estuary began approximately 9 days after discharge. Subsequently, the number of floating litter particles declined exponentially until the 40th day. In the La Niña scenario, the arrival of floating litter in the Qiongzhou Strait occurred approximately 10 days earlier compared to ENSO-neutral years (Figure 3B). The release of particles from the T2 section of the Qiongzhou Strait followed a similar pattern as observed in ENSO-neutral years, with an initial increasing and subsequent decrease. However, the release time was significantly earlier than the ENSO-neutral year. Notably, the crossing of the Qiongzhou Strait by floating litter occurred in spring, rather than in summer (Figure 3B).
In El Niño years, the movement of floating litter through the T1 transect exhibits similarities to that observed in La Niña years (Figure 3E). However, there is a notable distinction with significant discharge occurring within a 40 - 50 day period in summer. Conversely, the passage through the T2 transect, which leads to the Beibu Gulf, experiences a lag compared to ENSO-neutral and La Niña years, especially in summer. It takes approximately 40 - 50 days for particles to begin to release from the T2 transect (Figure 3F).
In this study, we investigated the dispersion patterns and distribution of floating litter released from Pearl River, which has recently been recognized as a significant location for floating litter and microplastics. Despite some previous observational research in this area (Mai et al., 2019; Lam et al., 2020; Chau et al., 2023; Zhang et al., 2024), there remains a lack of understanding regarding the behavior of floating litter under different hydrodynamic conditions. In comparison to other numerical model studies on floating litter and microplastics (Li et al., 2018; Shen et al., 2022; Liu et al., 2023), our study specifically focused on examining the inter-annual transport characteristics influenced by large-scale climate variability, particularly the ENSO, in addition to seasonal variations. Our main findings are:
1. During ENSO-neutral, El Niño, and La Niña years, the transport of plastic debris is predominantly influenced by the prevailing counterclockwise cyclonic circulation within the SCS basin. After being released from the Pearl River, plastic debris is carried seaward through Lingding Bay by gravitational circulation. Subsequently, influenced by the Coriolis force, it continues to move westward along the coast of Guangdong Province by the West-Guangdong Coastal Current (WGCC). As the debris exits the bay, it traverses the Qiongzhou Strait, circulates within the Beibu Gulf, and may even reach the western coasts of Vietnam and Laos. Notably, most of the floating litter accumulates within the estuary rather than in the Beibu Gulf and the Guangdong shelf. The simulation results are consistent with observational data indicating that once plastic debris enters the estuary, it is typically trapped along riverbanks and in low-flow zones, thereby reducing inputs to the coastal ocean and sea (Yonkos et al., 2014; Eerkes-Medrano et al., 2015; Zhang, 2017; Sun et al., 2022).
2. The transport and stranding patterns of floating litter exhibit notable disparities between La Niña/El Niño years and ENSO-neutral years. In La Niña years, reduced summer runoff from the Pearl River results in a decreased transport of floating litter particles, leading to a greater accumulation within Lingding Bay. In contrast, increased runoff in the summer of El Nino years facilitates the movement of floating litter out of Lingding Bay, reducing accumulation within the bay itself. The differences between El Niño, La Niña, and ENSO neutral years are consistent with numerous observations reported in the literature (Supplementary Table S1).
3. During the non-summer seasons of La Niña years, intensified westward flow facilitates the transportation of floating litter over extended distances, resulting in wider dispersion across the Yuexi coastal area and the Beibu Gulf, which decreases stranding within Lingding Bay. Conversely, during the non-summer seasons of El Niño years, the transport distance of floating litter is significantly increased. Furthermore, the weakened cyclonic circulation within the SCS caused by El Niño moderately impedes the transport of floating litter within the PRE. As a result, a significant portion of the floating litter is carried to the Hong Kong area, where high plastic debris are often observed (Cheung et al., 2018).
Although our study presents preliminary insights into the potential fate and distribution of floating litter in the PRE and the adjacent NSCS shelf, it is important to acknowledge several limitations at this stage. One key limitation is the absence of in-situ data on floating litter, which prevent the rigorously validation of our simulation results – an ongoing challenge faced by numerous numerical studies. Furthermore, this study primarily focuses on hydrodynamic processes, encompassing particle advection and random walk, while overlooking the characteristics of the floating litter itself. This may reduce the accuracy of our predictions. Indeed, the transport of plastic litter between different sea areas is affected by density, material, etc (Sun et al., 2022; Liu et al., 2023). For example, we’ve known that floating litter with higher densities may exhibit shorter transport distances compared to lighter densities, and they may also have a higher likelihood of fragmenting into smaller particles during transit. To address these limitations, our next plan involves deploying floats in the region to enhance the validation of our simulations and incorporating additional characteristics of floating litter into the model.
However, our analysis revealed a notable trend that floating litter particles are likely to accumulate within Lingding Bay, along the coastal region of Guangdong Province during El Niño years, ENSO-neutral and within the Beibu Gulf during the La Niña and ENSO-neutral years. It is imperative that future surveys prioritize these areas in specific years. Such prioritization will prove invaluable in assessing the extent of floating litter pollution within the PRE and the adjacent NSCS continental shelf. Additionally, our analysis will be useful in guiding the development of effective management strategies. For example, during the predicted potential La Nina years when floating litter can be transported over longer distance, and the dispersal areas are larger. The Environmental Protection Agency should consider building more capture infrastructure and promote international cooperation to manage transboundary pollution.
Ecological threats to estuarine and coastal seas from plastic pollution have been increasing in recent decades due to climate change and human land-based activities. Numerical modelling is an important tool for tracking the transport of marine debris and assisting policy makers and the public to implementing strategies to reduce the impact of plastic pollution. Previous research has widely investigated the hydrodynamic influences on plastic transport using general circulation models coupled with particle tracking models. However, the impacts of large scale climate events have been less thoroughly evaluated. In this study, we investigated the transport and stranding patterns of floating litter between La Niña, El Niño, and ENSO-neutral years, the disparities were notable both seasonally and interannually. We know that the frequency and intensity of climate change events are expected to increase in the foreseeable future due to global warming. The likelihood of climate events occurring should be taken into account when developing management strategies for predicting marine litter source-sink pathways and assessing potential trans-regional risks.
The raw data supporting the conclusions of this article will be made available by the authors, without undue reservation.
KP: Data curation, Investigation, Methodology, Writing – original draft, Formal analysis. YF: Conceptualization, Methodology, Supervision, Writing – review & editing, Funding acquisition. YZ: Investigation, Writing – review & editing. CF: Writing – review & editing, Conceptualization. XX: Writing – review & editing, Conceptualization.
The author(s) declare financial support was received for the research, authorship, and/or publication of this article. This research was supported by the National Key Research and Development Program of China (grant no. 2023YFF0805502), Southern Marine Science and Engineering Guangdong Laboratory (Zhuhai) (grant no. SML2023SP219), Hainan Province Science and Technology Special Fund (ZDYF2022SHFZ317). The numerical simulation is supported by the High Performance Computing Division and HPC managers of Wei Zhou and Dandan Sui in the South China Sea Institute of Oceanology.
The authors declare that the research was conducted in the absence of any commercial or financial relationships that could be construed as a potential conflict of interest.
All claims expressed in this article are solely those of the authors and do not necessarily represent those of their affiliated organizations, or those of the publisher, the editors and the reviewers. Any product that may be evaluated in this article, or claim that may be made by its manufacturer, is not guaranteed or endorsed by the publisher.
The Supplementary Material for this article can be found online at: https://www.frontiersin.org/articles/10.3389/fmars.2024.1494809/full#supplementary-material
Barnes D. K. A., Galgani F., Thompson R. C., Barlaz M. (2009). Accumulation and fragmentation of plastic debris in global environments. Philos. Trans. R Soc. Lond B Biol. 364, 1985–1998. doi: 10.1098/rstb.2008.0205
Baudena A., Kiko R., Jalón-Rojas I., Pedrotti M. L. (2023). Low-density plastic debris dispersion beneath the Mediterranean Sea surface. Environ. Sci. Technol. 57, 7503–7515. doi: 10.1021/acs.est.2c08873
Cai Z., Liu G., Liu Z., Gan J. (2022). Spatiotemporal variability of water exchanges in the Pearl River Estuary by interactive multiscale currents. Estuar Coast Shelf Sci. 265, 107730. doi: 10.1016/j.ecss.2021.107730
Chau H. S., Xu S., Ma Y., Wang Q., Cao Y., Huang G., et al. (2023). Microplastic occurrence and ecological risk assessment in the eight outlets of the Pearl River Estuary, a new insight into the riverine microplastic input to the northern South China Sea. Mar. pollut. Bull. 189, 114719. doi: 10.1016/j.marpolbul.2023.114719
Cheng G., Gong W., Wang Y., Xia Z. (2017). Modeling the circulation and sediment transport in the Beibu Gulf. Acta Oceanologica Sin. 36, 21–30. doi: 10.1007/s13131-017-1012-4
Cheung P. K., Fok L., Hung P. L., Cheung L. T. O. (2018). Spatio-temporal comparison of neustonic microplastic density in Hong Kong waters under the influence of the Pearl River Estuary. Sci. Total Environ. 628-629, 731–739. doi: 10.1016/j.scitotenv.2018.01.338
Cózar A., Sanz-Martín M., Martí E., González-Gordillo J. I., Ubeda B., Gálvez J.Á., et al. (2015). Plastic accumulation in the Mediterranean sea. PLoS One 10, e0121762. doi: 10.1371/journal.pone.0121762
Cui L., Li M., Zu T., Cai Z. (2024a). Seasonality of water exchange in the northern south China Sea from hydrodynamic perspective. Water 16, 10. doi: 10.3390/w16010010
Cui L., Liu Z., Chen Y., Cai Z. (2024b). Three-dimensional water exchanges in the shelf circulation system of the Northern South China Sea under climatic modulation from ENSO. J. Geophysical Research: Oceans 129, e2023JC020290. doi: 10.1029/2023JC020290
Deng Y., Liu Z., Zu T., Hu J., Gan J., Lin Y., et al. (2022). Climatic controls on the interannual variability of shelf circulation in the northern South China Sea. J. Geophysical Research: Oceans 127, e2022JC018419. doi: 10.1029/2022JC018419
Ding Y., Liu H., Yang W. (2019). Numerical prediction of the short-term trajectory of microplastic particles in Laizhou Bay. Water 11, 2251. doi: 10.3390/w11112251
Döös K. (1995). Interocean exchange of water masses. J Geophys Res. 100 (C7), 13499–13514. doi: 10.1029/95JC00337
Döös K., Jönsson B., Kjellsson J. (2017). Evaluation of oceanic and atmospheric trajectory schemes in the TRACMASS trajectory model v6. 0. Geoscientific Model. Dev. 10, 1733–1749. doi: 10.5194/gmd-10-1733-2017
Döös K., Nycander J., Coward A. C. (2008). Lagrangian decomposition of the deacon cell. J. Geophysical Research: Oceans 113. doi: 10.1029/2007JC004351
Eerkes-Medrano D., Thompson R. C., Aldridge D. C. (2015). Microplastics in freshwater systems: a review of the emerging threats, identification of knowledge gaps and prioritisation of research needs. Water Res. 75, 63–82. doi: 10.1016/j.watres.2015.02.012
Fang G., Chen H., Wei Z., Wang Y., Wang X., Li C. (2006a). Trends and interannual variability of the South China Sea surface winds, surface height, and surface temperature in the recent decade. J. Geophysical Research: Oceans 111, S16. doi: 10.1029/2005JC003276
Fang W., Guo J., Shi P., Mao Q. (2006b). Low frequency variability of South China Sea surface circulation from 11 years of satellite altimeter data. Geophysical Res. Lett. 33, L22612. doi: 10.1029/2006GL027431
Feng Y., Huang J., Du Y., Balaguru K., Ma W., Feng Q., et al. (2022). Drivers of phytoplankton variability in and near the Pearl River Estuary, South China Sea during Typhoon Hato, (2017): A numerical study. J. Geophysical Research: Biogeosciences 127, e2022JG006924. doi: 10.1029/2022JG006924
Fok L., Cheung P. K. (2015). Hong Kong at the Pearl River Estuary: A hotspot of microplastic pollution. Mar. pollut. Bull. 99, 112–118. doi: 10.1016/j.marpolbul.2015.07.050
Gan J., Cheung A., Guo X., Li L. (2009). Intensified upwelling over a widened shelf in the northeastern South China Sea. J. Geophysical Research: Oceans 114, C09019. doi: 10.1029/2000JC000768
Gao J., Wu G., Ya H. (2017). Review of the circulation in the beibu gulf, South China Sea. Continental Shelf Res. 138, 106–119. doi: 10.1016/j.csr.2017.02.009
Gu J., Zhang Y., Tuo P., Hu Z., Chen S., Hu J. (2024). Surface floating objects moving from the Pearl River Estuary to Hainan Island: An observational and model study. J. Mar. Syst. 241, 103917. doi: 10.1016/j.jmarsys.2023.103917
Howell E. A., Bograd S. J., Morishige C., Seki M. P., Polovina J. J. (2012). On North Pacific circulation and associated marine debris concentration. Mar. pollut. Bull. 65, 16–22. doi: 10.1016/j.marpolbul.2011.04.034
Jiang J., He L., Zheng S., Liu J., Gong L. (2024). A review of microplastic transport in coastal zones. Mar. Environ. Res. 196, 106397. doi: 10.1016/j.marenvres.2024.106397
Kaandorp M., Lobelle D., Kehl C., Dijkstra H., Van Sebille E. (2023). Global mass of buoyant marine plastics dominated by large long-lived debris. Nat. Geosci. 16, 689–694. doi: 10.1038/s41561-023-01216-0
Kako S.i., Isobe A., Seino S., Kojima A. (2010). Inverse estimation of drifting-object outflows using actual observation data. J. Oceanography 66, 291–297. doi: 10.1007/s10872-010-0025-9
Lam T. W. L., Fok L., Lin L., Xie Q., Li H.-X., Xu X.-R., et al. (2020). Spatial variation of floatable plastic debris and microplastics in the Pearl River Estuary, South China. Mar. pollut. Bull. 158, 111383. doi: 10.1016/j.marpolbul.2020.111383
Law K. L., Morét-Ferguson S. E., Goodwin D. S., Zettler E. R., DeForce E., Kukulka T., et al. (2014). Distribution of surface plastic debris in the eastern Pacific Ocean from an 11-year data set. Environ. Sci. Technol. 48, 4732–4738. doi: 10.1021/es4053076
Lebreton L., Egger M., Slat B. (2019). A global mass budget for positively buoyant macroplastic debris in the ocean. Sci. Rep. 9, 12922. doi: 10.1038/s41598-019-49413-5
Lebreton L.-M., Greer S., Borrero J. C. (2012). Numerical modelling of floating debris in the world’s oceans. Mar. pollut. Bull. 64, 653–661. doi: 10.1016/j.marpolbul.2011.10.027
Lebreton L. C., van der Zwet J., Damsteeg J.-W., Slat B., Andrady A., Reisser J. (2017). River plastic emissions to the world’s oceans. Nat. Commun. 8, 15611. doi: 10.1038/ncomms15611
Li D., Gan J., Hui C., Yu L., Liu Z., Lu Z., et al. (2021). Spatiotemporal development and dissipation of hypoxia induced by variable wind-driven shelf circulation off the Pearl River Estuary: Observational and Modeling Studies. J. Geophysical Research: Oceans 126, e2020JC016700. doi: 10.1029/2020JC016700
Li Y., Wolanski E., Dai Z., Lambrechts J., Tang C., Zhang H. (2018). Trapping of plastics in semi-enclosed seas: Insights from the Bohai Sea, China. Mar. pollut. Bull. 137, 509–517. doi: 10.1016/j.marpolbul.2018.10.038
Liu N., Geng B., Xue H., Xiu P., Wang Q., Wang D. (2020). Interannual variability of shelf and slope circulations in the northern South China Sea. J. Ocean Univ. China 19, 1005–1016. doi: 10.1007/s11802-020-4446-9
Liu R., Wang T., Li J., Liu X., Zhu Q. (2023). Simulation of seasonal transport of microplastics and influencing factors in the China Seas based on the ROMS model. Water Res. 244, 120493. doi: 10.1016/j.watres.2023.120493
Liubartseva S., Coppini G., Lecci R., Creti S. (2016). Regional approach to modeling the transport of floating plastic debris in the Adriatic Sea. Mar. pollut. Bull. 103, 115–127. doi: 10.1016/j.marpolbul.2015.12.031
Lui H.-K., Chen C.-T. A., Hou W.-P., Liau J.-M., Chou W.-C., Wang Y.-L., et al. (2020). Intrusion of Kuroshio helps to diminish coastal hypoxia in the coast of Northern South China Sea. Front. Mar. Sci. 7, 565952. doi: 10.3389/fmars.2020.565952
Luo L., Meng Z., Ma W., Huang J., Zheng Y., Feng Y., et al (2023). The second-generation real-time ecological environment prediction system for the Guangdong–Hong Kong–Marco Greater Bay Area: model setup, validation, improvements, and online visualization. Front Mar Sci. 10, 1096435. doi: 10.3389/fmars.2023.1096435
Mai L., You S.-N., He H., Bao L.-J., Liu L.-Y., Zeng E. Y. (2019). Riverine microplastic pollution in the Pearl River Delta, China: are modeled estimates accurate? Environ. Sci. Technol. 53, 11810–11817. doi: 10.1021/acs.est.9b04838
Martinez E., Maamaatuaiahutapu K., Taillandier V. (2009). Floating marine debris surface drift: convergence and accumulation toward the South Pacific subtropical gyre. Mar. pollut. Bull. 58 (9), 1347–1355. doi: 10.1016/j.marpolbul.2009.04.022
Meijer L. J., Van Emmerik T., van der Ent R., Schmidt C., Lebreton L. (2021). More than 1000 rivers account for 80% of global riverine plastic emissions into the ocean. Sci. Adv. 7 (18), eaaz5803. doi: 10.1126/sciadv.aaz5803
Mellor G. L., Yamada T. (1982). Development of a turbulence closure model for geophysical fluid problems. Rev Geophys. 20 (4), 851–875. doi: 10.1029/RG020i004p00851
Meng Z., Li N., Guan Y., Feng Y. (2020). Exchanges of surface plastic particles in the South China Sea through straits using Lagrangian method. J. Trop. Oceanography 39 (5), 109–116. doi: 10.11978/2019118
National Oceanic and Atmospheric Administration (NOAA) Marine Debris Program. (2016). Report on Modeling Oceanic Transport of Floating Marine Debris. (Silver Spring, MD), 21. Available at: https://repository.library.noaa.gov/view/noaa/21432/noaa_21432_DS1.pdf.
Politikos D. V., Ioakeimidis C., Papatheodorou G., Tsiaras K. (2017). Modeling the fate and distribution of floating litter particles in the Aegean Sea (E. Mediterranean). Front. Mar. Sci. 4, 191. doi: 10.3389/fmars.2017.00191
Qian W., Gan J., Liu J., He B., Lu Z., Guo X., et al. (2018). Current status of emerging hypoxia in a eutrophic estuary: The lower reach of the Pearl River Estuary, China. Estuarine Coast. Shelf Sci. 205, 58–67. doi: 10.1016/j.ecss.2018.03.004
Ryan P. G. (2015). Does size and buoyancy affect the long-distance transport of floating debris? Environ. Res. Lett. 10, 084019. doi: 10.1088/1748-9326/10/8/084019
Shchepetkin A. F., McWilliams J. C. (2009). “Computational Kernel Algorithms for Fine-Scale, Multiprocess, Longtime Oceanic Simulations,” in Handbook of Numerical Analysis. eds. Temam R. M., Tribbia J. J. (Elsevier), 121–183.
Shen Z., Wang H., Liang D., Yan Y., Zeng Y. (2022). The fate of microplastics in estuary: a quantitative simulation approach. Water Res. 226, 119281. doi: 10.1016/j.watres.2022.119281
Shu Y., Wang D., Feng M., Geng B., Chen J., Yao J., et al. (2018a). The contribution of local wind and ocean circulation to the interannual variability in coastal upwelling intensity in the Northern South China Sea. J. Geophysical Research: Oceans 123, 6766–6778. doi: 10.1029/2018JC014223
Shu Y., Wang Q., Zu T. (2018b). Progress on shelf and slope circulation in the northern South China Sea. Sci. China Earth Sci. 61, 560–571. doi: 10.1007/s11430-017-9152-y
Suaria G., Aliani S. (2014). Floating debris in the Mediterranean Sea. Mar. pollut. Bull. 86, 494–504. doi: 10.1016/j.marpolbul.2014.06.025
Sun Y., Cao L., Wang Y., Chen W., Li Y., Zhao X. (2022). Sources and distribution of microplastics in the east China sea under a three-dimensional numerical modelling. Environ. pollut. 311, 119910. doi: 10.1016/j.envpol.2022.119910
Thiel M., Hinojosa I. A., Miranda L., Pantoja J. F., Rivadeneira M. M., Vasquez N. (2013). Anthropogenic marine debris in the coastal environment: A multi-year comparison between coastal waters and local shores. Mar. pollut. Bull. 71, 307–316. doi: 10.1016/j.marpolbul.2013.01.005
Thornton L., Jackson N. L. (1998). Spatial and temporal variations in debris accumulation and composition on an estuarine shoreline, Cliffwood Beach, New Jersey, USA. Mar. pollut. Bull. 36, 705–711. doi: 10.1016/S0025-326X(98)00041-1
Wang Q., Cai W., Zeng L., Wang D. (2018). Nonlinear meridional moisture advection and the ENSO-southern China rainfall teleconnection. Geophysical Res. Lett. 45, 4353–4360. doi: 10.1029/2018GL077446
Wang B., Huang F., Wu Z., Yang J., Fu X., Kikuchi K. (2009). Multi-scale climate variability of the South China Sea monsoon: A review. Dynamics Atmospheres Oceans 47, 15–37. doi: 10.1016/j.dynatmoce.2008.09.004
Wang Q., Wang Y., Bo H., Zhou W., Wang D. (2011). Different roles of Ekman pumping in the west and east segments of the South China Sea Warm Current. Acta Oceanologica Sin. 30, 1–13. doi: 10.1007/s13131-011-0113-8
Weiss L., Ludwig W., Heussner S., Canals M., Ghiglione J.-F., Estournel C., et al. (2021). The missing ocean plastic sink: gone with the rivers. Science 373, 107–111. doi: 10.1126/science.abe0290
Xu Q., Dong Y.-x., Yang R., Zhang H.-o., Wang C.-j., Du Z.-w. (2019). Temporal and spatial differences in carbon emissions in the Pearl River Delta based on multi-resolution emission inventory modeling. J. Cleaner Production 214, 615–622. doi: 10.1016/j.jclepro.2018.12.280
Yin M., Cao H., Zhao W., Wang T., Huang W., Cai M. (2022). Tide-driven microplastics transport in an elongated semi-closed bay: A case study in Xiangshan Bay, China. Sci. Total Environ. 846, 157374. doi: 10.1016/j.scitotenv.2022.157374
Yonkos L. T., Friedel E. A., Perez-Reyes A. C., Ghosal S., Arthur C. D. (2014). Microplastics in four estuarine rivers in the Chesapeake Bay, USA. Environ. Sci. Technol. 48, 14195–14202. doi: 10.1021/es5036317
Zhang H. (2017). Transport of microplastics in coastal seas. Estuar. Coast. Shelf Sci. 199, 74–86. doi: 10.1016/j.ecss.2017.09.032
Zhang K., Cheng M. C., Liu M., Xu S., Ma Y., Chau H. S., et al. (2024). Microplastics in Hong Kong’s marine waters: Impact of rainfall and Pearl River discharge. Mar. pollut. Bull. 205, 116635. doi: 10.1016/j.marpolbul.2024.116635
Zhang J., Choi C. E. (2021). Improved settling velocity for microplastic fibers: A new shape-dependent drag model. Environ. Sci. Technol. 56, 962–973. doi: 10.1021/acs.est.1c06188
Keywords: floating litter, ENSO, numerical model, estuarine and coastal areas, transport and distribution, seasonal and interannual variability
Citation: Pang K, Feng Y, Zheng Y, Fang C and Xu X (2025) Simulating the ENSO impact on the distribution and fate of floating litter particles in the Northern South China Sea. Front. Mar. Sci. 11:1494809. doi: 10.3389/fmars.2024.1494809
Received: 11 September 2024; Accepted: 23 December 2024;
Published: 28 January 2025.
Edited by:
Ram Kumar, Central University of Bihar, IndiaReviewed by:
Qian Zhou, Zhejiang University of Technology, ChinaCopyright © 2025 Pang, Feng, Zheng, Fang and Xu. This is an open-access article distributed under the terms of the Creative Commons Attribution License (CC BY). The use, distribution or reproduction in other forums is permitted, provided the original author(s) and the copyright owner(s) are credited and that the original publication in this journal is cited, in accordance with accepted academic practice. No use, distribution or reproduction is permitted which does not comply with these terms.
*Correspondence: Yang Feng, eWZlbmdAc2NzaW8uYWMuY24=
Disclaimer: All claims expressed in this article are solely those of the authors and do not necessarily represent those of their affiliated organizations, or those of the publisher, the editors and the reviewers. Any product that may be evaluated in this article or claim that may be made by its manufacturer is not guaranteed or endorsed by the publisher.
Research integrity at Frontiers
Learn more about the work of our research integrity team to safeguard the quality of each article we publish.