- 1Second Institute of Oceanography, Ministry of Natural Resources, Hangzhou, China
- 2Key Laboratory of Ocean Space Resource Management Technology, Ministry of Natural Resources, Hangzhou, China
- 3Key Lab of Nearshore Engineering Environment and Ecological Security of Zhejiang Province, Hangzhou, China
- 4School of Hydraulic Engineering, Zhejiang University of Water Resources and Electric Power, Hangzhou, China
The risk of typhoon disasters is high in the Zhejiang coastal areas; however, it has been difficult to characterize waves generated by these typhoons, particularly in shallow waters. In this study, the characteristics of nearshore typhoon waves were analyzed using data from 14 typhoon processes from a wave station on the central coast of Zhejiang Province for three consecutive years from 2016 to 2018. According to their paths, these typhoons were divided into landing and non-landing steering types. Wave parameters were evaluated using statistical analyses and linear regression. Variations in wave parameters and spectra are discussed. We obtained several key results: (1) The dominant wave direction was E-SE and the strong wave direction was SE. (2) There were strong correlations between characteristic wave heights and between characteristic periods. (3) Single-peak spectra were dominant, with a frequency of 92.33%. The minimum peak frequency was 0.06–0.1 Hz and the maximum peak period was 17.7 s. The typhoon waves were mainly composed of swells with a frequency of 94.54%. (4) Affected by Typhoon Maria (No. 201808), a maximum wave height of 8.20 m was observed at 04:00 on July 11, 2018. This study provides an important reference for the design of offshore structures and disaster prevention and mitigation.
1 Introduction
Typhoons are strong tropical cyclones that develop in the Northwestern Pacific, often impacting coastal areas of China, Japan, Korea, and the Philippines. Most typhoons move through the East China Sea or make landfall in China, particularly in the Zhejiang coastal area (ZCA), located west of the East China Sea. Typhoon-induced waves are frequently devastating, as they have the potential to sink ships and damage offshore platforms and coastal protective structures. Typhoons typically entered the ZCA between May and November, with an average of 3.8 typhoons hitting the area annually (Sun et al., 2015). Typhoon Chan-hom (severe typhoon No. 9 of 2015) made landfall on the Zhoushan Islands, Zhejiang, generating waves with a maximum significant wave height of 3.3 m and causing direct economic losses of CNY 3.47 billion in the province (Yang et al., 2017). Investigating typhoon waves holds significant importance for marine engineering, navigation safety, and disaster prevention and mitigation in coastal regions.
Generally, studying typhoon waves necessitates the acquisition of actual typhoon wave measurements coupled with suitable analysis methods. In the past, it was extremely difficult to make accurate observations of typhoon waves, and analyses were mainly based on numerical simulations. For example, Zheng and Yu (2010) simulated the impact of Typhoon Winnie (No.199711) on Hangzhou Bay based on the SWAN model and analyzed the spatial distribution of wave heights. In addition, Xia et al. (2014) used the MIKE21SW model to simulate the wave characteristics associated with a typhoon moving northwest. However, numerical simulations necessitate actual measurements of typhoon wave processes for validation to ensure their reliability. Given the variability of typhoon paths, accurately simulating and verifying multi-path typhoon wave processes proves challenging. Analyzing multiple measured typhoon waves emerges as a reliable approach to investigate typhoon wave processes (Yang et al., 2017). Appropriate analysis methods enable the examination of variations in characteristic wave parameters during typhoon wave processes, the correlation between wave parameters, spectral characteristics, and the influence of typhoon wave paths and intensities on the observed sea area (Yang et al., 2021; Kumar and Anusree, 2023; Anjali Nair et al., 2022; Jiang et al., 2024).
In recent years, with subsequent advancements in observation and simulation techniques, studies of typhoon waves involving observations in the ZCA increased. For example, Yang et al. (2017) characterized the waves generated by six severe typhoons impacting the Zhoushan Islands based on observations. Feng et al. (2018) simulated all the typhoon wave processes impacting Zhejiang and Fujian over two decades and verified the simulation results using observations of four typhoon wave processes. Zhou et al. (2020) analyzed the wave variation in Sanmen Bay, Zhejiang induced by Typhoon Talim (No.201718) using one year of observations from a temporary station located in the bay. More recently, using one year of observations, Zhou et al. (2023) analyzed the wave variation characteristics induced by five typhoons and one cold wave, and Huan (2023) analyzed the wind-wave process in the Dongji Island sea area, Zhejiang, generated by Super Typhoon Lekima (No. 201909) using one year of wave observations. Furthermore, Jiang et al. (2024) analyzed seven typhoon wave processes that had severely impacted Zhejiang since 2010 using observations from two buoys at Zhoushan and Wenzhou and ERA5 reanalysis data. They found that most of the wave forms in the ZCA underwent “mixed wave-wind sea-mixed wave” evolutions. Yang et al. (2021) found that the waves in the Hangzhou Bay in the northern coastal area of Zhejiang increased markedly under the impact of typhoons; the wave spectra were mostly single-peaked, and most typhoon waves had a peak frequency of 0.2 Hz. Compared with those in Hangzhou Bay, typhoon waves in the Zhoushan Islands located outside of the bay were markedly higher, the wave period was longer, and the wave spectra had a single peak or two peaks, depending on the track of the typhoon (Yang et al., 2017). In addition, the typhoon waves in Sanmen Bay in the central-northern ZCA persisted for longer periods (approximately 3 days). Most had a double-peak spectrum and were dominated by mixed waves formed by the superposition of local wind seas and offshore swells. Other spectral forms have also been identified (Zhou et al., 2023): in the shallow waters (15 m) of the Dongji Islands near and south of Sanmen Bay, Super Typhoon Lekima (No. 201909) generated a maximum wave height of 8.67 m with a corresponding wave period of 14.0 s. This typhoon wave process was dominated by a double-peak spectrum attributed to mixed waves formed by wind seas and swells.
The previous studies of typhoon waves in the ZCA were dispersed across various sea areas and were based on observation analysis or simulations of only a few typical typhoons. Few studies have focused on typhoon waves in the shallow open waters of the central ZCA, and definitive results are lacking. Therefore, in this study, the typhoon wave characteristics in an open sea area in the central ZCA were thoroughly investigated using nearly three years of wave observations and focusing on 14 tropical cyclone wave processes that significantly impacted the area, including three strong tropical storms and 11 typhoons. Our results provide a reference for enabling typhoon defense in the open waters of the central ZCA.
2 Materials and methods
2.1 Study area and data selection
The study area covers the coastal waters east of Taizhou City, Zhejiang Province, which has a water depth of approximately 12 m. A wave station (121°41.400’E, 28°17.600’N) is located at the northern part of Niushan Island (Figure 1). The wave station is adjacent to the East China Sea in the east and is surrounded by open waters from north to south (clockwise) and is approximately 5 km away from the coastline in the west.
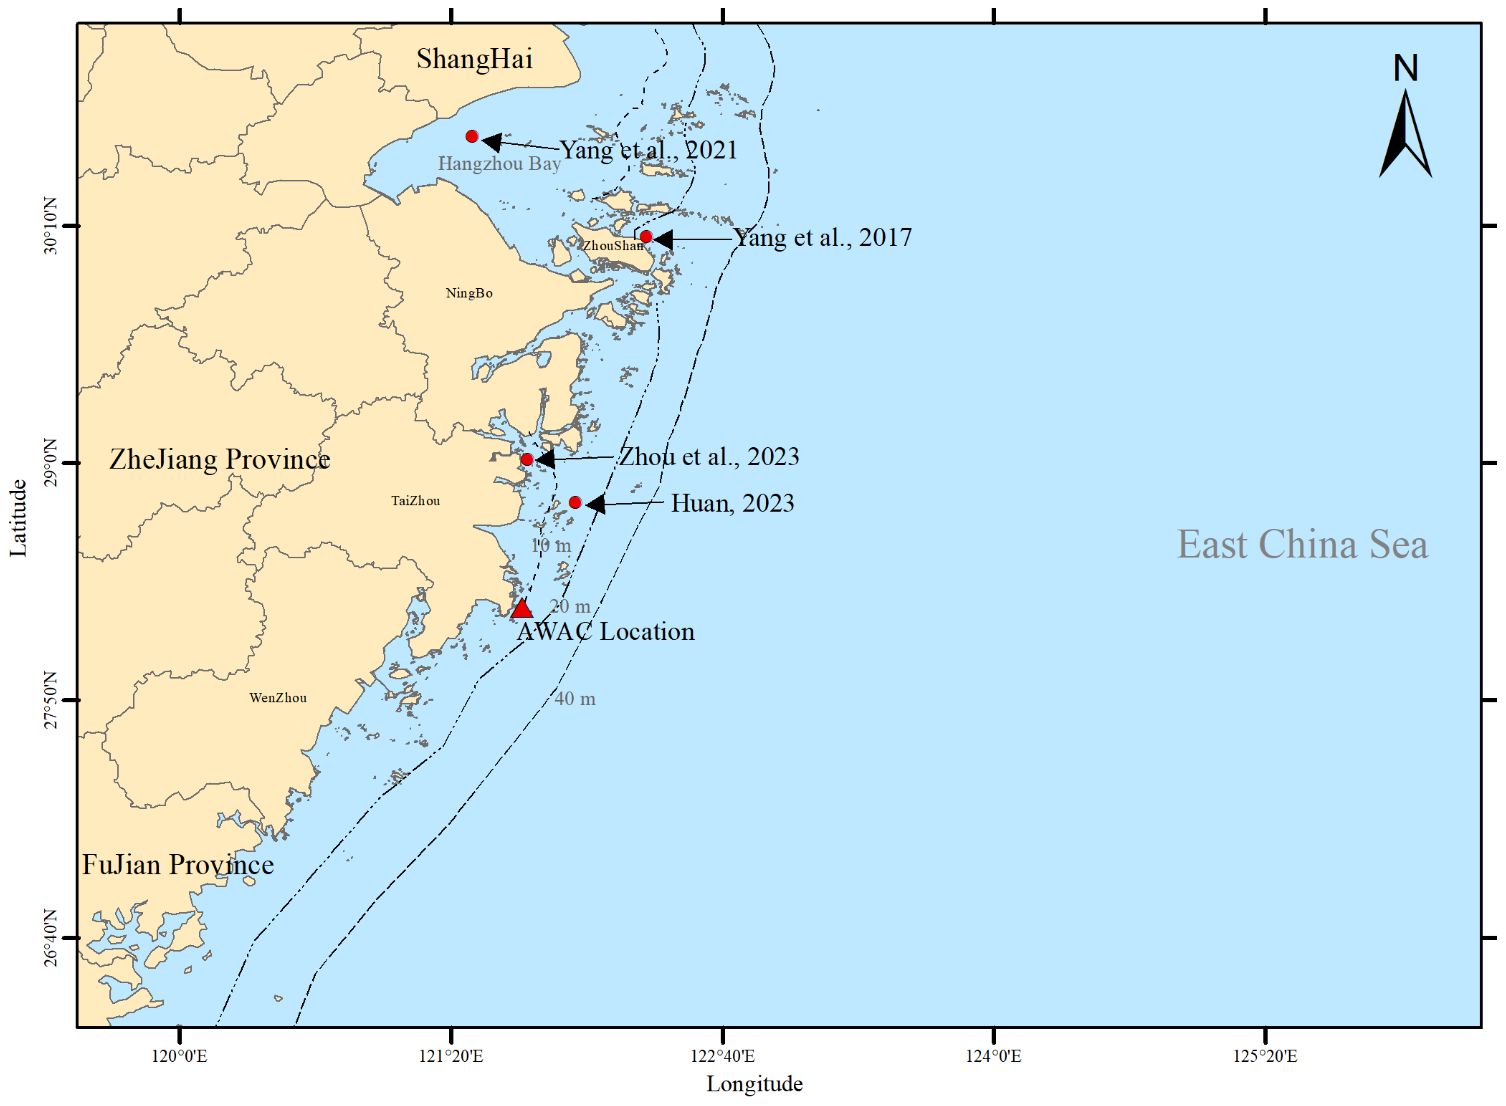
Figure 1. Location of wave observation station (“▲”). The locations of wave measurements made by Yang et al. (2021); Yang et al. (2017); Zhou et al. (2023) and Huan (2023) are also marked (“•”).
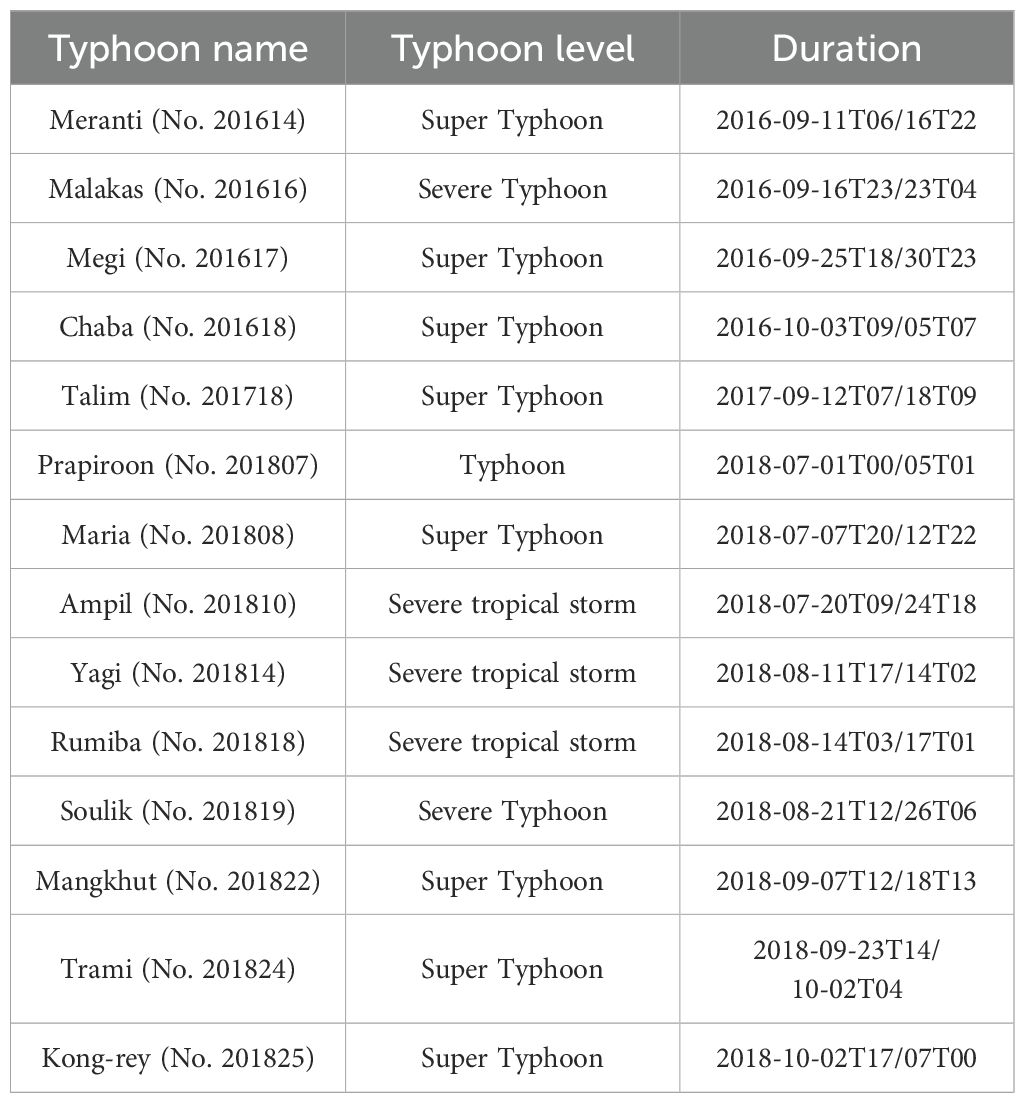
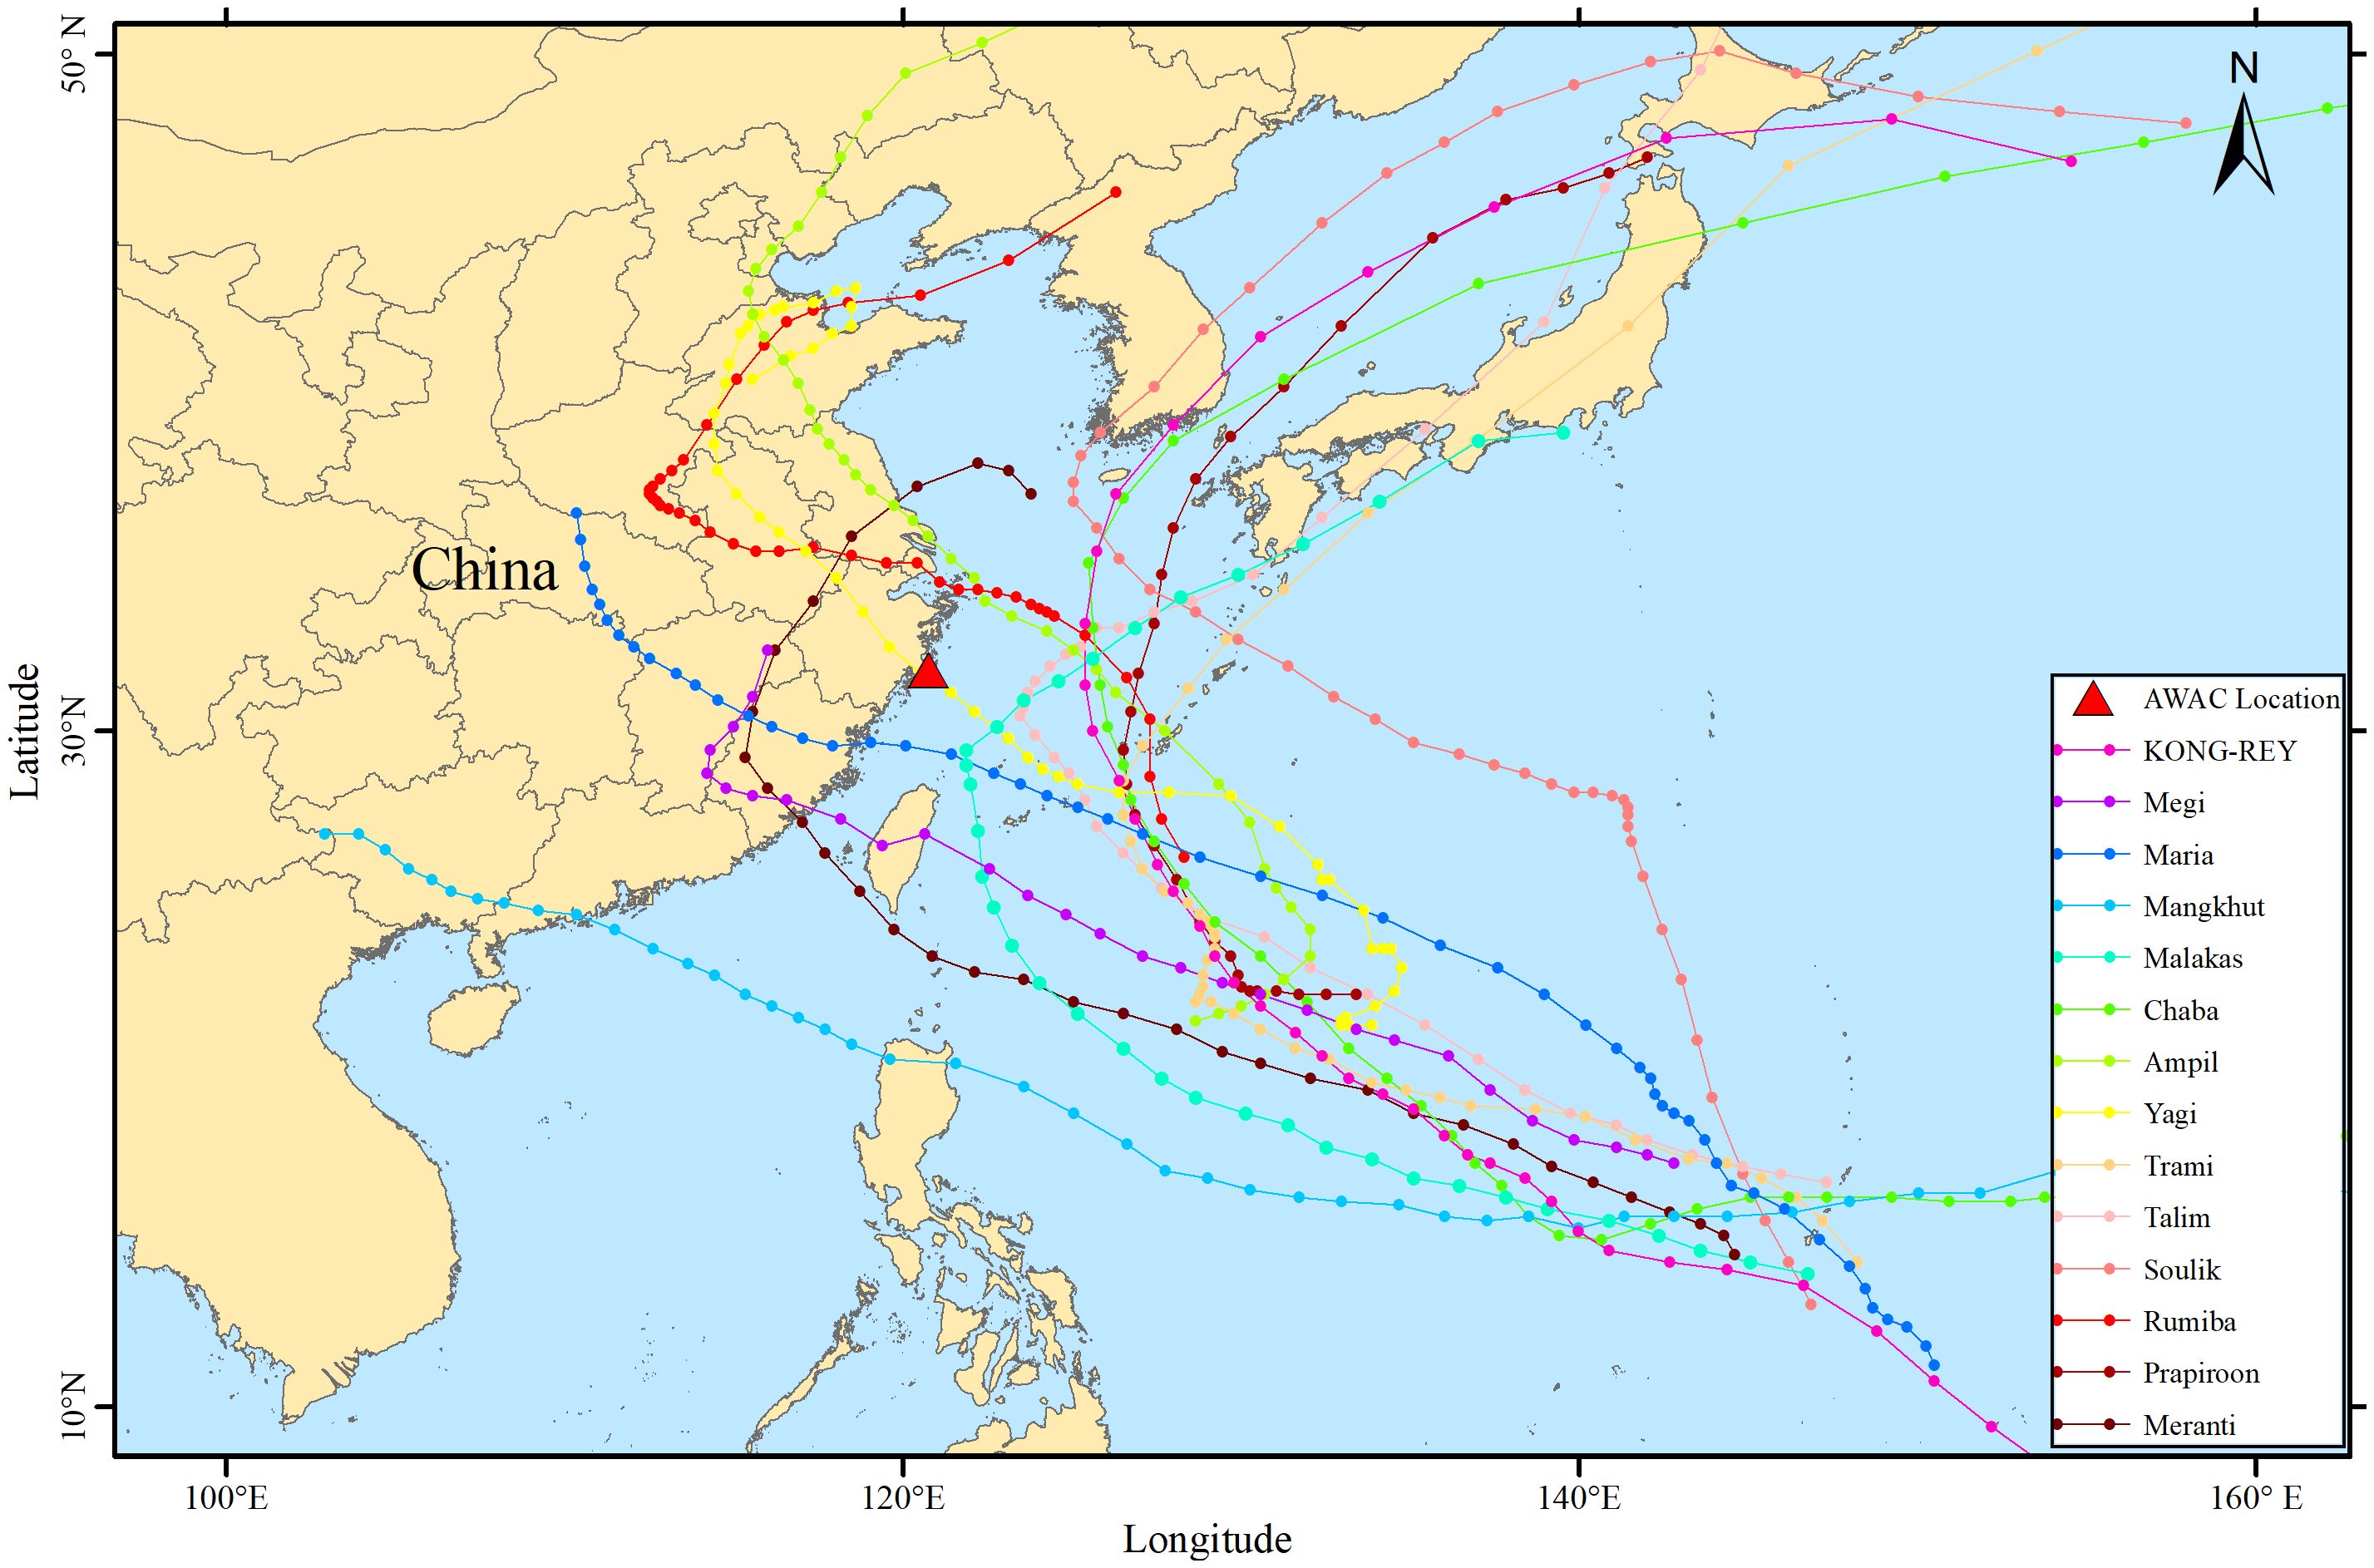
Wave observations were made at the station from September 1, 2016 to December 31, 2018. Based on the observations, 14 typhoon-induced large wave processes were identified. The initiation and termination times of each typhoon wave process were determined based on the height of the highest one-tenth wave (H1/10) that was larger than 0.80 m, from an engineering impact perspective. The wave processes included occasional data with a wave height smaller than this value, which were included in subsequent analyses. Table 1 shows the identified wave processes, durations, and intensity classifications. Figure 2 shows the tracks of the typhoons. The data of typhoon tracks were download from https://tcdata.typhoon.org.cn (Ying et al., 2014; Lu et al., 2021).
2.2 Observation instruments and data treatment methods
An acoustic wave and current profiler (AWAC-600K, Nortek) equipped with an acoustic surface tracking feature and the accuracy less than 1% of the measured value was used to measure wave heights and synchronous stratified measurements of flow velocity and direction. Observations sessions were made every hour at a sampling frequency of 2 Hz, with each session lasting about 18 min. Storm software accompanying the instrument was used to calculate wave parameters, such as weight heights, periods, and directions as well as frequency spectrum data. This instrument is widely used and provides reliable data processing results (Pedersen and Nylund, 2004).
Storm software performs zero-crossing statistical analyses of wave height records to calculate various parameters for the corresponding periods, including the significant wave height H1/3, height of highest one-tenth wave H1/10, maximum wave height Hmax, mean wave height Hmean, significant wave period T1/3, wave period T1/10 corresponding to H1/10, maximum wave period Tmax, and mean zero-crossing period Tz. The software uses the acoustic surface tracking and horizontal velocity U and V (SUV) method as the first choice to calculate wave directions (Pedersen et al., 2005). It uses the fast Fourier transform method to calculate frequency spectra and yields smooth frequency spectra with 64 degrees of freedom, which are truncated at a high frequency of 1 Hz. The resolution is 0.01 Hz. Other parameters can be calculated by the spectrum, such as the significant wave height Hm0, mean wave period T01, and spectral peak period Tp. We calculated other spectral parameters based on the frequency spectra output from the software, such as the zeroth-order moment m0, spectral peak value S(fp), mean wave period T02, and spectral width ϵ (Holthuijsen, 2007).
3 Results and discussion
3.1 Parametric characteristics of typhoon waves
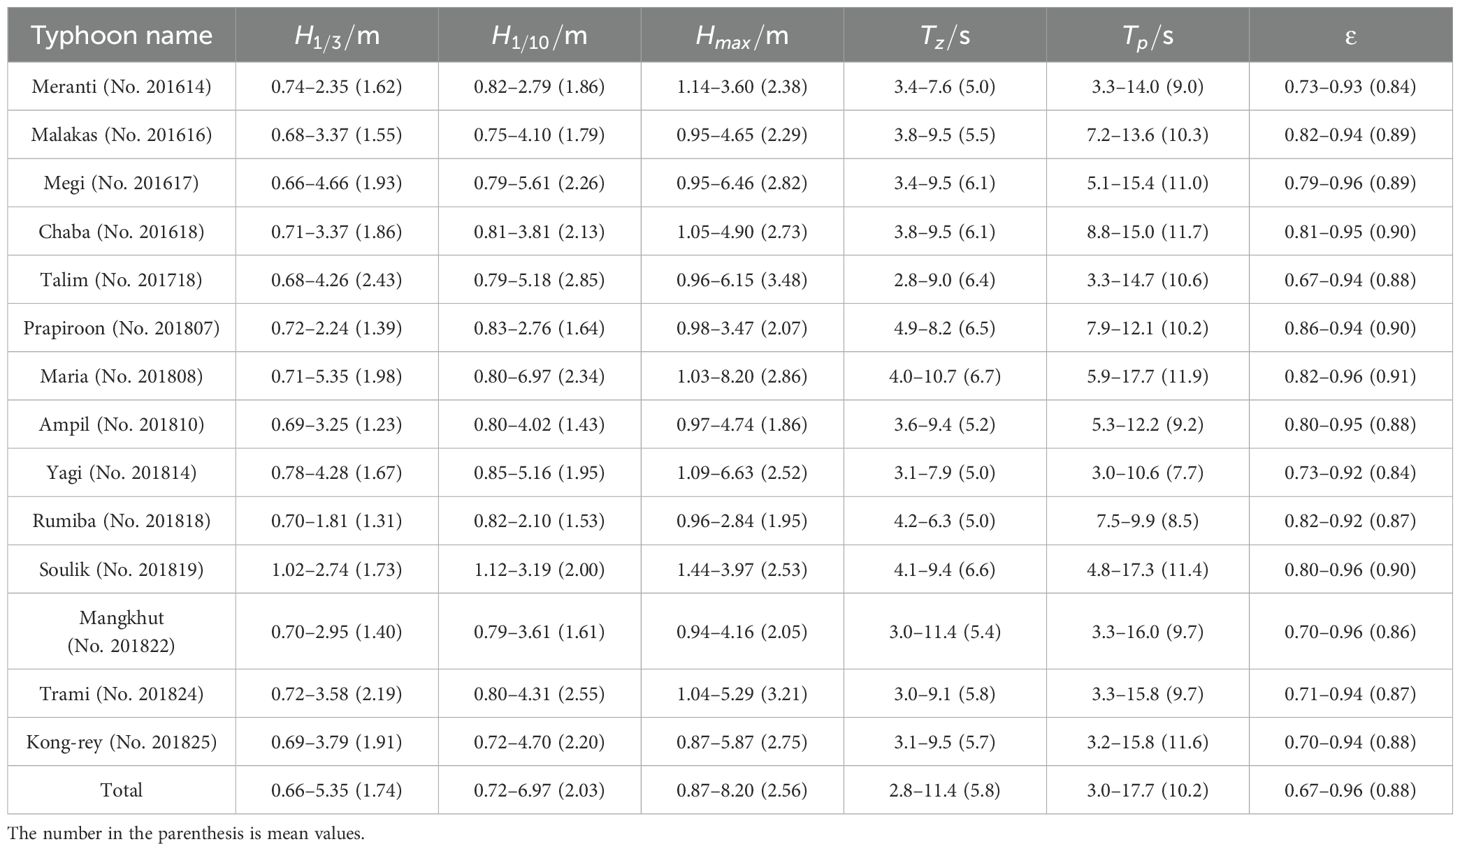
Table 2 shows the ranges of wave parameters during typhoon wave processes, demonstrating the substantial variation in wave height. H1/3 varied in the range of 0.66–5.35 m, with a mean of 1.74 m. According to their magnitudes, the waves were classified as smooth, slight, moderate, rough, and very rough. Among the observed typhoon wave processes, the maximum wave height of Maria (No. 201808) was markedly larger than those of other typhoon wave processes. During this process, the maximum H1/3 was 5.35 m, maximum H1/10 was 6.97 m, maximum Hmax was 8.20 m, and the maximum mean period of the maximum wave height was long, with a maximum Tz of 10.7 s. The maximum H1/10 occurred at 04:00 on 11 July 2018. At this moment, Hmax was 8.20 m, the water depth was 13.0 m, Tz was 10.7 s, and the wave direction was SE. It is already a catastrophic wave (Tao et al., 2018).
We analyzed wave parameters (mean and extreme values) for six typhoon wave processes in the Zhoushan Islands in the northern ZCA (Yang et al., 2017), two typhoon wave processes with the largest impact in the Hangzhou Bay as observed at two stations (Yang et al., 2021), one typhoon wave process with the largest impact occurring in the Sanmen Bay in the central ZCA (Zhou et al., 2023), and one typhoon wave process occurring in the Dongji Islands during the observation period of this study (Huan, 2023) (Figure 1; Table 3). The mean significant wave height of the typhoon wave processes observed in this study was markedly larger than those in the Zhoushan Islands (Yang et al., 2017) and Sanmen Bay (Zhou et al., 2023), and the mean wave period was longer. These findings reflect the fact that the water area observed in this study is directly adjacent to the East China Sea and deep-water waves can propagate to this area without obstruction. The difference between them is also related to the different number of typhoons counted during different statistical periods. The maximum wave height and the maximum wave period in the study area were similar to those in the Dongji Islands (Huan, 2023) and markedly larger than those in the Hangzhou Bay and Sanmen Bay. The larger maximum wave parameters in both the study area and the Dongji Islands (Huan, 2023) can be explained by typhoon tracks: the typhoons impacting these two water areas made landfall directly on the Zhejiang coast and had great intensity at landfall. They are also related to the location of the stations: the two stations for these water areas are surrounded by open sea waters in the N, E, and S directions, while the stations in the Zhoushan Islands and Hangzhou Bay are located in relatively closed waters.
3.2 Process analysis
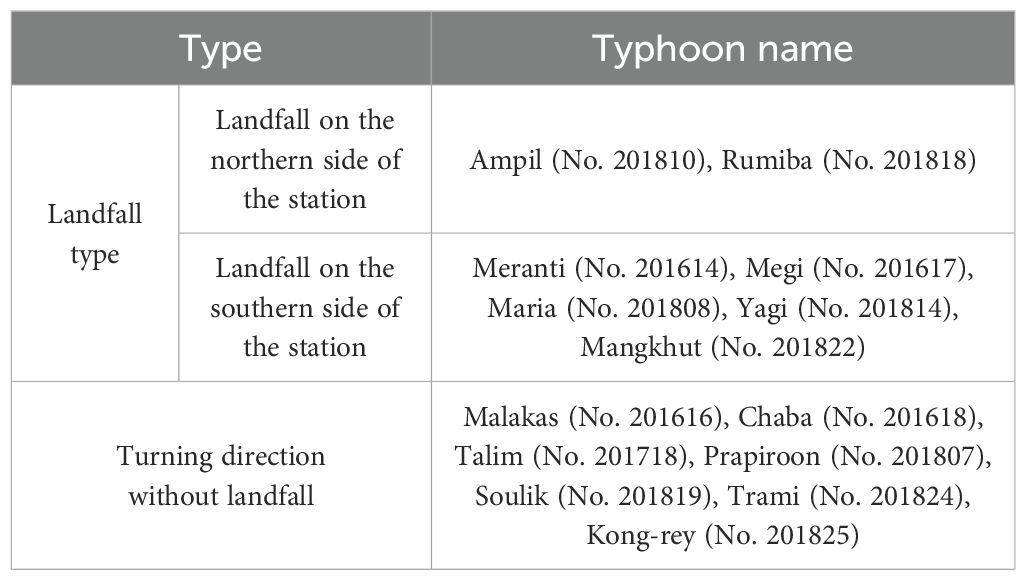
Two main types of tropical cyclones impacted the study area during the observation period: those making landfall and those turning northeast without making landfall. The first type can be divided into two sub-types: those landing on the southern side and those landing on the northern side of the station. Table 4 shows the classification of the tracks of the 14 tropical cyclones observed in this study.
The typhoon wave processes with the largest wave heights for three types of cyclones, Ampil (No. 201810), Maria (No. 201808), and Talim (No. 201718), were analyzed based on their maximum H1/10.
Ampil (No. 201810), a severe tropical storm, made landfall in Hangzhou Bay north of the study area with the intensity of a severe tropical storm. H1/10 and Tz of this wave process exhibited clear decaying trends. The maximum H1/10 was 4.02 m at 01:00 on 22 July 2018, while the maximum Tz occurred three hours later at 04:00 on 22 July 2018 (Figure 3A). Tp also exhibited an overall decreasing trend, fluctuating sharply before reaching a maximum of 12.2 s and remaining at approximately 11.0 s when the wave height exceeded 1.0 m. The wave direction did not show significant variation over time and was typically E and ESE. Rumiba (No. 201818), another cyclone making landfall in the northern part of the study area, was also dominated by waves in the E and ESE directions.
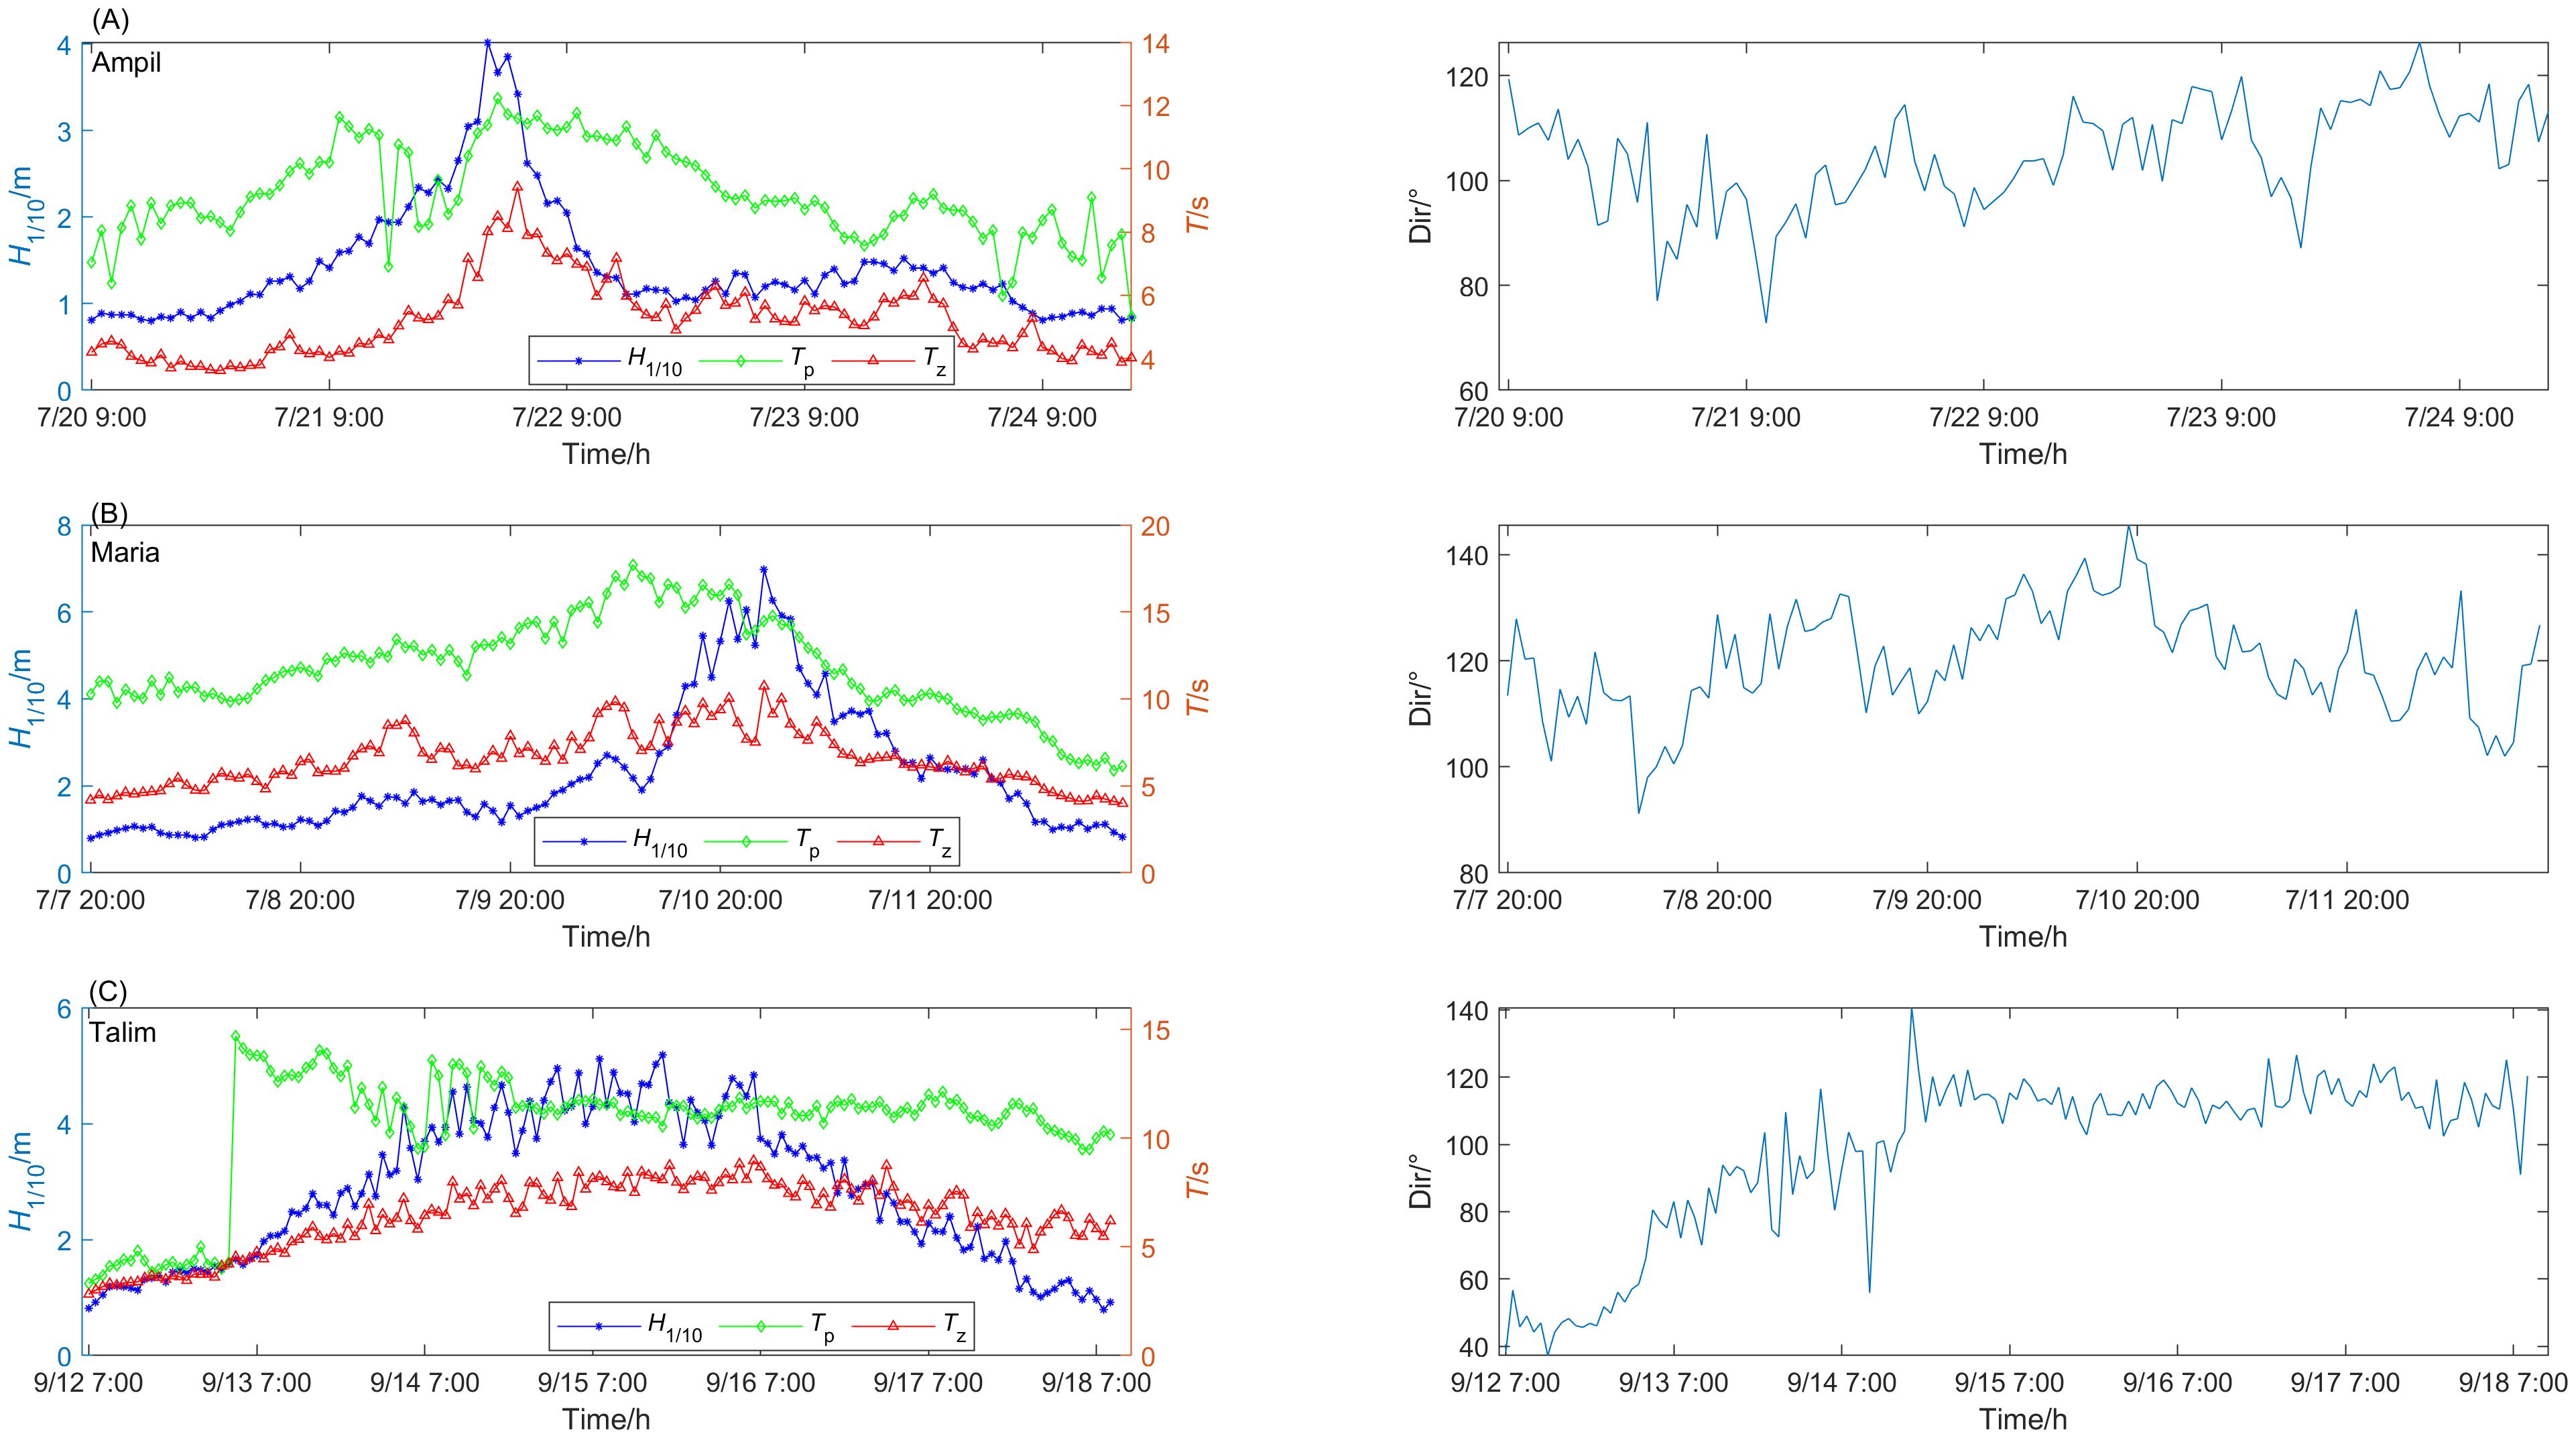
Figure 3. Variation in wave elements during typhoon waves (panels on the left: wave height and period; panels on the right: wave direction). (A) Ampil (No. 201810), (B) Maria (No. 201808), (C) Talim (No. 201718).
Maria (No. 201808), a super typhoon, made landfall in Fujian Province south of the study area with the intensity of a severe typhoon. H1/10 of the wave process varied between 1.0 and 2.0 m in the early stage, increased to 6.0 m on 10 July 2018, and reached a maximum of 6.97 m at 4:00 on 11 July 2018 (Figure 3B). Tp and Tz showed similar trends, showing an initial increase and subsequent decrease. Throughout the rough-wave stage on 10 July 2018, the two parameters exceeded 10.0 s, with a maximum of 17.7 s. The wave direction varied over time and was generally ESE and SE.
Talim (No. 201718), a super typhoon, moved through the East China Sea east of the study area with the intensity of a super typhoon. H1/10 of the wave process exhibited a clear trend characterized by an initial increase followed by a decrease. The maximum H1/10 was 5.18 m, and occurred at 17:00 on 15 September 2017 (Figure 3C). Tz also exhibited an initial increase followed by a decrease; however, the extent of change was smaller compared with that for wave height. Tp increased abruptly during the early stage and then decreased gradually. Tp was sustained at approximately 4.0 s when H1/10 was smaller than 1.5 m and above 10 s, reaching a maximum of 14.7 s. The wave direction changed from NE to E.
The wave direction of each cyclone process was related to its track. The cyclones making landfall in the northern side of the study area were dominated by waves in the E and ESE directions. The cyclones making landfall in the southern side of the study area generated waves in the E and ESE directions as well as in the NE, ENE, and SE directions. For example, Super Typhoon Megi (No. 201617) was dominated by waves in the SE direction, while the wave directions of Meranti (No. 201614) and Mangkhut (No. 201822) varied from NE clockwise to ESE. The wave direction of Yagi (No. 201814), whose track was closest to the study area, varied from ENE to E and finally to ESE. The cyclones passing through the East China Sea were dominated by waves in the E and ESE directions. Waves also occurred in the NE, ENE, and SE directions. Overall, the wave direction exhibited complex trends. For example, the wave direction of Malakas (No. 201616) varied from SE counterclockwise to ENE and the wave direction of Prapiroon (No. 201807) varied from SE and ESE to E and ESE. These waves varied in a direction opposite to that of Talim (No. 201718).
Overall, H1/10 and Tz of the typhoon wave processes exhibited trends characterized by an increase followed by a decrease. In addition, a large wave height was accompanied by a large mean wave period. The intensity and track of a typhoon had a remarkable impact on wave height. Typhoons with a larger intensity and track closer to the study area generated larger wave height in the study area. Typhoon Maria (No. 201808), which had a track close to the station in the study area and passed it as a sever typhoon, generated a much larger wave height compared with those of other typhoons. Severe Tropical Storm Yagi (No. 201814) made landfall closest to the station; however, it had smaller maximum wave height (6.63 m) and maximum mean period (6.7 s) compared with those of Maria (No. 201808) (Figure 2). Overall, most cyclones were dominated by waves in the E and ESE directions.
3.3 Regression analysis of wave parameters
3.3.1 Characteristic wave heights
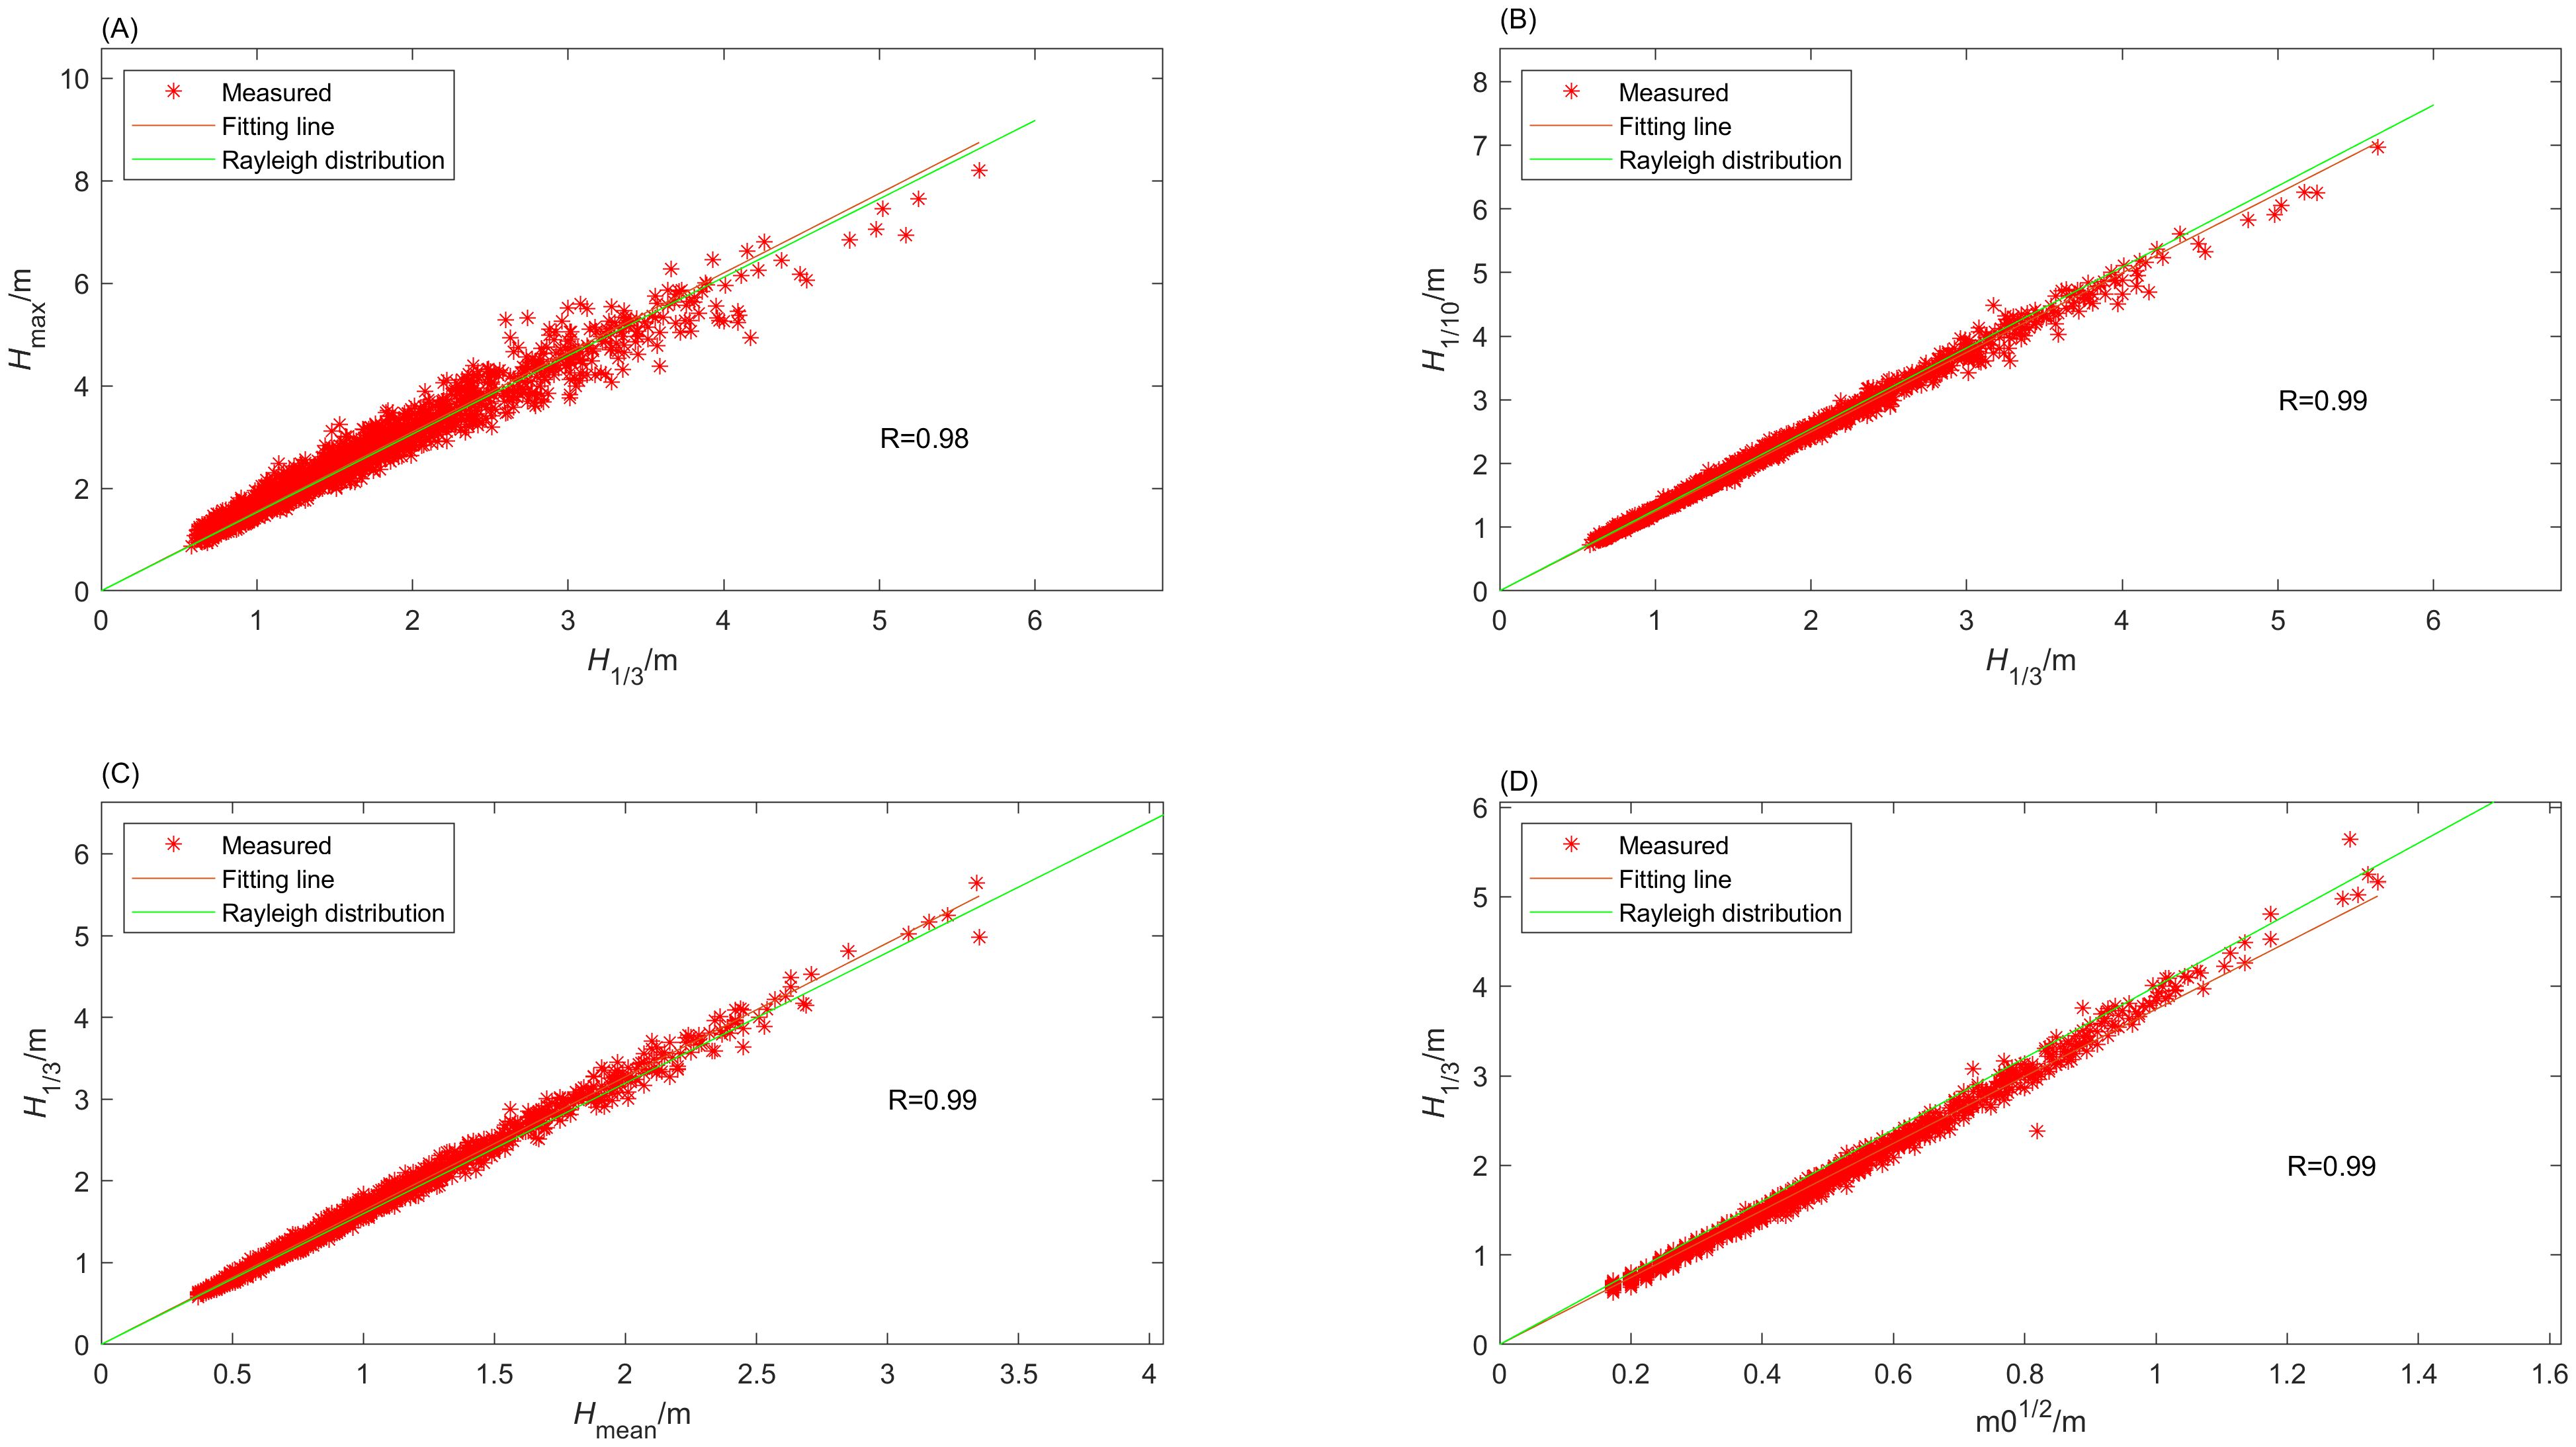
According to the Rayleigh distribution, there were linear relationships between characteristic wave heights. The ratios of Hmax/H1/3, H1/10/H1/3, and H1/3/Hmean were equal to 1.530, 1.272, and 1.598, respectively. However, the ratios between the observed wave heights differed from the theoretical values. The above ratios obtained from the fitting of the observation data set were 1.551, 1.249, and 1.637, respectively. The correlations were strong, with correlation coefficients of 0.98, 0.99, and 0.99, respectively (Figure 4). These ratios are inconsistent with theoretical values because of the shallow water effects (Kumar et al., 2010).
For deep water narrow spectrum, significant wave height . However, the significant wave height calculated from the zero-crossing statistical analysis of wave observations is usually less than four times the square root of the zeroth-order moment. Goda (2012) obtained a coefficient 3.8 for deep-water wind seas based on observations. For shallow sea waters, the following have been reported: coefficients of 3.75 (Yang et al., 2014) based on one year of wave observations in the south part of the radial sand ridges of the Southern Yellow Sea, Jiangsu (water depth: 10 m; significant wave height: 0.59 m), 3.57 (Yang et al., 2017) for the northeastern Zhoushan Islands sea area (water depth: 43 m; significant wave height: 1.12 m), and 3.50 (Zhou et al., 2023) for the Sanmen Bay sea area. The coefficient in this study was obtained by fitting the typhoon wave observations and determined as 3.74, with a correlation coefficient of 0.99 (Figure 4).
3.3.2 Characteristic wave periods
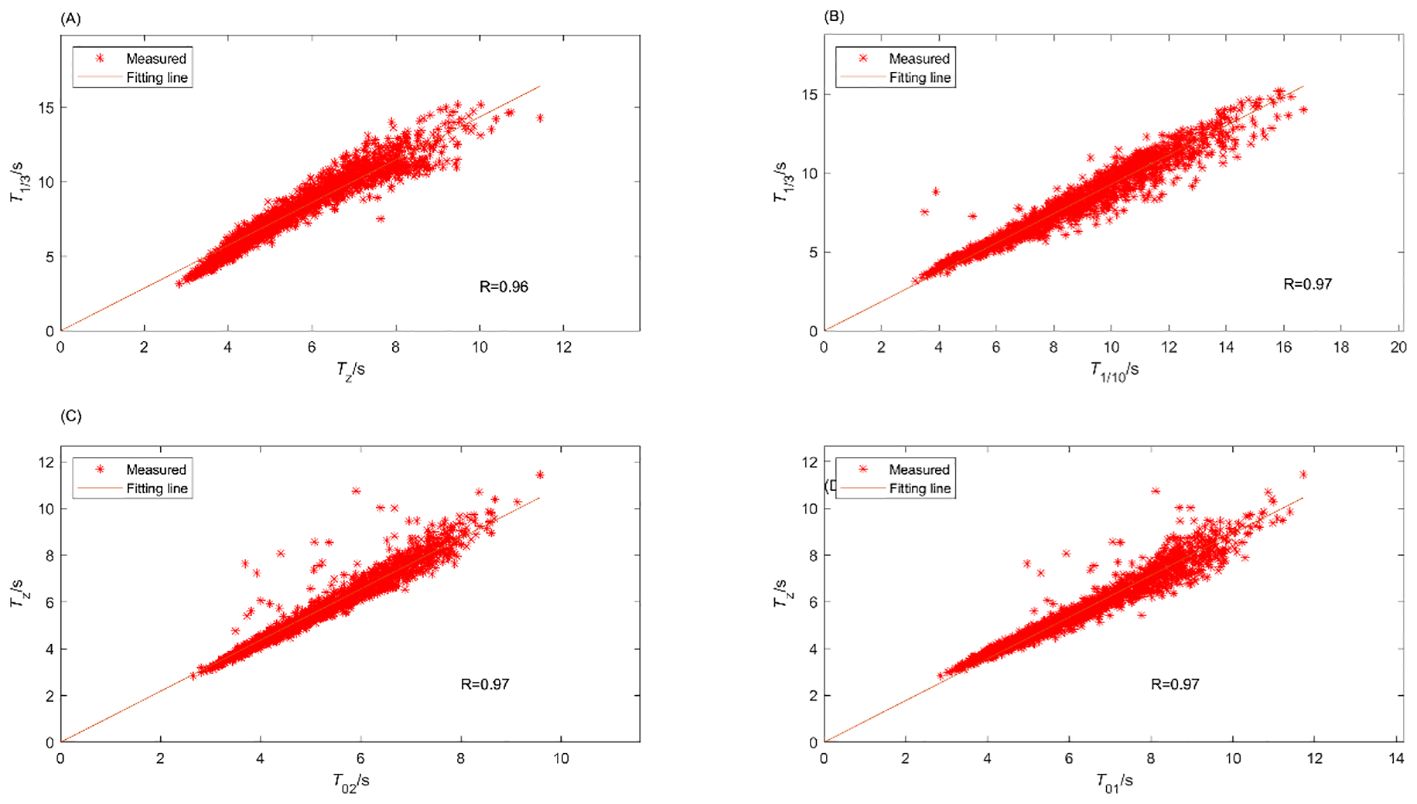
The characteristic wave periods of the sea areas differed. The ratios between the mean periods were T1/3/Tz = 1.436 (R = 0.96), T1/3/T1/10 = 0.929 (R = 0.97), Tz/T02 = 1.093 (R = 0.97), and Tz/T01 = 0.892 (R = 0.97) (Figure 5). Overall, T02 < Tz < T01. For deep waters, Tz ≈ T01, and T01 was directly proportional to m0/m1. These ratios differed between coastal shallow waters and offshore deep waters, as the coastal shallow waters were subjected to the complex impact of waves propagating from deep waters. Compared with the scatter plots for wave heights, most of the scatter plots for wave periods exhibited a larger dispersion.
3.4 Analysis of wave spectra
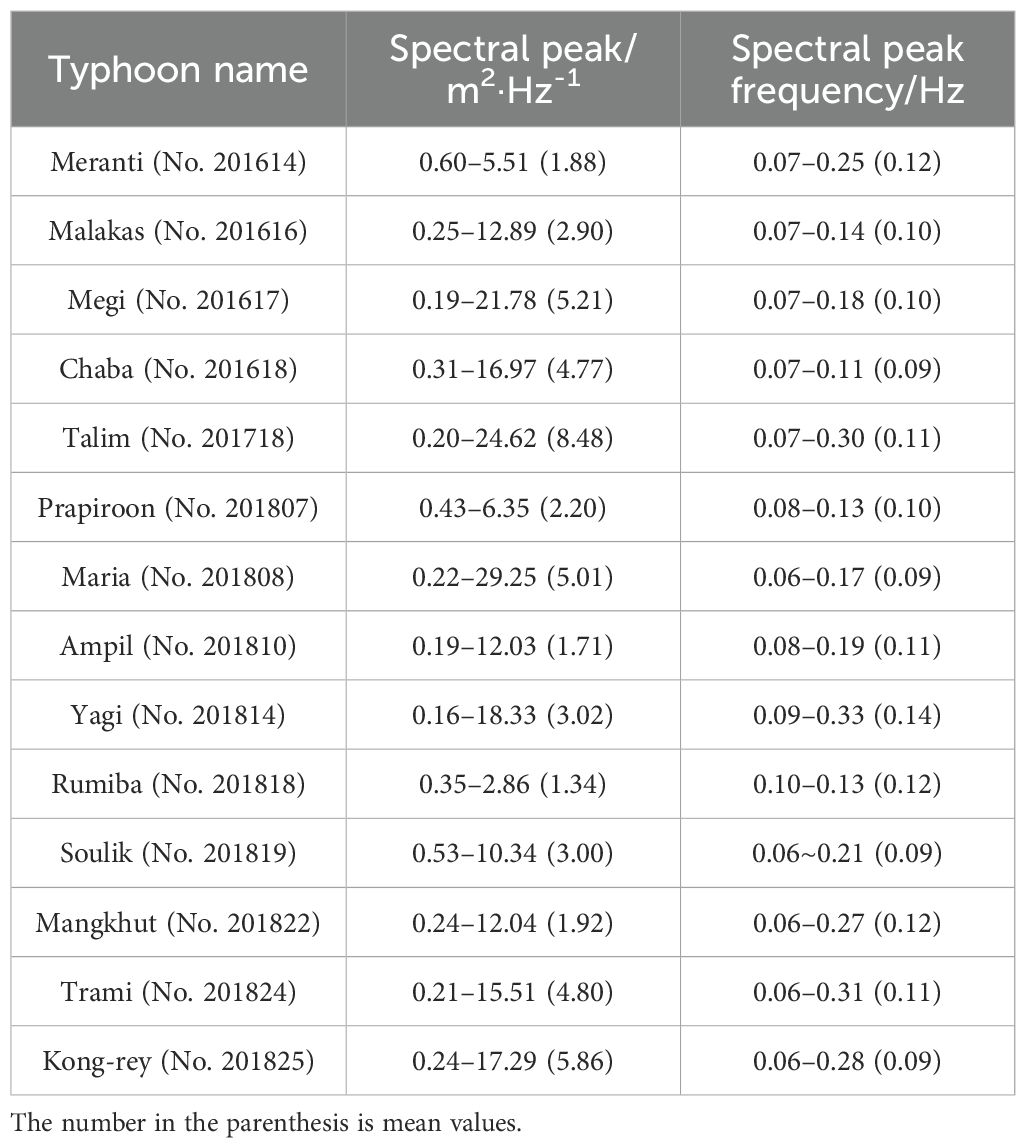
A statistical analysis of the typhoon wave processes in the study area showed that the wave spectra contained a single peak or two peaks (Figure 6), but single-peak spectra were dominant, with an occurrence frequency of 92.33%. The spectral peak values of the typhoon waves varied considerably. The maximum spectral peak value occurred during the Maria (No. 201808) typhoon wave process, i.e., 29.25 m2/Hz (Table 5), when the typhoon hit the area with the intensity of a severe typhoon and moved in the NE direction at a distance of approximately 380 km from the center of the typhoon to the observation station. Single-peak typhoon waves contained similar spectral peak frequencies (with a mean of approximately 0.10 Hz) and the spectral peak value was bigger than that of the double-peak spectra (Tables 5, 6). Double-peak typhoon waves contained relatively concentrated low- and high-frequency spectral peak frequencies that were concentrated at approximately 0.10 and 0.22 Hz, respectively (Table 6).
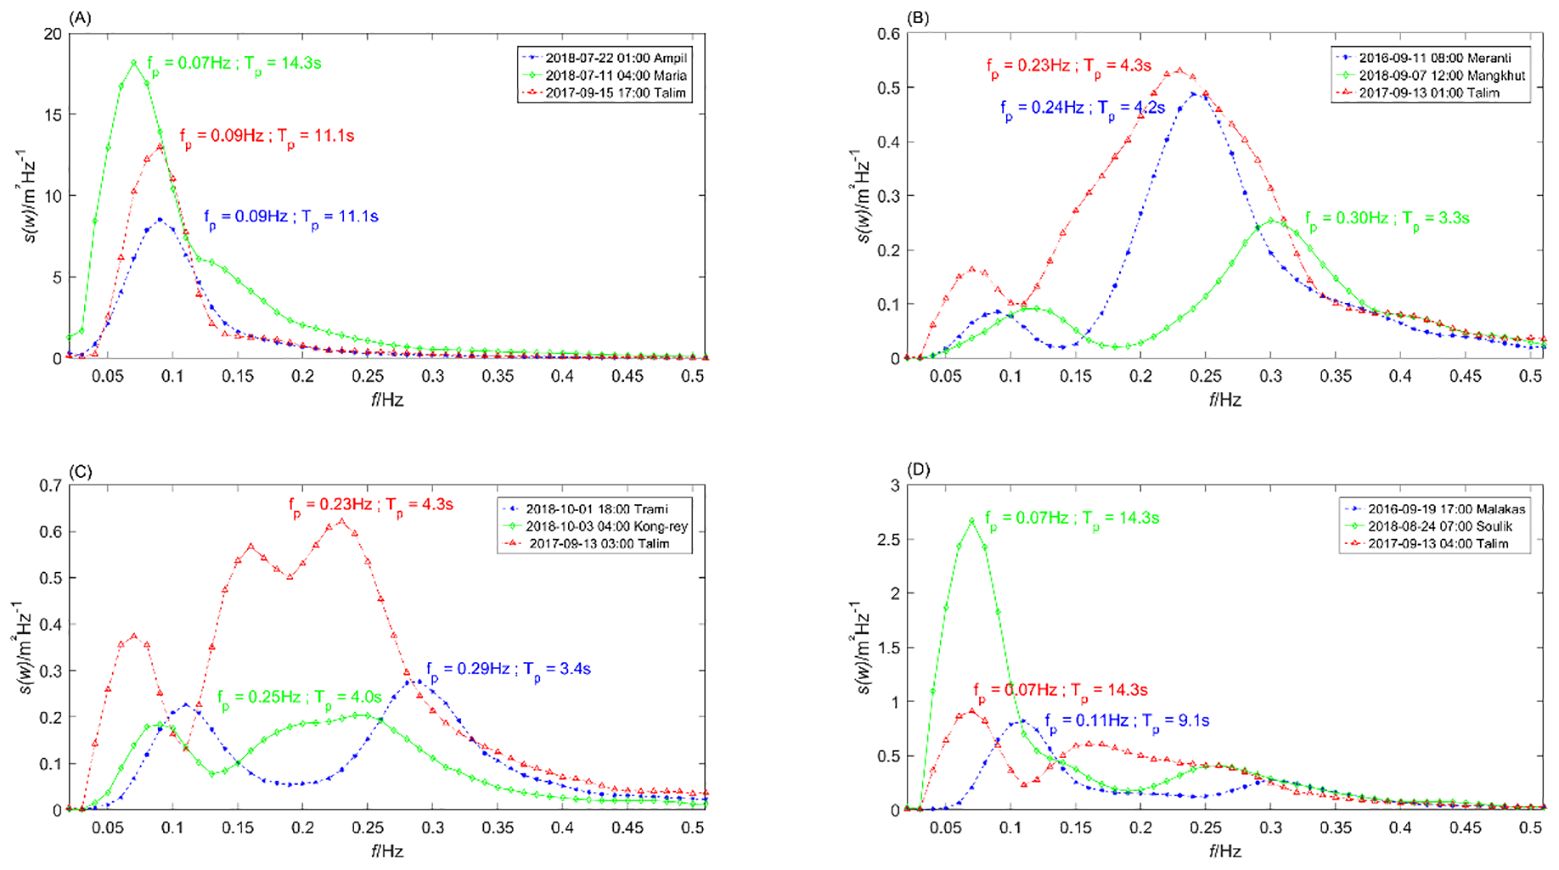
Figure 6. Four types of frequency spectrum occurring during typhoon wave processes: (A) single-peak frequency spectrum, (B) high frequency dominated double-peak spectrum, (C) double-peak spectrum with comparable high and low frequency, (D) low frequency dominated double-peak spectrum.
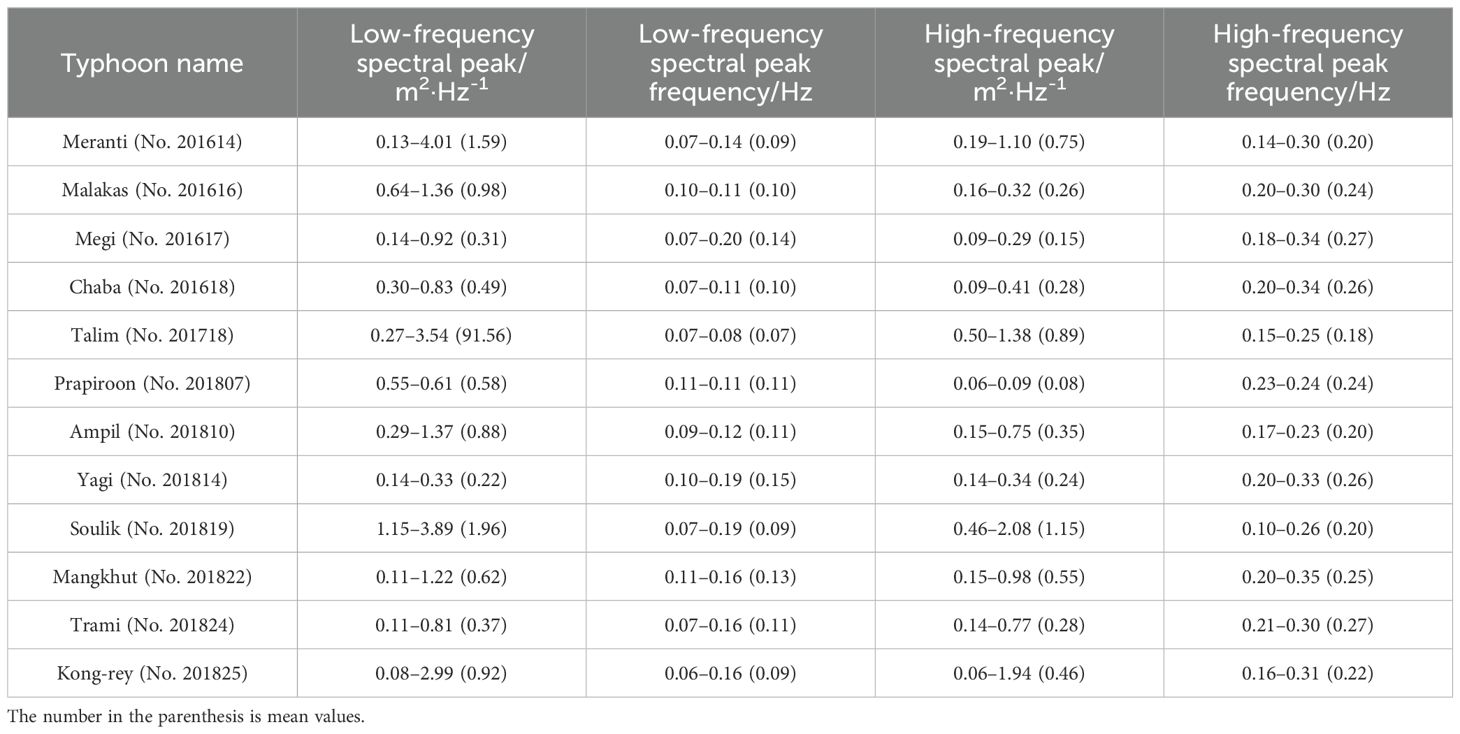
Table 6. Range and average values for double-peaked spectral energy and peak frequency for 12 typhoon wave processes.
Cyclones with a stronger intensity generated a lower spectral peak frequency in the study area due to the long-period swells generated by the cyclone propagating to the study area. Low-intensity tropical cyclones, such as Ampil (No. 201810), Yagi (No. 201814), and Rumiba (No. 201818) with the intensity of tropical storms, generated a minimum spectral peak frequency of 0.08–0.1 Hz in the study area. Cyclones with the intensity of a typhoon, severe typhoon, or super typhoon generated a minimum spectral peak frequency of 0.06–0.08 Hz in the study area (Table 5).
The spectrum peak frequency variation of typhoon wave process is relatively complex, and there is no obvious single factor to represent it. During the impact of Severe Tropical Storm Ampil (No.201810), the larger wave spectrum was located at approximately 0.08 Hz, the spectral peak frequency varied considerably (between 0.08 and 0.19 Hz), and the spectrum peak value reached 12.03 m2/Hz when the distance between the center of the typhoon and study area reached the smallest value of approximately 230 km (Figure 7A). During the impact of Super Typhoon Maria (No. 201808), the wave spectrum in the study area was large in the frequency range of 0.06–0.13 Hz, and it reached a maximum of 29.2 m2/Hz at a frequency of 0.06 Hz (Figure 7B). In addition, the spectral peak frequencies of Meranti (No. 201614), Yagi (No. 201814), Soulik (No. 201819), Mangkhut (No. 201822), Trami (No. 201824), and Kong-rey (No. 201825) varied considerably. During the impact of Super Typhoon Talim (No. 201718), the wave spectrum was large at frequencies of approximately 0.08 Hz. Due to the long persistence of Talim (No. 201718) in the East China Sea, the spectral peak frequency varied insignificantly during the rough-wave stage (Figure 7C). During the impact of Malakas (No. 201616), Megi (No. 201617), Chaba (No. 201618), Prapiroon (No. 201807), Maria (No. 201808), Ampil (No. 201810), and Rumiba (No. 201818), the spectral peak frequency did not vary significantly.
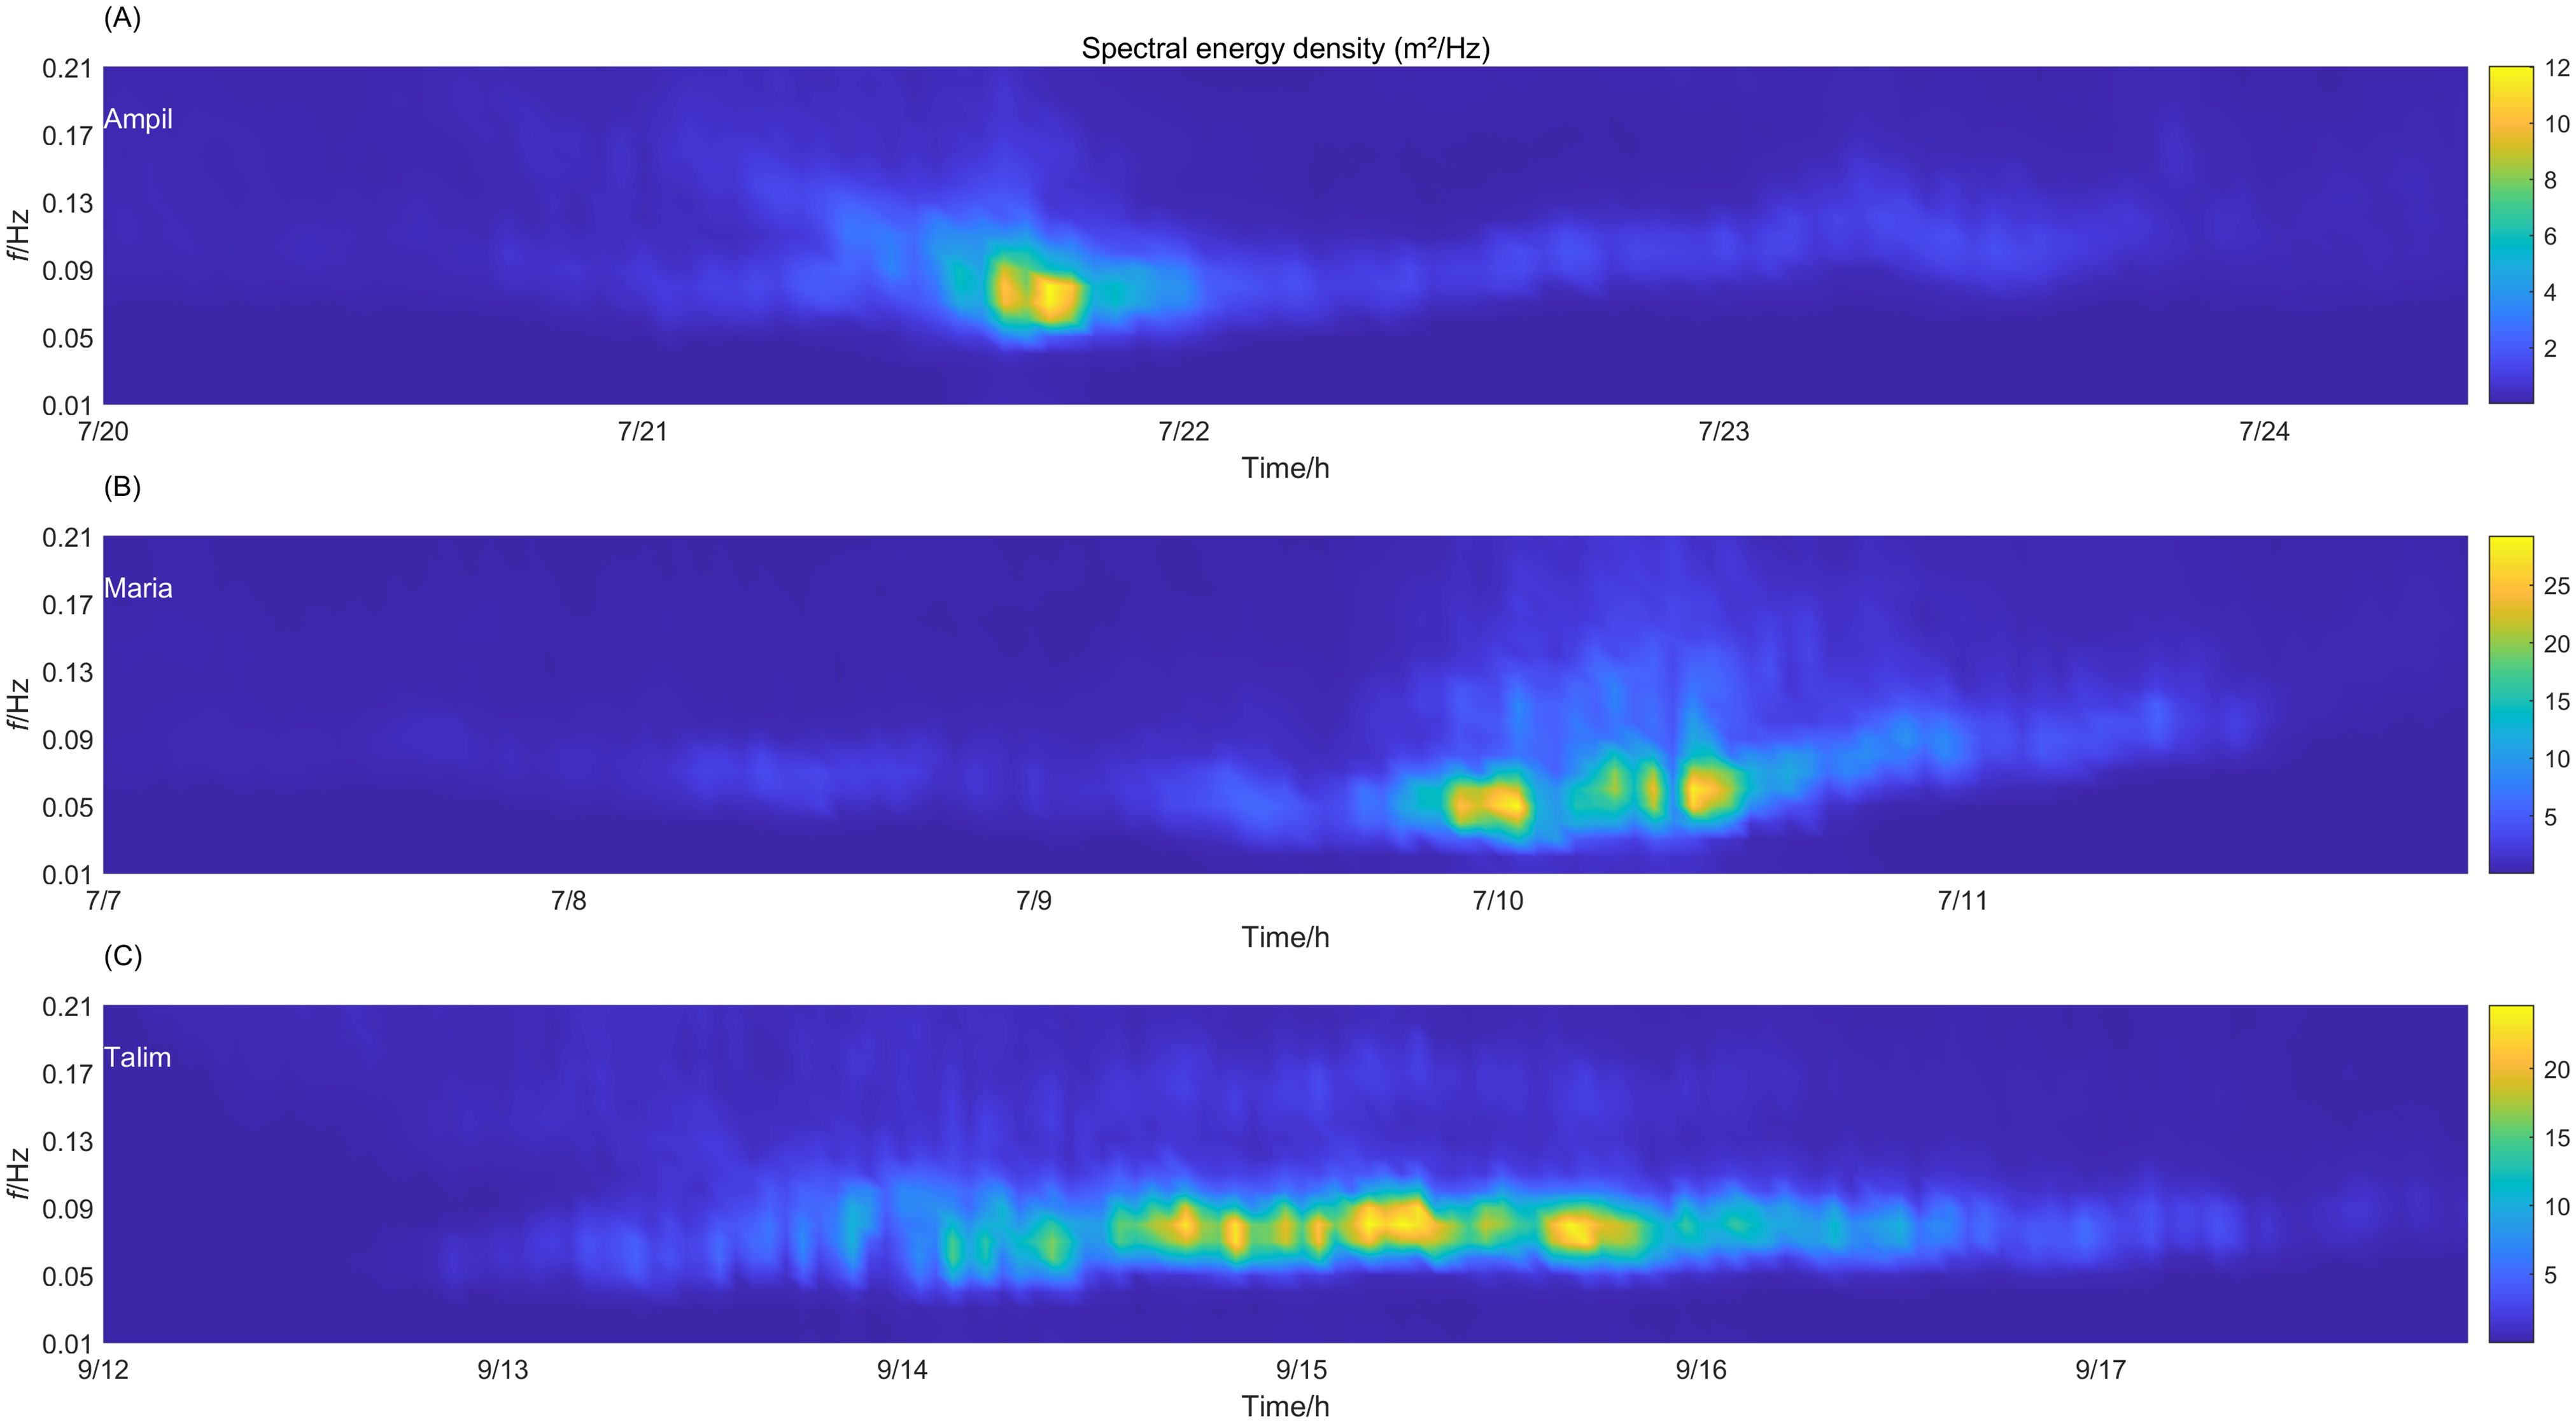
Figure 7. Spectral energy densities during the impact of typhoons: (A) Ampil (No. 201810), (B) Maria (No. 201808), (C) Talim (No. 201718).
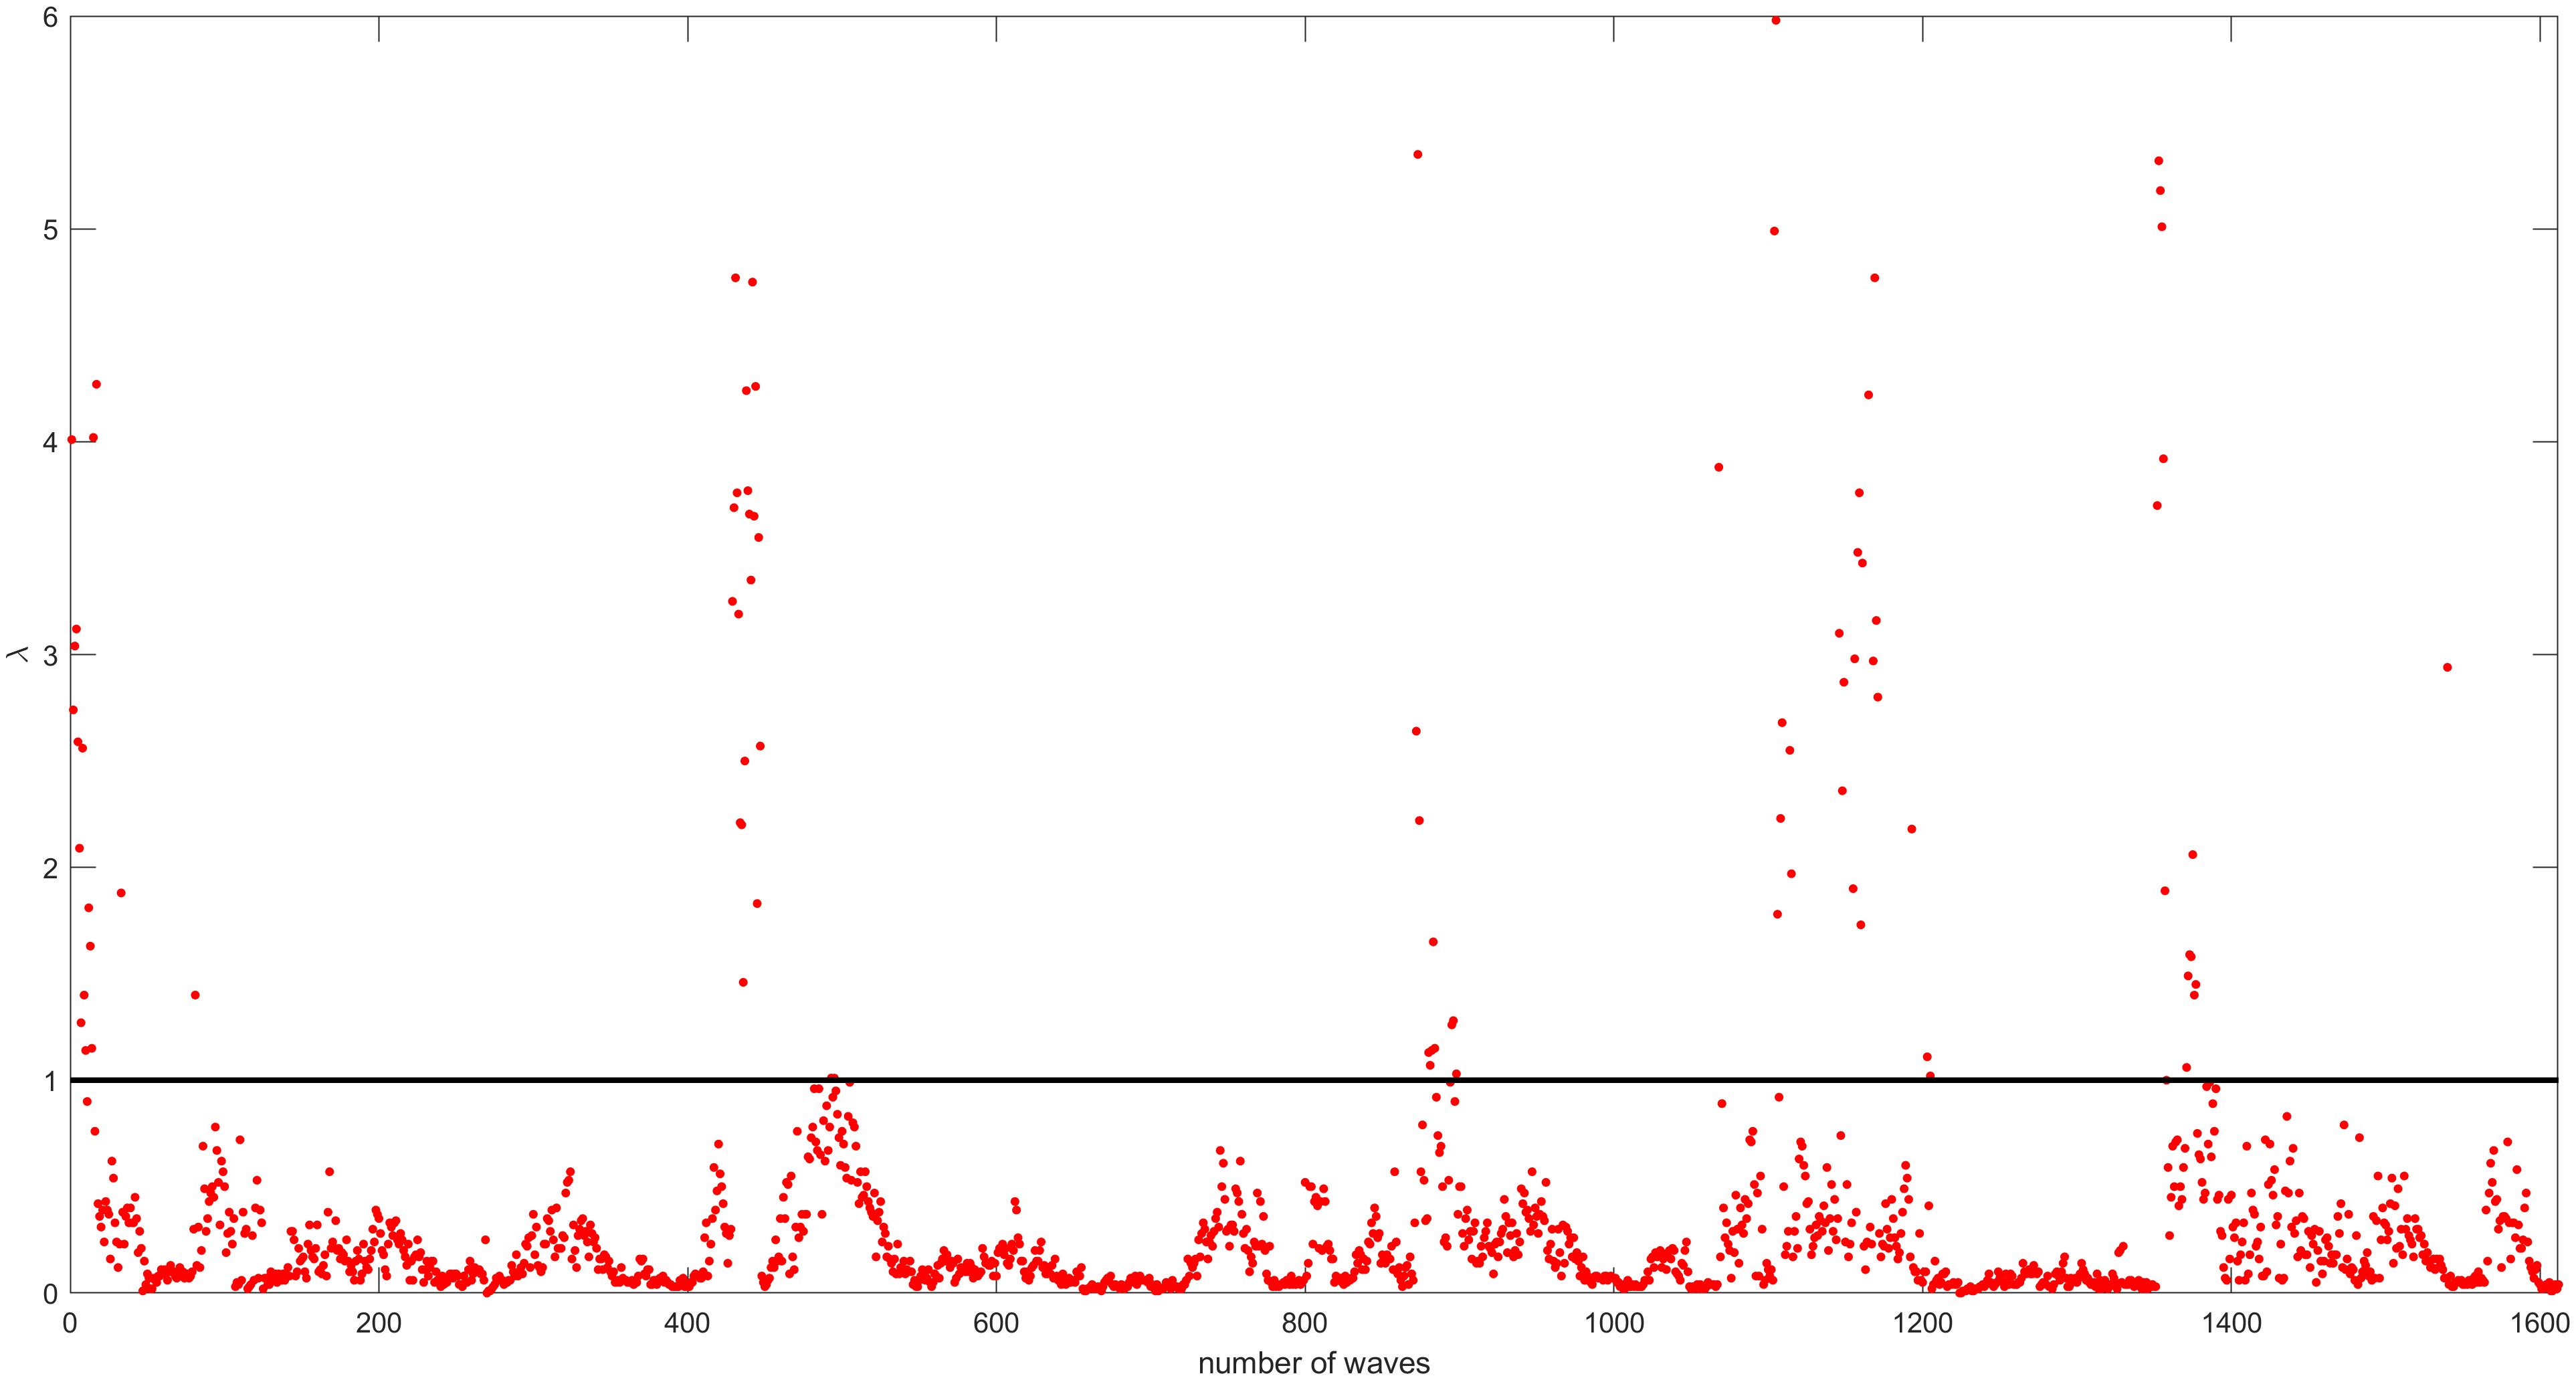
We also distinguished between wind seas and swells using the methods proposed by Portilla et al. (2009), who defined a coefficient as the ratio λ of the measured wave spectrum and the P-M spectrum at the spectral peak, which can be written as follows,
where SPM(fp) has the following basic form,
in which g is gravitational acceleration. The wave is a wind sea if λ > 1 and a swell otherwise. Figure 8 shows the variation in λ during all the typhoon wave processes. The wave processes induced by the 14 typhoon waves were dominated by swells at an occurrence ratio of 94.54%. For double-peak wave spectra, the low-frequency components corresponded to swells, while the high-frequency spectral peaks mostly corresponded to wind seas.
4 Conclusions
1. The central ZCA was impacted by 14 tropical cyclones during the three-year period of 2016–2018. Maria (No. 201808) generated the largest wave height: maximum H1/10 = 6.97 m, maximum Hmax = 8.20 m, maximum Tz = 10.7 s.
2. The cyclones landing on the northern side of the study area generated waves mainly in E and ESE directions. The cyclones landing on the southern side of the study area generated waves mainly in E, ESE, and SE directions, while the wave direction of some cyclones varied from NE clockwise to ESE. The cyclones passing through the East China Sea exhibited complex variations, varying between E and ESE overall.
3. The characteristic wave heights exhibited good linear relationships that followed the Rayleigh distribution. Some characteristic periods were also strongly correlated. However, the scatter plots for the characteristic wave periods showed greater dispersion than that for the characteristic wave heights. Overall, T02 < Tz < T01 in the study area, which differs from the offshore deep water where Tz ≈ T01.
4. The intensity of the cyclones had a significant impact on the spectral peak frequency in the study area. A larger cyclone intensity generally led to a lower spectral peak frequency. By contrast, the track of the cyclones had an insignificant impact on the wave spectrum in the study area. The wave spectra during the impact of the 14 cyclone processes mostly contained single-peaks and had a spectral peak frequency of approximately 0.1 Hz. The wave processes were dominated by swells.
Data availability statement
The raw data supporting the conclusions of this article will be made available by the authors, without undue reservation.
Author contributions
ZY: Conceptualization, Data curation, Formal analysis, Investigation, Methodology, Software, Writing – original draft, Writing – review & editing. QY: Investigation, Software, Writing – original draft, Writing – review & editing. BY: Funding acquisition, Methodology, Validation, Writing – original draft, Writing – review & editing. WS: Investigation, Software, Writing – original draft. JZ: Project administration, Resources, Supervision, Writing – original draft.
Funding
The author(s) declare financial support was received for the research, authorship, and/or publication of this article. This research was funded by the Joint Funds of the Zhejiang Provincial Natural Science Foundation of China (No. ZJWZ23E090009), and the Open Fund of Key Laboratory of Ocean Space Resource Management Technology, MNR, Zhejiang Province, China (No. KF-2022-110).
Acknowledgments
We would like to thank Editage (www.editage.cn) for the English language editing.
Conflict of interest
The authors declare that the research was conducted in the absence of any commercial or financial relationships that could be construed as a potential conflict of interest.
Publisher’s note
All claims expressed in this article are solely those of the authors and do not necessarily represent those of their affiliated organizations, or those of the publisher, the editors and the reviewers. Any product that may be evaluated in this article, or claim that may be made by its manufacturer, is not guaranteed or endorsed by the publisher.
References
Anjali Nair M., Amrutha M. M., Kumar V. S. (2022). Spectral wave characteristics in the coastal waters of the central west coast of India during tropical cyclone Kyarr. Ocean Dynamics 72, 151–168. doi: 10.1007/s10236-022-01496-x
Feng X. R., Yang D. Z., Yin B. S., Li M. J. (2018). The change and trend of the typhoon waves in Zhejiang and Fujian coastal areas of China. Oceanologia Limnologia Sinica 49, 233–241. doi: 10.11693/hyhz20180200036
Goda Y. (2012). Random Seas and Design of Maritime Structures (Singapore: World Scientific Pub Co Inc), 39–43.
Holthuijsen L. H. (2007). Waves in Oceanic and Coastal Waters (New York: Cambridge University Press). doi: 10.2277/0521860288
Huan C. Y. (2023). Analysis of measured wave parameters and typical typhoon wave characteristics in the Dongji Islands sea area of Zhejiang Province. Ocean Engineering 42, 148–156. doi: 10.16483/j.issn.1005-9865.2024.02.013
Jiang L. L., Yao R. S., Wang Y., Tu X. P. (2024). Analysis of typhoon wave characteristics on the sea surface of Zhejiang coastal area based on buoy stations and ERA5 reanalysis data. J. Ocean Technol. 43, 1–9. doi: 10.3969/j.issn.1003-2029.2024.01.001
Kumar V. S., Anusree A. (2023). High waves measured during tropical cyclones in the coastal waters of India. Ocean Eng. 289, 1–16. doi: 10.1016/j.oceaneng.2023.116124
Kumar V. S., Philip C. S., Nair T. N. B. (2010). Waves in shallow water off west coast of India during the onset of summer monsoon. Annales Geophysicae 28, 817–824. doi: 10.1007/s00376-020-0211-7
Lu X. Q., Yu H., Ying M., Zhao B. K., Zhang S., Lin L. M., et al. (2021). Western North Pacific tropical cyclone database created by the China Meteorological Administration. Adv. Atmos. Sci. 38, 690−699. doi: 10.1007/s00376-020-0211-7
Pedersen T., Lohrmann A., Krogstad H. E. (2005). Wave measurements from a subsurface platform (Madrid: proceedings Waves, Madrid), 1–10.
Pedersen T., Nylund S. (2004). Wave height measurements using acoustic surface tracking. 2004 (USA: Baltic International Symposium), 1234−1241. doi: 10.1109/BALTIC.2004.7296806
Portilla J., Ocampo-torres F. J., Monbaliu J. (2009). Spectral partitioning and identification of wind sea and swell. J. Atmospheric Oceanic Technol. 26, 107–122. doi: 10.1175/2008JTECHO609.1
Sun J., Wang Y., Zuo J. C. (2015). Characteristic analysis of typhoon along coastal areas of Jiangsu and Zhejiang provinces. J. Hohai University 43, 215–221. doi: 10.3876/j.issn.1000-1980.2015.03.005
Tao A. F., Shen Z. C., Li S., Xu X., Zhang Y. (2018). Research progress for disastrous waves in China. Sci. Technol. Rev. 36, 26–34. doi: 10.3981/j.issn.1000-7857.2018.14.005
Xia L. Y., Luan S. G., Zhang C. (2014). Wave characteristics of northwest moving path typhoon. J. Dalian Ocean University 6, 654–658. doi: 10.3969/j.issn.2095-1388.2014.06.021
Yang B., Feng W. B., Zhang Y. (2014). Wave characteristics at south part of radial sand ridges of Southern Yellow Sea. China Ocean Engineering 28, 317–330. doi: 10.1007/s13344-014-0026-3
Yang B., Shi W. Y., Ye Q., Zhang Z. L., Yang W. K., Song Z. K. (2017). Characteristics of waves in coastal waters of northeast Zhoushan Island during typhoons. Adv. Water Sci. 28, 106–115. doi: 10.14042/j.cnki.32.1309.2017.01.012
Yang B., Yang Y. F., Yang Z. L., Feng X., Ye Q., Yu L. L., et al. (2021). Wave characteristics in a semi-enclosed offshore windfarm influenced by East Asian monsoon and extreme weather: a study of central Hangzhou Bay, China. Ocean Dynamics 71, 1011–1031. doi: 10.1007/s10236-021-01480-x
Ying M., Zhang W., Yu H., Lu X. Q., Feng J. X., Fan Y. X., et al. (2014). An overview of the China Meteorological Administration tropical cyclone database. J. Atmos. Oceanic Technol. 31, 287–301. doi: 10.1175/JTECH-D-12-00119.1
Zheng L. S., Yu X. P. (2010). Modeling of wind wave in Hangzhou Bay. South-to-north Water Transfers Water Sci. Technol. 8, 128–130. doi: 10.3724/sp.j.1201.2010.03128
Zhou Y., Chen J. C., Zhang J. B., Song Z. K., Pan Y., Yan D. H. (2023). Analysis on characteristics of measured large waves in seas adjacent to Zhejiang. Acta Energiae Solaris Sinica 44, 23–29. doi: 10.19912/j.0254-0096.tynxb.2021-1590
Keywords: central coast of Zhejiang province, typhoon wave, wave characteristics, wave spectra, regression analysis
Citation: Yang Z, Ye Q, Yang B, Shi W and Zhang J (2024) Characteristics of measured typhoon waves on the central coast of Zhejiang province. Front. Mar. Sci. 11:1494107. doi: 10.3389/fmars.2024.1494107
Received: 10 September 2024; Accepted: 26 September 2024;
Published: 09 October 2024.
Edited by:
Kejian Wu, Ocean University of China, ChinaReviewed by:
Shujiang Li, Ministry of Natural Resources, ChinaYl Wei, Shanghai Ocean University, China
Huaming Yu, Ocean University of China, China
Copyright © 2024 Yang, Ye, Yang, Shi and Zhang. This is an open-access article distributed under the terms of the Creative Commons Attribution License (CC BY). The use, distribution or reproduction in other forums is permitted, provided the original author(s) and the copyright owner(s) are credited and that the original publication in this journal is cited, in accordance with accepted academic practice. No use, distribution or reproduction is permitted which does not comply with these terms.
*Correspondence: Bin Yang, OTQ2NDM3NjRAcXEuY29t
 Zhongliang Yang
 Qin Ye
 Bin Yang
 Weiyong Shi
 Junbiao Zhang