- 1Key Laboratory of Marine Geology and Metallogeny, First Institute of Oceanography, Ministry of Natural Resources, Qingdao, China
- 2Laboratory for Marine Geology, Laoshan Laboratory, Qingdao, China
- 3Retired, Soquel, CA, United States
- 4School of Materials Science and Engineering, Shandong University of Technology, Zibo, Shandong, China
- 5Lab of Isotope Marine Chemistry, Xiamen University, Xiamen, Fujian, China
Introduction: Cobalt is the most important critical element in ferromanganese crusts. Co concentration in the Fe-Mn crusts is one of the key parameters for determination of the Co resource. Thus, it is essential to clarify the controls on the variations of Co concentration of ferromanganese crusts.
Methods: To clarify the controls on Co concentration of hydrogenetic nonphosphatized ferromanganese crusts, an equation was deduced based on Fick’s First Law: , and eight potential controls were gleaned from this equation, including dilution, diffusivity of Co ions in seawater (Dsw), temperature which controls the Dsw, Co ion concentration in seawater (Csw), the diffusion distance of Co ions near the interface of seawater and Fe-Mn crusts (δ), thickness of one molecular layer (z), growth rate (GR), and specific surface area of Fe-Mn crusts (Ssp). To constrain the value of Co ion diffusion gradients and consequently verify the proposed equation, we determined the Co concentrations, growth rates, and specific surface area of the outermost layer of Fe-Mn crusts, and calculated diffusivity of Co2+.
Results: The for the Fe-Mn crusts from Caiwei seamount (Magellan seamounts) was determined to be 295-496 pM/mm, which are reasonable for the Co ion concentrations and seawater mixing in the deep ocean.
Discussion: According to the equation established in this study, the trend of decreasing Co concentrations in Fe-Mn crusts with increasing water depth is controlled mainly by dilution and to a lesser extent by seawater Co ion concentration, temperature of seawater, and consequently the diffusivity of Co ions in seawater.
1 Introduction
Cobalt (Co) is the most important critical element in ferromanganese crusts (Fe-Mn crusts) due to the high concentrations, economic value, and application in the manufacture of hybrid and electric car batteries, storage of solar energy, magnetic recording media, high-T super-alloys, supermagnets, and smart phones (Hein et al., 2013). Relative to 2020, it’s estimated by the International Energy Agency that a 21-fold Co supply will be needed by 2040 to achieve the clean energy transition (IEA, 2021). Compared to the land-based reserve of Co, 11 million tons (U. S. Geological Survey, 2024), the tonnage of in place Co in Fe-Mn crusts from the Pacific Prime Crust Zone (PPCZ) is as high as 50 million tons (Hein and Koschinsky, 2014). Land-based Co ores mainly occur in the West African copper belt (D.R. Congo), with a reserve of 6 million tons, which is 55% of the land-based Co reserves (U. S. Geological Survey, 2024). The average grade of the Co ores in the West African copper belt is 0.12% (Milesi et al., 2006). In contrast, the average Co concentration in Fe-Mn crusts in PPCZ is 0.67% (Hein et al., 2013). Although the mining of Fe-Mn crusts is not currently feasible for technological and economic reasons, Fe-Mn crusts are promising future Co ores.
For determination of the Co resource both before and during mining, Co concentration (grade) in the Fe-Mn crusts is one of the key parameters. However, the Co concentrations in Fe-Mn crusts show regional, local, and stratigraphic (depth in the crusts) variations. The average Co concentrations of Fe-Mn crusts from the seamounts in the Pacific range from 0.3% to 0.8% (Hein et al., 2000). Cobalt concentrations of Fe-Mn crusts show a negative correlation with water depth (Cronan, 1977; Halbach et al., 1983; Manheim, 1986; Andreev and Gramberg, 2002; Benites et al., 2023), and the data show a wide range of variations (Andreev and Gramberg, 2002). The average Co concentrations of the stratigraphic sections of the Fe-Mn crusts from the Magellan seamounts range from 0.32% to 0.65% (Melnikov and Pletnev, 2013). Thus, it is essential to clarify the controls on the variations of Co concentration of Fe-Mn crusts to develop criteria for exploration and extraction.
Halbach et al. (1983) suggested that Co-flux is constant over one order of magnitude of Fe-Mn crust growth rates, and consequently concluded that extremely slow growth rates and high Mn concentrations result in high Co concentrations. Based on the growth rate and chemical compositions of Fe-Mn crusts from the mid-Pacific, Manheim (1986) proposed that Co fluxes were roughly constant regardless of the water depth, which indicates that slow growth rates will result in high Co concentration in Fe-Mn crusts. Ren et al.(2022, 2024) proposed that oxidizing deep-water, oligotrophic bottom currents, and low sedimentation rates are optimal for west Pacific Co-rich Fe-Mn nodule formations (similar to Fe-Mn crusts in chemistry and mineralogy) to enrich multiple elements from seawater, including Co. Hein et al. (2000) suggested that the dominant controls on the concentration of elements (including Co) in Fe-Mn crusts include the concentration of the elements in seawater, element-particle reactivity, element residence time in seawater, the absolute and relative amounts of Fe and Mn in Fe-Mn crusts, dilution from detrital and diagenetic minerals, the colloid surface charge and types of complexing agents, the value of x in MnO2-x, dissolved O2 and pH of seawater, specific surface area, and growth rate.
In this work, we analyze the potential controls for Co concentrations in Fe-Mn crusts from the Magellan seamounts, and propose an equation that unites all the factors.
2 Samples and methods
2.1 Sample description
Fe-Mn crusts from two sites are used here. Fe-Mn crust DY31-III-JL-Dive70C (hereafter Fe-Mn crust DY31) was collected by the Chinese submersible Jiaolong in 2013 on Caiwei seamount (Magellan seamounts) (155.5492° E, 15.9246° N) at a water depth of 2270 m. Fe-Mn crust MAD23 was collected by dredge on the R. V. Dayang Yihao in 2006 from Caiwei seamount (155.5284° E, 15.9124° N) at a water depth between 1904 m and 1885 m (Figure 1). Fe-Mn crust DY31 is about 6 cm thick, and the stratigraphic section can be divided into three distinct layers called II-1, II-2 and III (Figure 2). Layer II-1 is the lowermost layer, 1 cm thick, and shows a dendritic texture with dendrite orientation indicating that layer II-1 is an older crust that was turned over before layers II-2 and III were accreted on to it. The overlying layer II-2 is about 2 cm thick, black, and dense, with a dendritic texture composed of short dendrites oriented in the opposite direction to those in layer II-1. Layer III is about 3 cm thick, composed of long, black dendrites. The substrate rock was not recovered. Fe-Mn crust MAD23 is 6.6 cm thick, and the stratigraphic section is divided into three distinct layers from the bottom to the surface: I-1, II and III. Layer I-1 is 1.2 cm thick, dense, and black, with a laminated texture; layer II is 3.2 cm thick, dendritic, and varies from the compact to friable; layer III is 2.2 cm thick, black, and compact, with a dendritic texture (Figure 2).
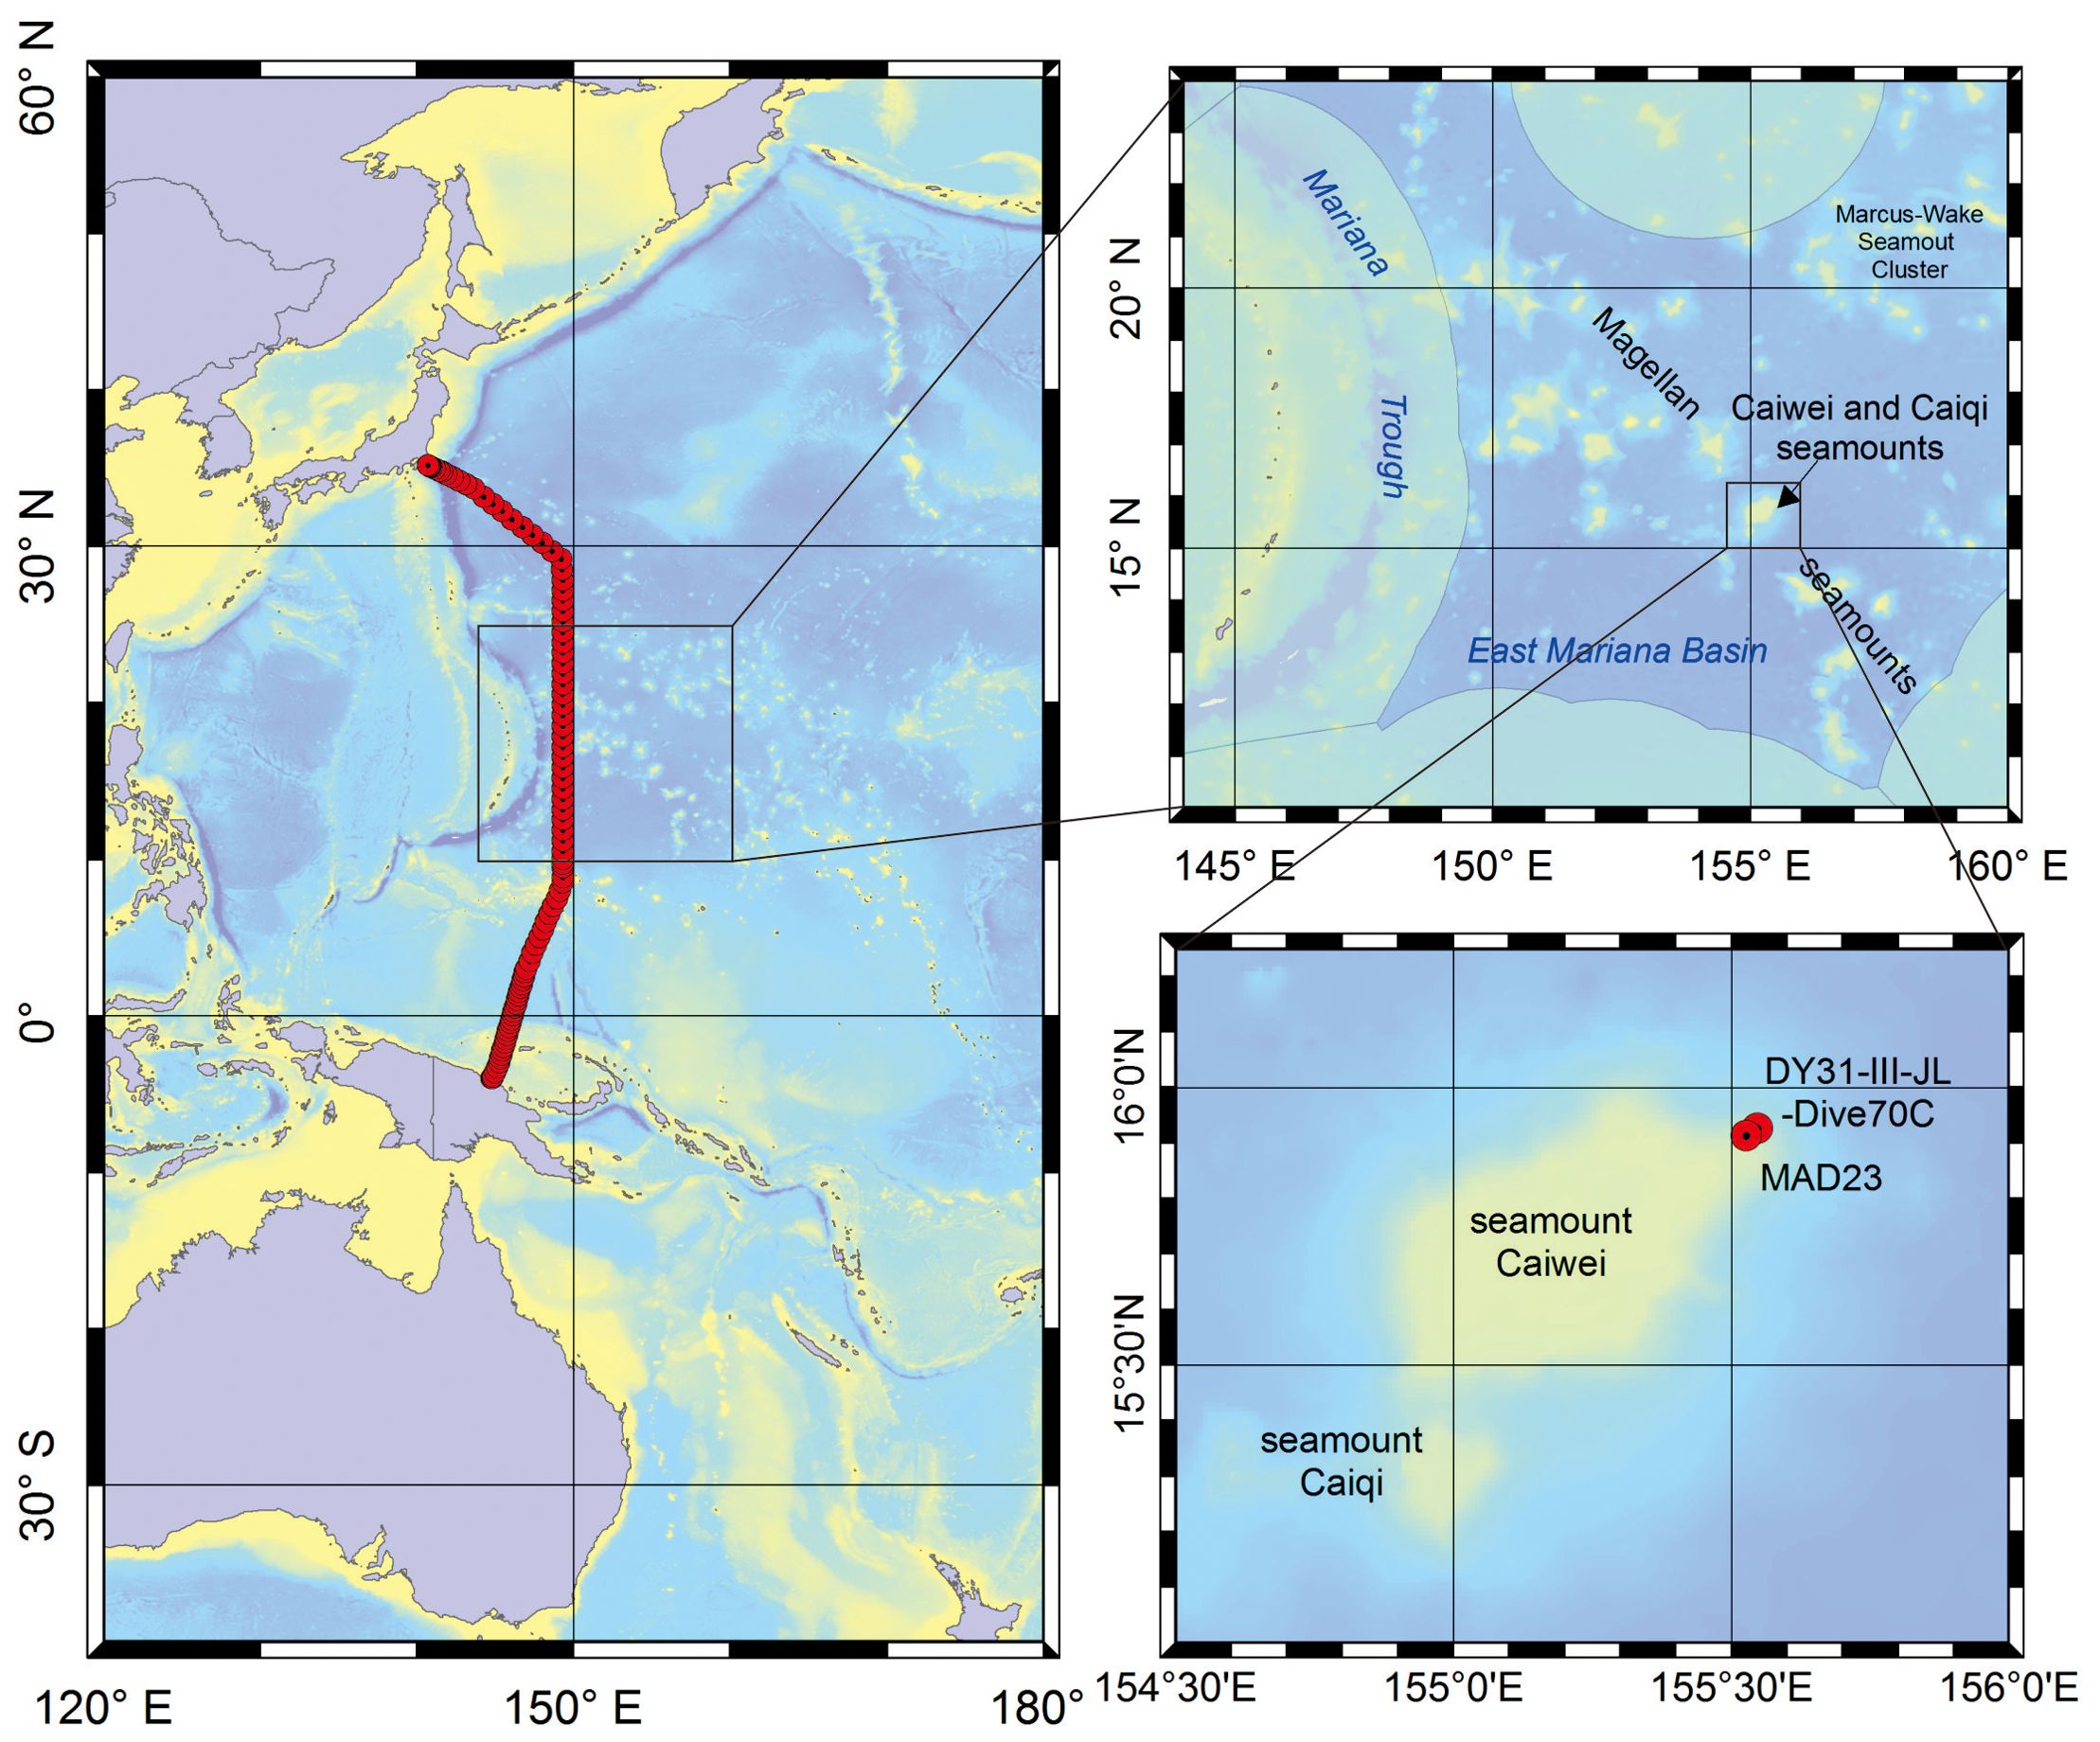
Figure 1. Left map, location of World Ocean Circulation Experiment (WOCE) P10 transect (red line); right top map, location of Caiwei seamount; and right bottom map, sampling sites of Fe-Mn crusts (red circles).
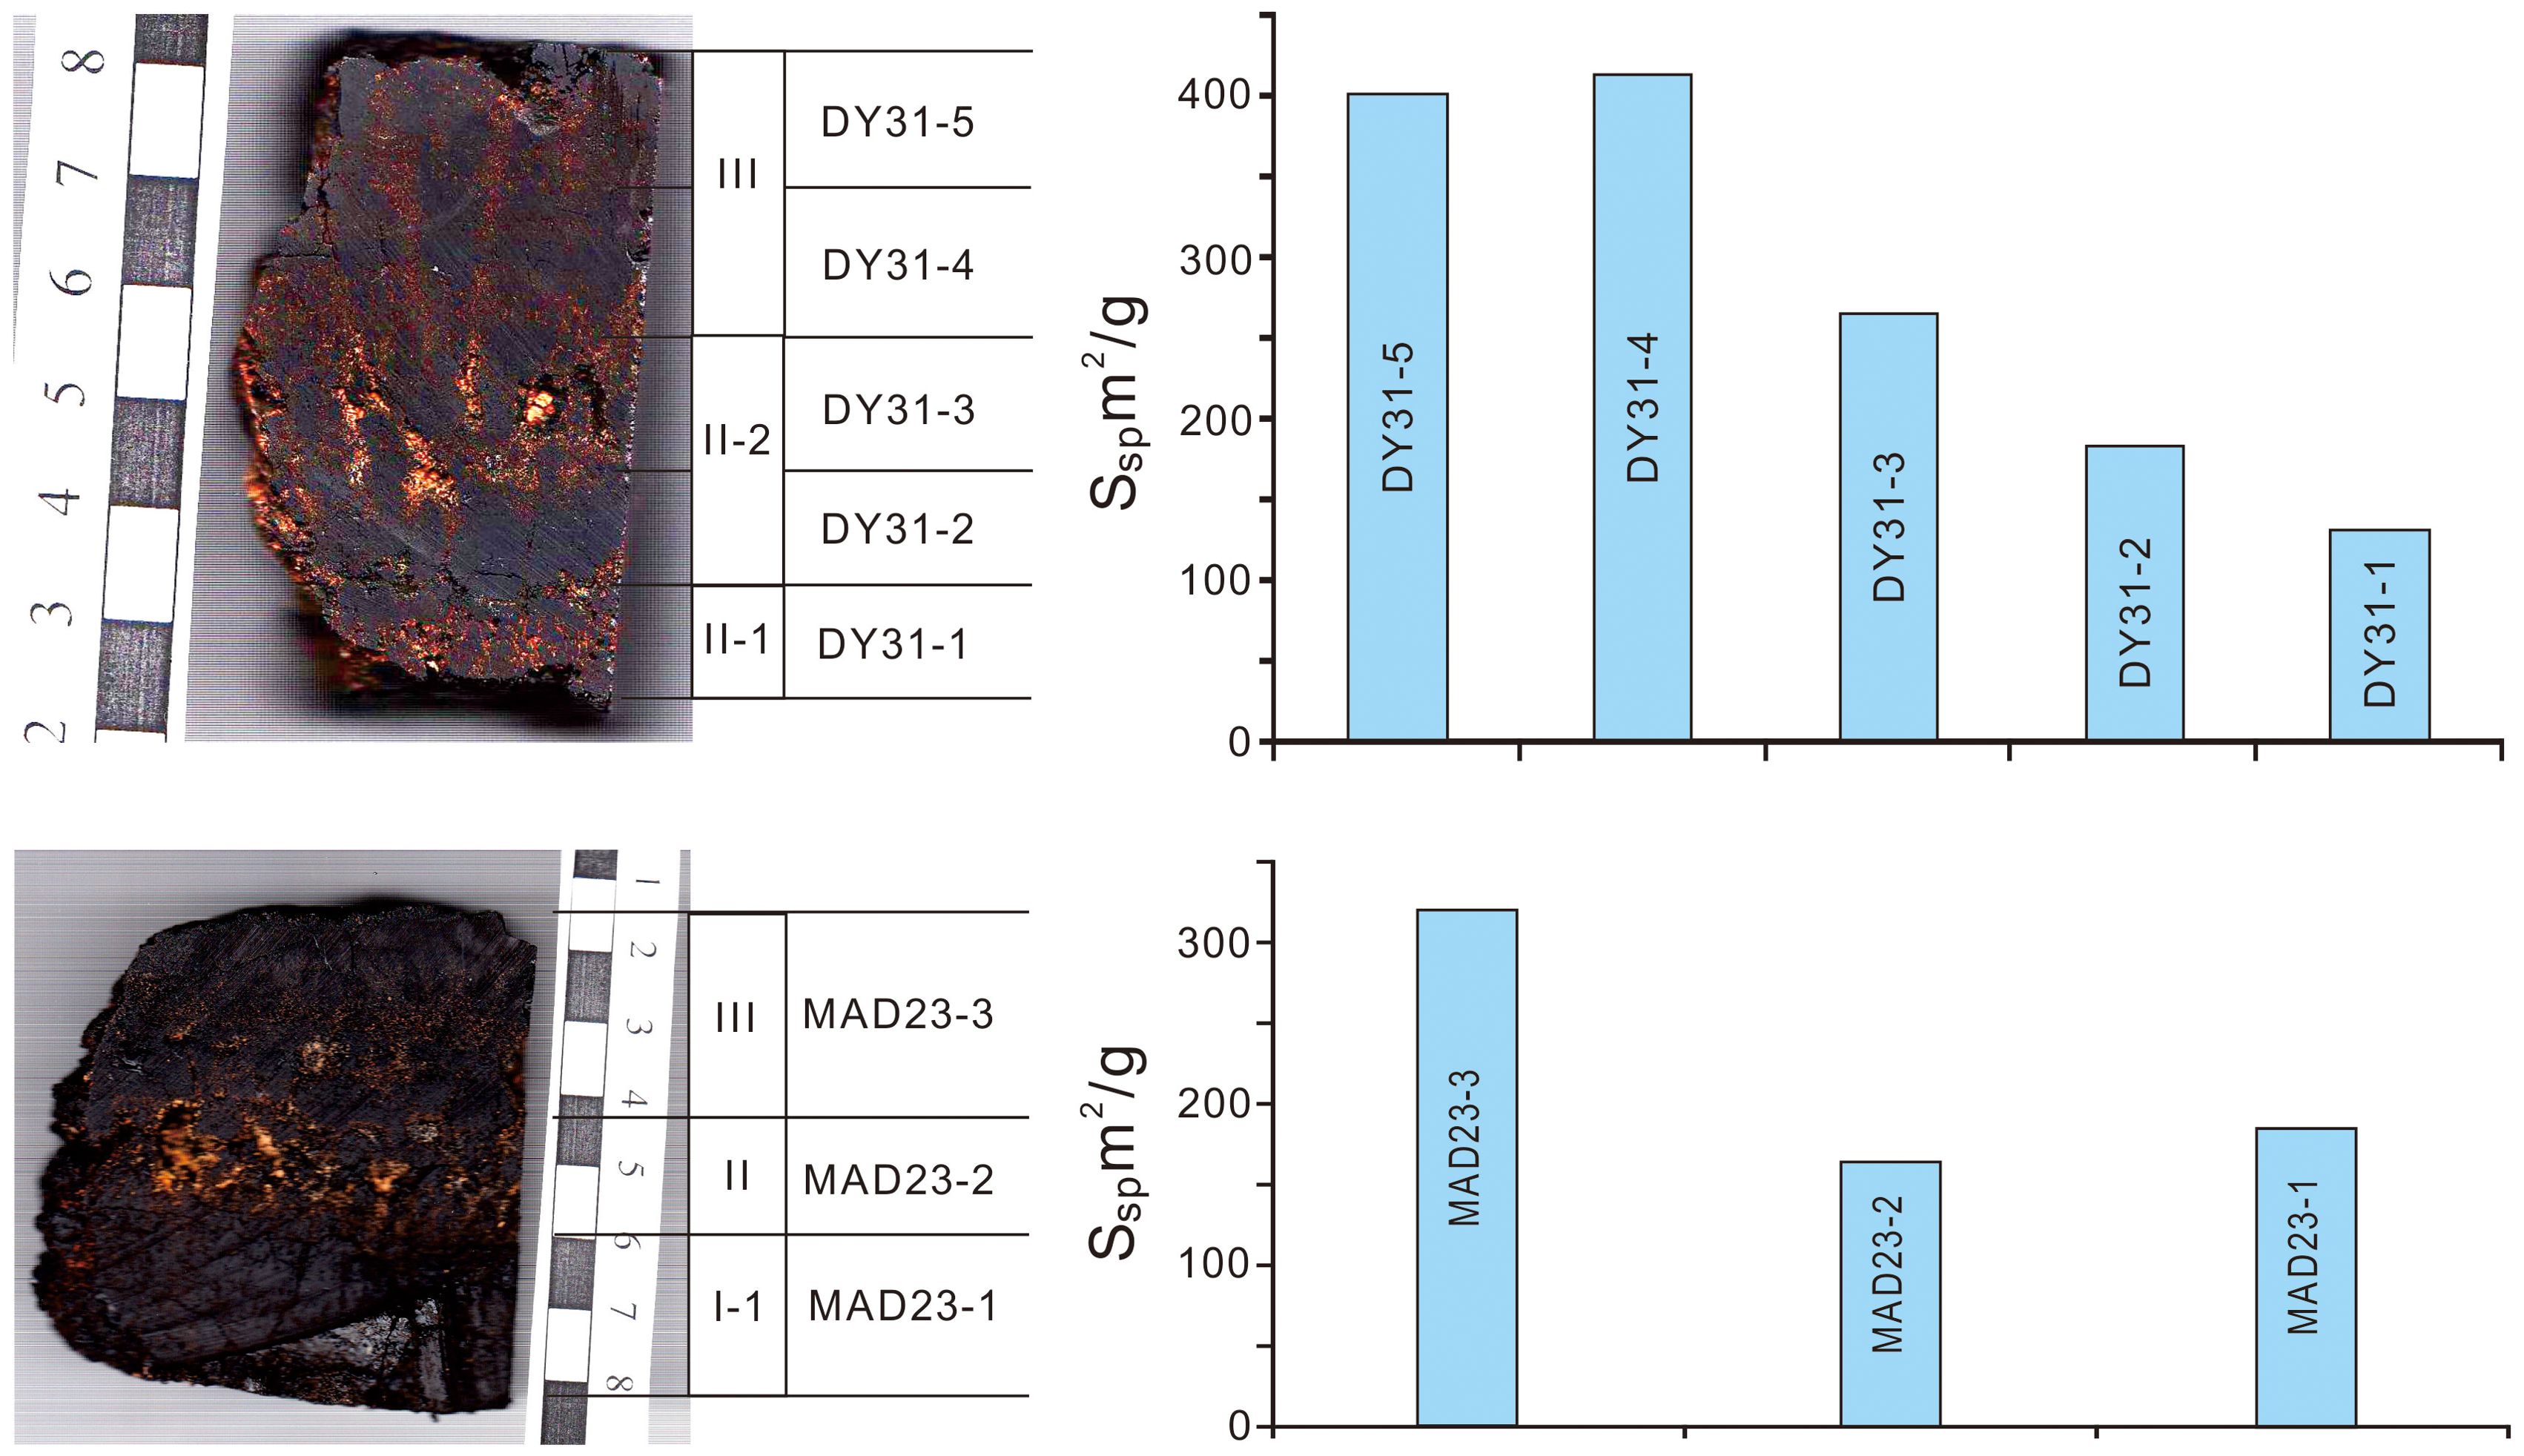
Figure 2. Variation of specific surface area in the stratigraphic sections of Fe-Mn crusts from Caiwei seamount; note the scale bars in cm divisions.
2.2 Analytical methods for major elements, 230Th isotope, and specific surface area of Fe-Mn crusts
In order to characterize the chemical composition, 20 samples were taken along the stratigraphic section of Fe-Mn crust DY31 (13 for layer III, 6 for layer II-2, and 1 for layer II-1); 21 samples were taken for Fe-Mn crust MAD23 (11 for layer III, 7 for layer II, and 3 for layer I-1) (Table 1). The outermost layers (youngest), 2.5 mm for Fe-Mn crust DY31 and 3.6 mm for Fe-Mn crust MAD23, are used in this study to investigate the controls on Co concentrations in Fe-Mn crusts. The samples were ground to a <74 μm powder in an agate mortar and pestle. The samples were then digested following the procedure described by Ren et al. (2010), and analyzed by Inductively Coupled Plasma Optical Emission Spectrometer (ICP-OES, Thermal iCAP6300 instrument) for Al2O3, CaO, TFe, K2O, MgO, MnO2, Na2O, P2O5, TiO2, Co, Cu, Ni, Ba, Sr, and Pb. Standards GSMC-1and GSMC-2 were analyzed together with Fe-Mn crust samples to monitor accuracy.
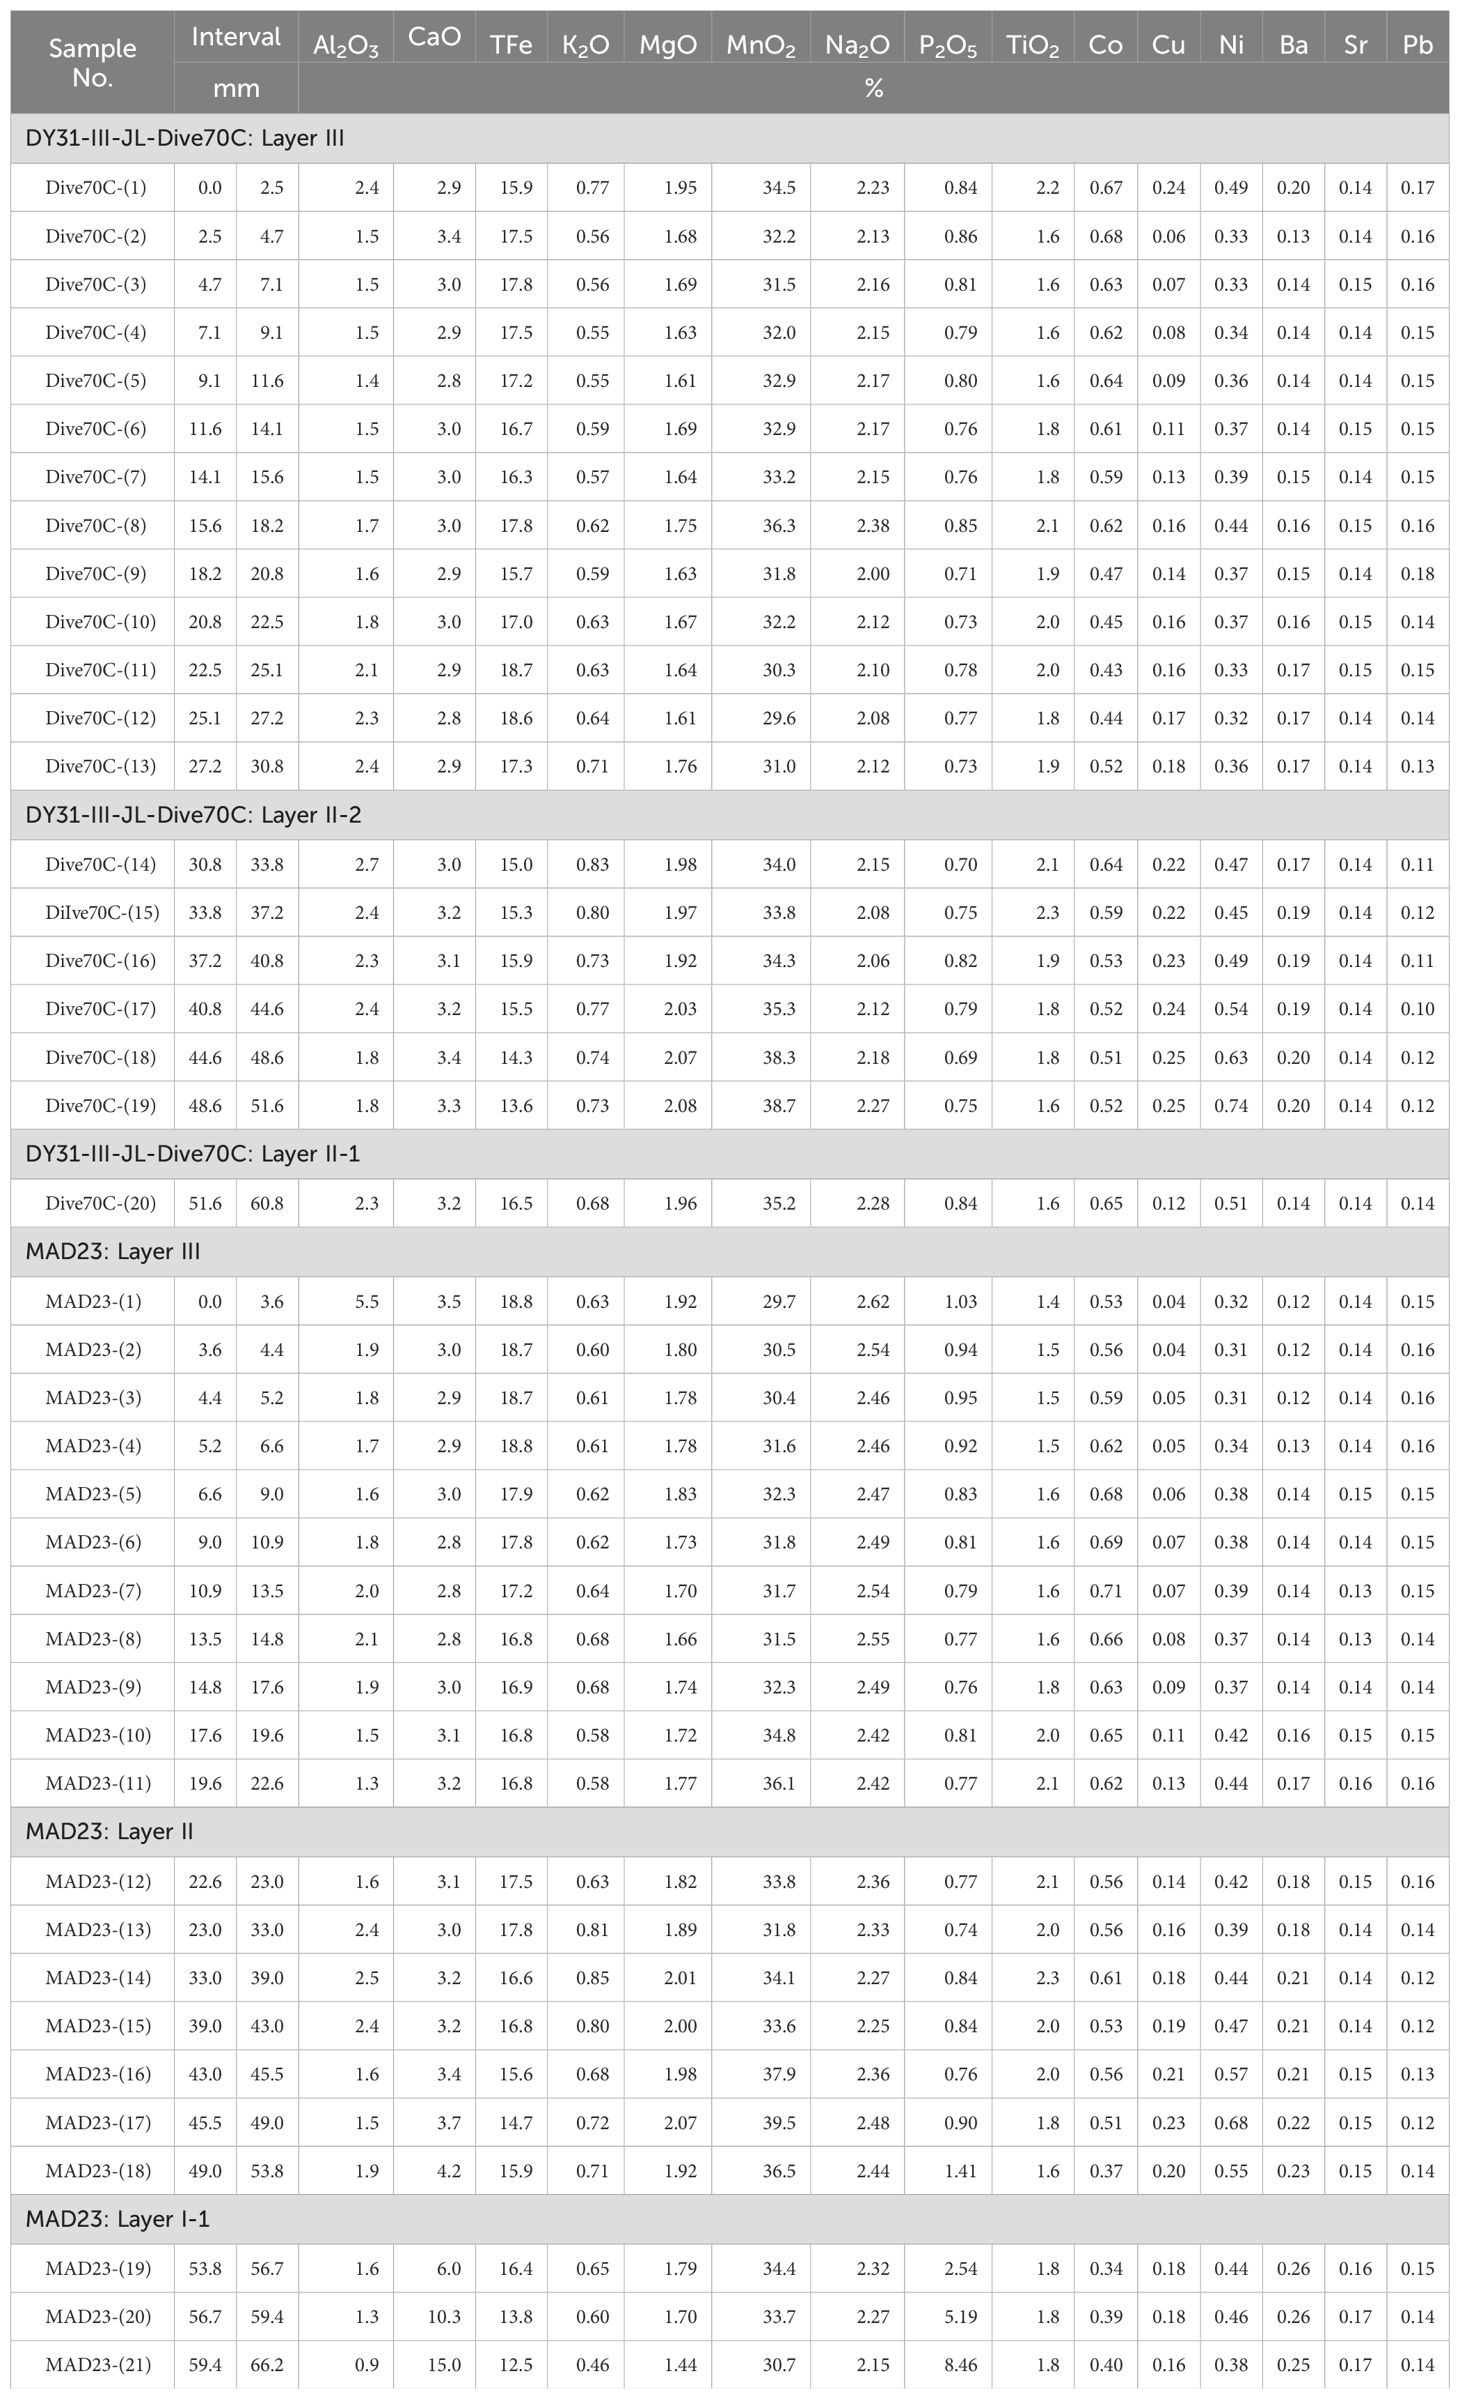
Table 1. Major element concentrations through stratigraphic sections of Fe-Mn crusts from Caiwei seamount of the Magellan seamounts.
For determination of 230Thex growth rates of the outermost layers of the Fe-Mn crusts, ten (DY31) and eight (MAD23) samples were scraped layer by layer with surgical blades from the outermost approximately 2 mm of crust (based on decay of 230Th in Fe-Mn crusts and the detection limit). The sampling intervals d (mm) were calculated with the formula: , where w is the weight of each sample; ρ is the density of Fe-Mn crusts (1.6 g/cm3, Halbach et al., 1983), and A is the sampling area. The error of d is estimated to be ±20% (Ku et al., 1979). The samples were ground in an agate mortar and pestle and then dried at 110 ° C. Then the samples were digested following the procedure described by Hu et al. (2002). The digested samples were separated and purified using the procedure of Luo et al. (1986). U and Th isotopes were determined by alpha spectrometry (Octete ™ PC).
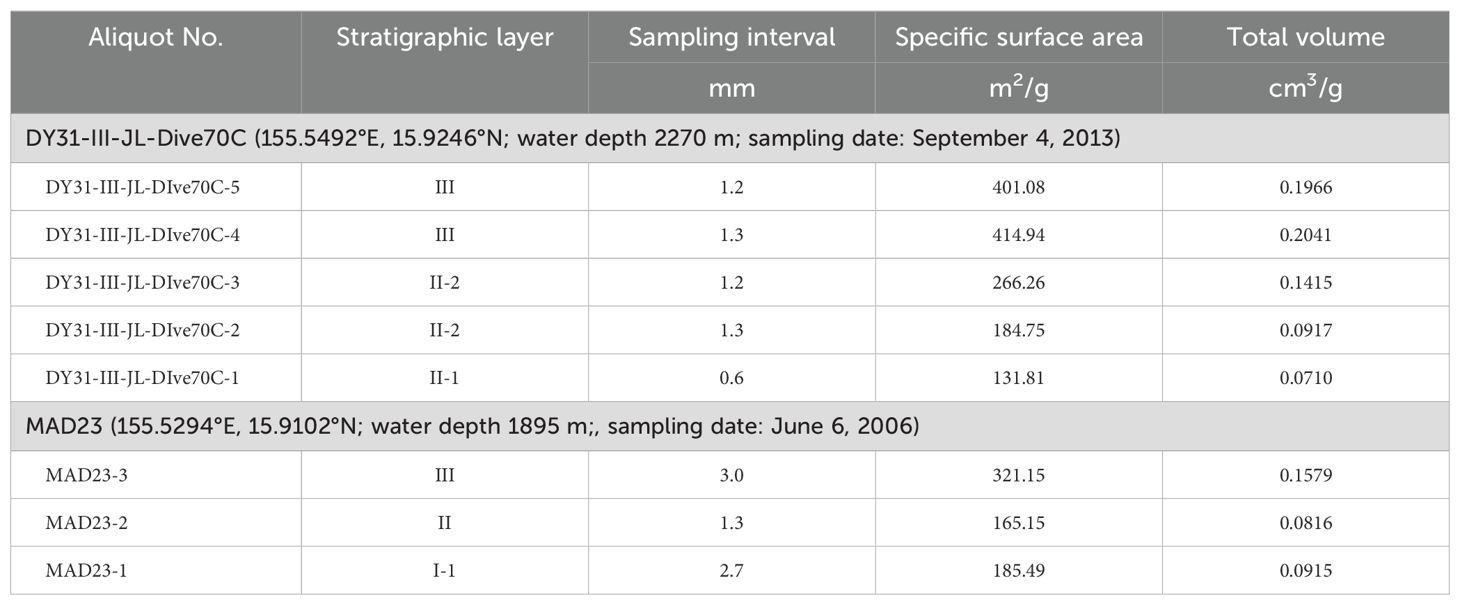
To determine variations in specific surface area, eight samples were taken along the stratigraphic section of the Fe-Mn crusts in this study: five samples from Fe-Mn crust DY31 (two for layer III, two for layer II-2, and one for layer II-1) and three samples from layer III, II, and I-1 of Fe-Mn crust MAD23 (Figure 2). The samples were crashed to grains of about 1 mm in diameter, and then dried at 110 ° C. The specific surface areas were determined by N2 adsorption using the BET method using a Belsorp-max instrument, in September 2014.
3 Results
3.1 Fe-Mn crusts cobalt and transition metals
The concentrations of Mn, Fe, Co, Ni, and Cu of Fe-Mn crusts DY31 and MAD23 show the same variations as those of other hydrogenetic Fe-Mn deposits (Table 1; Figure 3, right panel). The Co concentration of the outermost layer (2.5 mm) of DY31 is 0.67%, and MnO2 concentration is 34.5%. The Co concentrations of layer III (0-30.8 mm) of this Fe-Mn crust range from 0.43% to 0.68% with a mean value of 0.57%. The Co concentrations of layer II-2 (30.8-51.6 mm) range from 0.51% to 0.64% with a mean value of 0.55%, and the Co concentration of layer II-1 (51.6-60.8 mm) is 0.65%. The Co concentration of the outermost layer (3.6 mm) of MAD23 is 0.53%, and MnO2 concentration is 29.7%. The Co concentrations through the stratigraphic section of Fe-Mn crust MAD23 vary between 0.71% and 0.34%. The ranges of Co concentrations in MAD23 crust layer III (0-22.6 mm), II (22.6-53.8 mm), and I-1 (53.8-66.2 mm) are 0.53-0.71%, 0.37-0.61%, and 0.34-0.40% respectively. The average Co concentrations for crust MAD23 decreases from 0.63% in layer III, to 0.53% of layer II, to 0.38% of layer I-1 (Figure 3, left panel).
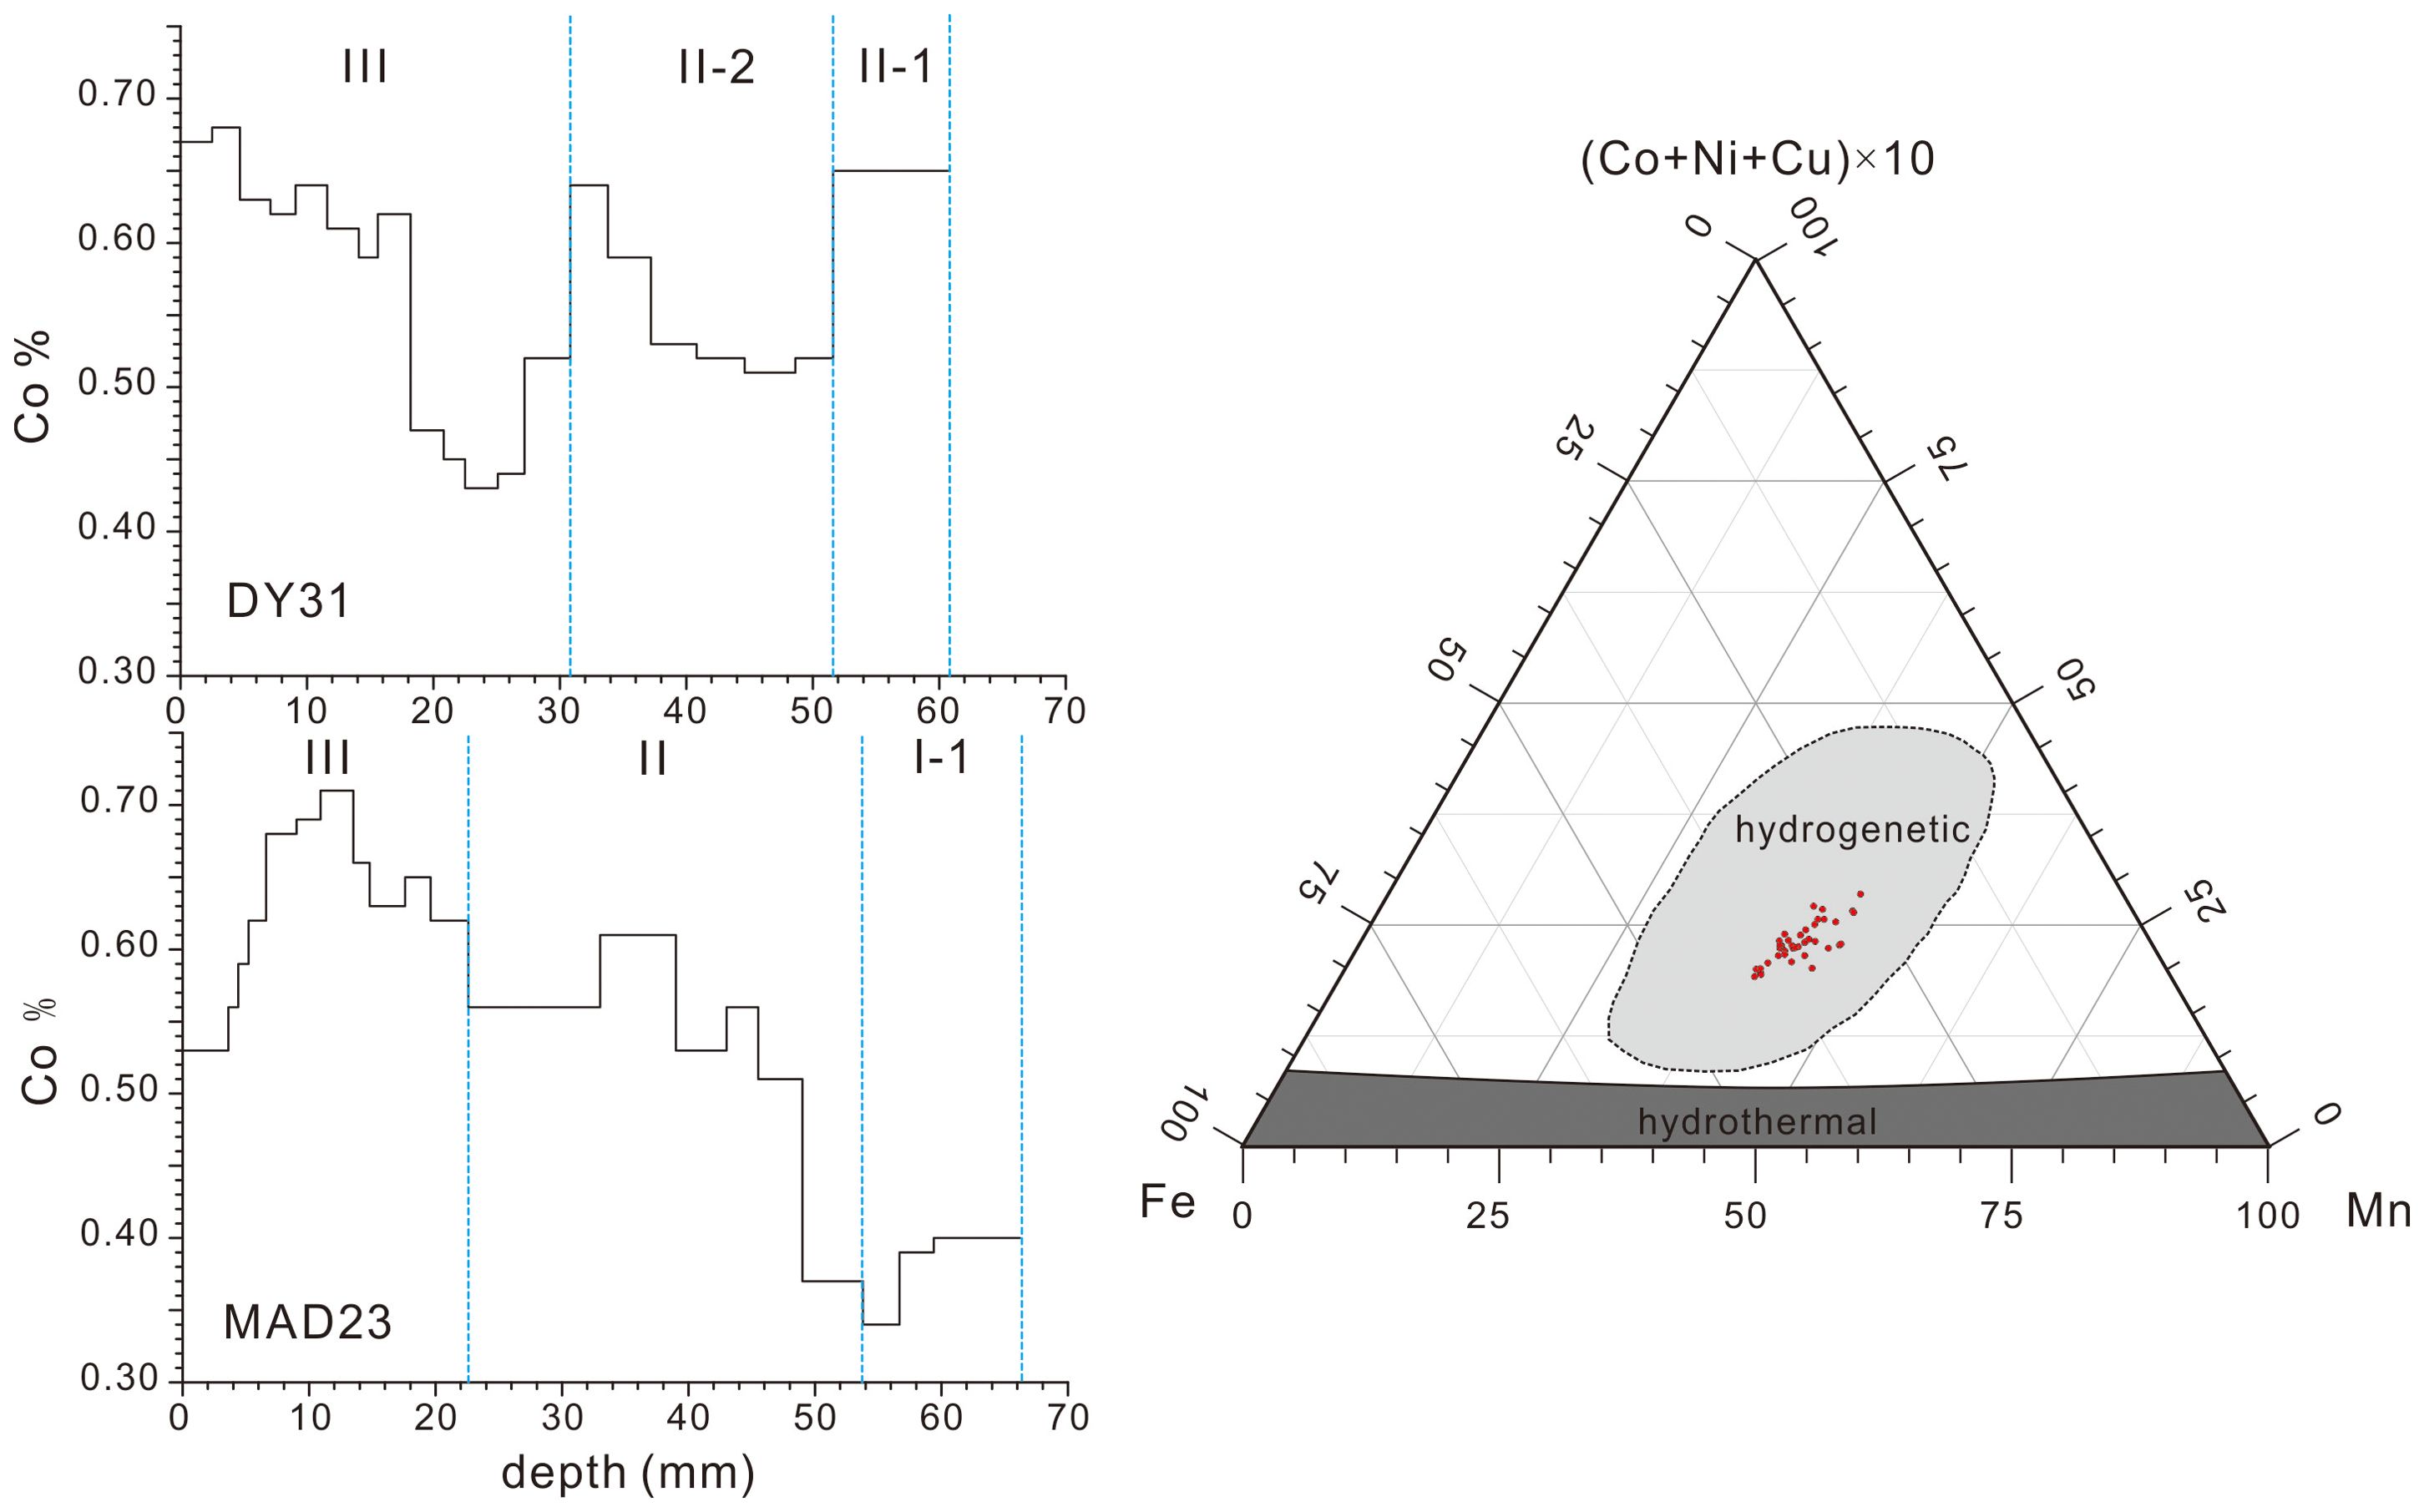
Figure 3. Left panel, Co concentrations of Fe-Mn crusts DY31 and MAD23 through the stratigraphic sections; right panel, ternary diagram of Mn, Fe, and (Cu+Co+Ni)×10 following Bonatti et al. (1972) for samples analyzed in this study.
3.2 Growth rates of outermost layers of the Fe-Mn crusts
The 230Thex and ratios of 230Thex/232Th of the Fe-Mn crusts show exponential decreases with depth (age) (Table 2). The growth rates (GR) were estimated by fitting the depth distributions of 230Thex and 230Thex/232Th with the isotope decay equations 230Thex)d = 230Thex)0· and 230Thex/232Th)d = 230Thex/232Th)0· , where d is sampling depth in the stratigraphic sections and λ230 is the decay constant of 230Th (9.19×10⁻⁶ a-1) (Figure 4).
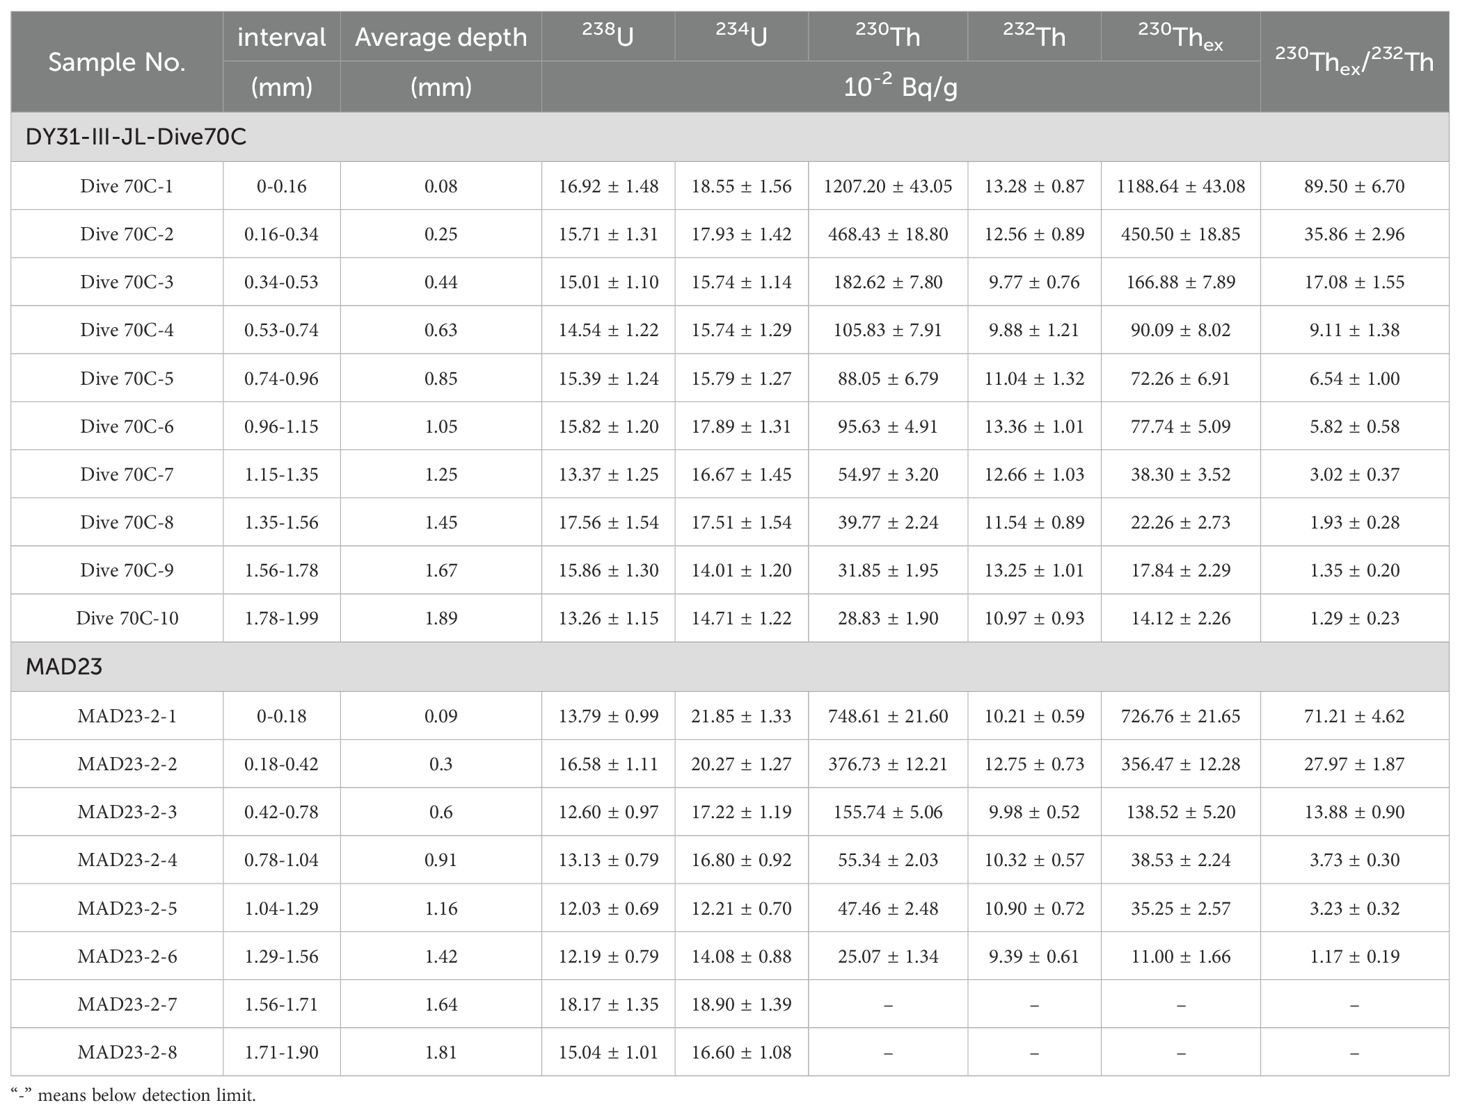
Table 2. 238U, 234U, 230Th, 232Th, and 230Thex specific activity, and the ratios 230Thex/232Th of Fe-Mn crusts from Caiwei seamount.
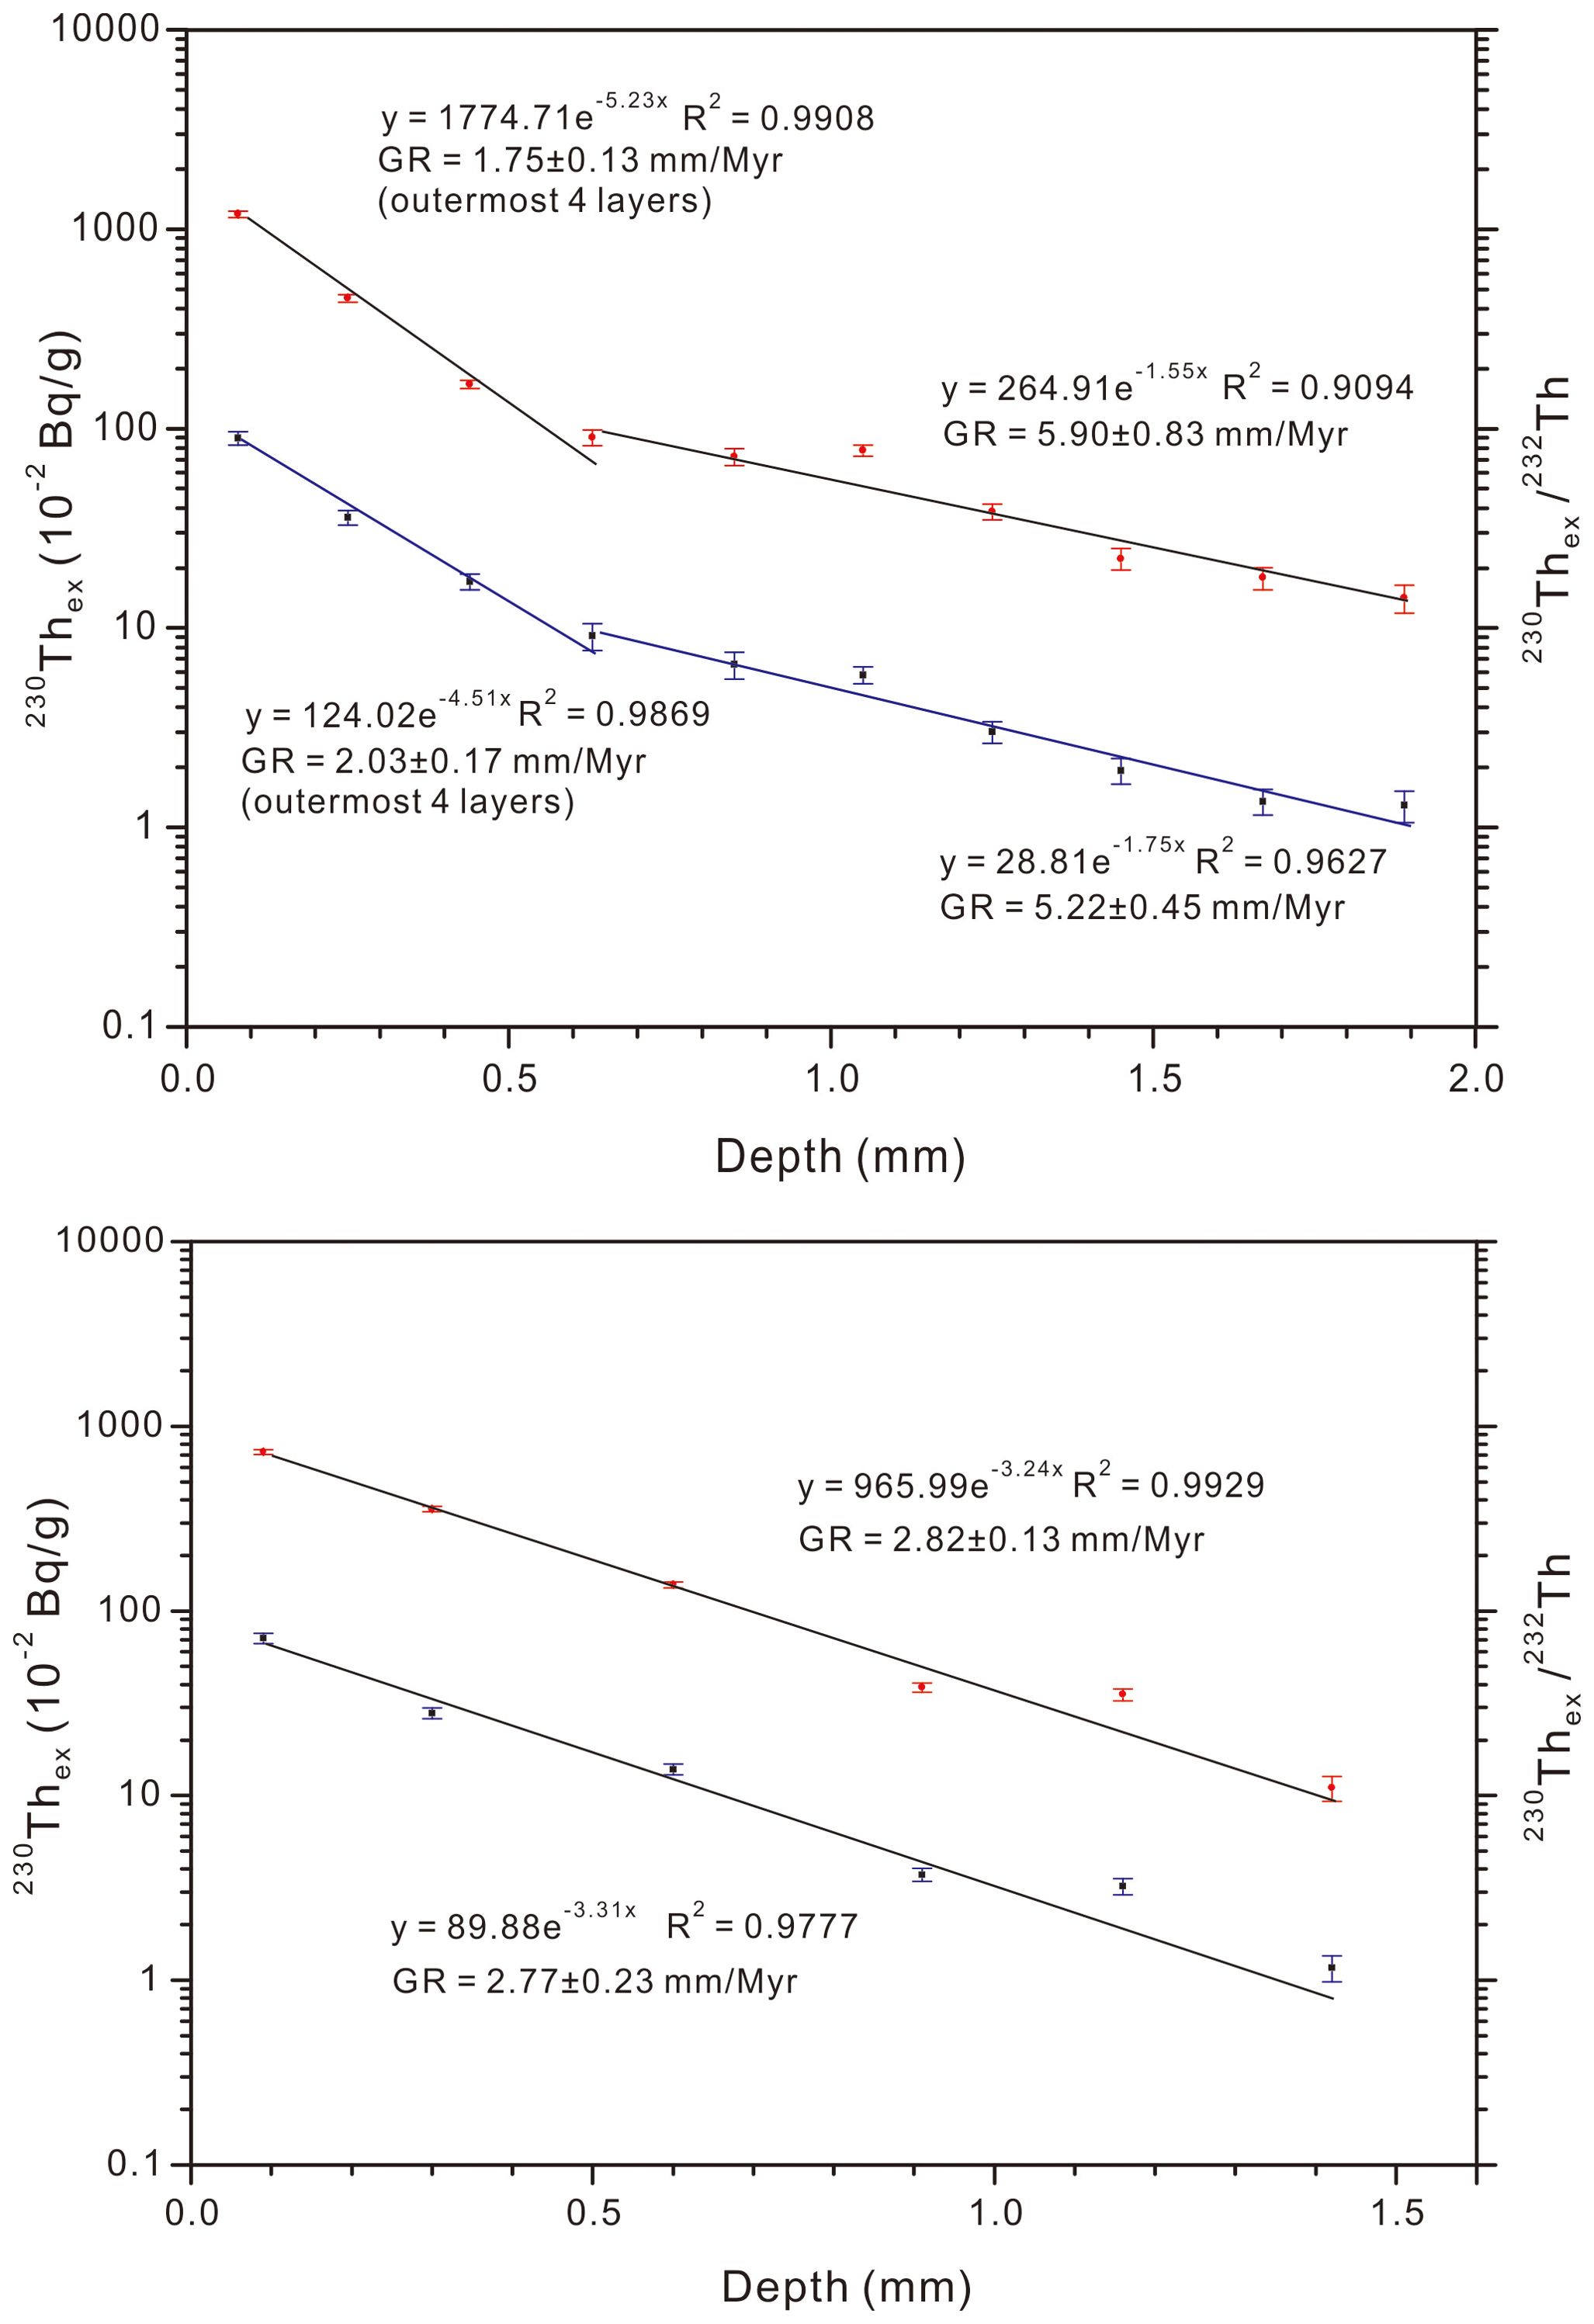
Figure 4. Fe-Mn crusts DY31 (top panel) and MAD23 (bottom panel) from Caiwei seamount, decay profiles of 230Thex activities (upper curves, red dots in each panel) and 230Thex/232Th activities (lower curve, blue dots in each panel), error bars are shown for each datum.
The decay curve of 230Thex of Fe-Mn crust DY31 shows a deflection at 0.74 mm (around 420 ka). The GR of this Fe-Mn crust derived from 230Thex are 1.75 ± 0.13 mm/Myr between 0.00 mm and 0.74 mm, and 5.90 ± 0.83 mm/Myr between 0.74 mm and 1.99 mm in the stratigraphic section, whereas the GR of this Fe-Mn crust derived from 230Thex/232Th are slightly higher between 0 mm and 0.74 mm, 2.03 ± 0.17 mm/Myr, and the same within error between 0.74 mm and 1.99 mm, 5.22 ± 0.45 mm/Myr. In contrast, the growth rates of Fe-Mn crust MAD23 are constant between 0 mm to 1.9 mm, 2.82 ± 0.13 mm/Myr by 230Thex and 2.77 ± 0.23 mm/Myr by 230Thex/232Th.
3.3 Specific surface area of Fe-Mn crusts from Caiwei seamount
The specific surface area decreases with depth (age) through the stratigraphic sections of the two Fe-Mn crusts (Table 3; Figure 2). The specific surface areas of DY31 decrease from 401 m2/g and 414 m2/g in the upper and lower parts of layer III respectively, to 266 m2/g and 185 m2/g in the upper and lower parts of layer II-2, to 132 m2/g in layer II-1 (Figure 2, top panel). The specific surface areas of MAD23 decrease from 321 m2/g in layer III, to 165 m2/g in layer II, and about the same in layer I-1, 185 m2/g (Figure 2, bottom panel). Fe-Mn crust DY31 was kept moist after recovery from Caiwei seamount, and determined one year after recovery, while Fe-Mn crust MAD23 was stored dry and analyzed 8 years after recovery. The Fe-Mn crust analyzed soon after collection has higher specific surface areas relative to those analyzed later.
4 Discussion
4.1 Theoretical model for the controls of cobalt in Fe-Mn crusts
Almost all of the Co in seawater from the western North Pacific is dissolved rather than particulate (Nakatsuka et al., 2009). The two main species of dissolved Co in seawater are Co2+ (65%) and CoCl+ (14%) (Byrne, 2002). Those Co ions are transported with bottom currents and diffuse onto the surface of Fe-Mn crusts, where Co2+ ions are adsorbed by δ-MnO2 (98-99%; Koschinsky and Hein, 2003) and oxidized to Co3+, initially proposed by Murray and Dillard (1979). In this Co enrichment process, diffusion is the critical step because of the low diffusion flux relative to its oxidation rate by δ-MnO2. Halbach et al. (1983) estimated that the fluxes of Co into Fe-Mn crusts from the Line Islands are 2.4-4.0 μg cm-2 kyr-1; in their calculation, the high specific surface area of Fe-Mn crusts (average 300 m2/g; Hein et al., 2000) was not incorporated, which can decrease the Co flux. Kanungo et al. (2004) carried out adsorption experiments of Co on hydrous manganese dioxide from complex electrolyte solutions resembling seawater in major ion concentrations, and the results show that δ-MnO2 adsorbed 2.4 mmole/g Co in 72 hours at pH 7.25 and temperature of 300 K. The specific surface areas of δ-MnO2 used in that study range from 2.64 m2/g to 94.22 m2/g (Parida et al., 1981). Consequently, we calculated the maximum adsorption flux of Co on the surface of δ-MnO2 to be about 1.62×10⁶ μg cm-2 kyr-1, which is much higher than the Co fluxes on Fe-Mn crusts in the natural seawater system. This difference in Co flux may result mainly from the different Co concentrations in the laboratory solution and in seawater. Nevertheless, the adsorption experiment shows the great potential of Fe-Mn crusts to adsorb Co. Therefore, based on flux data and adsorption capacity, it is reasonable to conclude that the diffusion of Co in seawater is the critical step in the Co enrichment process from seawater to Fe-Mn crusts.
Assuming that all the Co ions that diffused to the surface of the Fe-Mn crusts were adsorbed and eventually captured through surface oxidation by the Fe-Mn crusts, the concentrations of Co in the Fe-Mn crusts (Ccr, assuming that the concentration of δ-MnO2 in Fe-Mn crusts is equal to the percentage of MnO2; Co concentration in Fe-Mn crusts normalized to MnO2 = 100% to eliminate dilution mainly from detrital minerals and FeOOH) can be given by
Where J = diffusion flux of Co, Ssp = specific surface area of the Fe-Mn crusts, and = duration for the growth of one molecular layer.
When J is the function of time t, Equation 1 should be rewritten as
For a semi-infinite medium with constant surface concentration, the concentration can be derived from Albarede (1995) as
Where C = concentration in a semi-infinite medium, Cint = C at x = 0, C0 = C at x = ∞, D = diffusivity. Based on Equation 3, the response time and gradient of concentration C to the surface concentration Cint can be estimated for Co diffusion in deep-sea water in a diffusion layer of 5 mm as shown in Figure 5, where Cint = 34.1 pM, C0 = 0, D = 3.626×10⁻⁶ cm2/s for this research (shown in section 4.2.2 and 4.2.3). Figure 5 shows that the gradient of the concentration of Co in the diffusion layer is nearly constant when time t = 1000 s, which indicates that the response time of Co concentration in the diffusion layer is rather short. In this case with a constant gradient of concentration Co, the diffusion can be described by Fick’s First Law. Since deep seawater is a dissipative system, it is reasonable to assume that the Co concentration in ambient seawater of seamounts vary slowly relative to the short response time of the diffusion layer. Hence, we can use Fick’s First Law to describe Co diffusion near the ferromanganese crusts on seamounts concisely.
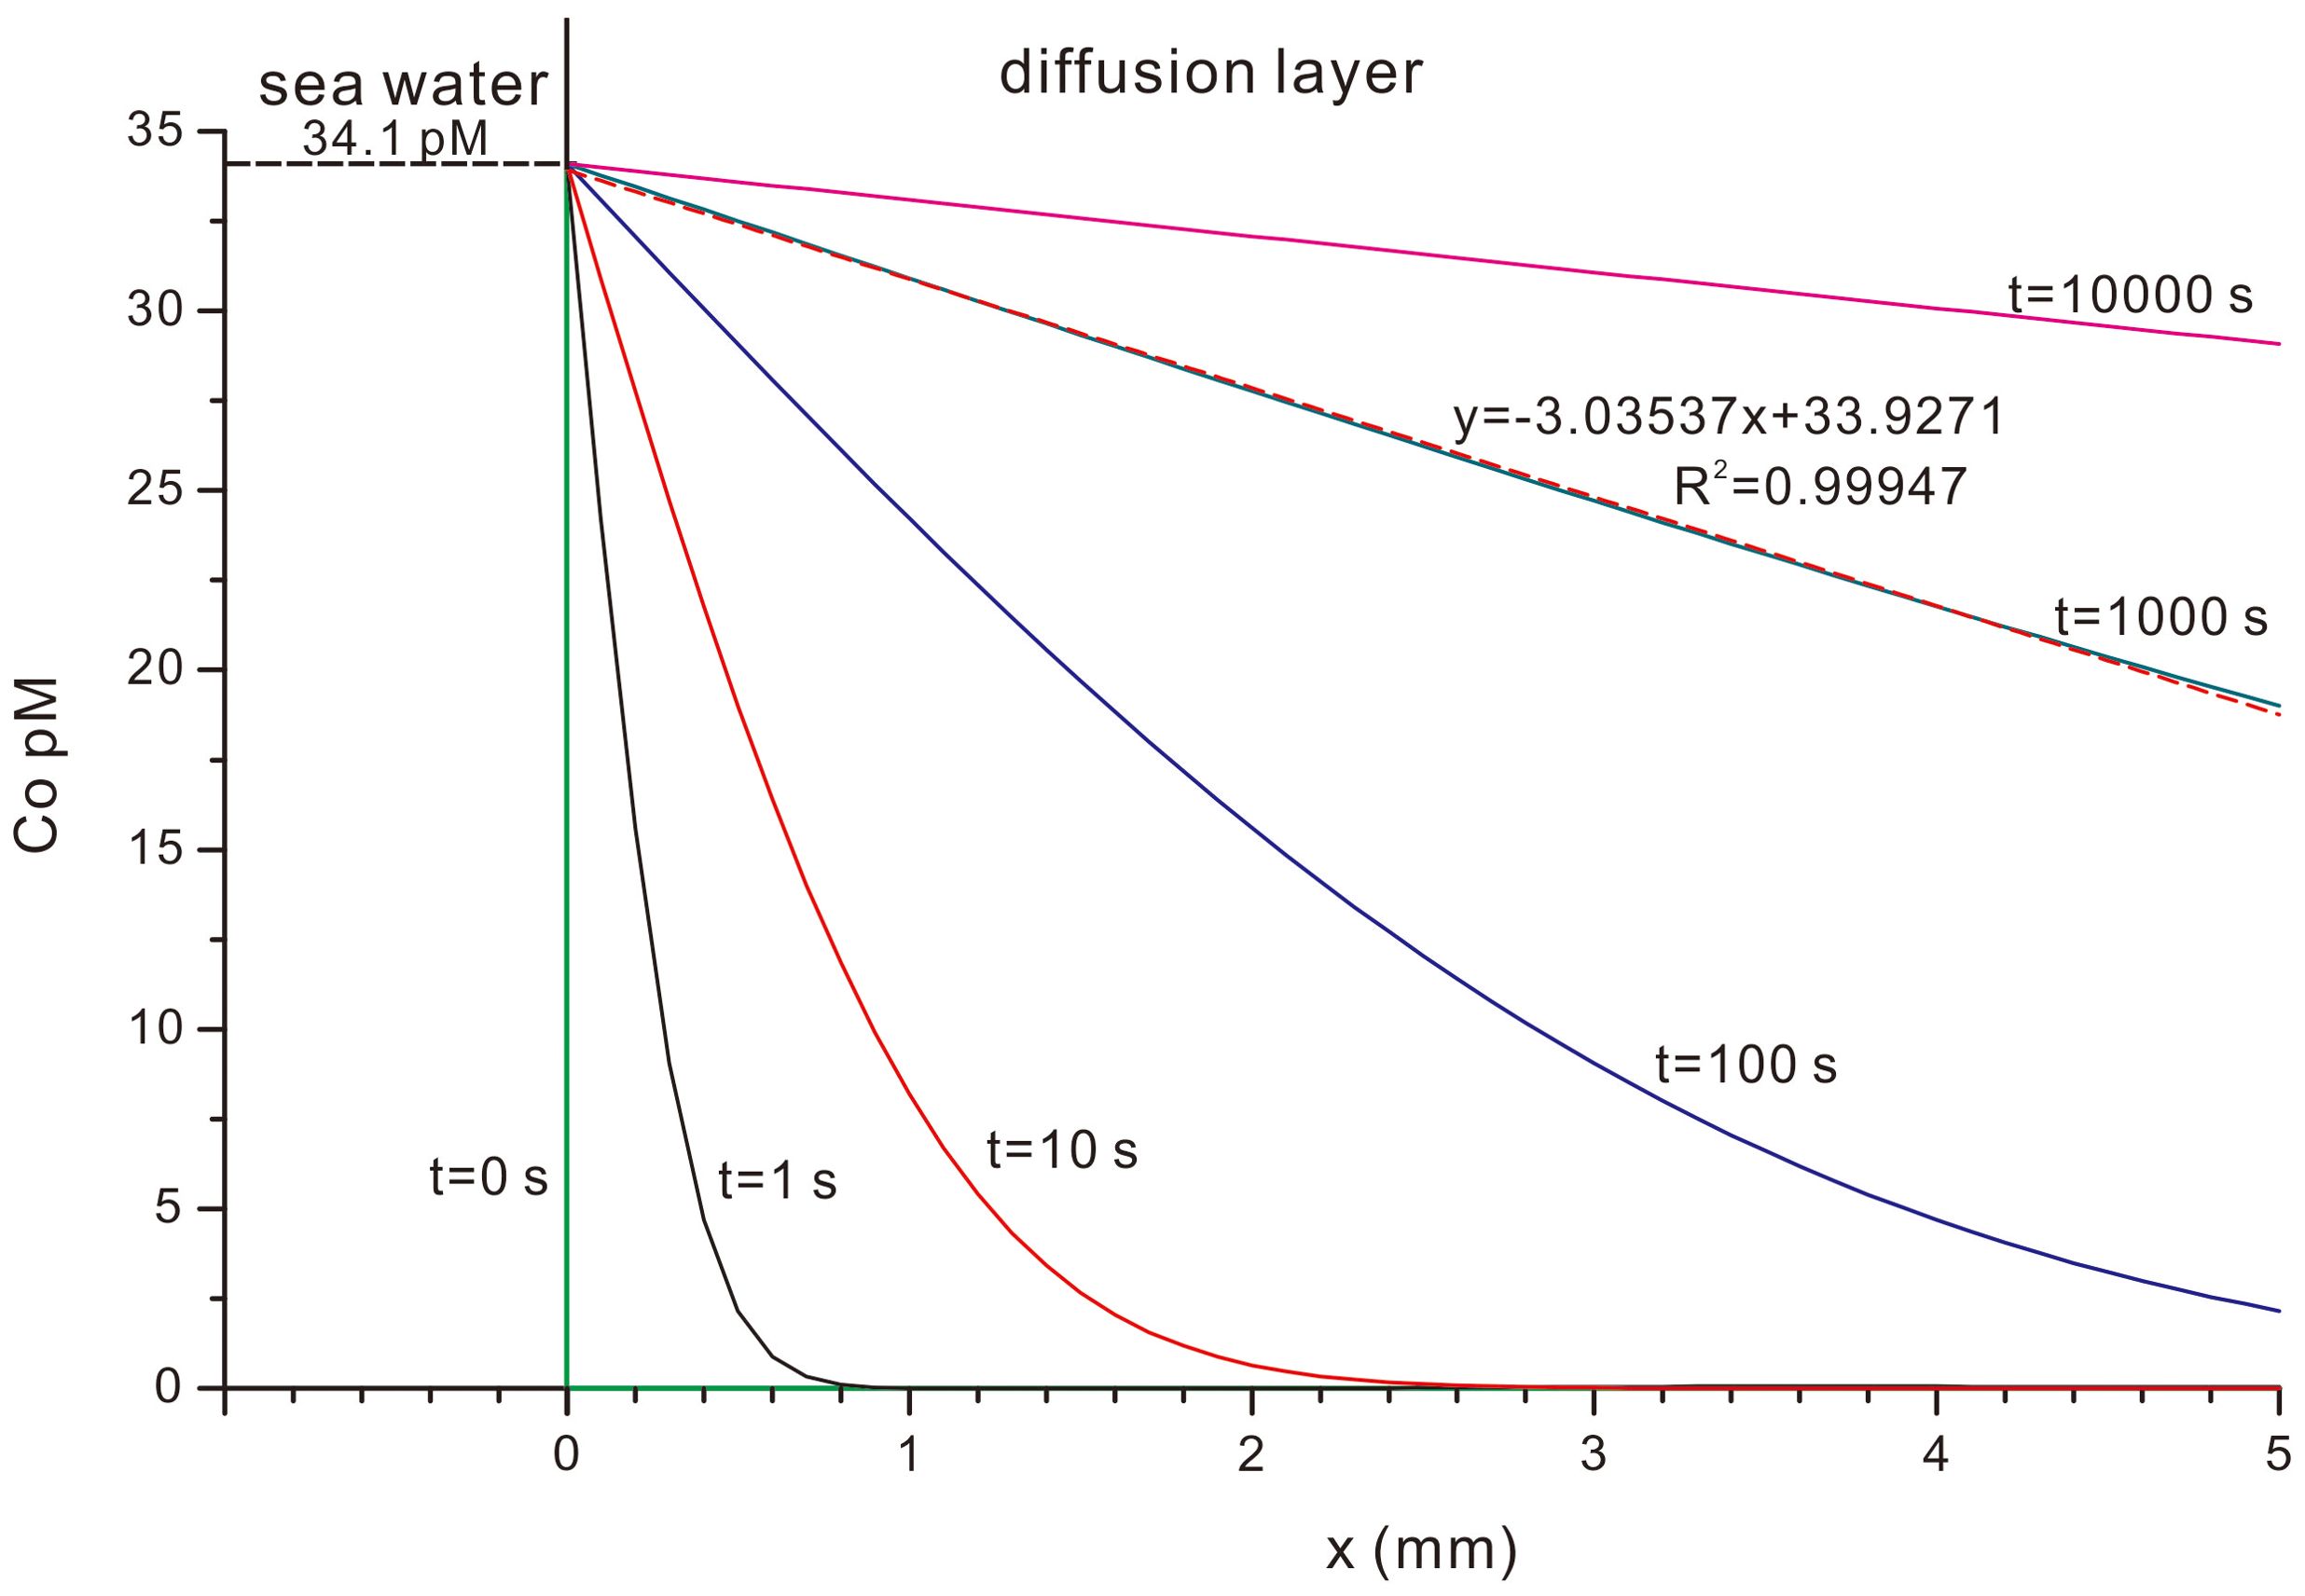
Figure 5. Response time and gradient of Co concentrations in the diffusion layer to the surface concentration.
Based on Fick’s First Law, the diffusion flux of Co (J) from seawater to the Fe-Mn crusts can be given by
Where Dsw = diffusivity of Co ion in seawater, Csw = Co ion concentration in seawater at time t, = diffusion gradient of Co ions. Dsw can be estimated by Dsw = (m0 + m1T)×10-6 cm2/s, where m0 = 3.31, m1 = 0.158, and T is temperature in Celsius (Boudreau, 1997). Assuming that the Co concentration in seawater near the interface of seawater and Fe-Mn crusts is 0 and the diffusion distance of Co ions near the interface is δ, then the .
The duration for the growth of one molecular layer of Fe-Mn crust t can be given by
Where z = the thickness of one molecular layer of Fe-Mn crust (4.7Å, Manheim, 1986), GR = growth rate.
When the Equations 2, 4, and 5 are combined, the concentration of Co in Fe-Mn crusts (Ccr) can be given by
Where Csw is not constant in the duration for the growth of one molecular layer and varies with time t.
When Csw is constant in the duration for the growth of one molecular layer, Equation 4 can be rewritten as
When Csw is not constant in the duration for the growth of one molecular layer, Equation 4 can be rewritten as
Where is the averaged Csw weighted by time t, and is the averaged Co concentration derived from .
Equations 5, 6 indicate that the controls on the Co concentrations in Fe-Mn crusts include diffusivity of Co ions in seawater (Dsw), temperature which controls the Dsw, Co ion concentration in seawater (Csw or ), the diffusion distance of Co ions near the interface of seawater and Fe-Mn crusts (δ), growth rate (GR), and specific surface area of Fe-Mn crusts (Ssp).
4.2 Estimation of parameters
In Equations 7, 8, the diffusion distance of Co ions near the interface of seawater and Fe-Mn crusts (δ) cannot be measured directly. Therefore, we calculated δ for the Fe-Mn crusts from Caiwei seamount based on Co concentrations, growth rates, and specific surface area of the outermost layer of the Fe-Mn crusts, diffusivity of Co2+, and Co concentration in the seawater.
4.2.1 Major elements
The sequential leaching experiments (Koschinsky and Halbach, 1995; Koschinsky and Hein, 2003) and X-ray absorption near-edge structure data (Takahashi et al., 2007) show that the Co in Fe-Mn crusts resides in vernadite (δ-MnO2). Consequently, the other minerals in Fe-Mn crusts, such as aluminosilicates, phosphates, and FeOOH dilute the Co concentration of Fe-Mn crusts. In order to eliminate the dilution parameter, we normalized the Co concentration to 100%MnO2. The normalized Co concentrations of the outermost layers of DY31 (2.5 mm) and MAD23 (3.6 mm) are 2.14% and 1.79% respectively.
4.2.2 Diffusivity of Co ions in seawater (Dsw)
The modern seawater temperature is 2°C at 2000 m water depth around Caiwei seamount (Figure 6). The diffusivity of Co ions in seawater is estimated to be 3.626×10⁻⁶ cm2/s by Dsw = (m0 + m1T)×10-6 cm2/s, where m0 = 3.31, m1 = 0.158, and T is in Celsius (Boudreau, 1997).
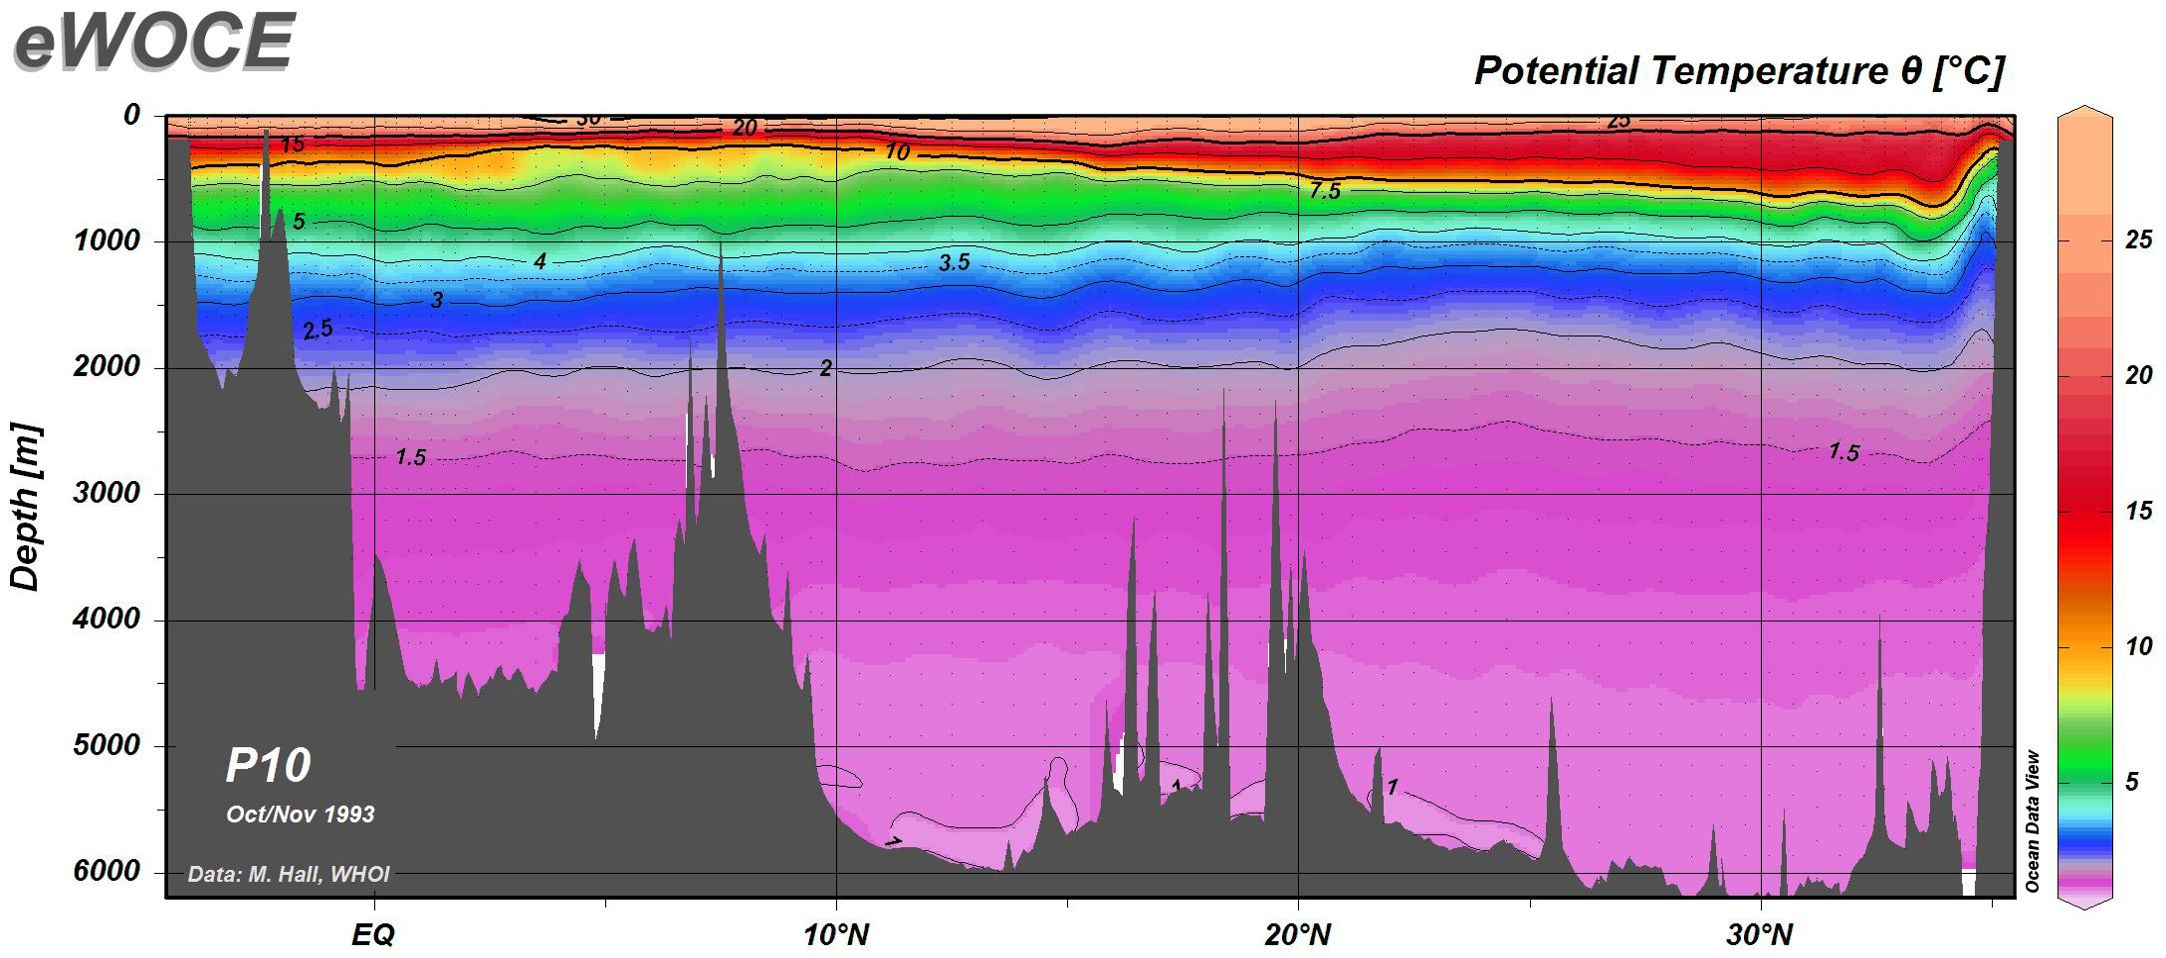
Figure 6. Profile of seawater temperature, west Pacific (location is shown in left map of Figure 1; modified with permission after http://www.ewoce.org/gallery/P10_TPOT.gif, Schlitzer, Reiner, Electronic Atlas of WOCE Hydrographic and Tracer Data Now Available, Eos Trans. AGU, 81(5), 45, 2000).
4.2.3 Specific surface area
In Equations 7, 8, the specific surface area of δ-MnO2 should be used to calculate δ. However, the specific surface area of δ-MnO2 is difficult to determine separately from FeOOH, which is epitaxially intergrown. The vernadite (δ-MnO2) in Fe-Mn crusts from the western Pacific are sheets as thin as 1 nm determined by Aberration-corrected FEG-STEM, and ferrihydrite (FeOOH) is typically 10 nm or less in diameter (Hochella, 2008), both of which coexist at a less than 1 micron scale as shown by EPMA with a spot diameter of 1 μm, which can detect the X-ray signals from Mn and Fe simultaneously (e.g. Ren et al., 2011).
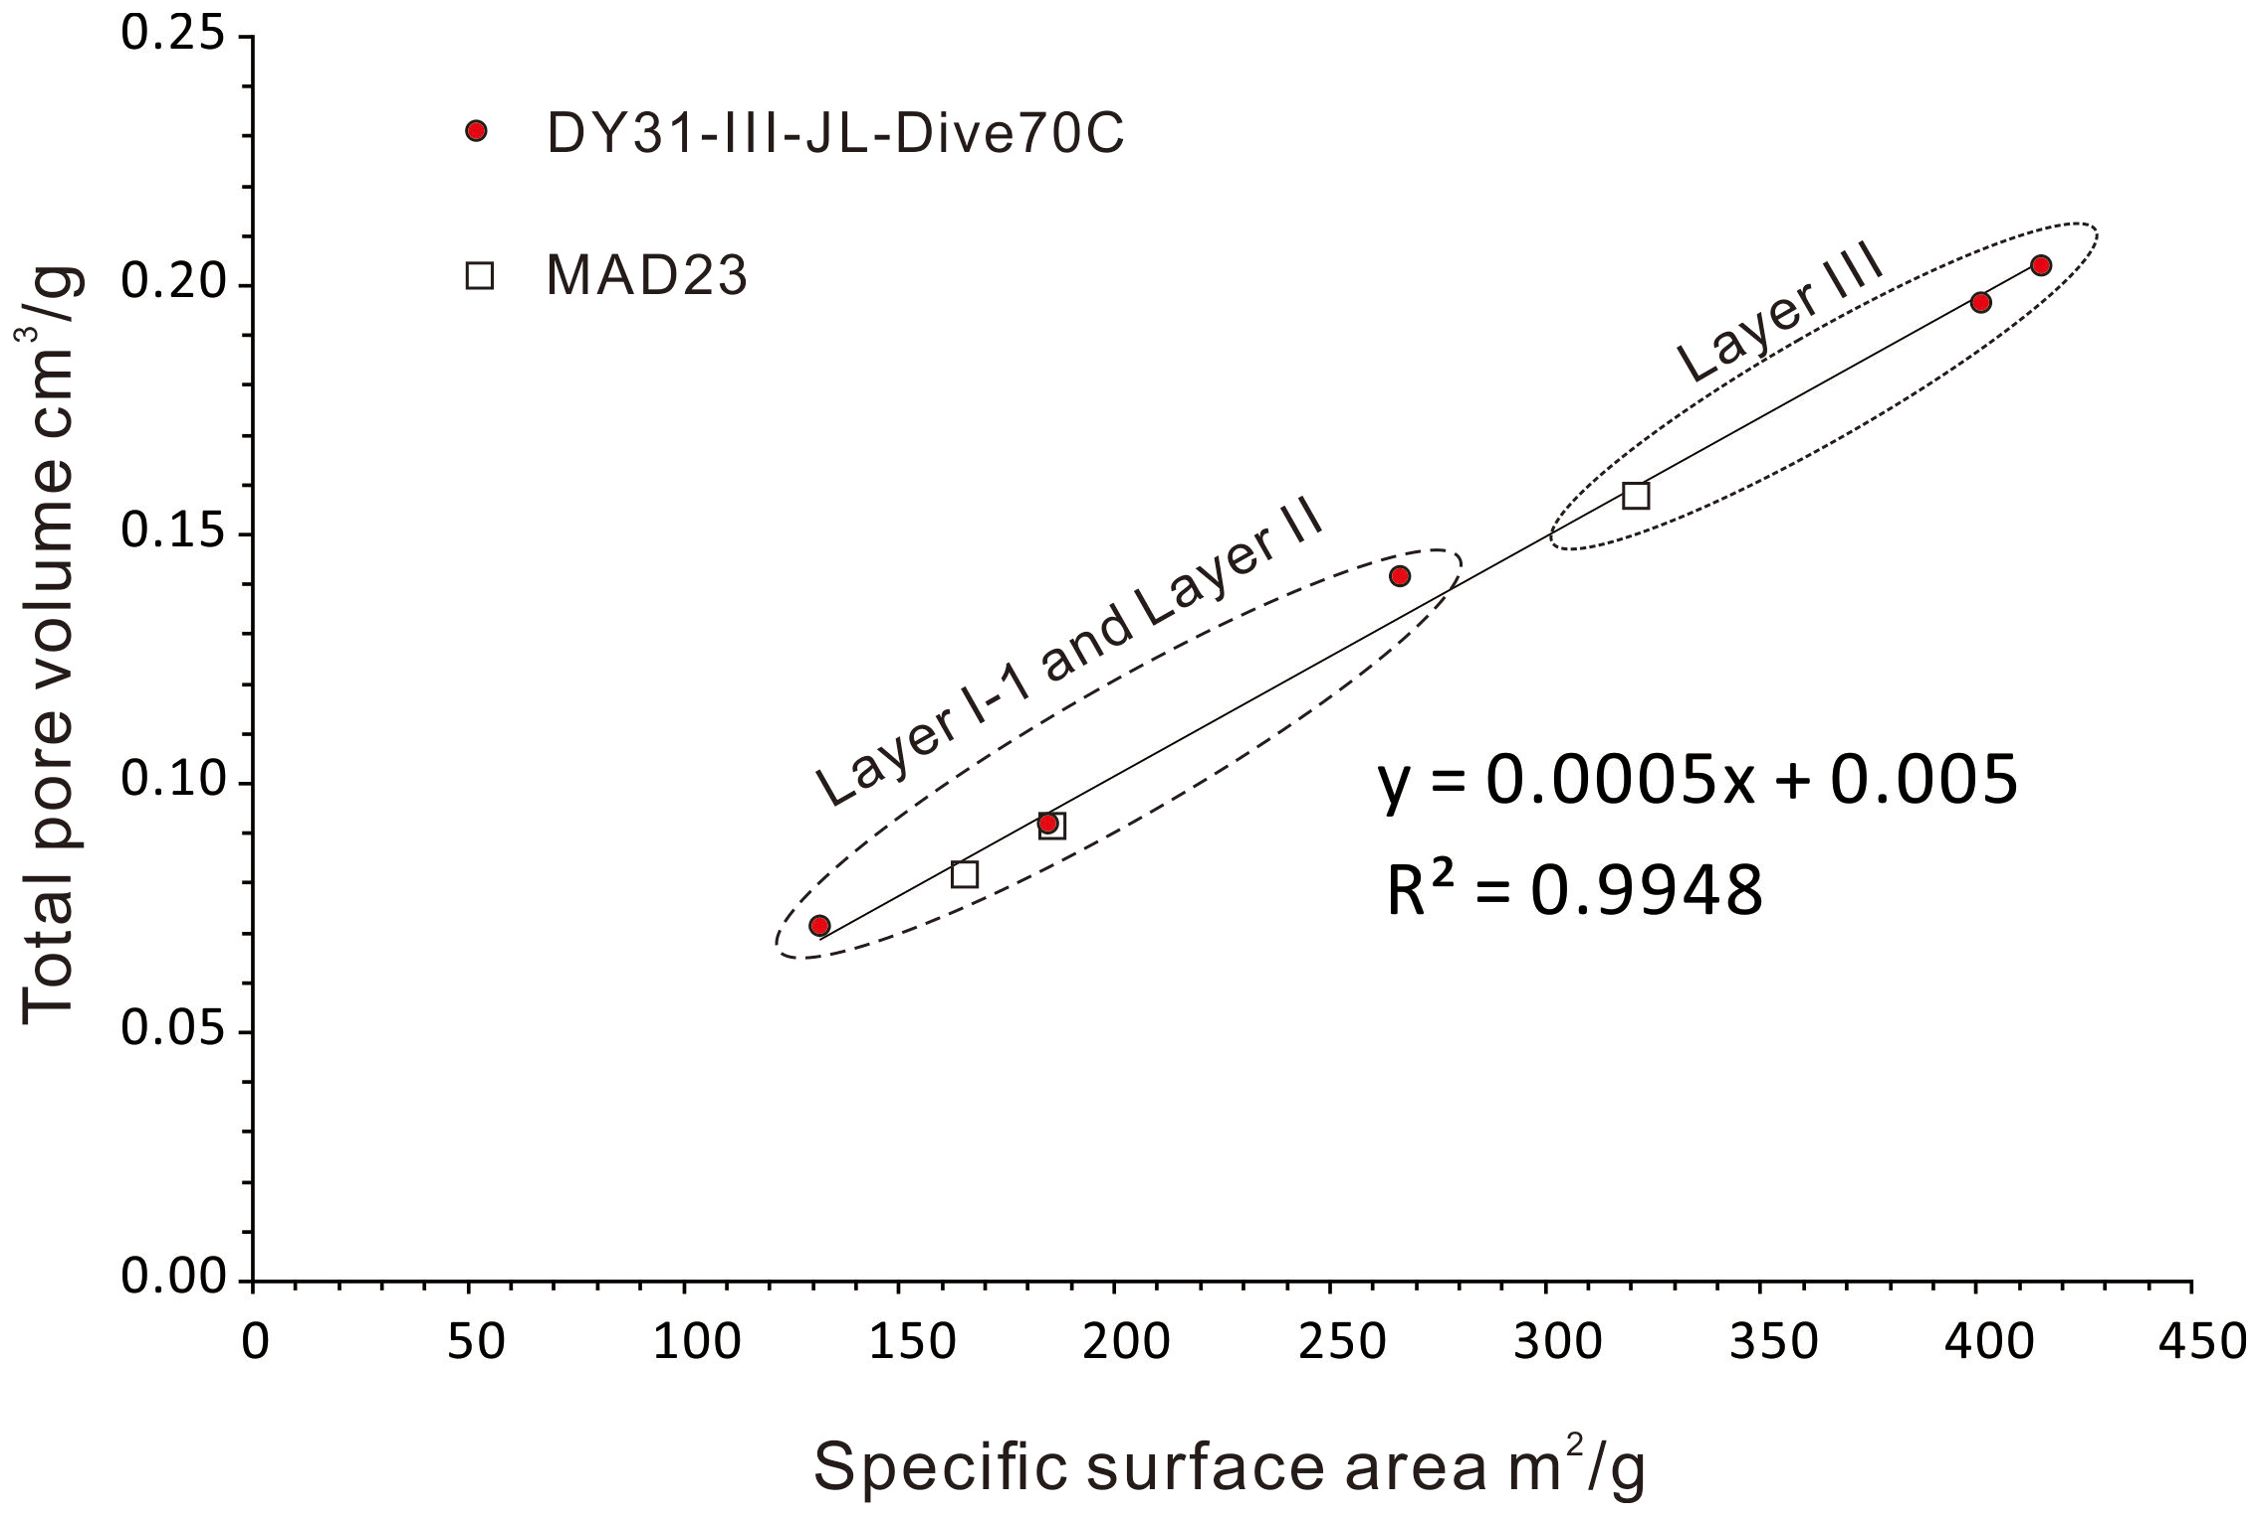
The specific surface areas (Ssp) in this study were determined for Fe-Mn crusts, which predominantly reflect δ-MnO2 and FeOOH. The specific surface areas of surface samples (≤ 1 mm sampling depth) and volume samples (≤ 5-6 mm sampling depth) of Fe-Mn crusts from Karin Ridge of the Mid-Pacific Mountains vary from 250 m2/g to 381 m2/g, and decreased up to 20% and 40% during the first four weeks and the eight weeks respectively after collection (Hein et al., 1994). The specific surface area along the section of a Fe-Mn crust from Marshall Islands range from 373 m2/g to 530 m2/g for the younger generation, and from 84 m2/g to 178 m2/g for the older generation (Xue, 2007). The specific surface areas for Fe-Mn crusts DY31 and MAD23 in this study show the same variations as those obtained by Hein et al. (1994) and Xue (2007). The specific surface areas of the younger generations are greater than those of the older generation; the specific surface areas of MAD23 8-years after collection are lower than those measured 1 year after collection (Figure 7). The variation of specific surface areas reflects differences in stratigraphy and preservation. From these data, we infer that only the well-preserved outermost layers of Fe-Mn crusts can be used to obtain specific surface areas that may closely reflect those existing under in situ conditions. Specific surface area shows a nearly perfect positive correlation (r = 0.997) with pore volume, with an intercept close to zero (Figure 7), which indicates that the same characteristic or process may control both, such as particle size. These considerations indicate that it is most appropriate to use the Ssp of the outermost layer of crust DY31 to estimate the δ in Equations 7, 8.
4.2.4 Growth rate by 230Thex
The plots of 230Thex and 230Thex/232Th versus depth show constant exponential decay curves for Fe-Mn crusts DY31 (0-0.74 mm) and MAD23 (0-1.99 mm), indicating that the growth rates were constant during the growth of these outermost layers for each crust. Therefore, we assume that the growth rates for modern Fe-Mn crusts are the same as those that define the growth rates of the outermost layers approximately 0.74 mm and 2 mm for DY31 and MAD23 respectively. Here we use 1.75 mm/Myr (230Thex) and 2.03 mm/Myr (230Thex/232Th) for Fe-Mn crust DY31, and 2.82 mm/Myr (230Thex) and 2.77 mm/Myr (230Thex/232Th) for Fe-Mn crust MAD23 to estimate δ in Equations 7, 8.
4.2.5 Estimation of diffusion gradients of Co ions
Using the above parameters, the diffusion gradients of Co ions can be estimated (Table 4). Based on the parameters for Fe-Mn crust DY31, the diffusion gradient of Co ions ranges from 295 pM/mm to 342 pM/mm. The gradient calculated for Fe-Mn crust MAD23 is greater than for DY31, ranging from 487 pM/mm to 496 pM/mm. Given the bottom currents and mixing generated by the impact of water masses on seamounts (e.g., Lueck and Mudge, 1997), and the Co ion concentrations of seawater below 2000 m in the Pacific ranging from approximately 30 pM to 40 pM, the diffusion gradients of Co ions obtained in this study are reasonable.
4.3 Controls on the decreased Co concentrations with water depth
The Co concentrations of Fe-Mn crusts decrease with water depth. For example, the Co concentrations of Fe-Mn crusts from Line Islands decrease by 69% with increasing water depth, from 2.0% at 1120 m to 0.62% at 3280 m (Halbach et al., 1983). Data from Cronan (1977) also show that Co concentrations of Fe-Mn crusts decrease by more than 50% from 1000 m to 3000 m. The average Co concentrations of Fe-Mn crusts from the global ocean (Andreev and Gramberg, 2002) decrease from around 0.75% at 1000 m to 0.25% at 4000 m, a 66% decrease.
According to Equation 8, the Co concentration in Fe-Mn crusts can be given by
The statistical data show that no significant correlation exists between water depth and growth rates of surface samples of Fe-Mn crusts (Hein et al., 2000). The specific surface areas of Fe-Mn crusts from Karin Ridge of the central Pacific do not show a significant correlation with water depth (Hein et al., 1994). Furthermore, z and δ are constant in Equation 9. So in this study we only consider the Dsw, Csw and MnO2 concentration (dilution effects).
The seawater Co concentrations (Csw) decrease from around 38 pM at 2000 m to around 32 pM at 4000 m, a decrease of 16% (Biller and Bruland, 2012); the Co diffusivity (Dsw) decreases from 3.626×10⁻⁶ cm2/s (2000 m and 2°C) to 3.468×10⁻⁶ cm2/s (around 4500 m and 1°C), a decrease of 4.4%. So, integration of the decreases of Dsw and Csw can decrease Co concentration of Fe-Mn crusts by 20% of the original value from shallow water to deep water, which is not enough to account for the measured deceases of Co concentrations of Fe-Mn crusts with increasing water depth. Therefore, we infer that the decrease of MnO2 concentration through dilution from aluminosilicates and FeOOH should be the major control, which is consistent with the conclusions of other studies. Halbach and Puteanus (1984) attributed the high Co concentration in the Fe-Mn crusts from shallow water (1500-1000 m) to the lower carbonate dissolution rates and correspondingly lower Fe supply to the crusts.
Equation 9 defines the controls on Co concentrations in the layers of Fe-Mn crusts as they were accreted. However, in most cases, only bulk Co concentrations in Fe-Mn crusts are available to quantify resources. The bulk Co concentrations are mathematically equal to the weighted average of those in various layers of Fe-Mn crusts, which can be affected by absence of some layers that were eroded as noted before by Hein et al. (2000). Bulk concentrations may also be influenced by the subsidence and migration of seamounts, which can change the ambient seawater chemical conditions around seamounts, even if the seawater chemistry was constant (as in the present oceans) during the growth of Fe-Mn crusts through the Cenozoic. Nevertheless, based on Equation 9, it is possible to ascertain the sensitivity of Co concentration to those potential influences for each stratigraphic interval. The controls including dilution effect from incorporation of detrital minerals (Kim et al., 2006) or dissolution of carbonate (Halbach and Puteanus, 1984), seawater Co concentrations (Csw), and diffusivity (Dsw) vary continuously in the region of a seamount. When the Co concentrations in Fe-Mn crusts from a seamount are sensitive to those controls, Equation 9 can constitute the theoretical foundation for the application of Kriging to interpolate Co grade values and estimate the resources for each stratigraphic generation.
5 Summary and conclusions
Eight controls on Co concentrations in nonphosphatized Fe-Mn crusts are evaluated, including dilution effects, diffusivity of Co ions in seawater (Dsw), temperature which controls the Dsw, Co ion concentration in seawater (Csw), the diffusion distance of Co ions near the interface of seawater and Fe-Mn crusts (δ), the thickness of one molecular layer of Fe-Mn crusts (z), growth rate (GR), and specific surface area of Fe-Mn crusts (Ssp). Those controls are integrated in the equation: . Based on Co concentrations, growth rates, and specific surface area of the outermost layer of the Fe-Mn crusts, and diffusivity of Co2+, the Co diffusion gradients for the Fe-Mn crusts from Caiwei seamount is estimated to be 295-496 pM/mm. According to the model developed here, the decrease of Co concentration in Fe-Mn crusts with increasing water depth is controlled mainly by dilution of MnO2, the main Co host-, and to a lesser extent seawater Co ion concentration, temperature, and consequently the diffusivity of Co ions in seawater.
Data availability statement
The raw data supporting the conclusions of this article will be made available by the authors, without undue reservation.
Author contributions
XR: Conceptualization, Funding acquisition, Investigation, Project administration, Visualization, Writing – original draft, Writing – review & editing. JH: Writing – review & editing. ZY: Methodology, Writing – review & editing. NX: Methodology, Writing – review & editing. AZ: Methodology, Writing – review & editing.
Funding
The author(s) declare financial support was received for the research, authorship, and/or publication of this article. This work was supported by the Marine S&T Fund of Shandong Province for Laoshan Laboratory (grant number: LSKJ202203600-2), by the China Ocean Mineral Resources R&D Association (COMRA) project (grant number: DY135-N2-1-04), and by the National Natural Science Foundation of China (grant number: 40806027).
Conflict of interest
The authors declare that the research was conducted in the absence of any commercial or financial relationships that could be construed as a potential conflict of interest.
Publisher’s note
All claims expressed in this article are solely those of the authors and do not necessarily represent those of their affiliated organizations, or those of the publisher, the editors and the reviewers. Any product that may be evaluated in this article, or claim that may be made by its manufacturer, is not guaranteed or endorsed by the publisher.
References
Albarede F. (1995). Introduction to geochemical modeling (Cambridge: Cambridge University Press). doi: 10.1017/CBO9780511622960.010
Andreev S. I., Gramberg I. S. (2002). Cobalt-rich ores of the world ocean (St. Petersburg: VNIIOkeageologia).
Benites M., González F. J., Hein J., Marino E., Reyes J., Millo C., et al. (2023). Controls on the chemical composition of ferromanganese crusts from deep-water to the summit of the Rio Grande Rise, South Atlantic Ocean. Mar. Geol. 462, 107094. doi: 10.1016/j.margeo.2023.107094
Biller D. V., Bruland K. W. (2012). Analysis of Mn, Fe, Co, Ni, Cu, Zn, Cd, and Pb in seawater using the Nobias-chelate PA1 resin and magnetic sector inductively couples plasma mass spectrometry (ICP-MS). Mar. Chem. 130-131, 12–20. doi: 10.1016/j.marchem.2011.12.001
Bonatti E., Kraemer T., Rydell H. S. (1972). “Classification and genesis of submarine iron-manganese deposits,” in Ferromanganese Deposits on the Ocean Floor. Ed. Horn D. R. (Washington, D. C.: Columbia University), 149–166.
Boudreau B. P. (1997). Diagenetic models and their implementation (Berlin: Springer). doi: 10.1007/978-3-642-60421-8
Byrne R. H. (2002). Inorganic speciation of dissolved elements in seawater: the influence of pH on concentration ratios. Geochem. Trans. 3, 11–16. doi: 10.1186/1467-4866-3-11
Cronan D. S. (1977). “Deep-sea nodules: Distribution and geochemistry,” in Marine Manganese Deposits. Ed. Glasby G. P. (Elsevier, Amsterdam), 11–44. doi: 10.1016/s0422-9894(08)71016-x
Halbach P., Puteanus D. (1984). The influence of the carbonate dissolution rate on the growth and composition of Co-rich ferromanganese crusts from Central Pacific seamount areas. Earth Planet. Sci. Lett. 68, 73–87. doi: 10.1016/0012-821x(84)90141-9
Halbach P., Segl M., Puteanus D., Mangini A. (1983). Co-flux and growth rates in ferromanganese deposits from central Pacific seamount areas. Nature 304, 716–719. doi: 10.1038/304716a0
Hein J. R., Bychkov A. S., Gibbs A. E. (1994). Data and results from R.V. Aleksandr Vinogradov cruises 91-AV-19/1, North Pacific hydrochemistry transect; 91-av-19/2, North Equatorial Pacific Karin Ridge Fe-Mn crust studies; and 91-AV-19/4, Northwest Pacific and Bering sea sediment geochemistry and paleoceanographic studiest. U.S. Geological Survey Open File Report Washington D.C.: Department of the Interior, 94–230. doi: 10.3133/ofr94230
Hein J. R., Koschinsky A. (2014). “Deep-ocean ferromanganese crusts and nodules,” in Treatise on geochemistry, second edition, V. 13, Chapter 11. Eds. Holland H. D., Turekian K. K. (Oxford: Elsevier Ltd.), 273–291. doi: 10.1016/b978-0-08-095975-7.01111-6
Hein J. R., Koschinsky A., Bau M., Manheim F. T., Kang J.-K., Roberts L. (2000). “Cobalt-rich ferromanganese crusts in the pacific,” in Handbook of Marine Mineral Deposits. Ed. Cronan D. S. (CRC Press, Boca Raton, Florida), 239–279. doi: 10.1201/9780203752760-9
Hein J. R., Mizell K., Koschinsky A., Conrad T. A. (2013). Deep-ocean mineral deposits as a source of critical metals for high- and green-technology applications: Comparison with land-based resources. Ore. Geol. Rev. 51, 1–14. doi: 10.1016/j.oregeorev.2012.12.001
Hochella M. F. J. (2008). Nanogeoscience: From origins to cutting-edge application. Elements 4, 373–379. doi: 10.2113/gselements.4.6.373
Hu G. L., Cai Y. H., Yang C. Y., Zhuang Z. X., Wang X. R., Huang Y. P. (2002). Determination of 27 elements in two polymetallic nodule reference samples from the Pacific Ocean by ICP-MS. Acta Oceanol. Sin. 24, 47–52. doi: 10.1007/s11670-002-0022-7
IEA (2021). The Role of Critical Minerals in Clean Energy Transitions (Paris: IEA). Available at: https://www.iea.org/reports/the-role-of-critical-minerals-in-clean-energy-transitions (Accessed November 13, 2023).
Kanungo S. B., Tripathy S. S., Rajeev (2004). Adsorption of Co, Ni, Cu, and Zn on hydrous manganese dioxide from complex electrolyte solutions resembling sea water in major ion content. J. Colloid. Interface Sci. 269, 1–10. doi: 10.1016/s0021-9797(03)00464-8
Kim J., Hyeong K., Jung H., Moon J., Kim K. (2006). Southward shift of the Intertropical Convergence Zone in the western Pacific during the late Tertiary: Evidence from ferromanganese crusts on seamounts west of the Marshall Islands. Paleoceanography 21, PA4218. doi: 10.1029/2006pa001291
Koschinsky A., Halbach P. (1995). Sequential leaching of marine ferromanganese precipitates: Genetic implications. Geochim. Cosmochim. Acta 59, 5113–5132. doi: 10.1016/0016-7037(95)00358-4
Koschinsky A., Hein J. R. (2003). Uptake of elements from seawater by ferromanganese crusts: solid-phase associations and seawater speciation. Mar. Geol. 198, 331–351. doi: 10.1016/S0025-3227(03)00122-1
Ku T. L., Omura A., Chen P. S. (1979). “Be10 and U-series isotopes in Mn nodules from the central North Pacific,” in Marine Geology and Oceanography of the Pacific Manganese Nodule Province. Eds. Bishop J. L., Piper Z. (Plenum, New York), 791–814. doi: 10.1007/978-1-4684-3518-4_26
Lueck R. G., Mudge T. D. (1997). Topographically induced mixing around a shallow seamount. Science 276, 831–833. doi: 10.1126/science.276.5320.1831
Luo S. D., Shi W. Y., Chen Z., Huang Y. P. (1986). Study on a new method for Separation and determination of U and Th in deep sea manganese nodules. Acta Oceanol. Sin. 8 (3), 324–330. Available at: http://www.hyxbocean.cn//cn/article/pdf/preview/19860309.pdf (Accessed August 2, 2024).
Manheim F. T. (1986). Marine cobalt resources. Science 232, 600–608. doi: 10.1126/science.232.4750.600
Melnikov M. E., Pletnev S. P. (2013). Age and formation conditions of the Co-rich manganese crust on guyots of the Magellan seamounts. Lithol. Miner. Resour. 48, 3–16. doi: 10.1134/s0024490212050057
Milesi J.-P., Toteu S. F., Deschamps Y., Feybesse J. L., Catherine L., Cocherie A., et al. (2006). An overview of the geology and major ore deposits of Central Africa: Explanatory note for the 1:4,000,000 map “Geology and major ore deposits of Central Africa. J. Afr. Earth Sci. 44, 571–595. doi: 10.1016/j.jafrearsci.2005.10.016
Murray J. W., Dillard J. G. (1979). The oxidation of cobalt (II) adsorbed on manganese dioxide. Geochim. Cosmochim. Acta 43, 781–787. doi: 10.1016/0016-7037(79)90261-8
Nakatsuka S., Okamura K., Takeda S., Nishioka J., Firdaus M., Norisuye K., et al. (2009). Behaviors of dissolved and particulate Co, Ni, Cu, Zn, Cd and Pb during a mesoscale Fe-enrichment experiment (SEEDS II) in the western North Pacific. Deep-Sea. Res. II. 56, 2822–2838. doi: 10.1016/j.dsr2.2009.06.008
Parida K. M., Kanungo S. B., Sant B. R. (1981). Studies on MnO2-I. chemical composition, microstructure and other characteristics of some synthetic MnO2 of various crystalline modifications. Electrochim. Acta 26, 435–443. doi: 10.1016/0013-4686(81)85033-5
Ren J. B., He G. W., Deng X. G., Deng X. Z., Yang Y., Yao H. Q., et al. (2022). Metallogenesis of Co-rich ferromanganese nodules in the northwestern Pacific: Selective enrichment of metallic elements from seawater. Ore. Geol. Rev. 143, 104778. doi: 10.1016/j.oregeorev.2022.104778
Ren J. B., He G. W., Yang Y., Yu M., Deng Y. N., Pang Y. T., et al. (2024). Ultraselective enrichment of trace elements in seawater by Co-rich ferromanganese nodules. Global Planet. Change 239, 104498. doi: 10.1016/j.gloplacha.2024.104498
Ren X. W., Liu J. H., Cui Y. C., Shi X. F., Yin J. W. (2011). Effects of phosphatization on enrichment of cobalt in the Co-rich Fe-Mn crusts from seamount MP2 of the Line Islands in the central Pacific. Adv. Mar. Sci. 29, 323–329. doi: 10.3969/j.issn.1671-6647.2011.03.008
Ren X. W., Shi X. F., Zhu A. M., Liu J. H., Fang X. S. (2010). Controlling factors on enrichment of cerium in Co-rich Fe-Mn crusts from Magellan Seamount Cluster. J. Chin. Rare. Earth Soc. 28 (4), 489–494. Available at: https://www.docin.com/p-1186041205.html (Accessed August 2, 2024).
Takahashi Y., Manceau A., Geoffroy N., Marcus M. A., Usui A. (2007). Chemical and structural control of the partitioning of Co, Ce, and Pb in marine ferromanganese oxides. Geochim. Cosmochim. Acta 71, 984–1008. doi: 10.1016/j.gca.2006.11.016
U. S. Geological Survey (2024). “Cobalt,” in Mineral Commodity Summaries 2024 (Washington D.C.: Department of the Interior), 62–63. doi: 10.3133/mineral2024
Keywords: ferromanganese crusts, Magellan seamounts, cobalt, diffusivity, Pacific
Citation: Ren X, Hein JR, Yang Z, Xing N and Zhu A (2024) Controls on cobalt concentrations in ferromanganese crusts from the Magellan seamounts, west Pacific. Front. Mar. Sci. 11:1489943. doi: 10.3389/fmars.2024.1489943
Received: 02 September 2024; Accepted: 28 November 2024;
Published: 19 December 2024.
Edited by:
Francisco Javier González, Instituto Geológico y Minero de España (IGME), SpainReviewed by:
Egidio Marino, Instituto Geológico y Minero de España (IGME), SpainJiangbo Ren, Guangzhou Marine Geological Survey, China
Copyright © 2024 Ren, Hein, Yang, Xing and Zhu. This is an open-access article distributed under the terms of the Creative Commons Attribution License (CC BY). The use, distribution or reproduction in other forums is permitted, provided the original author(s) and the copyright owner(s) are credited and that the original publication in this journal is cited, in accordance with accepted academic practice. No use, distribution or reproduction is permitted which does not comply with these terms.
*Correspondence: Xiangwen Ren, cmVueGlhbmd3ZW5AMTYzLmNvbQ==
 Xiangwen Ren
 James R. Hein
 Zanzhong Yang4